Four Examples of “Facts” Eliminated
First Example: Critical Information Omitted
* “About 99.8% of firearms and more than 99.6% of handguns will not be used to commit violent crimes in any given year.”[1]
* Reason for elimination: This statistic neglects key information such as the number of guns in the U.S. Thus, it can create a misleading impression, given that, in 2014, roughly 600,000 violent crimes were committed by offenders visibly armed with a gun.[2] [3]
Second Example: Subjective Assertion and Critical Information Omitted
* States “with weak gun violence prevention laws and higher rates of gun ownership have the highest overall gun death rates in the nation.”[4]
* Reasons for elimination:
- The phrase “weak gun violence prevention laws” is subjective and ill-defined.[5]
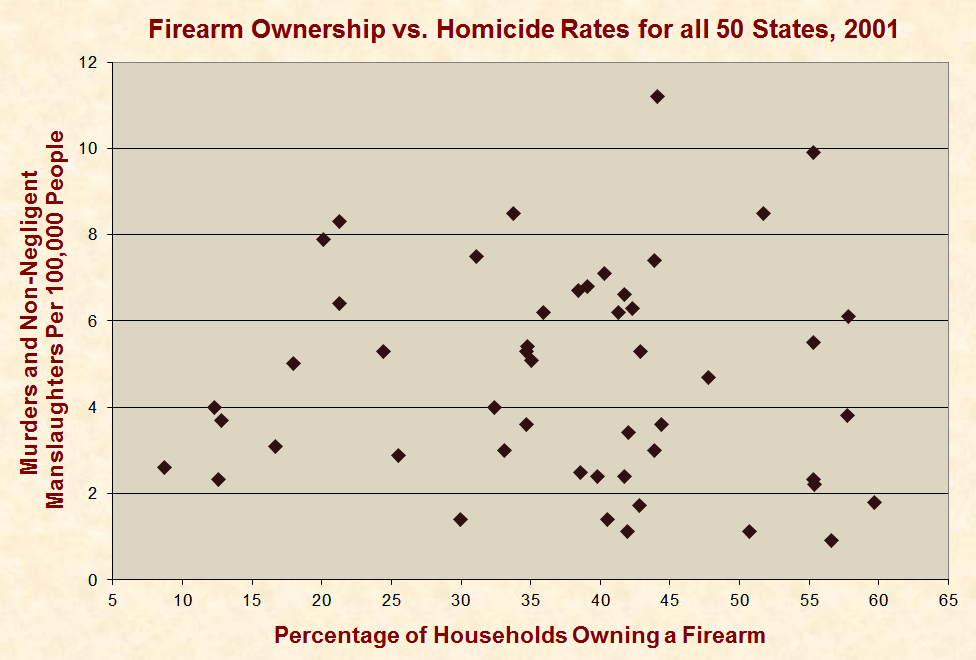
- This claim is missing key information and can be deceptive because it accounts for murders committed with guns but fails to account for lives saved with guns. Hence, it neglects the primary issue, which is the overall rate of violent deaths. This is significant because, as the graph below shows, many states with higher gun ownership rates also have the lowest murder rates, and there is no clear association between gun ownership rates and murder rates.
Third Example: Snapshot Observation with Conflating Factors
* “Right-to-carry” states allow individuals to carry firearms for protection against crime. In these states, the violent crime rate is 24% lower than the rest of the U.S., the murder rate is 28% lower, and the robbery rate is 50% lower.[7]
* Reason for elimination: This data does not account for other factors that may impact crime rates, such as cultural differences, arrest rates, illegitimacy rates, and poverty.
Note that many gun control studies attempt to control for such factors, but opposing sides inevitably point to other factors that are uncontrolled. Furthermore, it is practically impossible to control for all relevant factors due to data limitations.[8] [9] [10] Conversely, some researchers fault studies that do not show significant results until the effects of controls are considered.[11]
In accord with our mission to provide comprehensive and straightforward facts, Just Facts uses time-series data and lets this data speak for itself instead of subjecting it to statistical analyses that can be manipulated. For example, we provide homicide rates in the state of Florida in the years leading up to and after passage of the Florida “right-to-carry” law. Such data does not prove cause and effect, but it does allow us to observe trends and limits the impact of numerous variables because the data is drawn from a large population set with limited demographic changes from year to year.
To provide additional context, Just Facts sometimes provides comparative data (such as homicide rates for the nation as a whole over the same time period), but we provide this data in unadulterated form; we do not “control” for it in our calculations. This provides readers with the raw data in accord with our Standards of Credibility.
Fourth Example: Blurred Cause and Effect, Tenuous Results, and Statistical Manipulation
* “In homes with guns, the homicide of a household member is almost 3 times more likely to occur than in homes without guns.”[12] [13]
* Reasons for elimination: This statistic is based on a three-county study comparing households in which a homicide occurred to demographically similar households in which a homicide did not occur. After controlling for several variables, the study found that gun ownership was associated with a 2.7 times increase in the odds of homicide.[14] This study does not meet Just Facts’ Standards of Credibility because:
- The study blurs cause and effect. As explained in a comprehensive analysis of firearm research conducted by the National Research Council, gun control studies such as this (known as “case-control” studies) “fail to address the primary inferential problems that arise because ownership is not a random decision. … Homicide victims may possess firearms precisely because they are likely to be victimized.”[15]
- The study’s results are highly sensitive to uncertainties in the underlying data. For example, minor variations in firearm ownership rates (which are determined by interview and are thus dependent upon interviewees’ honesty) can negate the results.[16] [17]
-
The results are derived from statistical processes instead of letting the data speak for itself. For reference, the raw data of this study shows that households in which a homicide occurred were:
- 25% more likely to have a firearm (45% vs. 36% for non-homicide households).
- 130% more likely have a household member who was previously arrested (53% vs. 23%).
- 400% more likely to have a household member who used illicit drugs (31% vs. 6%)
- 400% more likely to have a household member who was previously hit or hurt during a fight in the home (32% vs. 6%).[18]
Footnotes
[1] Webpage: “1998 NRA Fact Card.” National Rifle Association, 1998. <nra.org>
“About 99.8% of firearms and more than 99.6% of handguns will not be used to commit violent crimes in any given year.”
[2] Calculated with data from:
a) Bulletin: “Criminal Victimization, 2014.” By Jennifer L. Truman and Lynn Langton. U.S. Department of Justice, Bureau of Justice Statistics. Revised September 29, 2015. <www.bjs.gov>
Page 1: “Violent crime [is] defined as rape or sexual assault, robbery, and aggravated assault, and simple assault.…”
Page 2: “Table 1: Violent Victimizations, by Type of Violent Crime, 2005, 2013, and 2014”
Page 3: “Table 2: Firearm Victimizations, 2005–2014”
Page 11: “The UCR includes homicides and commercial crimes, while the NCVS excludes these crime types.”
b) Report: “2014 Crime in the United States, Murder.” Federal Bureau of Investigation, Criminal Justice Information Services Division, Fall 2015. <www.fbi.gov>
“The FBI’s Uniform Crime Reporting (UCR) Program defines murder and nonnegligent manslaughter as the willful (nonnegligent) killing of one human being by another. … In 2014, the estimated number of murders in the nation was 14,249.”
c) Dataset: “2014 Crime in the United States, Expanded Homicide Data Table 9: Murder Victims by Age by Weapon, 2014.” Federal Bureau of Investigation, Criminal Justice Information Services Division, Fall 2015. <www.fbi.gov>
d) Dataset: “2014 Crime in the United States, Robbery Table 1: Robbery, Location, Percent Distribution within Region.” Federal Bureau of Investigation, Criminal Justice Information Services Division, Fall 2015. <ucr.fbi.gov>
NOTE: An Excel file containing the data and calculations is available upon request.
[3] The United States government publishes two primary crime measures: The FBI’s “Uniform Crime Report” (UCR) and the Department of Justice’s “National Crime Victimization Survey” (NCVS). The UCR is based upon incidents reported to law enforcement authorities and does not account for unreported crimes. The NCVS is based upon data gathered from extensive interviews, and hence, provides more accurate estimates of crime than the UCR.* The NCVS, however, does not provide data on: murders and nonnegligent manslaughters (because the victims cannot be interviewed), crimes committed against children under the age of 12, and commercial crimes such as robberies of banks and convenience stores.† Therefore, Just Facts uses the NCVS data as a baseline and extrapolates the missing information from UCR and NCVS data.
* Book: Firearms and Violence: A Critical Review. By the Committee to Improve Research and Data on Firearms and the Committee on Law and Justice, National Research Council of the National Academies. Edited by Charles F. Wellford, John V. Pepper, and Carol V. Petrie. National Academies Press, 2005.
Page 21: “The National Crime Victimization Survey … is widely viewed as a “gold standard for measuring crime victimization.”
Page 30: “Although the NCVS data do many things right, they are, like any such system, beset with methodological problems of surveys in general as well as particular problems associated with measuring illicit, deviant, and deleterious activities….”
† Report: “The Nation’s Two Crime Measures.” By Michael Planty and Lynn Langton. U.S. Department of Justice, Bureau of Justice Statistics, September, 2014. <www.bjs.gov>
Page 1:
The U.S. Department of Justice administers two statistical programs to measure the magnitude, nature, and impact of crime in the nation: the FBI’s Uniform Crime Reporting (UCR) Program and the Bureau of Justice Statistic’s National Crime Victimization Survey (NCVS). Each of these programs produces valuable information about aspects of the nation’s crime problem. Because the UCR and NCVS programs have different purposes, use different methods, and focus on somewhat different aspects of crime, the complementary information they produce together provides a more comprehensive understanding of the nation’s crime problem than either could produce alone. …
The UCR Program currently collects information on murder and nonnegligent manslaughter, forcible rape, robbery, aggravated assault, burglary, larceny-theft, motor vehicle theft, arson, and human trafficking. …
The current NCVS collects detailed information on the frequency and nature of the crimes of rape and other sexual assault, robbery, aggravated and simple assault, personal larceny, household burglary, motor vehicle theft, and other theft. Each year, BJS interviews a nationally representative sample of approximately 169,000 persons age 12 or older living in U.S. households. Households remain in the sample for 3.5 years. …
Page 2:
The NCVS includes, but the UCR excludes, sexual assault (completed, attempted, and threatened), attempted robberies, verbal threats of rape, simple assault, and crimes not reported to law enforcement. The UCR includes, but the NCVS excludes, homicide, arson, commercial crimes, and crimes against children under age 12. The UCR captures crimes reported to law enforcement, but collects only arrest data for simple assault and sex offenses other than forcible rape.
[4] Press release: “States with Weak Gun Laws and Higher Gun Ownership Lead Nation in Gun Deaths, New Data for 2014 Confirms.” Violence Policy Center, January 4, 2016. <www.vpc.org>
Newly available data for 2014 reveals that states with weak gun violence prevention laws and higher rates of gun ownership have the highest overall gun death rates in the nation, according to a Violence Policy Center (VPC) analysis of just-released data from the Centers for Disease Control and Prevention’s National Center for Injury Prevention and Control.
In addition, states with the lowest overall gun death rates have lower rates of gun ownership and some of the strongest gun violence prevention laws in the nation. However, even in these states the human toll of gun violence is far above the gun death rate in other industrialized nations.…
States with the Five Lowest Gun Death Rates … Rank 46 [=] Connecticut …
The VPC defined states with “weak” gun violence prevention laws as those that add little or nothing to federal law and have permissive laws governing the open or concealed carrying of firearms in public. States with “strong” gun violence prevention laws were defined as those that add significant state regulation that is absent from federal law, such as restricting access to particularly hazardous and deadly types of firearms (for example, assault weapons), setting minimum safety standards for firearms and/or requiring a permit to purchase a firearm, and restricting the open and concealed carrying of firearms in public.…
[5] As shown in the citation above, the Violence Policy Center (VPC) characterizes Connecticut as a state with “strong gun violence prevention laws.” Connecticut happens to have the fifth lowest rate of gun death in the nation. VPC defines states with “weak gun laws” as those “that add little or nothing to federal law and have permissive laws governing the open or concealed carrying of firearms in public.” Yet, in spite of VPC’s characterization of Connecticut and definition of weak gun control laws, Connecticut has a law allowing civilians to carry concealed handguns that could certainly be described as “permissive.”
More specifically, Connecticut law allows local officials to issue concealed carry permits to private citizens, which the state government reviews.* Between January 1, 2000 and December 31, 2009, the state of Connecticut issued 166,190 permits, while during almost the same period (1/1/2000 – 2/24/2010), the state denied only 436 permits (2.6% of the total).† Thus, as the National Rifle Association’s Institute for Legislation Action has explained, in Connecticut and a few other “may-issue” states, governments “will generally issue a permit to the same kinds of persons who would qualify for a permit in a Shall-Issue state….”‡
NOTES:
- * Connecticut Law: Title 29, Chapter 529, Section 29-28(b): “Permit to carry pistol or revolver.” Accessed July 28, 2016 at <law.justia.com>
Upon the application of any person having a bona fide residence or place of business within the jurisdiction of any such authority, such chief of police, warden or selectman may issue a temporary state permit to such person to carry a pistol or revolver within the state, provided such authority shall find that such applicant intends to make no use of any pistol or revolver which such applicant may be permitted to carry under such permit other than a lawful use and that such person is a suitable person to receive such permit.
- † Correspondence from the Connecticut Special Licensing & Firearms Unit to Just Facts, February 24, 2010 and March 18, 2010.
- ‡ Article: “The State (by State) of Right-To-Carry.” By Dave Kopel. National Rifle Association Institute for Legislative Action, July 28, 2006. <www.nraila.org>
Do-Issue: Three states—Alabama, Connecticut and Iowa—have statutes that are not completely Shall-Issue, but that reserve some discretion to the issuing law enforcement agency. In these states, local law enforcement will generally issue a permit to the same kinds of persons who would qualify for a permit in a Shall-Issue state, and many times these states are included on Shall-Issue state lists.
Capricious-Issue: Eight coastal states have permit laws but give local law enforcement almost unlimited discretion to deny permits. Although there can be significant variation from one locality to another, permits are rarely issued in most jurisdictions, except to celebrities or other influential people. These Capricious-Issue states are Hawaii, California, Delaware (not as bad as the others, in practice), Maryland, New Jersey (the worst), New York, Massachusetts and Rhode Island.
[6] Graph constructed with data from:
a) Paper: “Gun Ownership and Social Gun Culture.” By Bindu Kalesan and others. Injury Prevention, June 29, 2015.
Page 1: “We assessed gun ownership rates in 2013 across the USA … We used data from a nationally representative sample of 4,000 US adults, from 50 states and District of Columbia, ages > 18 years to assess gun ownership….”
Page 3: “Figure 3: Gun Ownership Rates in Each State, 2013.”
b) Dataset: “2013 Crime in the United States, Table 5: Crime in the United States by State.” Federal Bureau of Investigation, Criminal Justice Information Services Division, Fall 2014. <ucr.fbi.gov>
[7] Webpage: “Right-to-Carry 2009.” National Rifle Association of America, Institute for Legislative Action, May 7, 2009. <www.nraila.org>
RTC [right-to-carry] laws respect the right to self-defense by allowing individuals to carry firearms for protection.…
RTC states have lower violent crime rates, on average, compared to the rest of the country (total violent crime by 24 percent; murder, 28 percent; robbery, 50 percent; and aggravated assault, 11 percent).
[8] For example:
a) Article: “Domestic Disputes: Bad Social Science and Bad Legal Policy.” By Eugene Volokh. National Review, June 17, 2003. <www.nationalreview.com>
“The study, however, completely failed to control for what might well be the most important factors: whether the household contained violent criminals, gang members, drug dealers, and the like. These are the very factors that might cause both gun ownership and gun death. And because the study didn’t control for them, it says nothing about whether gun ownership really “increases the odds” that a law-abiding citizen will be killed. The study’s results could easily flow simply from the huge set of homicide victims who are themselves criminals.”
b) Book: Firearms and Violence: A Critical Review. By the Committee to Improve Research and Data on Firearms and the Committee on Law and Justice, National Research Council of the National Academies. Edited by Charles F. Wellford, John V. Pepper, and Carol V. Petrie. National Academies Press, 2005.
Page 273: “The importance of controlling for the correct set of covariates is well known. In fact, much of the debate between Lott and his statistically orientated critics focuses on determining the correct set of control variables.”
NOTE: The quote just above and the quote just below illustrate how there is no satisfying the opposing sides of this debate with control variables. For as Lott states, his “study uses the most comprehensive set of control variables yet used in a study of crime, let alone any previous study on gun control.” [Book: More Guns, Less Crime. By John R. Lott, Jr. University of Chicago Press, 1998. Page 153.]
[9] Book: Firearms and Violence: A Critical Review. By the Committee to Improve Research and Data on Firearms and the Committee on Law and Justice, National Research Council of the National Academies. Edited by Charles F. Wellford, John V. Pepper, and Carol V. Petrie. National Academies Press, 2005.
Page ix: “One theme that runs throughout our report is the relative absence of credible data central to addressing even the most basic questions about firearms and violence. As we often state in the report, without much better data, important questions will continue to be unanswerable.”
Page 1: “While there is a large body of empirical research on firearms and violence, there is little consensus on even the basic facts about these important policy issues.”
Page 19: “In the committee’s view, the major scientific obstacles for advancing the body of research and further developing credible empirical research to inform policy on firearms is the lack of reliable and valid data.”
[10] For facts about the pitfalls of using control variables to determine the effects of public policies, see the introductory notes of Just Facts’ research on education.
[11] Book: Firearms and Violence: A Critical Review. By the Committee to Improve Research and Data on Firearms and the Committee on Law and Justice, National Research Council of the National Academies. Edited by Charles F. Wellford, John V. Pepper, and Carol V. Petrie. National Academies Press, 2005.
Page 151 (conclusions regarding John R. Lott’s concealed carry study): “No link between right-to-carry laws and changes in crime is apparent in the raw data, even in the initial sample; it is only once numerous covariates are included that the negative results in the early data emerge.”
[12] Webpage: “Factsheet: Guns in the Home.” Johns Hopkins Center for Gun Policy and Research. Accessed March 29, 2010 at <www.jhsph.edu>
Although many gun owners keep a gun in the home for protection, studies have shown that … the risks of keeping a gun in the home outweigh the benefits. In fact, in homes with guns, the homicide of a household member is almost 3 times more likely to occur than in homes without guns.5
5 Kellermann AL, Rivara FP, Rushforth NB et al. Gun ownership as a risk factor for homicide in the home. New England Journal of Medicine. 1993;329:1084-1091.
[13] Legal brief: District of Columbia and Adrian M. Fenty, Mayor of the District of Columbia, Petitioners, v. Dick Anthony Heller, Respondent. In the Supreme Court of the United States. By Linda Singer (Attorney General for the District of Columbia) and others. January 4, 2008. Case 07-290. <www.abanet.org>
Page 52:
People who live in houses with firearms, particularly hand-guns, are almost three times more likely to die in a homicide, and much more likely to die at the hands of a family member or intimate acquaintance than people who do not. See Arthur L. Kellermann et al., Gun Ownership as a Risk Factor for Homicide in the Home, 329 New Eng. J. Med. 1084 (1993).
[14] Paper: “Gun Ownership as a Risk Factor for Homicide in the Home.” By Arthur L. Kellermann and others. New England Journal of Medicine, October 7, 1993. <content.nejm.org>
“After controlling for these characteristics, we found that keeping a gun in the home was strongly and independently associated with an increased risk of homicide (adjusted odds ratio, 2.7; 95 percent confidence interval, 1.6 to 4.4).”
NOTES:
- The “odds ratio” is not the same as the “relative risk” (which is the measure of probability that most people understand).* However, Just Facts consulted with two independent authorities on statistics who stated that the odds ratio is a valid approximation of relative risk in this study.
- * Paper: “Making Sense of Odds and Odds Ratios.” By DA Grimes and KF Schulz. Obstetrics and Gynecology (New York), February 2008. Pages 423–426. <www.ncbi.nlm.nih.gov>. Page 423: Despite their growing use in the medical literature,1,2 odds ratios remain poorly understood by clinicians (and by some researchers, as well).2 Pages 423–424: “Both clinicians and patients readily understand relative risk. It is simply a ratio of probabilities.”
[15] Book: Firearms and Violence: A Critical Review. By the Committee to Improve Research and Data on Firearms and the Committee on Law and Justice, National Research Council of the National Academies. Edited by Charles F. Wellford, John V. Pepper, and Carol V. Petrie. National Academies Press, 2005.
Page 5:
Because of current data limitations, researchers have relied primarily on two different methodologies. First, some studies have used case-control methods*, which match a sample of cases, namely victims of homicide or suicide, to a sample of controls with similar characteristics but who were not affected by violence.…
Case control studies show that violence is positively associated with firearms ownership, but they have not determined whether these associations reflect causal mechanisms. Two main problems hinder inference on these questions. First and foremost, these studies fail to address the primary inferential problems that arise because ownership is not a random decision. For example, suicidal persons may, in the absence of a firearm, use other means of committing suicide. Homicide victims may possess firearms precisely because they are likely to be victimized.
NOTE: * The study under discussion is a case-control study. [Paper: “Gun Ownership as a Risk Factor for Homicide in the Home.” By Arthur L. Kellermann and others. New England Journal of Medicine, October 7, 1993. <content.nejm.org>. “[W]e conducted a population-based case-control study to determine the strength of the association between a variety of potential risk factors and the incidence of homicide in the home.”]
[16] Book: Firearms and Violence: A Critical Review. By the Committee to Improve Research and Data on Firearms and the Committee on Law and Justice, National Research Council of the National Academies. Edited by Charles F. Wellford, John V. Pepper, and Carol V. Petrie. National Academies Press, 2005.
Page 119 (regarding case-control studies such as Kellermann et al., 1993): “[E]ven small degrees of misreporting on ownership by either the cases or the controls can create substantial biases in the estimated risk factors (see Kleck, 1997, for an illustration of these biases).”
Page 35:
While surveys of firearms acquisitions, possession, and use are of varying quality and scope, they all share common methodological and survey sampling-related problems. The most fundamental of these is the potential for response errors to survey questionnaires. Critics argue that asking people whether they own a firearm, what kind it is, and how it is used may lead to invalid responses because ownership is a controversial matter for one or more reasons: some people may own a firearm illegally, some may own it legally but worry that they may use it illegally, and some may react to the intense public controversy about firearm ownership by becoming less (or even more) likely to admit to ownership (Blackman, 2003).7
7 While in most surveys respondents are provided confidentiality, the concern is still expressed that violations of confidentiality directly or through data mining could lead to the identification of specific respondents in a way that might allow the identification of firearms owners.
[17] Book: Armed: New Perspectives on Gun Control. By Gary Kleck & Don B. Kates. Prometheus Books, 2001. Chapter 2: “Guns and Public Health: Epidemic of Violence or Pandemic of Propaganda?” By Don B. Kates.
Page 82:
To reiterate, NEJM-1993’s conclusions depend entirely on there having been no substantial underestimation of the control group’s gun ownership. It would take only 35 of the 388 controls falsely denying gun possession to make the control ownership percentage exactly equal to that of the homicide case households. If indeed the controls actually had gun ownership equal to that of the homicide case households (45.4%), then a false denial rate of only 20.1 percent among the gun-owning controls would produce the 35 false denials and thereby equalize ownership. Such a 20.1 false denial rate is smaller than either of the “refused consent for interview” category of the pilot study, or the “inaccurate registration data” category. Therefore the results of the pilot study are consistent with a false denial rate sufficiently high to bring the control group gun ownership rate up to a level equal to, or even higher than, the homicide case household rate, although the authors cite the pilot study to the reverse effect. Neglect of the false denial rate can produce a bias large enough, by itself, to account for the entire association between gun ownership and homicide claimed in this study.
[18] Paper: “Gun Ownership as a Risk Factor for Homicide in the Home.” By Arthur L. Kellermann and others. New England Journal of Medicine, October 7, 1993. <content.nejm.org>
“Multivariate analyses used conditional logistic regression, the appropriate technique for a matched-pairs design14.”
NOTE: The actual raw data is provided in Table 3: “Univariate Analysis of Hypothesized Risk on Protection.”