Hide the Decline
NOTE: If you came directly to this page without first reading Just Facts’ research on proxies, we suggest you do so in order to gather vital context about the facts below, such as the definitions of certain terms and acronyms.
* On November 16, 1999, Phil Jones, the Director of the CRU,[1] [2] sent an email containing the following statement to the three coauthors of the hockey stick graph (and also copied two of the authors of the chapter about proxies in the 2007 IPCC report):[3] [4] [5]
* In the text of this email:[7]
- “Mike” refers to Michael Mann, lead author of the hockey stick graph.
- Nature is the scientific journal that published the paper on which the hockey stick graph is based.[8] [9]
- The “real temps” are modern instrument-measured surface temperatures.
- “Keith” refers to Keith Briffa, the Deputy Director of the CRU,[10] a lead author of the chapter about proxies in the 2007 IPCC report, and the lead author of one of the papers cited in the report’s spaghetti graph.[11]
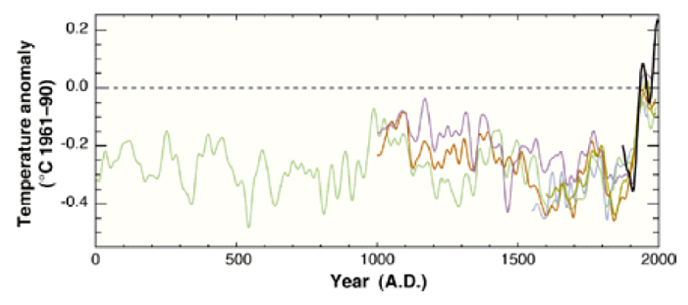
* In a 1999 paper coauthored by Keith Briffa, he presented the following graph of proxy studies (including one of his own that stops at “1961”) while “adding in the real temps” (shown in black):
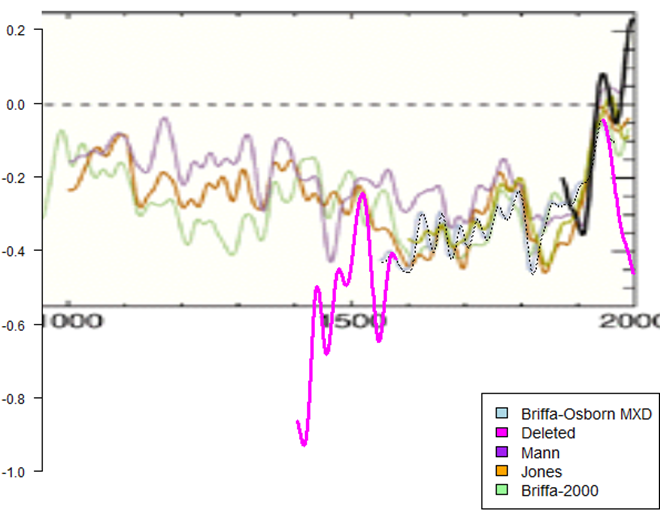
* In 2011, Steve McIntyre of ClimateAudit.org found a dataset on the website of a study led by Phil Jones that matches the data graphed above. He later found the same dataset among the ClimateGate documents. This data extends further into the past and future than shown in the graph above, and it shows a “decline” in temperatures starting in “1961.” When McIntyre added this excluded data to the graph, the result was as follows:
* In addition to Briffa’s series, the “hide the decline” email mentions “two” other “series” to which Jones applied “Mike’s Nature trick” (in these cases, “from 1981 onwards”). The email states that Jones was working on a diagram for the “WMO” (World Meteorological Organization), which is the United Nation’s “authoritative voice on the state and behavior of the Earth’s atmosphere.”[15] [16]
* Four months after Jones sent the “hide the decline” email, the WMO published its annual report with a graph of these series on the cover and a note inside stating, “all the reconstructions … indicate that against the background of the millennium as a whole, the 20th century was unusually warm”:
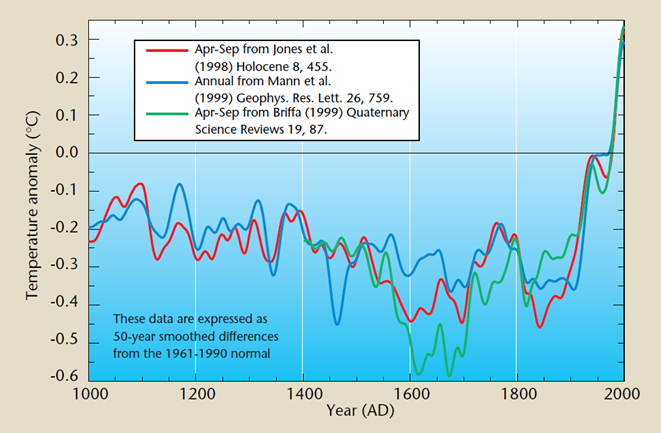
* The notes on the upper left of this graph above identify the “two” other “series” mentioned by Jones in the “hide the decline” email. These series are from papers in which Jones and Mann are the lead authors.[18]
* In a 1999 ClimateGate email, Mann wrote that Briffa’s proxy “series … is the problem we all picked up on (everyone in the room at IPCC was in agreement that this was a problem and a potential distraction/detraction from the reasonably consensus viewpoint we’d like to show w/ the Jones et al and Mann et al series.”[19]
* Some authors of the ClimateGate emails have asserted that in the “hide the decline” email:
- the word “trick” is not a “secret” but “a good way to deal with a problem.”
- the term “hiding” is “probably a poor choice of words.”
- cutting short Briffa’s proxy series at 1961 “is well known” and “completely appropriate” because it “diverges from the [modern instrument-measured] temperature records….”[20] [21]
* In a 2004 blog post, Mann wrote that proxy studies which use:
* In the same post, Mann responded to someone who wrote that “the practice of grafting the thermometer record onto a proxy temperature record—as I believe was done in the case of the ‘hockey stick’—is dubious to say the least.” In reply, Mann stated that the modern instrument temperatures are “clearly distinguished in red,” and:
* The reconstruction on the cover of the WMO report, which is the subject of the “hide the decline” email, grafts the thermometer record onto all three proxy series without showing any distinction (color or otherwise) between the proxy and thermometer data (see above).
* Regarding other mentions of proxy data diverging from thermometer data:
- In a 1999 ClimateGate email, Keith Briffa states, “We don’t have a lot of proxies that come right up to date and those that do (at least a significant number of tree proxies) [show] some unexpected changes in response that do not match the recent warming.”[24]
- In a 2004 ClimateGate email, a lead author of the chapter about proxies in the 2007 IPCC report states there “is a real issue” in “showing some of the tree-ring data for the period after 1950.”[25]
- In another study included in the 2007 IPCC spaghetti graph,[26] the authors state that the reconstruction “does very well at tracking the instrumental data … up to about 1982, after which the tree-ring estimates systematically under-estimate the actual warming.”[27]
Footnotes
[1] Webpage: “Professor Philip Jones.” Accessed July 5, 2015 at <bit.ly>
“I am Research Director of the Climatic Research Unit (CRU) and a Professor in the School of Environmental Sciences at the University of East Anglia in Norwich. I am principally known for the time series of hemispheric and global surface temperatures, which I update on a monthly basis.”
[2] NOTE: Jones is cited five times in the 2007 IPCC spaghetti graph. [Report of Working Group 1: “Climate Change 2007: The Physical Science Basis.” Edited by S. D. Solomon and others. World Meteorological Organization/United Nations Environment Programme, Intergovernmental Panel on Climate Change. Cambridge University Press, 2007. Chapter 6: “Palaeoclimate.” By Eystein Jansen and others. <www.ipcc.ch>. Page 469: “Records of Northern Hemisphere temperature shown in Figure 6.10. … Jones and Moberg, 2003 … Jones and Moberg, 2003 … Jones et al., 2003 … Jones et al., 1998 … Mann and Jones, 2003”]
[3] Paper: “Northern Hemisphere Temperatures During the Past Millennium.” By Michael E. Mann, Raymond S. Bradley, and Malcolm K. Hughes. Geophysical Research Letters, March 15, 1999. <www.geo.umass.edu>
[4] At the time of the e-mail, Briffa was the Deputy Director of the CRU and a lead author of the chapter about proxies in the 2007 IPCC report. [Webpage: “Professor Keith Briffa.” Accessed June 29, 2011 at <bit.ly>. “I am currently Deputy Director of the Climatic Research Unit, University of East Anglia, Norwich, U.K., where I have worked since 1977.”] [Report of Working Group 1: “Climate Change 2007: The Physical Science Basis.” Edited by S. D. Solomon and others. World Meteorological Organization/United Nations Environment Programme, Intergovernmental Panel on Climate Change. Cambridge University Press, 2007. Chapter 6: “Palaeoclimate.” By Eystein Jansen and others. <www.ipcc.ch>. “Lead Authors: Keith R. Briffa (UK) …”]
[5] Osborn is a contributing author of the chapter about proxies in the 2007 IPCC report and is cited by name 13 times in this chapter. [Report of Working Group 1: “Climate Change 2007: The Physical Science Basis.” Edited by S. D. Solomon and others. World Meteorological Organization/United Nations Environment Programme, Intergovernmental Panel on Climate Change. Cambridge University Press, 2007. Chapter 6: “Palaeoclimate.” By Eystein Jansen and others. <www.ipcc.ch>. “Contributing Authors … T. Osborn (UK)”]
[6] Climategate Document 942777075.
From: Phil Jones <p.jones…>
To: ray bradley <rbradley…>, mann… [Michael E. Mann], mhughes… [Malcolm Hughes]
Subject: Diagram for WMO [World Meteorological Organization] Statement
Date: Tue, 16 Nov 1999 13:31:15 +0000
Cc: k.briffa … [Keith Briffa], t.osborn … [Timothy J. Osborn]
Dear Ray, Mike and Malcolm,
Once Tim’s got a diagram here we’ll send that either later today or
first thing tomorrow.
I’ve just completed Mike’s Nature trick of adding in the real temps
to each series for the last 20 years (ie from 1981 onwards) amd from
1961 for Keith’s to hide the decline. Mike’s series got the annual
land and marine values while the other two got April–Sept for NH [Northern Hemisphere] land
N of 20N. The latter two are real for 1999, while the estimate for 1999
for NH combined is +0.44C wrt 61–90. The Global estimate for 1999 with
data through Oct is +0.35C cf. 0.57 for 1998.
Thanks for the comments, Ray.
Cheers
Phil
NOTE: See the next five footnotes for biographical information on the sender and recipients of this email.
[7] NOTE: The identifications of “Mike,” “Keith,” Nature, and “the real temps” are established by the context of the email and its distribution list. As shown below, individuals implicated in this email have publicly commented upon it, and none of them have contested these identifications.
[8] Paper: “Northern Hemisphere Temperatures During the Past Millennium.” By Michael E. Mann, Raymond S. Bradley, and Malcolm K. Hughes. Geophysical Research Letters, March 15, 1999. <www.geo.umass.edu>
Pages 1–2: “We here apply the methodology detailed by MBH98 to the sparser proxy data network available prior to AD 1400, to critically revisit this issue, extending NH [Northern Hemisphere] reconstructions as far back as is currently feasible.”
[9] Paper: “Global-Scale Temperature Patterns and Climate Forcing Over the Past Six Centuries.” By Michael E. Mann, Raymond S. Bradley, and Malcolm K. Hughes. Nature, April 23, 1998. Pages 779–787. <www.geo.umass.edu>
[10] Webpage: “Professor Keith Briffa.” Accessed June 29, 2011 at <bit.ly>
“I am currently Deputy Director of the Climatic Research Unit, University of East Anglia, Norwich, U.K., where I have worked since 1977.”
[11] Report of Working Group 1: “Climate Change 2007: The Physical Science Basis.” Edited by S. D. Solomon and others. World Meteorological Organization/United Nations Environment Programme, Intergovernmental Panel on Climate Change. Cambridge University Press, 2007. <www.ipcc.ch>
Chapter 6: “Palaeoclimate.” By Eystein Jansen and others. Pages 433–497. <www.ipcc.ch>
Page 433: “Lead Authors: Keith R. Briffa (UK) …”
Page 469: “Records of Northern Hemisphere temperature shown in Figure 6.10. … B2000 … Briffa, 2000; calibrated by Briffa and others, 2004.”
[12] Paper: “Seeing the Wood from the Trees.” By Keith R. Briffa and Timothy J. Osborn. Science, May 7, 1999. Pages 926–929. <www.meteo.psu.edu>
Pages 926–927:
Records of past climate … Comparison of NH [Northern Hemisphere] temperature reconstructions, all recalibrated with linear regression against the 1881–1960 mean April-September instrumental temperatures averaged over land areas north of 20ºN. All series have been smoothed with a 50-year Gaussian-weighted filter and are anomalies from the 1961–90 mean. Instrumental temperatures (1871–1997) are in black … northern NH tree-ring densities [1550–1960, from3, processed to retain low-frequency signals] are in pale blue….
3 K. R. Briffa and others, Nature 391, 678 (1998) [GEOREF]; K. R. Briffa, P. D. Jones, F. H. Schweingruber, T. J. Osborn, ibid. 393, 450 (1998) [GEOREF]; K. R. Briffa and others, Philos. Trans. R. Soc. Lond. B Biol. Sci. 353, 65 (1998).
[13] Blog post: “Hide the Decline – the Other Deletion.” By Steve McIntyre. Climate Audit, March 21, 2011. <climateaudit.org>
As noted previously, Briffa data was deleted after 1960. (Smoothing was done after the deletion further accentuating the impact of the deletion of post-1960 data.)
In addition, and this point has not been previously discussed, Briffa and Osborn [Science, 1999] did not show data prior to 1550 for the Briffa MXD [maximum latewood density] reconstruction. I’d previously noticed that an archive for Jones et al 1998 (surprisingly) contained a Briffa version that is linearly related to the Science graphic – the match is shown as a dotted line. (The basis of the linear relationship is not reported and not known to me at present, but can nonetheless be used empirically to show the extensions.)
[14] Blog post: “Hide the Decline: Sciencemag # 3.” By Steve McIntyre. Climate Audit, March 23, 2011. <climateaudit.org>
[In the] dossier of computer programs in the Climategate documents … [i]n the directory osborn-tree6, the program science99_fig1.pro both by its name† and contents appears to be the program that was used to produce the figure in Briffa and Osborn (Science 1999)—see here for example, though the program in the Climategate zip file is not dated until Feb 16, 2000, about 9 months after the publication of the article. …
The start period for the reconstruction in the code is 1402 (the start of the magenta portion), rather than 1550 – the start of the Briffa version in the actual graphic.
It’s therefore evident that they had, at one time, plotted the Science 1999 spaghetti graph showing data before 1550, but elected to delete the pre-1550 data as well as the post-1960 data.
NOTE: † Osborn was Briffa’s coauthor in the above-referenced 1999 paper in Science.
[15] Webpage: “WMO in Brief.” World Meteorological Organization. Accessed June 30, 2011 at <public.wmo.int>
“The World Meteorological Organization (WMO) is a specialized agency of the United Nations. It is the UN system’s authoritative voice on the state and behaviour of the Earth’s atmosphere, its interaction with the oceans, the climate it produces and the resulting distribution of water resources.”
[16] Climategate Document 942777075.
From: Phil Jones <p.jones…>
To: ray bradley <rbradley…>,mann… [Michael E. Mann], mhughes… [Malcolm Hughes]
Subject: Diagram for WMO Statement
Date: Tue, 16 Nov 1999 13:31:15 +0000
Cc: k.briffa… [Keith Briffa],t.osborn… [Timothy J. Osborn]
Dear Ray, Mike and Malcolm,
Once Tim’s got a diagram here we’ll send that either later today or
first thing tomorrow.
I’ve just completed Mike’s Nature trick of adding in the real temps
to each series for the last 20 years (ie from 1981 onwards) amd from
1961 for Keith’s to hide the decline. Mike’s series got the annual
land and marine values while the other two got April–Sept for NH [Northern Hemisphere] land
N of 20N. The latter two are real for 1999, while the estimate for 1999
for NH combined is +0.44C wrt 61–90. The Global estimate for 1999 with
data through Oct is +0.35C cf. 0.57 for 1998.
Thanks for the comments, Ray.
Cheers
Phil
[17] “WMO Statement on the Status of the Global Climate in 1999.” World Meteorological Organization, March 2000. <library.wmo.int>
Page 2:
Front cover: Northern Hemisphere temperatures were reconstructed for the past 1000 years (up to 1999) using palaeoclimatic records (tree rings, corals, ice cores, lake sediments, etc.), along with historical and long instrumental records. The data are shown as 50-year smoothed differences from the 1961–1990 normal. Uncertainties are greater in the early part of the millennium (see page 4 for further information†). For more details, readers are referred to the PAGES newsletter (Vol. 7, No. 1: March 1999, also available at <www.pages.unibe.ch>) and the National Geophysical Data Center (<www.ngdc.noaa.gov>). (Sources of data: P.D. Jones, K.R. Briffa and T.J. Osborn, University of East Anglia, UK; M.E. Mann, University of Virginia, USA; R.S. Bradley, University of Massachusetts, USA; M.K. Hughes, University of Arizona, USA; and the Hadley Centre, The Met. Office).
NOTES:
- † Page 4 does not hint that any of the data was cut off to “hide the decline.” The page states that “all the reconstructions (shown on the front cover as 50-year smoothed differences from the 1961–1990 normal) indicate that against the background of the millennium as a whole, the 20th century was unusually warm.”
- The series described in the “hide the decline” email (see previous footnote) exactly match those in the graph on the cover of the WMO report: “Apr–Sep from Jones … Annual from Mann … Apr–Sep from Briffa.”
[18] See footnote directly above.
[19] Climategate Document 938018124.
From: “Michael E. Mann” <mann…>
To: Keith Briffa <k.briffa…>, “Folland, Chris” <ckfolland…>, ‘Phil Jones’ <p.jones…>
Subject: RE: IPCC revisions
Date: Wed, 22 Sep 1999 12:35:24 -0400
Cc: tkarl…, mann…
…
I am perfectly amenable to keeping Keith’s series in the plot, and can ask Ian Macadam (Chris?) to add it to the plot he has been preparing….
So if Chris and Tom (?) are ok with this, I would be happy to add Keith’s series. That having been said, it does raise a conundrum: We demonstrate (through comparining an exatropical averaging of our nothern hemisphere patterns with Phil’s more extratropical series) that the major discrepancies between Phil’s and our series can be explained in terms of spatial sampling/latitudinal emphasis (seasonality seems to be secondary here, but probably explains much of the residual differences). But that explanation certainly can’t rectify why Keith’s series, which has similar seasonality *and* latitudinal emphasis to Phil’s series, differs in large part in exactly the opposite direction that Phil’s does from ours. This is the problem we all picked up on (everyone in the room at IPCC was in agreement that this was a problem and a potential distraction/detraction from the reasonably concensus viewpoint we’d like to show w/ the Jones et al and Mann et al series.
So, if we show Keith’s series in this plot, we have to comment that “something else” is responsible for the discrepancies in this case. Perhaps Keith can help us out a bit by explaining the processing that went into the series and the potential factors that might lead to it being “warmer” than the Jones et al and Mann et al series?? We would need to put in a few words in this regard. Otherwise, the skeptics have an field day casting doubt on our ability to understand the factors that influence these estimates and, thus, can undermine faith in the paleoestimates. I don’t think that doubt is scientifically justified, and I’d hate to be the one to have to give it fodder!
[20] Blog post: “The CRU Hack.” By “group.” RealClimate, November 20, 2009. <www.realclimate.org>
No doubt, instances of cherry-picked and poorly-worded “gotcha” phrases will be pulled out of context. One example is worth mentioning quickly. Phil Jones in discussing the presentation of temperature reconstructions stated that “I’ve just completed Mike’s Nature trick of adding in the real temps to each series for the last 20 years (ie from 1981 onwards) and from 1961 for Keith’s to hide the decline.” The paper in question is the Mann, Bradley and Hughes (1998) Nature paper on the original multiproxy temperature reconstruction, and the “trick” is just to plot the instrumental records along with reconstruction so that the context of the recent warming is clear. Scientists often use the term “trick” to refer to a “a good way to deal with a problem”, rather than something that is “secret”, and so there is nothing problematic in this at all. As for the “decline”, it is well known that Keith Briffa’s maximum latewood tree ring density proxy diverges from the temperature records after 1960 (this is more commonly known as the “divergence problem”—see e.g. the recent discussion in this paper) and has been discussed in the literature since Briffa et al in Nature in 1998 (Nature, 391, 678–682). Those authors have always recommend not using the post 1960 part of their reconstruction, and so while “hiding” is probably a poor choice of words (since it is “hidden” in plain sight), not using the data in the plot is completely appropriate, as is further research to understand why this happens.
[21] Webpage: “Contributors.” RealClimate. Accessed June 30, 2011 at <www.realclimate.org>
The current permanent contributors to content on this site are:
• Gavin Schmidt
• Michael Mann
• Caspar Ammann
• Rasmus Benestad
• Ray Bradley
• Stefan Rahmstorf
• Eric Steig
• David Archer
• Ray Pierrehumbert
• Thibault de Garidel
• Jim Bouldin
William Connolley was a contributor, but has now left academia, although his posts are still online.
[22] Blog post: “Myth vs. Fact Regarding the ‘Hockey Stick.’ ” By Michael Mann. RealClimate, December 4, 2004. <www.realclimate.org>
“Studies such as those of Soon and associates (Soon and Baliunas, 2003; Soon et al, 2003) that consider only ‘20th century’ conditions, or interpret past temperature changes using evidence incapable of resolving trends in recent decades, cannot meaningfully address the question of whether late 20th century warmth is anomalous in a long-term and large-scale context.”
[23] Blog post: “Myth vs. Fact Regarding the ‘Hockey Stick.’ ” By Michael Mann. RealClimate, December 4, 2004. <www.realclimate.org>
John Finn says: … Whatever the reason for the divergence, it would seem to suggest that the practice of grafting the thermometer record onto a proxy temperature record – as I believe was done in the case of the “hockey stick” – is dubious to say the least. …
[Response: No researchers in this field have ever, to our knowledge, “grafted the thermometer record onto” any reconstruction. It is somewhat disappointing to find this specious claim (which we usually find originating from industry-funded climate disinformation websites) appearing in this forum. Most proxy reconstructions end somewhere around 1980, for the reasons discussed above. Often, as in the comparisons we show on this site, the instrumental record (which extends to present) is shown along with the reconstructions, and clearly distinguished from them (e.g. highlighted in red as here). Most studies seek to “validate” a reconstruction by showing that it independently reproduces instrumental estimates (e.g. early temperature data available during the 18th and 19th century) that were not used to “calibrate” the proxy data. When this is done, it is indeed possible to quantitatively compare the instrumental record of the past few decades with earlier estimates from the proxy reconstruction, within the context of the estimated uncertainties in the reconstructed values (again see the comparisons here, with the instrumental record clearly distinguished in red, the proxy reconstructions indicated by e.g. blue or green, and the uncertainties indicated by shading). -mike]
[24] Climategate Document 938031546.
From: Keith Briffa† <k.briffa…>
To: “Folland, Chris”‡ <ckfolland…>, “Phil Jones”§ <p.jones…>, “Michael E. Mann”# <mann…>
Subject: RE: IPCC revisions
Date: Wed Sep 22 16:19:06 1999
Cc: tkarl… [Tom Karl£]
NOTES:
- † At the time of the e-mail, Briffa was the Deputy Director of the CRU and a lead author of the chapter about proxies in the 2007 IPCC report. [Webpage: “Professor Keith Briffa.” Accessed June 29, 2011 at <bit.ly>. “I am currently Deputy Director of the Climatic Research Unit, University of East Anglia, Norwich, U.K., where I have worked since 1977.”] [Report of Working Group 1: “Climate Change 2007: The Physical Science Basis.” Edited by S. D. Solomon and others. World Meteorological Organization/United Nations Environment Programme, Intergovernmental Panel on Climate Change. Cambridge University Press, 2007. Chapter 6: “Palaeoclimate.” By Eystein Jansen and others. <www.ipcc.ch>. “Lead Authors: Keith R. Briffa (UK) …”]
- ‡ Folland is a coordinating lead author of the chapter about proxies in the 2001 IPCC report. [Report of Working Group 1: “Climate Change 2001: The Scientific Basis.” Edited by J.T. Houghton and others. World Meteorological Organization/United Nations Environment Programme, Intergovernmental Panel on Climate Change, 2001. Chapter 2: “Observed Climate Variability and Change.” By C.K. Folland and others. <www.ipcc.ch>]
- § At the time of the e-mail, Jones was the Director of the CRU and is cited five times in the 2007 IPCC “spaghetti graph.” [Webpage: “Professor Philip Jones.” Accessed July 5, 2015 at <bit.ly>. “I am Research Director of the Climatic Research Unit (CRU) and a Professor in the School of Environmental Sciences at the University of East Anglia in Norwich. I am principally known for the time series of hemispheric and global surface temperatures, which I update on a monthly basis.”] [Report of Working Group 1: “Climate Change 2007: The Physical Science Basis.” Edited by S. D. Solomon and others. World Meteorological Organization/United Nations Environment Programme, Intergovernmental Panel on Climate Change. Cambridge University Press, 2007. Chapter 6: “Palaeoclimate.” By Eystein Jansen and others. <www.ipcc.ch>. Page 469: “Records of Northern Hemisphere temperature shown in Figure 6.10. … Jones and Moberg, 2003 … Jones and Moberg, 2003 … Jones et al., 2003 … Jones et al., 1998 … Mann and Jones, 2003”]
- # Mann is the lead author of the hockey stick graph. He is cited by name 29 times in the chapter about proxies in the 2001 IPCC report. [Paper: “Northern Hemisphere Temperatures During the Past Millennium.” By Michael E. Mann, Raymond S. Bradley, and Malcolm K. Hughes. Geophysical Research Letters, March 15, 1999. <www.geo.umass.edu>] [Report of Working Group 1: “Climate Change 2001: The Scientific Basis.” Edited by J.T. Houghton and others. World Meteorological Organization/United Nations Environment Programme, Intergovernmental Panel on Climate Change, 2001. Chapter 2: “Observed Climate Variability and Change.” By C.K. Folland and others. <www.ipcc.ch>]
- £ “Thomas Karl … Served as a Review Editor of the IPCC Fourth Assessment Report, Coordinating Lead Author and Lead Author of the IPCC Third Assessment Report, and both Lead and Contributing Author on the IPCC Second Assessment Report.” [Report: “ ‘Consensus’ Exposed: The CRU Controversy.” United States Senate Committee on Environment and Public Works, Minority Staff, February 2010. <www.epw.senate.gov>. Pages 35–36.]
[25] Climategate Document 1121869083.
… Date: Tue, 19 Jul 2005 15:38:31 +0100
To: Tom Crowley† <tcrowley…>, Jonathan Overpeck‡ <jto@…>
From: Keith Briffa§ <k.briffa…>
Subject: Re: thoughts and Figure for MWP box
Cc: Eystein Jansen# <eystein.jansen…> …
Jonathan Overpeck‡ wrote: …
ANOTHER THING THAT IS A REAL ISSUE IS SHOWING SOME OF THE TREE-RING DATA FOR THE PERIOD AFTER 1950. BASED ON THE LITERATURE, WE KNOW THESE ARE BIASED - RIGHT? SO SHOULD WE SAY THAT’S THE REASON THEY ARE NOT SHOWN? OF COURSE, IF WE ONLY PLOT THE FIG FROM CA [abbreviation for “about”] 800 TO 1400 AD, IT WOULD DO WHAT WE WANT, FOCUS ON THE MWP [Medieval Warm Period] ONLY - THE TOPIC OF THE BOX – AND SHOW THAT THERE WERE NOT ANY PERIODS WHEN ALL THE RECORDS ALL SHOWED WARMTH - I.E., OF THE KIND WE’RE EXPERIENCING NOW. TWO CENTS WORTH
NOTES:
- † Crowley was a reviewer of the chapter about proxies in the 2007 IPCC report. [Curriculum Vitae: Thomas John Crowley, January 2009. <www.ae-info.org>. “Reviewer, Intergovernmental Panel for Climate Change (IPCC) Chapter on Paleoclimatology (April, 2005)”]
- ‡ Overpeck is a coordinating lead author of the chapter about proxies in the 2007 IPCC report. [Article: “Nobel Peace Prize Winner has UA Connections.” By Johnny Cruz. University of Arizona News, October 12, 2007. <bit.ly>. “The Intergovernmental Panel on Climate Change was one of the winners of the 2007 Nobel Peace Prize, and a professor at The University of Arizona was one of only 33 lead authors on an IPCC assessment report released earlier this year. Jonathan Overpeck, director of the UA’s Institute for the Study of Planet Earth and professor of geosciences and atmospheric sciences, was a coordinating lead author, Chapter 6 (Paleoclimate), for the IPCC’s fourth assessment report.”]
- § At the time of the e-mail, Briffa was the Deputy Director of the CRU and a lead author of the chapter about proxies in the 2007 IPCC report. [Webpage: “Professor Keith Briffa.” Accessed June 29, 2011 at <bit.ly>. “I am currently Deputy Director of the Climatic Research Unit, University of East Anglia, Norwich, U.K., where I have worked since 1977.”] [Report of Working Group 1: “Climate Change 2007: The Physical Science Basis.” Edited by S. D. Solomon and others. World Meteorological Organization/United Nations Environment Programme, Intergovernmental Panel on Climate Change. Cambridge University Press, 2007. Chapter 6: “Palaeoclimate.” By Eystein Jansen and others. <www.ipcc.ch>. “Lead Authors: Keith R. Briffa (UK) …”]
- # Jansen is a coordinating lead author of the chapter about proxies in the 2007 IPCC report. [Report of Working Group 1: “Climate Change 2007: The Physical Science Basis.” Edited by S. D. Solomon and others. World Meteorological Organization/United Nations Environment Programme, Intergovernmental Panel on Climate Change. Cambridge University Press, 2007. Chapter 6: “Palaeoclimate.” By Eystein Jansen and others. <www.ipcc.ch>]
[26] Report of Working Group 1: “Climate Change 2007: The Physical Science Basis.” Edited by S. D. Solomon and others. World Meteorological Organization/United Nations Environment Programme, Intergovernmental Panel on Climate Change. Cambridge University Press, 2007.
Chapter 6: “Palaeoclimate.” By Eystein Jansen and others. Pages 433–497. <www.ipcc.ch>
Page 469: “Records of Northern Hemisphere temperature shown in Figure 6.10. … ECS2002 … Esper et al., 2002; recalibrated by Cook et al., 2004a”
[27] Paper: “Extra-Tropical Northern Hemisphere Land Temperature Variability Over the Past 1000 Years.” By Edward R. Cook and others. Quaternary Science Reviews, November 2004. Pages 2063–2074. <www.sciencedirect.com>
Page 2063: “The Northern Hemisphere (NH) temperature reconstruction published by Esper, Cook, and Schweingruber (ECS) in 2002 is revisited in order to strengthen and clarify its interpretation.”
Page 2071:
The re-calibrated mean RCS [Regional Curve Standardization method] tree-ring record probably represents the best reconstruction of past land-only, extra-tropical NH [Northern Hemisphere] annual temperatures that is practical to extract from it at this time. Note that it does very well at tracking the instrumental data on inter-decadal and longer timescales up to about 1982, after which the tree-ring estimates systematically under-estimate the actual warming.