Please wait as we load hundreds of rigorously documented facts for you.
Please wait as we load hundreds of rigorously documented facts for you.

For example:

* The facts below differentiate between healthcare spending, prices, and costs based upon the following definitions:
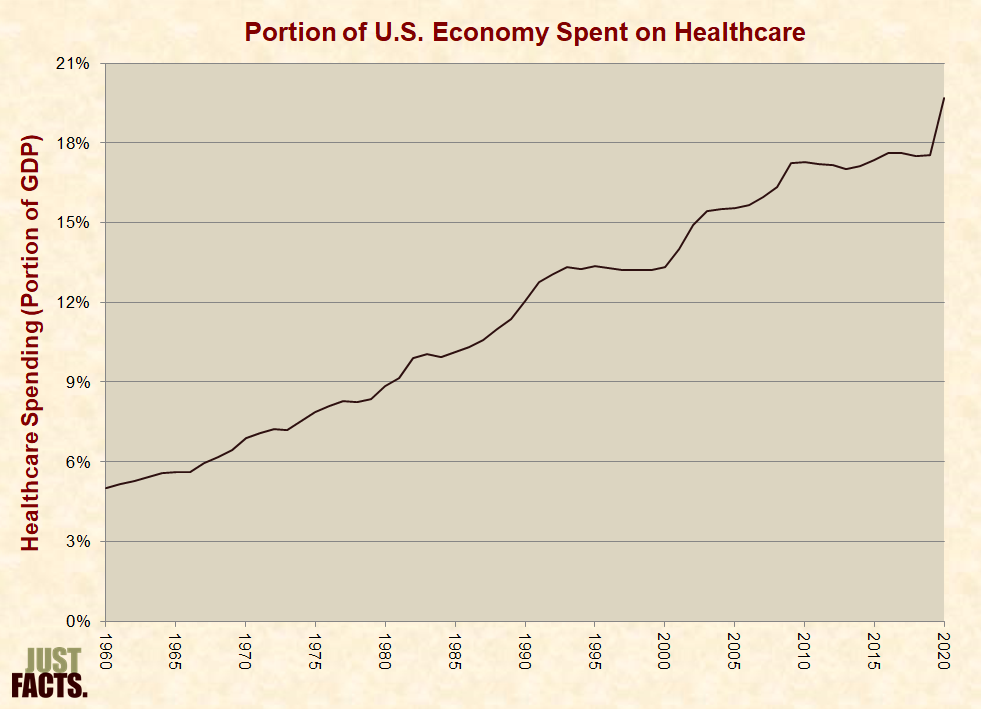
* From 1960 to 2020, healthcare spending in the United States increased:
* In 1942, the price for a maternity room at Christ Hospital in Jersey City, NJ was $7.00 per day.[3] Adjusting for inflation, this amounts to $97.29 in 2011 dollars.[4] In 2011, the price for a maternity room at the same hospital was $1,360 per day.[5]
* A 2022 survey of 15 hospitals in Ohio (where state law requires hospitals to publish their prices[6]) found that the daily price of a typical hospital room ranged from $1,905 to $3,675, with an average of $2,391 and a median of $2,166.[7]
* In 1980, the average price for a typical hospital room in the U.S. was $127 per day.[8] Adjusting for inflation, this amounts to $459 in 2022 dollars.[9]
* In 1988, Mutual of Omaha insurance company paid an average of $270 per day for all types of hospital rooms (such as medical/surgical, intensive care, maternity, etc.).[10] [11] Adjusting for inflation, this amounts to $656 in 2022 dollars.[12]
* In 2002, Mutual of Omaha paid an average of $748 per day for all types of hospital rooms.[13] Adjusting for inflation, this amounts to $1,187 in 2022 dollars.[14]
* Third-party payments are healthcare expenses that are not directly paid by consumers but by other entities such as governments and insurance companies. Such entities are called “third-parties” because they do not deliver or receive healthcare. In other words, they are not patients or caregivers.[15]
* From 1960 to 2020, the portion of U.S. healthcare expenses paid:
* A scientific, nationally representative survey commissioned in 2019 by Just Facts found that 38% of voters believe the government now pays a smaller portion of all U.S. healthcare costs than it did in 1960.[17] [18] [19]
* Per the Encyclopedia of Health Care Management:
* A Rand Corporation study tracked the healthcare spending of 2,756 families over periods of either three or five years during 1974–1982. The families were given insurance plans that covered all healthcare expenses above $1,000 per year or a reduced amount for lower-income families so that healthcare expenses could never exceed certain portions of their income.[23] (Accounting for inflation, $1,000 during the timeframe of this study equates to about $4,507 in 2022 dollars.[24])
* The families in the study were then randomly assigned to plans that covered their healthcare expenses below $1,000 per year, covering either 5%, 50%, 75%, or 100% of this spending. For example, families with 75% coverage paid 25% of their healthcare spending up to $1,000 per year (a maximum of $250 out-of-pocket), and insurance paid for everything else. The results were as follows:
* A 2001 study published in the American Journal of Public Health analyzed insurance coverage levels and health outcomes of “an older, chronically ill population” with conditions such as “diabetes, hypertension, coronary artery disease, congestive heart failure, or depression.” The study grouped “individuals into 3 cost-sharing categories: no copay (insurance pays all), low copay (insurance pays more than half but not all), and high copay (insurance pays half or less).” Per the study:
* U.S. law has incentivized and subsidized third-party healthcare payments by:
* Two common measures of nations’ wealth are:
* The Organization for Economic Cooperation and Development (OECD) is a group of 38 mostly developed nations such as Australia, Canada, Germany, Japan, and the United States.[52] [53]
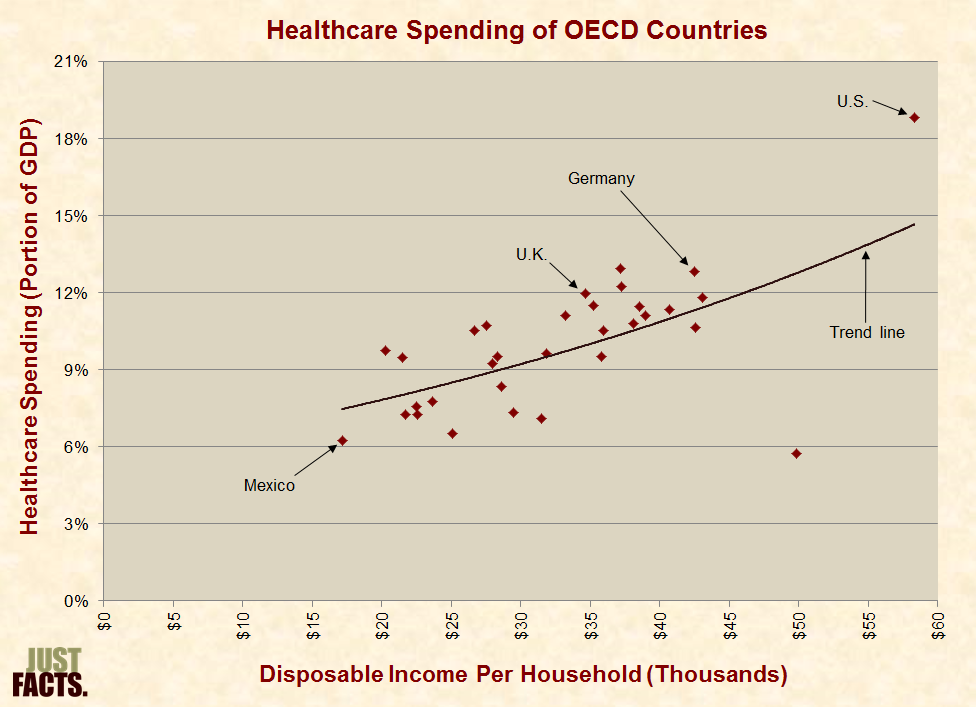
* Among OECD nations, higher disposable income is generally associated with a greater portion of GDP spent on healthcare:

* Per the Handbook of Health Economics, “results obtained with international comparisons should be treated with considerable caution,” but a “common and extremely robust result of international comparisons is that the effect of per capita GDP (income) on [healthcare] expenditures is clearly positive and significant….”[58] [59]
* Personal healthcare expenditures consist of monies directly spent to “treat individuals with specific medical conditions.”[60]
* In the U.S. during 2014, the average annual healthcare spending per person for 65–84-year-olds was 3.5 times higher than that of 19–44 year-olds:
|
Age Group (Years) |
Annual Personal Healthcare Spending Per Person |
|
0–18 |
$3,749 |
|
19–44 |
$4,856 |
|
45–64 |
$10,212 |
|
65–84 |
$16,977 |
|
85+ |
$32,903 |
|
All ages |
$8,054 |
* When the first wave of baby boomers reached the age of 65 in 2011, there were 4.5 Americans aged 20–64 for every American aged 65 or older. As the baby-boom generation ages and projected life expectancy increases, the Social Security Administration projects that this ratio will drop to 2.8 to 1 by 2030 and to 2.7 to 1 by 2040.[62] [63] [64]
* Cancer, cardiovascular disease, and diabetes are responsible for the majority of deaths and healthcare costs in the United States.[65] [66]
* In 2008, the journal of the American Heart Association published a study entitled “The Impact of Prevention on Reducing the Burden of Cardiovascular Disease.” The authors found that:
* Per the Congressional Budget Office:
* In 2008, the journal PLoS Medicine published a study on the healthcare costs of obesity and smoking in the Netherlands. The authors found that:
* The study’s conclusion states:
* In 1998, the British Medical Journal published a study examining the cost effectiveness of preventing fatal diseases in the Netherlands. The study found that:
* The study’s conclusion states:
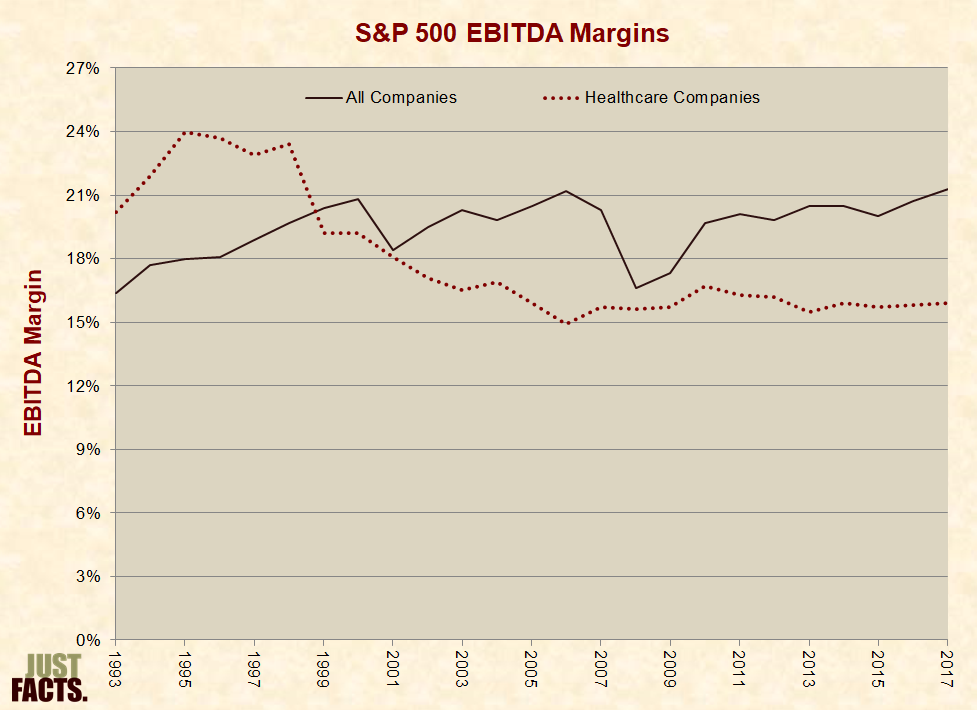
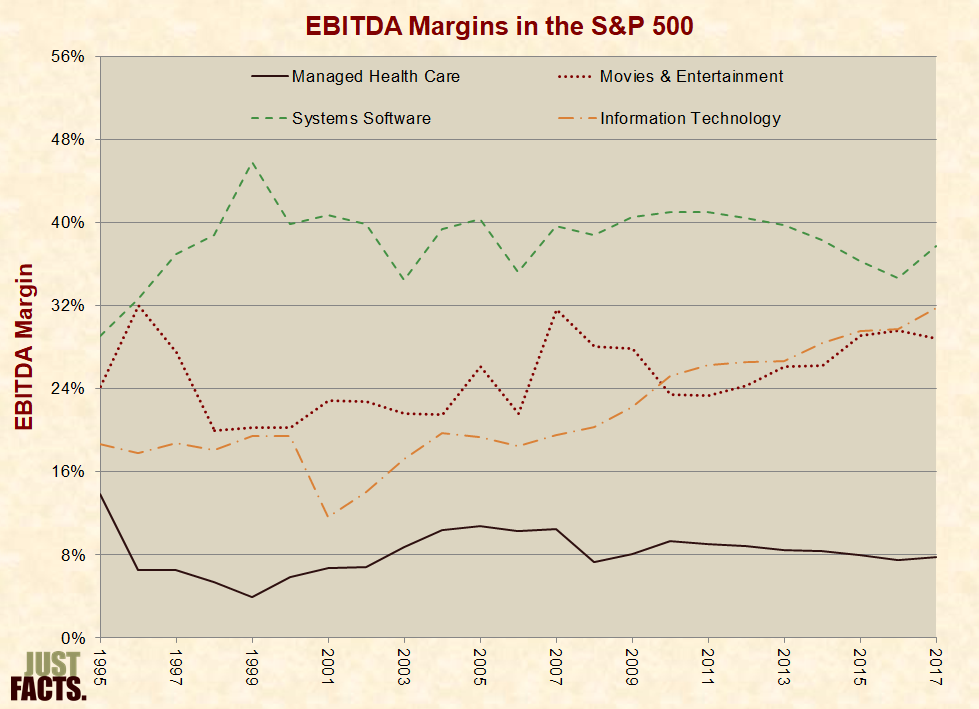
* EBITDA or “earnings before interest, taxes, depreciation and amortization,” is “an important standard measure” of company and industry profitability.[73] [74]
* From 1993 to 2017, the average EBITDA margin for all companies in the S&P 500 was 20%. For healthcare companies in the S&P 500, it was 18%:
* As of August 2015, the net profit margins (after taxes[77]) for various industries within the healthcare sector were as follows:
|
Industry |
Net Profit Margin |
|
Medical Practitioners |
–11.5% |
|
Generic Drugs |
–4.4% |
|
Long-Term Care Facilities |
–2% |
|
Home Healthcare |
–0.5% |
|
Drug-Related Products |
1.7% |
|
Healthcare Plans |
3.2% |
|
Hospitals |
4.1% |
|
Specialized Health Services |
6.2% |
|
Medical Laboratories & Research |
6.4% |
|
Drug Delivery |
8.2% |
|
Medical Appliances & Equipment |
10.2% |
|
Medical Instruments & Supplies |
10.5% |
|
Diagnostic Substances |
11.4% |
|
Non-Major Drug Manufacturers |
17.6% |
|
Biotechnology |
19.5% |
|
Major Drug Manufacturers |
21.6% |
* In May of 2021, the average hourly wage (not including benefits) for nonfarm workers in the U.S. was $28.01, and the average hourly wage for various healthcare occupations was as follows:
|
Occupation Title |
Average Hourly Wage |
|
Pharmacy Technicians |
$18.25 |
|
Paramedics |
$23.80 |
|
Dietitians and Nutritionists |
$31.55 |
|
Chiropractors |
$39.06 |
|
Registered Nurses |
$39.78 |
|
Physical Therapists |
$44.67 |
|
Physician Assistants |
$57.43 |
|
Pharmacists |
$60.43 |
|
Dentists |
$85.47 |
|
Pediatricians |
$95.40 |
|
Family Medicine Physicians |
$113.43 |
|
Psychiatrists |
$120.08 |
|
Surgeons |
$141.60 |
|
Obstetricians and Gynecologists |
$142.41 |
|
Anesthesiologists |
$159.22 |
* In 2021, all of the top-10 highest-paying occupations were in the medical or dental fields.[81]
* Per the Congressional Budget Office:
* Per the U.S. Treasury Department, an “improper payment” is:
* Per the U.S. Government Accountability Office:
* In 2021, the U.S. Department of Health and Human Services and Department of Justice spent $2.2 billion trying to control healthcare fraud and abuse.[88]
* According to federal government estimates, during 2021:
* In New Jersey during 2007, the agency that administers Medicaid and the Children’s Health Insurance Program provided such benefits to at least 873 families with gross incomes above $85,000, including three families with incomes above $700,000.[94] [95]
* In 2008, the Government Accountability Office reported that their investigators were able to “easily set up two fictitious” medical supply companies that were “approved for Medicare billing privileges despite having no clients and no inventory.”[96]
* A 2009 Medicare fraud investigation by CBS News found that:
* A 2010 Medicare fraud investigation by the Wall Street Journal found that:
* Per the FBI’s “2009 Financial Crimes Report”:
* In 2011, the U.S. Government Accountability Office reported the results of an investigation to “determine the extent to which Medicare beneficiaries obtained frequently abused drugs from multiple prescribers.” This is called “doctor shopping,” and it is one of the main ways people “obtain highly addictive” prescription drugs “for illegitimate use.” The investigation found that:
* The Inspector General of the U.S. Department of Health and Human Services investigated opioid use among Medicare beneficiaries during 2021 to determine the extent to which beneficiaries overdosed on or received high amounts of opioids.[101] This study found that:
* In the U.S. during 2020:
* Federal law requires all nonprofit hospitals to treat Medicare and Medicaid patients.[112] During 2020:
* As of 2018, state Medicaid plans limited payments for hospital stays to no more than 45 days in Florida, 24 days in Oklahoma, and 30 days in Texas. Many states require prior approval for hospital stays or certain procedures.[114]
* Federal law requires most hospitals with emergency departments to provide an “examination” and “stabilizing treatment” for anyone who comes to such a facility and requests care for an emergency medical condition or childbirth, regardless of their ability to pay and immigration status. This is mandated under a federal law called the Emergency Medical Treatment and Active Labor Act (EMTALA).[115] [116] [117]
* In 2000, emergency room physicians incurred an average of $138,300 in bad debt by providing treatment mandated under EMTALA. Bad debt does not include charity care or care for which charges were reduced through negotiations. It only includes care for which payment was owed and not received.[118]
* In 2001, emergency room physicians spent about half of their patient-care time providing treatment mandated under EMTALA.[119]
* Since 2014, the Affordable Care Act (a.k.a. Obamacare) has required private health insurers to:
* The added costs of insuring people after they become ill raises the premiums of other customers.[124] [125] [126] [127] Per a 2016 report by Blue Cross Blue Shield (BCBS):
* “Uncompensated care” is defined as the total cost to healthcare providers of both charity care and bad debt.[129]
* In 2021, the Consumer Financial Protection Bureau reported that 58% of all third-party debt collection efforts were associated with medical bills.[130] [131]
* In 2020, hospitals provided $42.7 billion of uncompensated care,[132] amounting to 3.5% of hospitals’ total costs.[133]
* “Defensive medicine” is defined by the American Academy of Orthopaedic Surgeons as “the practice of ordering excessive or unnecessary tests, procedures, visits, or consultations solely for reducing liability risk to the physician, and/or the practice of avoiding high-risk patients or procedures.”[134]
* In 2010, the costs to the U.S. healthcare system of malpractice awards, lawyers’ fees, and lawsuit-related administrative costs were about $30 billion or 1.1% of total healthcare spending.[135] [136] (This does not include the costs of defensive medicine.)
* States and localities have varying legal systems and demographics that drive disparities in medical malpractice costs.[137] As examples:
* A nationwide survey of 462 physicians conducted in 2009/2010 by Gallup and Jackson Healthcare found that 73% of doctors engaged in some form of defensive medicine over the past 12 months. On average, the physicians who practiced defensive medicine estimated that 21% of their practice was defensive in nature.[146]
* As of November 2022, Just Facts has been unable to find a credible estimate for the system-wide costs of defensive medicine in the U.S.[147] [148]
* A widely cited 2010 paper in the journal Health Affairs estimates that the costs of defensive medicine in the U.S. during 2008 were $38.8 billion for hospitals and $6.8 billion for physician and clinical services.[149]
* The authors of this study arrived at the $38.8 billion estimate for hospitals by:
* The authors of this same study:
* Examples of administrative and regulatory dynamics that impact healthcare costs include:
* A 2001 study conducted by PricewaterhouseCoopers for the American Hospital Association chronicled more than 40 layers of paperwork associated with caring for a typical Medicare patient who arrives at an emergency room with a broken hip and receives treatment until recuperation.[183] Some of the findings are:
* In 2022, federal, state, and local governments in the U.S. spent $2,239 billion on health and healthcare programs.[191] This amounts to:
* Relative to other types of government spending in 2022, healthcare spending was:
* From 1959 to 2022, spending on health and healthcare programs rose from:
* “Mandatory” federal programs are those that are permanently funded by law. Hence, they can spend money without Congress and the president passing new laws. In contrast, Congress and the president typically fund “discretionary” programs for one year at a time.[198] [199] The four major federal mandatory healthcare programs are Medicare, Medicaid, the Children’s Health Insurance Program, and the Affordable Care Act (i.e., Obamacare) exchange subsidies.[200] [201]
* The share of federal revenues spent on mandatory healthcare programs increased from 5% in 1970 to 14% in 1990 and 36% in 2010. In 2014, the Congressional Budget Office projected that under current federal policies, this share would rise to 41% in 2030, 55% in 2050, and 75% in 2080. Combining these projections with historical data and actual outcomes since then yields the following results:

* Data from the chart above:
|
Year |
Historical |
Projection |
|
1970 |
5% |
|
|
1980 |
9% |
|
|
1990 |
14% |
|
|
2000 |
16% |
|
|
2010 |
36% |
|
|
2020 |
41% |
|
|
2021 |
35% |
|
|
2030 |
41% |
|
|
2040 |
49% |
|
|
2050 |
55% |
|
|
2060 |
61% |
|
|
2070 |
68% |
|
|
2080 |
75% |
|
|
2089 |
81% |
* The Medicare program was founded in 1965 to provide health insurance for people aged 65 and older. It was later expanded to cover younger people who are permanently disabled.[203]
* In 2021, Medicare provided health insurance for almost all Americans aged 65 and over (roughly 56 million people) and about 8 million permanently disabled individuals under the age of 65.[204] [205] [206] In total, Medicare enrollees are about 19% of the U.S. population.[207]
* Medicare provides coverage for:
* In 2021, Medicare beneficiaries received an average of $13,536 per person in healthcare benefits and paid an average of $1,940 per person in premiums.[212]
* To qualify for premium-free Medicare hospital insurance, individuals or their spouses must work while paying Medicare’s payroll tax for at least ten years.[213]
* In 2019 (latest available data), Medicare covered 66% of healthcare expenses for traditional Medicare beneficiaries not living in institutions such as nursing homes. The remainder of beneficiaries’ healthcare expenses were paid by:
* In 2021, Medicare spent about $840 billion.[216] This amounts to 12% of all federal expenditures and 19% of all federal revenues.[217]
* Medicare expenditures in 2020 were funded by:
|
Portion[218] |
Category |
Source |
|
46% |
General revenues[219] |
Federal income, corporate, excise, and other taxes.[220] In total, these taxes are progressive so that higher-income households pay higher effective tax rates.[221] [222] [223] [224] [225] [226] |
|
34% |
Payroll taxes |
A 2.9% payroll tax on all workers’ wages and another 0.9% payroll tax on wages above $200,000 for singles and $250,000 for couples.[227] [228] [229] |
|
15% |
Insurance premiums |
Premiums paid by Medicare beneficiaries who receive Part B or Part D benefits. These premiums are indexed so that wealthier beneficiaries pay greater amounts.[230] [231] [232] |
|
3% |
Taxes on Social Security benefits |
Taxes paid by Social Security beneficiaries whose incomes exceed certain thresholds.[233] |
|
1% |
Transfers |
State governments.[234] |
|
1% |
Interest[235] |
Interest paid on the Medicare Trust Fund from the general fund of the U.S. Treasury.[236] [237] |
|
1% |
Miscellaneous |
Fees and gifts.[238] |
* In 2017, 81% of primary care physicians accepted new Medicare patients, as compared to 76% who accepted new Medicaid patients and 97% who accepted new privately insured patients.[239]
* All nonprofit hospitals are required by law to treat Medicare patients.[240]
* In 2019, Medicare payment rates for inpatient hospital services were 60% of private health insurance payment rates.[241]
* In 2020, Medicare paid hospitals an average of 16% below their costs of caring for Medicare patients.[242]
* The Affordable Care Act (a.k.a. Obamacare) progressively cuts Medicare payment rates “for hospital, skilled nursing facility, home health, hospice, ambulatory surgical center, diagnostic laboratory, and many other services” over upcoming decades to “less than half of their level under the prior law.” The U.S. Centers for Medicare and Medicaid Services projects that by 2097, Medicare payment rates for inpatient hospital services will be about 40% of private health insurance payment rates. Medicare’s Trustees have stated that these cuts will likely cause “withdrawal of providers from the Medicare market” and “severe problems with beneficiary access to care….”[243] [244]
* From 2013 to 2017, the number of rural hospital closures in the U.S. was more than twice the number of closures during the preceding five-year period. The U.S. Government Accountability Office found that the closures “were generally preceded and caused by financial distress” that was “exacerbated” by a decline in the number of patients receiving inpatient care and “across-the-board Medicare payment reductions.”[245]
* A scientific, nationally representative survey commissioned in 2019 by Just Facts found that 45% of voters believe the price controls in Obamacare won’t worsen Medicare patients’ access to care.[246] [247] [248]
* In 2003, Congress and Republican President George W. Bush passed a law adding a prescription drug benefit to the Medicare program.[249] [250] The bill passed with 88% of Republicans voting for it and 89% of Democrats voting against it.[251] The Congressional Budget Office estimated it would add $395 billion to the deficit over the following 10 years.[252]
* The Democratic Congressional Campaign Committee later described the Republican-passed Medicare prescription drug benefit as “costly.”[253] When this bill was being debated, 85% of House Democrats voted for a competing plan that the Congressional Budget Office estimated would add $969 billion to the deficit over the following 10 years, or 2.4 times more than the Republican plan.[254] [255]
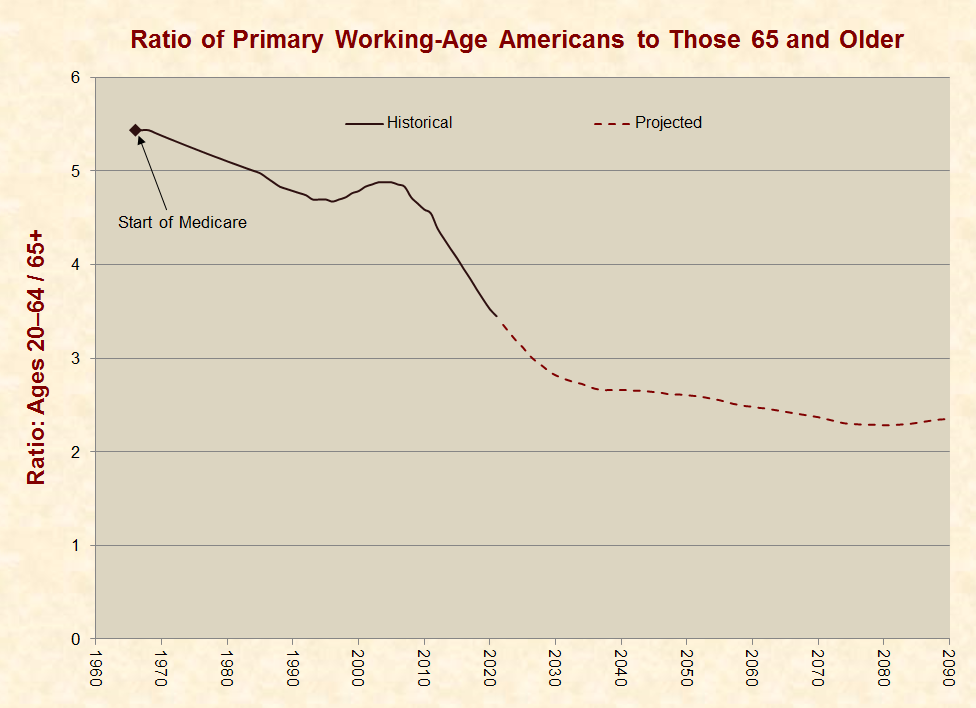
* When Medicare began paying benefits in 1966,[256] there were 5.4 Americans in their primary working years (aged 20–64) for every American aged 65 or older. By 2021, this ratio declined to 3.4 or by 37%.[257] [258]
* As the baby-boom generation matures and projected life expectancy increases,[259] the Social Security Administration projects that the ratio of people in their primary working years to Medicare benefit recipients will decline to 2.8 by 2030, or by 48% from 1966 to 2030:
* From the time that Medicare was established in 1965, the general eligibility age for benefits has stayed at 65 years old.[261] [262] In 1965:
* In 2012, the journal Demography published research that found the Social Security Administration is using an antiquated method to project life expectancies, and as a result, the program “may be in a considerably more precarious position than officially thought.”[275]
* The 2022 Medicare Trustees Report projects the future finances of the Medicare program based upon high, low, and intermediate-cost assumptions.[276] Per the intermediate assumptions, the Medicare program faces a $52 trillion actuarial deficit over the next 75 years (in 2022 dollars). The resources needed to cover this deficit “would be in addition to the payroll taxes, benefit taxes, and premium payments.”[277]
* The above actuarial deficit approximates how much money must be immediately added to the Medicare program to cover the projected shortfall between the program’s dedicated funding sources and its costs for the next 75 years.[278] It is equivalent to 62 times the total spending for Medicare in 2021.[279]
* The Medicare Trustees have stated that measurements such as the actuarial deficit can:
* One way to account for the last of these concerns is to calculate how much money must be immediately added to the Medicare program in order to cover the projected shortfall for all current participants in the program (both taxpayers and beneficiaries).[282] This amounts to $52.7 trillion or an additional $201,572 from every U.S. resident aged 16 or older.[283] [284] [285] This measure approximates the method by which publicly traded companies are required by law to report the finances of their pension and retirement plans.[286] [287] [288] [289]
* The Medicare Trustees Report makes financial projections based primarily on current laws.[290] Per the Trustees, the “actual future costs for Medicare may exceed the projections shown in this report, possibly by substantial amounts.”[291] This is because:
* In 2022, U.S. Centers for Medicare and Medicaid Services published an alternative projection to estimate the potential costs of Medicare given the facts listed above.[294] Per this estimate, actual Medicare costs will exceed the costs shown in the Trustees Report by 3% per year by 2040, 13% per year by 2060, 24% per year by 2080, and 33% per year by 2096.[295]
* In 2022, the U.S. Treasury published a financial analysis of the alternative projection described above. These calculations show that Medicare’s 75-year open group unfunded obligation is 21% higher under the alternative projection than it is under current law.[296]
* When Democratic President Lyndon B. Johnson proposed a “hospital insurance” program for senior citizens in his 1964 State of the Union speech, he said that it would cost “no more than $1 a month” per worker.[297]
* Adjusted for inflation, $1 in 1964 equals $9.68 in 2023.[298] Individuals with the following wages now pay the following Medicare hospital insurance payroll taxes per month:
|
Yearly Wages |
Monthly Hospital Insurance Taxes |
|
$25,000 |
$60 |
|
$50,000 |
$121 |
|
$100,000 |
$242 |
|
$250,000 |
$642 |
|
$1,000,000 |
$3,017 |
* Hospital insurance payroll taxes fund about 34% of Medicare’s total spending. Other Medicare benefits—like physician services, lab tests, and prescription drugs—are paid through other taxes, premiums, and miscellaneous receipts.[300]
* The Medicare payroll tax amounts shown on paychecks generally do not account for the taxes that employers pay.[301] These taxes are mainly borne by employees in the form of reduced wages (for more details, see Just Facts’ research on tax distribution).[302] [303] [304] [305]
* Medicare hospital insurance payroll taxes were previously limited by a wage threshold that generally increased as the national average wage increased. Earnings above this threshold were not subject to the Medicare payroll tax. In 1993, this threshold was $135,000 per year.[306] That year, the 103rd Congress and Democratic President Bill Clinton passed a law that removed the threshold, thus making all earnings subject to Medicare payroll taxes.[307] The bill passed with 85% of Democrats voting for it and 100% of Republicans voting against it.[308]
* The same 1993 bill imposed a new Medicare tax on Social Security beneficiaries with incomes above certain limits. This tax is levied on the Social Security benefits of individuals if the total of one-half of their benefits and all other income is more than $34,000 per year ($44,000 if married and filing jointly).[309] [310] This threshold is not indexed for inflation or wage growth.[311]
* Starting in 2013, the Affordable Care Act (a.k.a. Obamacare) levied an additional 0.9% Medicare hospital insurance payroll tax on wages above $200,00 for singles and $250,000 for couples.[312] [313] This law passed with 89% of Democrats voting for it and 100% of Republicans voting against it.[314]
* The Medicaid program was founded in 1965 to pay for healthcare services for “certain low-income persons in the United States and its Territories.”[315] [316]
* In 2019, an average of 74 million people in the U.S. and its territories were enrolled in Medicaid for the entire year.[317] [318]
* During the Covid-19 pandemic—amid government-mandated business shutdowns that cost millions of jobs[319] [320]—average Medicaid enrollment increased from 75 million people in 2020 to 84 million in 2021.[321]
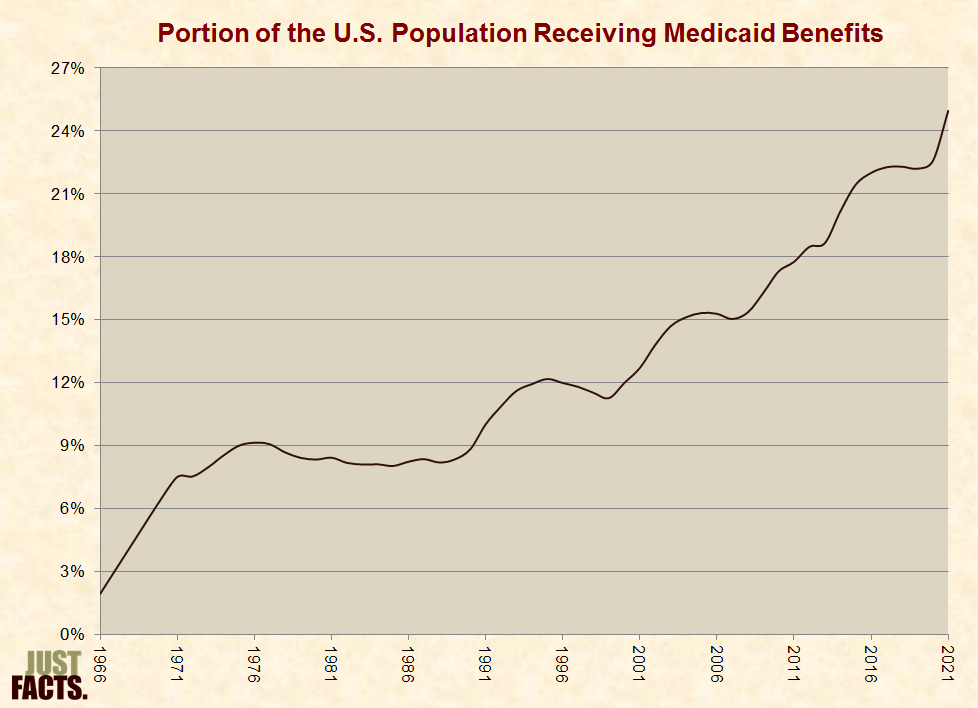
* The average portion of the U.S. population receiving Medicaid benefits for the entire year increased from 2% in 1966 to 25% in 2021:
* In 2019, Medicaid enrollment and spending was divided as follows:
|
Category |
Portion of Beneficiaries[323] |
Cost Per Enrollee[324] |
Portion of Medicaid Spending[325] |
|
Adults |
39% |
$5,808 |
28% |
|
Children |
38% |
$3,336 |
16% |
|
Disabled |
13% |
$21,368 |
34% |
|
Aged |
10% |
$17,885 |
23% |
* States are not required to participate in the Medicaid program, but all choose to do so. Within certain federal guidelines, states have latitude in setting eligibility criteria, deciding which healthcare services to cover, and regulating payments to doctors and other healthcare providers.[326] [327] [328]
* An example of a federal guideline is that all participating states must provide Medicaid coverage for pregnant women and children in families with income below a certain level.[329]
* Per the Congressional Research Service, “compared to both Medicare and employer-sponsored health care plans,” Medicaid “offers the broadest array of medical care and related services available in the United States today.”[330]
* Medicaid-covered services vary by state and include items such as ambulance transportation, chiropractic care, dental care, eyeglasses, physician services, hospital services, substance abuse rehabilitation, nonemergency medical transportation, personal care, prescription drugs, and private duty nursing.[331] [332]
* Medicaid expenditures are funded by federal and state general revenues.[333] Federal general revenues are comprised of income, corporate, excise, and other taxes.[334] [335] In total, these taxes are progressive so that higher-income households pay higher effective tax rates.[336] [337] [338]
* In 2021, Medicaid spent about $736 billion. This amounts to:
* The portion of Medicaid expenditures paid by the federal versus state governments varies by state. The federal government pays a greater share of Medicaid costs for states with lower average income levels.[340]
* There is no dollar limit on the federal funds states may receive for their Medicaid programs. Thus, as states provide more generous Medicaid benefits, they receive more funding from the federal government.[341] [342]
* The average share of Medicaid spending paid by the federal government (versus the states) has risen from 48% in 1966 to 69% in 2020, with a spike in 2009–2010 due to various “stimulus” bills and the Affordable Care Act and another spike beginning in 2020 due to the Covid-19 pandemic:

* In 2020, Medicaid paid for:
* Unauthorized immigrants are not eligible for standard Medicaid coverage but can receive Medicaid for emergency conditions. An emergency condition is defined as “one manifested by acute symptoms of such severity that the absence of immediate medical attention could reasonably be expected to result in”:
* In 2009, 74% of all babies delivered at Parkland Memorial Hospital in Dallas, Texas were born to women who were noncitizens.[352]
* Depending upon the state of residence, as of 2022, Medicaid will pay up to 100% of nursing home costs for individuals who have:
* Per the U.S. Centers for Medicare and Medicaid Services:
* From January 2006 through May 2009, a Medicaid enrollee in Buffalo, NY used an ambulance service 603 times at no cost to him, costing taxpayers at least $118,158.[355]
* All nonprofit hospitals are required by law to treat Medicaid patients.[356]
* In 2019, Medicaid payment rates for inpatient hospital services were 62% of private health insurance payment rates.[357]
* In 2020, Medicaid paid hospitals an average of 12% below their costs of caring for Medicaid patients.[358]
* Under current law, Medicaid payment rates for inpatient hospital services will progressively decline to about 40% of private health insurance payment rates by 2097.[359]
* In 2019, Medicaid payment rates for physician services were about 54% of private health insurance payment rates.[360]
* Per the 2013 Medicare Trustees Report, low Medicaid payment rates for healthcare services “have already led to access problems for Medicaid enrollees.”[361] [362]
* For a study published in the New England Journal of Medicine (2011), researchers posing as mothers called 273 specialty clinics in Cook County, Illinois (an urban area containing Chicago), to schedule appointments for “common health conditions requiring outpatient specialty care.” The researchers called each clinic twice, once while stating that their children were covered by Medicaid or the Children’s Health Insurance Program (CHIP), and the other while stating that their children were covered by private insurance. The study found that:
* A survey conducted by the Center for Studying Health System Change found that “about half of physicians reported accepting all new Medicaid patients in 2004–05, compared with more than 70 percent for Medicare and privately insured patients.”[364]
* In 2017, 76% of primary care physicians accepted new Medicaid patients, as compared to 81% who accepted new Medicare patients and 97% who accepted new privately insured patients.[365]
* Starting in 2014, the Affordable Care Act (a.k.a. Obamacare) required all states to provide Medicaid coverage for all individuals under the age of 65 with family incomes below 138% of federal poverty guidelines, without regard for any assets they have.[366] [367] In 2022, 138% of the federal poverty guideline was $38,295 for a family of four.[368]
* Obamacare stripped all federal Medicaid funds from any state that refused to comply with this expansion of Medicaid.[369]
* In the 2012 Supreme Court case of National Federation of Independent Business v. Sebelius:
* As of January 2022, 39 states and the District of Columbia have expanded Medicaid in accord with Obamacare. In these states, all adults under the age of 65 with family incomes below at least 138% of federal poverty guidelines are eligible for Medicaid. Some of these states also provide Medicaid to people with higher incomes.[371] [372]
* As of 2022, an additional 20 million people have enrolled in Medicaid as a result of the states’ expansions.[373]
* Among the 12 states that have not expanded Medicaid in accord with Obamacare:
* In 2013, Democratic President Barack Obama stated that expanding Medicaid will reduce healthcare costs by reducing emergency room visits:
* In 2008, the state of Oregon began providing Medicaid coverage to thousands of people selected through a lottery from a pool of uninsured, low-income adults. Random selection methods like this allow researchers to directly measure of the effects of public policies.[376] In 2014, the journal Science published a study of about 25,000 people who participated in this lottery and lived in the most-populated area of Oregon. The study followed the new Medicaid recipients for about 18 months after the lottery and found they had:
* In 2016, the New England Journal of Medicine published a follow-up study to the one above. This study analyzed an additional year of data to determine if Medicaid recipients would make less use of emergency rooms over time. It found that their increased levels of emergency room visits did not decline.[379]
* In 1997, the 105th Congress and Democratic President Bill Clinton passed a law that created a Children’s Health Insurance Program (CHIP) to help states provide insurance to low-income children.[380] [381] [382] The bill passed with 84% of Republicans and 78% of Democrats voting for it.[383]
* In 2020, 9.1 million children were enrolled in CHIP during some point in the year.[384]
* The legislation that created CHIP states that the “purpose” of the program is to provide “child health assistance to uninsured, low-income children … under 19 years of age … whose family income is at or below 200 percent” of the federal poverty line.[385] In 2022, 200% of the federal poverty line for a family of four was $55,500.[386]
* In 2022, states had income eligibility limits for CHIP ranging from 185% of the federal poverty line ($51,338 for a family of four) in Idaho to 400% of the federal poverty line ($111,000 for a family of four) in New York.[387] [388]
* In 2022, the median income eligibility limit for CHIP was 255% of the federal poverty line or $70,763 for a family of four.[389] [390]
* Not all sources of household income are considered when determining eligibility for CHIP. For example, the income of the following household members is not counted unless they are legal parents or guardians of the child:
* Since 2014, the Affordable Care Act (a.k.a. Obamacare) has mandated that families can have unlimited financial assets and still be eligible for CHIP.[395] [396]
* From 1998 to 2020, the average annual inflation-adjusted CHIP spending for every person in the U.S. under the age of 18 increased from $9 to $303:

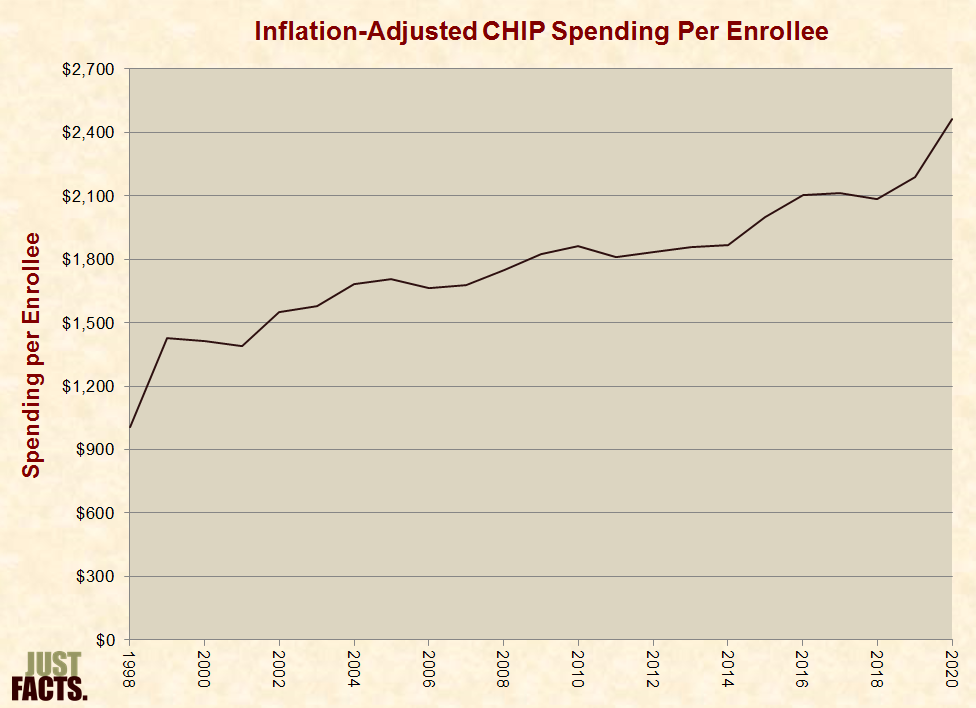
* From 1998 to 2020, the average annual inflation-adjusted CHIP spending per enrollee increased from $1,004 to $2,462:
* Like Medicaid, the federal and state governments share in the cost for CHIP, and states have latitude in setting eligibility criteria and deciding which healthcare services to cover.[399] The federal portion of CHIP funding varies by state, and before 2016, these rates ranged over time in different states from 65% to 81%.[400]
* During 2016–2019, the 2010 Affordable Care Act (a.k.a. Obamacare) raised the share of CHIP paid by the federal government by 23 percentage points per state, up to a maximum of 100%.[401] [402] Depending upon the state, the federal government paid from 88% to 100% of CHIP costs in 2019.[403]
* In 2020, the U.S. Congress and Republican President Donald Trump increased the federal government’s share of CHIP spending for the duration of the Covid-19 pandemic. Depending upon the state, the federal government paid from 69% to 89% of CHIP costs in 2022.[404] [405]
* In 2009, the U.S. Congress and Democratic President Barack Obama made legal immigrants immediately eligible for CHIP, overriding a previous requirement of a five-year waiting period.[406] This bill passed Congress with 99% of Democrats voting for it and 75% of Republicans voting against it.[407]
* In 2010, the 111th Congress and President Obama passed two laws that are collectively known as the “Affordable Care Act.” Formally, these bills were named the “Patient Protection and Affordable Care Act” and the “Health Care and Education Reconciliation Act.” Informally, these bills are known as “Obamacare.” The bills were passed separately for political and procedural reasons detailed in these footnotes.[408] [409]
* The bills passed Congress with 79–89% of Democrats voting for them and 99–100% of Republicans voting against them.[410] [411] Together, the bills contain about 1,000 pages.[412] [413]
* The Affordable Care Act:
* During the debate over the Affordable Care Act, Republicans proposed more than a hundred amendments to the legislation, most of which were rejected by the Democrats, who were in the majority at the time.[511] Examples of rejected amendments include:
* Between 2008 and 2013, Barack Obama promised at least 39 times that everyone who liked their health insurance could keep it under Obamacare. He also pledged at least 11 times that everyone who liked their doctor could keep their doctor under Obamacare.[518] For example, he stated:
* When Obamacare’s health insurance mandates went into effect, all health insurance plans that did not meet criteria specified in the Affordable Care Act were cancelled. By the end of 2013, millions of people (precise number unknown) had received health insurance cancellation notices due to Obamacare.[520] [521] [522]
* Some of the people who lost their health insurance were eligible to purchase federally-subsidized insurance through the Obamacare exchanges.[523]
* A 2015 study by Avalere Health of insurance plans offered by Obamacare exchanges in the five states with the greatest enrollment found that:
* Some of the people who lost their health insurance because of Obamacare were eligible to enroll in Medicaid.[525]
* Per the 2011 Medicare Trustees Report, low Medicaid payment rates for healthcare services cause “access problems for Medicaid enrollees.”[526] [527]
* For a study published in the New England Journal of Medicine (2011), researchers posing as mothers called 273 specialty clinics in Cook County, Illinois (an urban area containing Chicago), to schedule appointments for “common health conditions requiring outpatient specialty care.” The researchers called each clinic twice: once while stating that their children were covered by Medicaid or the Children’s Health Insurance Program (CHIP), and the other while stating that their children were covered by private insurance. The study found that:
* During the 2008 presidential election campaign, Barack Obama promised at least 18 times that his healthcare plan would save families an average of $2,500 per year on insurance premiums.[529] For example, he stated:
* In the years surrounding the passage of the 2010 Affordable Care Act, inflation-adjusted premium increases for employer-provided family health insurance varied as follows:

* In 2010, Congress’s Joint Committee on Taxation and the U.S. Centers for Medicare and Medicaid Services projected that the following changes in federal spending and revenues would occur during 2010–2019 as a result of the Affordable Care Act. Most of this would occur beginning in 2014, when many provisions of the act were scheduled to take effect.[535]
|
Projected Federal Spending Changes From the Affordable Care Act, 2010–2019 |
|
|
Provision |
Increase (billions) |
|
Medicare Cuts |
–$575 |
|
Insurance Subsidies for Individuals |
$507 |
|
Medicaid Expansion |
$410 |
|
Insurance Subsidies for Small Businesses |
$31 |
|
CHIP Increased Funding |
$29 |
|
Other Medicaid and CHIP Provisions |
$28 |
|
Miscellaneous |
$8 |
|
Total |
$438 |
|
Projected Federal Revenue Changes From the Affordable Care Act, 2010–2019 |
|
|
Provision |
Increase |
|
Taxes and Fees |
$421 |
|
Fines on Individuals & Employers |
$120 |
|
CLASS Act (discussed below) |
$38 |
|
Total |
$579 |
* The totals above net to a $141 billion improvement in the federal government’s finances over 2010–2019.[539] [540] This assumed:
* As of November 2022, the Joint Committee on Taxation, U.S. Centers for Medicare & Medicaid Services, and Congressional Budget Office have not studied the Affordable Care Act’s actual impact on federal revenues or spending thus far.[569] Per the:
NOTE: When interpreting the facts in this section, it is important to realize that association does not prove causation, and it is often difficult to determine causation in economics and other social sciences. This is because numerous variables might affect a certain outcome, and there is frequently no objective way to identify all of these factors and determine which is causing the others and to what degree.
* A 2016 study by the U.S. Department of Health & Human Services found that Obamacare “resulted in gains in health insurance coverage for 20.0 million nonelderly adults (ages 18 to 64).”[572]
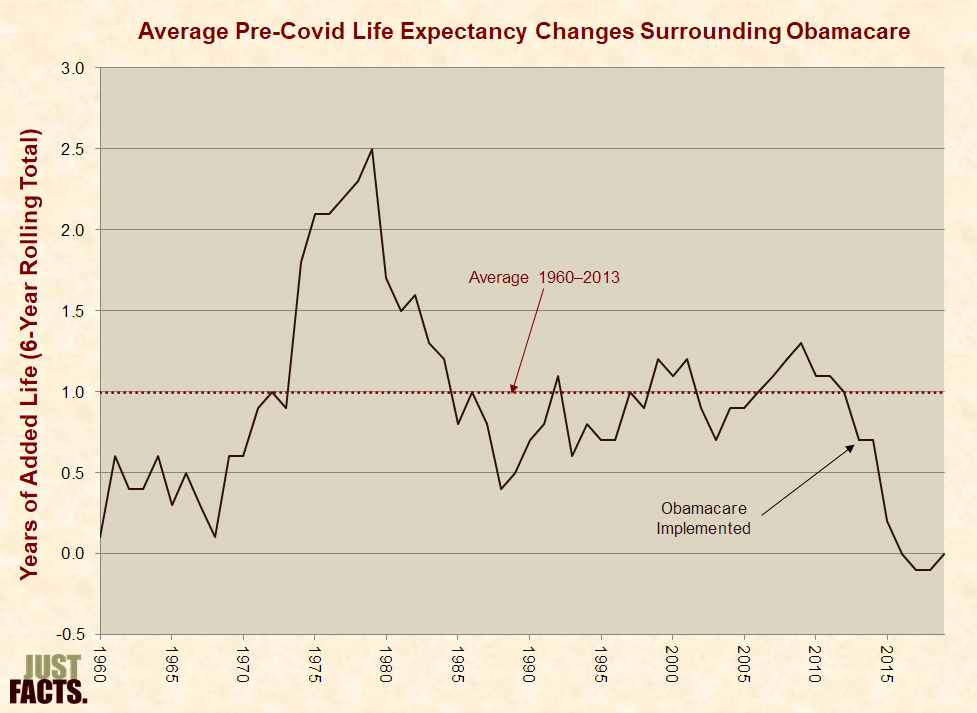
* The following proponents of Obamacare linked insurance coverage and life expectancy to promote the law and criticize the U.S. healthcare system:
* In the U.S. from 1960 until most provisions of Obamacare were implemented in 2014, the average life expectancy rose by an average of 1.0 years every six years. In the ensuing six years of Obamacare implementation (2014–2019) prior to the Covid-19 pandemic,[577] average life expectancy had a net change of zero:
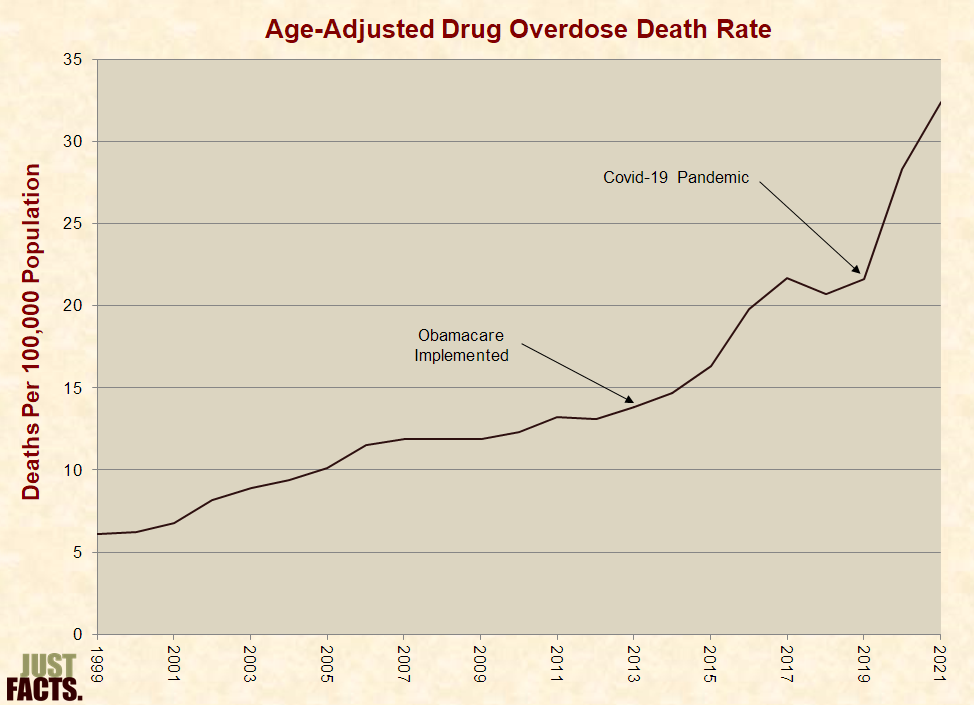
* Since the outset of 2014, the Affordable Care Act has required all new and renewed health insurance plans to cover treatment for substance abuse.[580] [581] [582] [583] [584] Obamacare supporters claimed that this mandate:
* From the start of Obamacare’s substance abuse coverage mandate in 2014 until just before the Covid-19 pandemic began six years later,[588] [589] the drug overdose death rate rose 4.1 times faster than in the six years prior to the mandate:
* In 2009, the American Journal of Public Health published a study that “analyzed the relationship between uninsurance and death.” Using survey data for 1988–1994 on 9,000 adults, the authors compared mortality rates at the end of the year 2000 between uninsured and privately insured participants. After controlling for 11 factors (such as age, gender, income, education, and body mass index), its authors concluded that “lack of health insurance is associated with as many as 44,789 deaths per year in the United States….”[594] The authors also:
* In 2009, Health Services Research published a study on the relationship between lack of insurance and risk of death. Using survey data for 1986–2000 on 643,000 people collected by the National Center for Health Statistics, the author compared mortality rates as of 2002 between the uninsured and privately insured participants. After controlling for 17 factors (such as age, gender, income, education, and body mass index), the author concluded that “there is little evidence to suggest extending insurance coverage to all adults would have a large effect on the number of deaths in the United States.”[617] [618] The study was similar to the above study from 2009 except that it:
* In a paper published by Annals of Family Medicine in 2019, the authors conducted a meta-analysis of studies that examined associations between healthcare and health outcomes.[626] They found that:
* Other than healthcare, factors that can affect mortality rates and life expectancy include:
* In September 2011:
* None of the above-cited articles or editorials mentioned the following facts, which are contained in the Census Bureau survey they cited:
* A study that cross-checked respondents from the above-referenced survey with data from the Centers for Medicare and Medicaid Services found that in 2005, about 18% of the “uninsured” in the survey actually had insurance through Medicaid.[646] [647]
* From 2007 through 2020, the annual portion of total private health insurance company revenues paid out in healthcare benefits for customers ranged from 86.9% to 89.2%.[648] [649] The remainder went to profits, taxes on premiums, and administrative expenses such as employee salaries and benefits, office space and furniture, computers, utilities, property taxes and insurance, sales commissions, advertising, legal fees, and audit fees.[650] [651] [652]
* From 2007 through 2010 (later data not available), the annual median net profit margin for the ten largest health insurance/managed care companies ranged from 2.1% to 4.4%. Throughout this period, the highest profit made by any of these companies in any year was 7.3%.
|
Net Profit Margins of the Ten Largest Health Insurance/Managed Care Companies |
|||
|
Year |
Median |
High |
Low |
|
2007 |
4.4% |
6.6% |
1.4% |
|
2008 |
2.1% |
4.5% |
–1.1% |
|
2009 |
3.1% |
7.3% |
–0.3% |
|
2010 |
4.2% |
6.3% |
–1.0% |
* In 2009, CNN uncritically reported the following statement from U.S. Senate Majority Leader Harry Reid:
* In 2008 (later data not available), the health insurance/managed care industry had a 2.2% net profit margin, which ranked 35th out of 53 top industries. The industry with the highest profit margin was network/communications equipment, which had a 20.4% profit margin.[657] [658]
* EBITDA or “earnings before interest, taxes, depreciation and amortization,” is “an important standard measure” of company and industry profitability.[659] [660] [661]
* In 2009, the average EBITDA margin for health insurance/managed care companies in the S&P 500 was 8%. For various other industries in the S&P 500, the margins were as follows:
|
Industry |
2009 EBITDA Margin |
|
Auto Parts & Equipment |
5% |
|
Automobile Manufacturers |
7% |
|
Advertising |
12% |
|
Retail Apparel |
14% |
|
Publishing |
18% |
|
Brewers |
19% |
|
Information Technology |
22% |
|
Movies & Entertainment |
28% |
|
Healthcare Equipment |
30% |
|
Telecom Services |
33% |
|
Pharmaceuticals |
33% |
|
Systems Software |
41% |
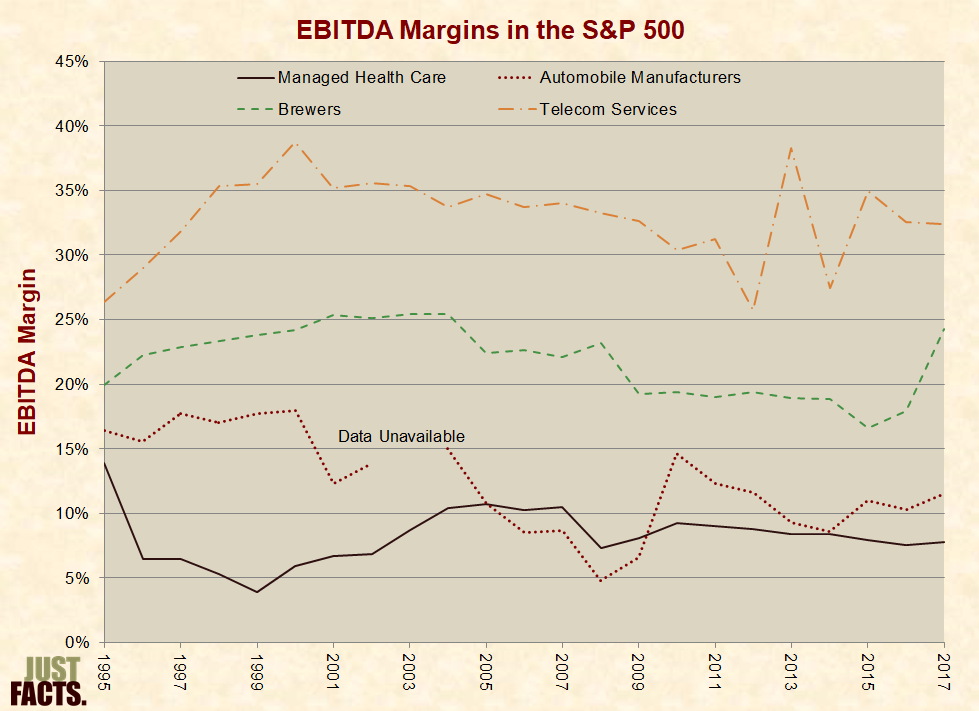
* From 1995 through 2017, the following industries (and others) in the S&P 500 had continually higher EBITDA margins than the health insurance/managed care industry:
* In 2009, the following exchange occurred on NBC:
Chris Matthews (MSNBC host):
Katty Kay (BBC’s Washington correspondent):
* In the last quarter of 2011 (earlier data not available), health insurance companies had a 4.5% quarterly net profit margin, as compared to 6.9% for electric utilities, 8.2% for gas utilities, and 12.0% for water utilities.[667] EBITDA margins for utilities are not available.[668]
* In 2010 on NPR’s All Things Considered, reporter Julie Rovner stated:
* In 2010, the average EBITDA margin for health insurance/managed care companies in the S&P 500 was 15% higher than automakers, 52% lower than brewers, and 69% lower than telecom companies:
* In 2011, the New York Times published a story by Reid Abelson stating:
* In the last quarter of 2011 (full-year data not available), health insurance companies had a 4.5% quarterly net profit margin, as compared to 2.9% for the New York Times Company,[673] 5.2% for music & video stores, 9.7% for toys & games, 14.0% for wireless communications, and 53.1% for periodical publishers.[674]
* In 2011, the average EBITDA margin for health insurance/managed care companies in the S&P 500 was 7% higher than auto parts & equipment, 59% lower than publishing, and 74% lower than pharmaceuticals:

* The facts in this section pertain to countries that are members of the Organization for Economic Cooperation and Development (OECD). This is a group of 38 mostly developed nations like Australia, Canada, Germany, Japan, and the United States. [677] [678]
* Per the Handbook of Health Economics, “results obtained with international comparisons should be treated with considerable caution.” The significance of such comparisons is limited by:
* A product or service is a luxury good if people spend a larger portion of their budget on it when their income increases.[682]
* Comparisons of developed countries show that healthcare is a luxury good: as national income increases, generally so does the portion of the economy spent on healthcare.[683] [684] [685] [686]
* Two common measures of nations’ wealth are:
* Among OECD nations, higher disposable income is generally associated with a greater portion of GDP spent on healthcare. In 2020, the U.S. had the highest average disposable income in the OECD and spent 19% of its economy on healthcare.[692]
* The relatively high healthcare spending in the U.S. may result from higher prices, but direct price comparisons are limited by a lack of comparable data. A 2018 study published by the Journal of the American Medical Association found that:
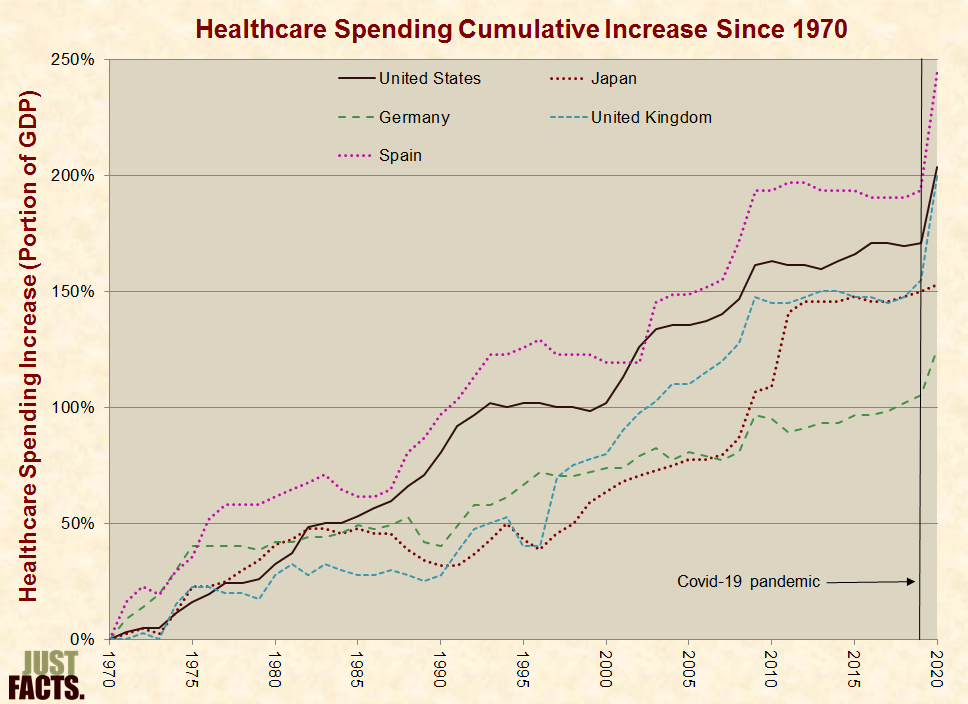
* From 1970 to 2020, healthcare spending as a portion of GDP in the 10 most-populated OECD countries grew as follows:
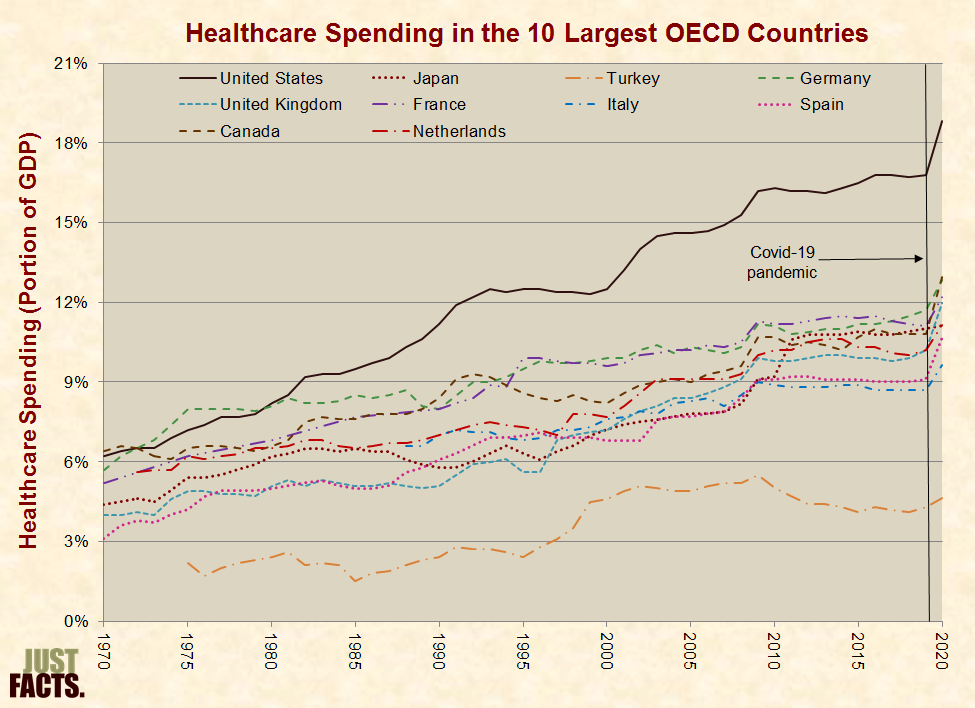
* From 1970 to 2020, healthcare spending as a portion of GDP rose by 203% in the United States. In the next four most-populated OECD countries with data available during that period, healthcare spending rose by 102% to 246%:
* Several factors can affect the quantity, quality, and appropriateness of the healthcare that people receive, including but not limited to:
* Rationing is a process of deliberately reducing people’s healthcare use to save money or restrict use of limited supplies.[706] [707] [708] [709] Some considerations that lead to rationing include but are not limited to:
* Rationing can include but is not limited to:
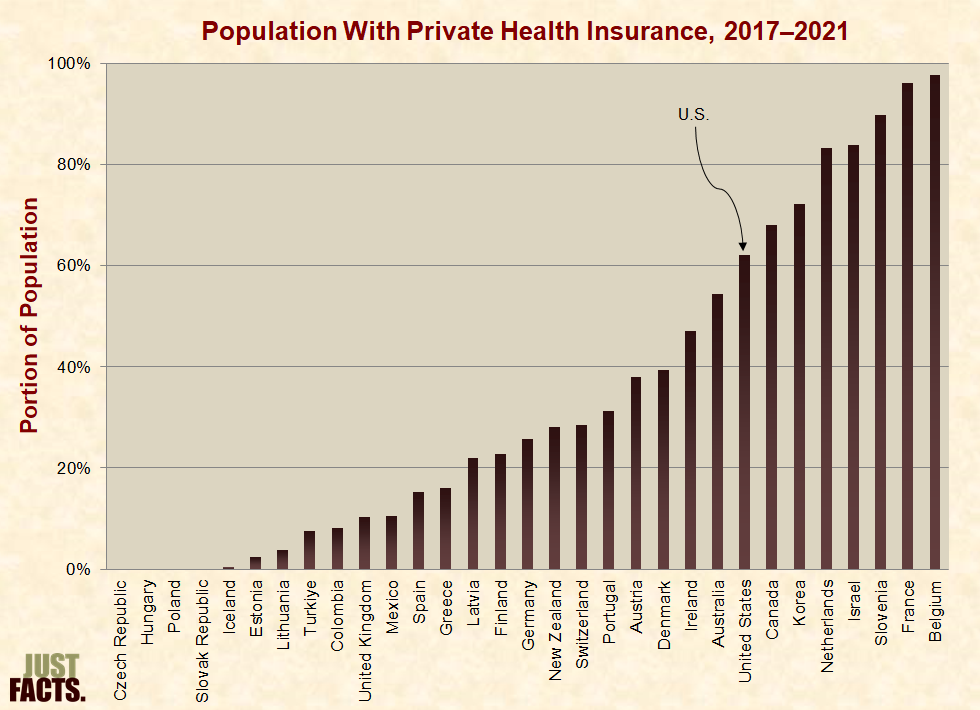
* In order to avoid the effects of rationing in their public or private insurance plan, some people purchase additional policies that:
* The portion of people with private health insurance in the OECD ranges from 98% in Belgium to 0% in the Czech Republic, Hungary, Poland, and the Slovak Republic:
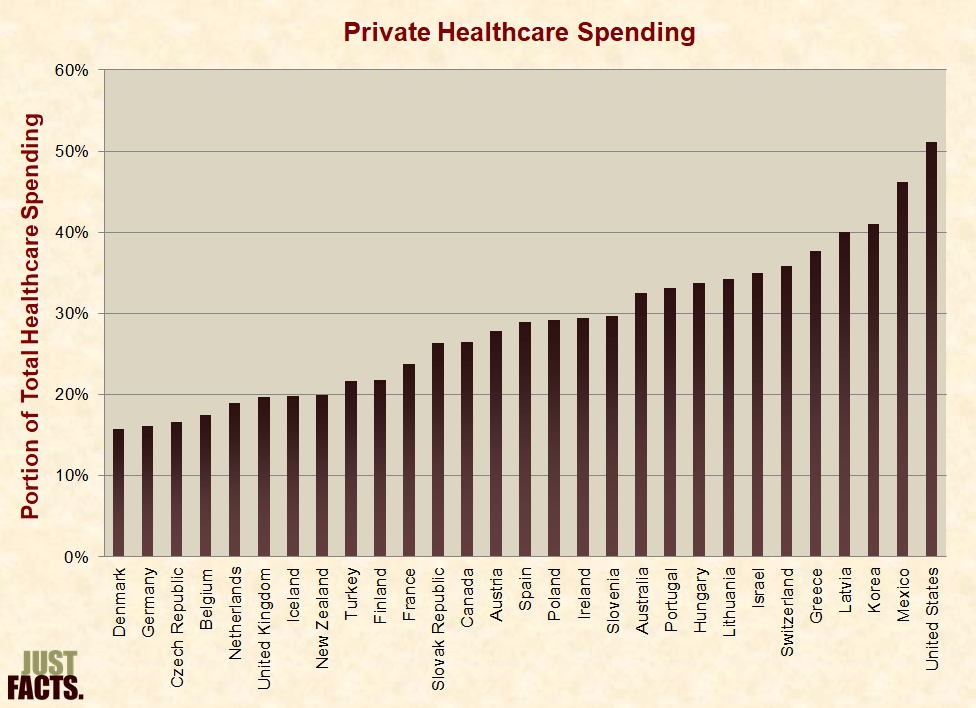
* In 2013, before Obamacare required most Americans to have health insurance or pay a fine, the U.S. led the OECD in the portion of all healthcare spending not provided or mandated by the government:
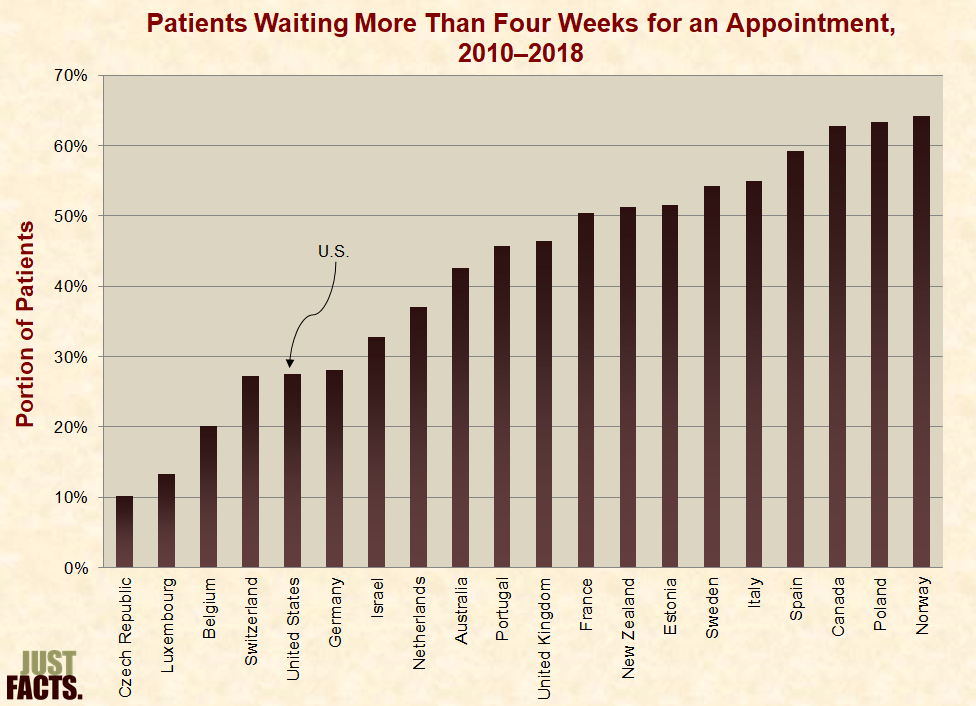
* Long wait times for health services can cause increased pain and disability, worse medical outcomes, and lost wages.[756] [757]
* According to survey data from 2010 to 2018,[758] the portion of patients who wait more than four weeks to get an appointment with a specialist ranges from 10% in the Czech Republic to 64% in Norway:
* Some contributing factors and outcomes of wait times in developed countries include:[761]
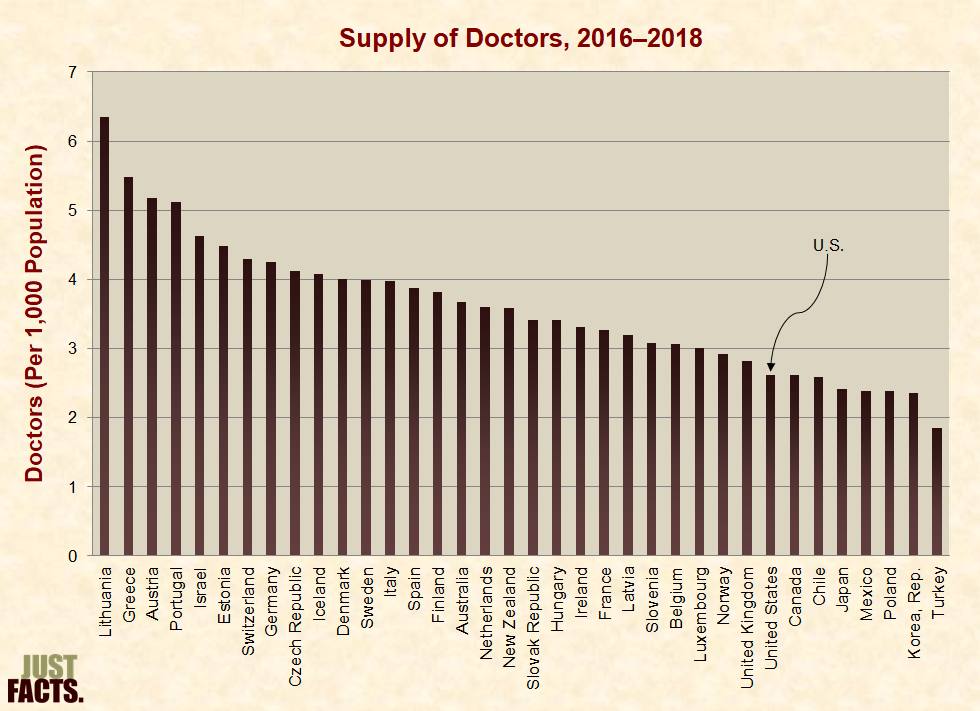
* The World Health Organization identifies human resources as the most important—and often the most costly—aspect of healthcare.[774]
* The staff of medical professionals in OECD nations ranges from 1.8 to 6.4 doctors per 1,000 people. The United States has 2.6 doctors per 1,000 people, which is fewer than the OECD’s median of 3.5 and average of 3.6:
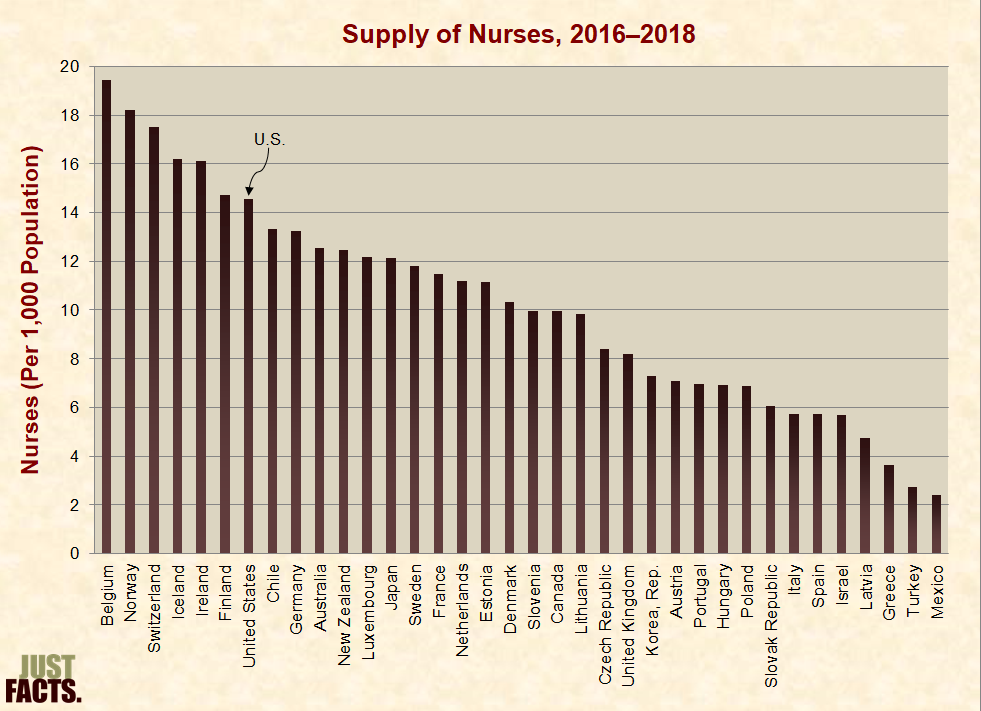
* The staff of medical professionals in OECD countries ranges from 2.4 to 19.5 nurses per 1,000 people. The United States has 14.5 nurses per 1,000 people, which is more than the OECD’s median of 10.1 and average of 10.2:
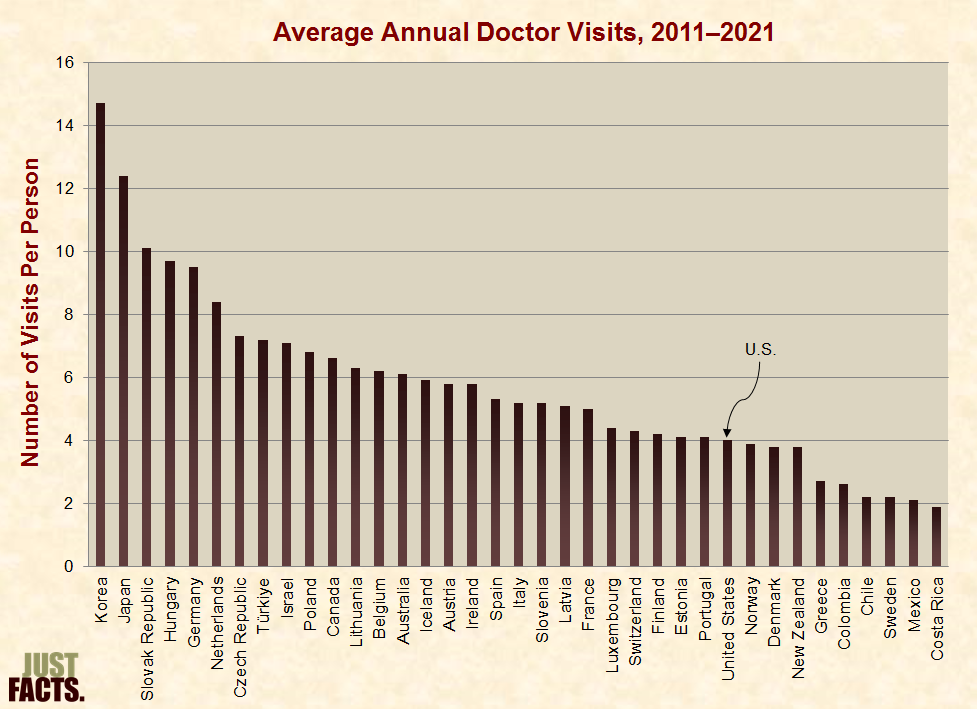
* The frequency of doctor visits differs between developed nations for various reasons, including but not limited to:
* In OECD nations, people visit a doctor in person an average of 5.8 times per year, with a median of 5.3 times. Americans visit a doctor about 4 times per year:
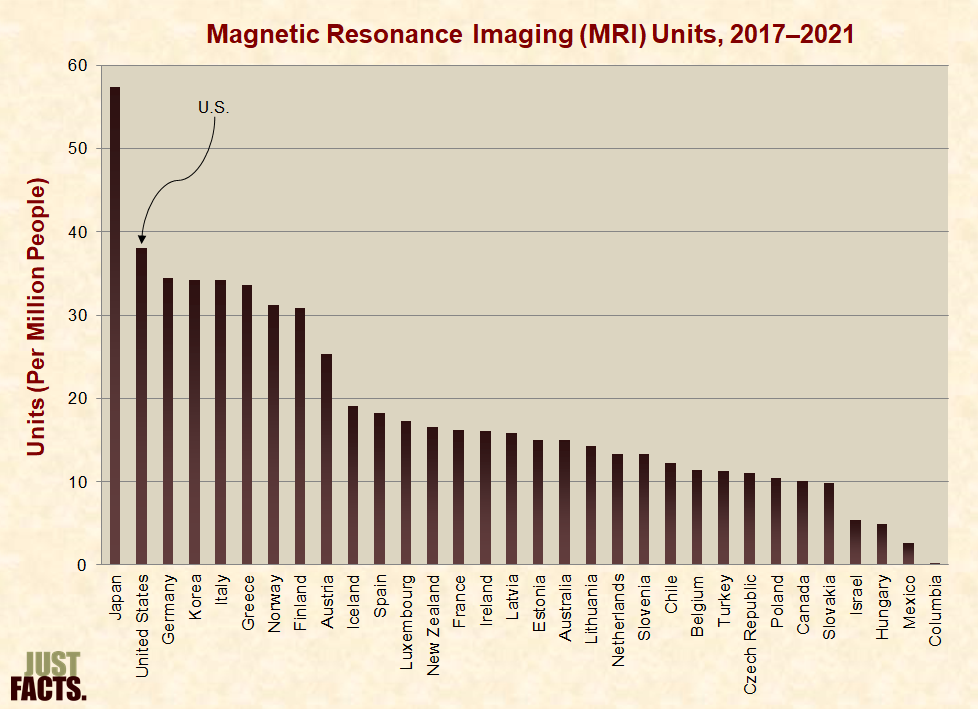
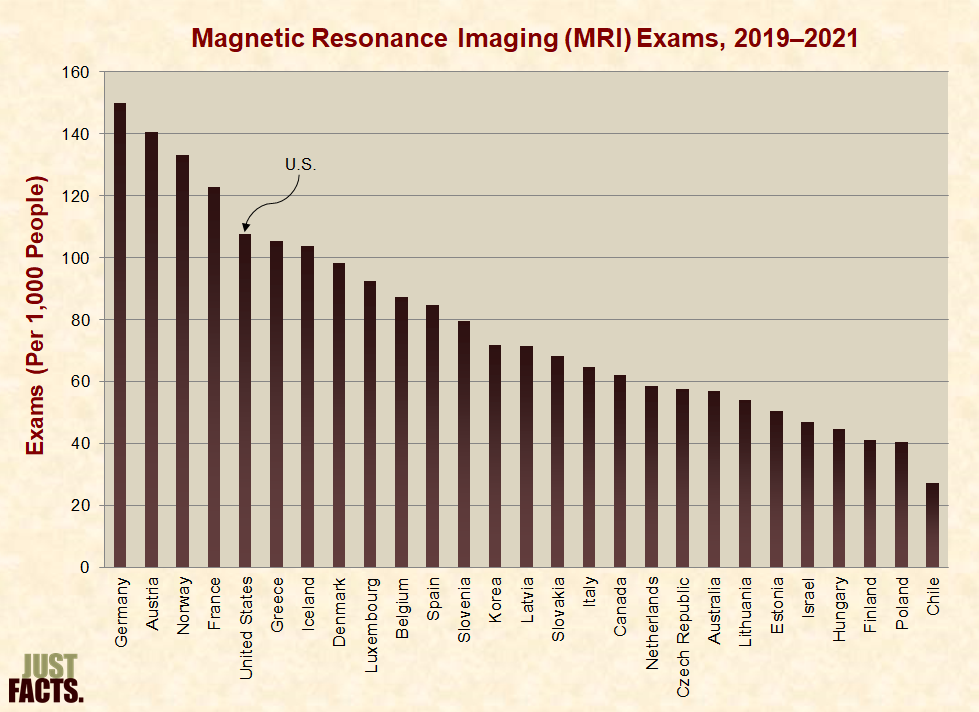
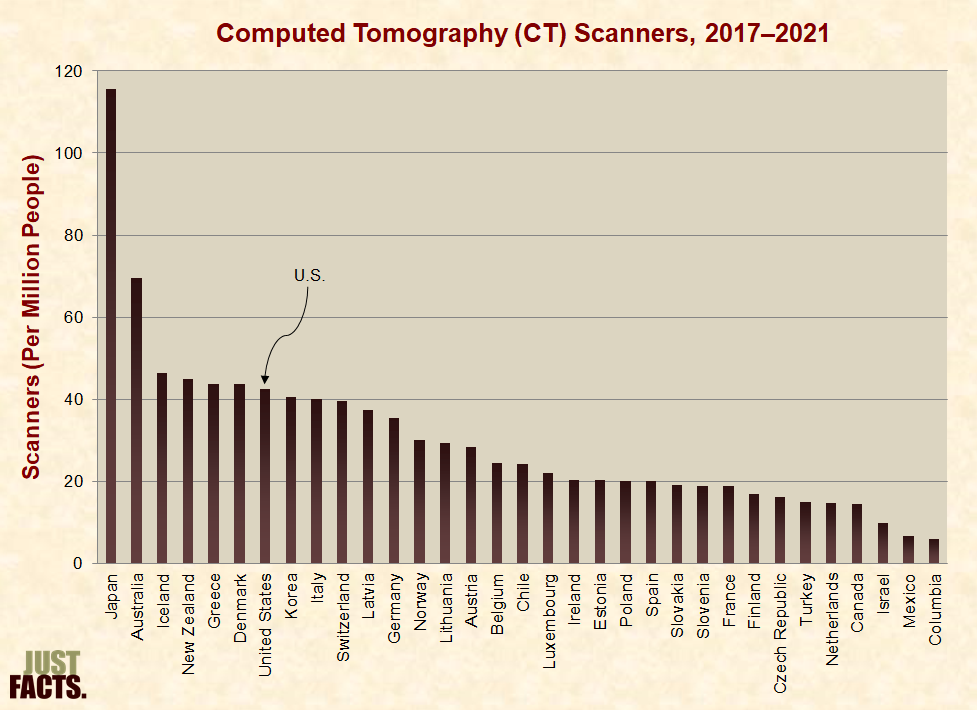
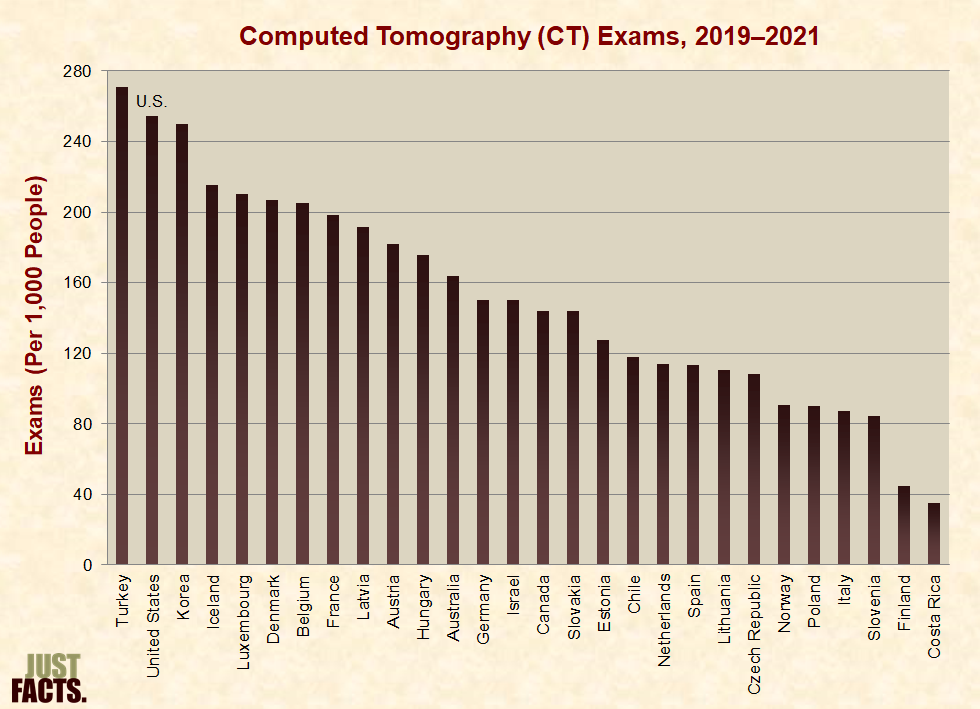
* Medical technologies such as Magnetic Resonance Imaging (MRI) and Computed Tomography (CT) are important for properly diagnosing diseases in order to improve the efficiency of treatments and reduce unnecessary procedures.[791] [792] [793] [794] [795] The OECD does not have guidelines for the ideal number of MRI units or CT scanners. Too few units could lead to long wait times, and too many units could lead to overuse.[796]
* The following four charts show the number and use of MRI units and CT scanners in OECD countries. The United States has more of these units and performs more of these exams than the average and median for the OECD:
* Certain cancer screenings can contribute to earlier diagnoses and more effective treatment. The World Health Organization recommends breast cancer screening for women aged 50–69.[801] [802] [803] In the OECD, screening rates for this target group range from 31% to 90% with a median of 74%:

* Per the textbook Neuropsychopharmacology: The Fifth Generation of Progress:
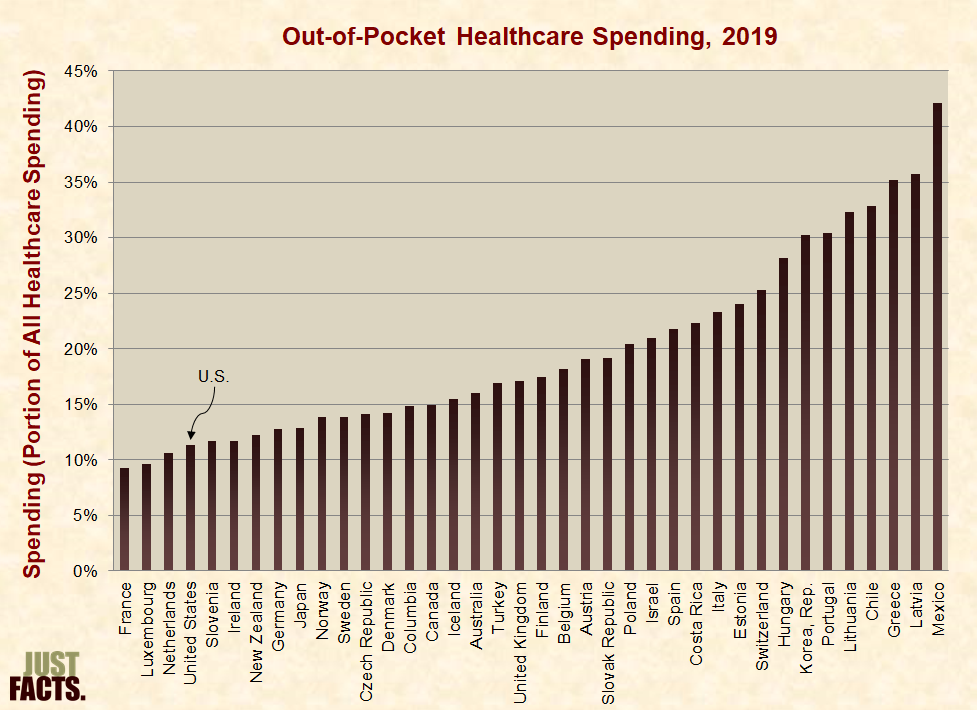
* The portion of medical expenses that patients pay out of pocket affects their use of healthcare services. The OECD states:
* In the majority of OECD countries, 100% of the population has health insurance. In the United States, approximately 90% of the population has health insurance. Mexico has the lowest insured rate with 72%.[809] [810] [811]
* Among OECD countries, the portion of healthcare expenditures that households pay out of pocket ranges from 9% in France to 42% in Mexico, with an average of 20% and a median of 17%. In the United States, households pay 11% of all healthcare expenditures:
* Cost control through rationing can prevent doctors from recommending medical care,[813] [814] and patients may forgo recommended treatment if their share of the cost is too high or if they think a doctor recommended a test or procedure only to protect against a lawsuit.[815] [816] [817]
* According to the most recent survey data (collected during 2010–2018),[818] [819] [820] the portion of patients who skip recommended medical care due to cost ranges from about 1% in Poland to about 20% in the U.S.:
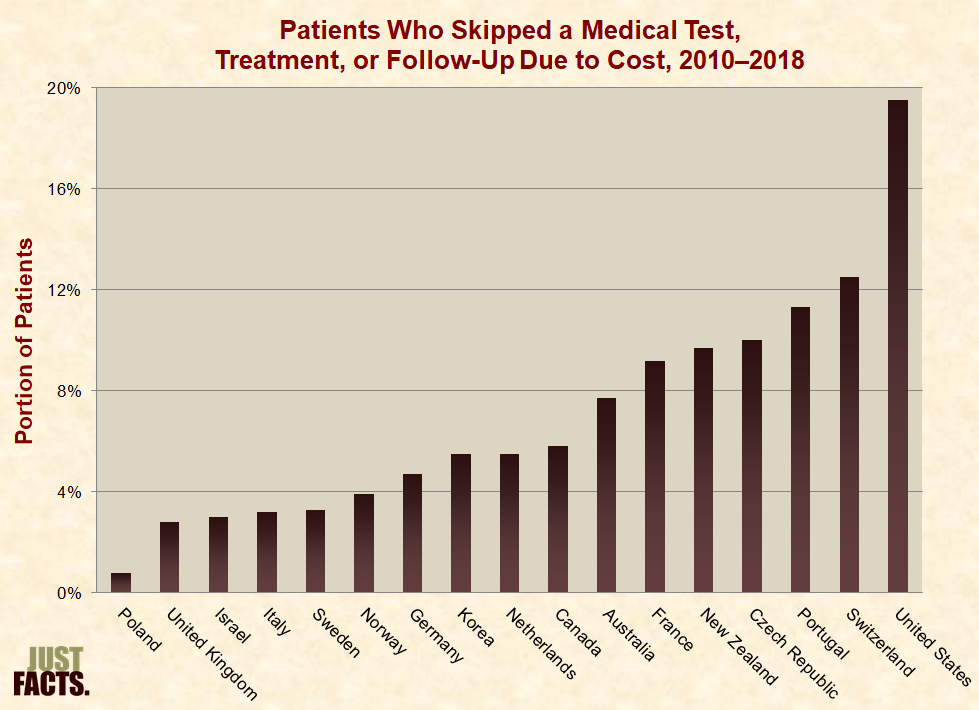
* When patients pay a lower (or no) portion of their medical expenses out of pocket, they use more healthcare services. This is called the moral hazard effect, and it was demonstrated in two randomized health insurance experiments:[823] [824]
* Government-run health systems and private insurance companies sometimes use rationing to limit overutilization from the moral hazard effect.[829]
* Healthcare outcomes measure if medical care improves patient health. These are not the same as health outcomes, which also reflect a range of non-medical factors.[830] [831]
* Cancer survival rates reflect how effectively healthcare systems provide early detection and treatment.[832] [833] The United States has higher cancer survival rates than the average and median of OECD countries for three out of four common types of cancer:
|
Five-Year Cancer Survival Rates, 2010–2014 |
|||
|
Cancer |
OECD Average |
OECD Median |
United States |
|
Breast |
85% |
86% |
90% |
|
Cervical |
66% |
66% |
63% |
|
Colon |
62% |
64% |
65% |
|
Rectal |
61% |
63% |
64% |
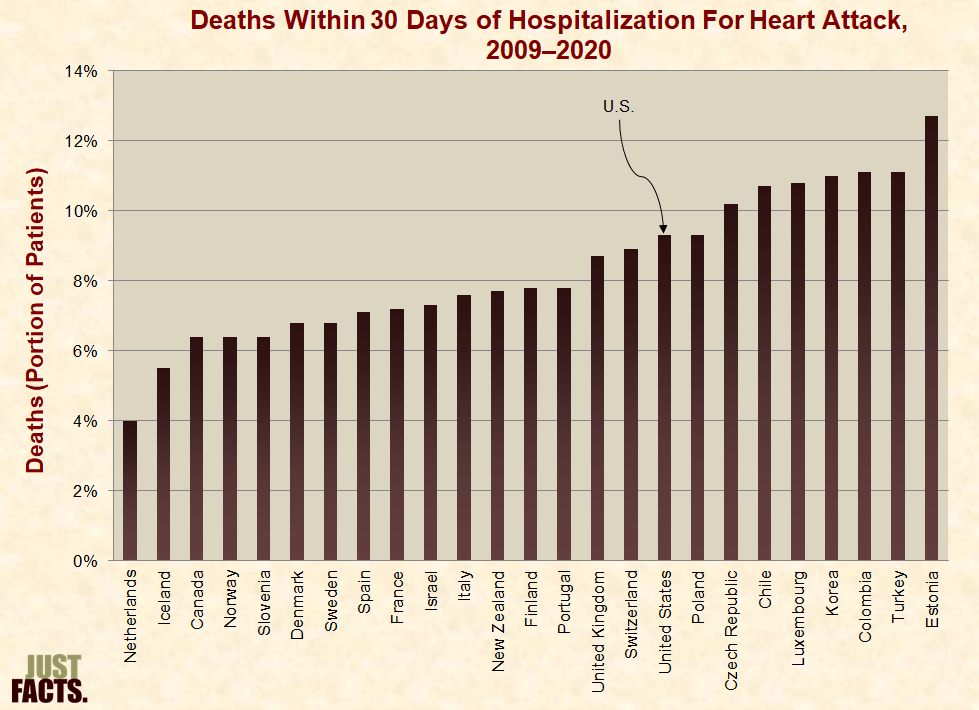
* Per the OECD, measuring the mortality rate of patients hospitalized for a heart attack is a “good indicator of acute care quality” because it “reflects the processes of care, such as timely transport of patients and effective medical interventions.”[836] [837]
* In the United States, about 9% of patients hospitalized for a heart attack die within 30 days, which is also the median for OECD countries:
* Per the OECD, health outcomes, as opposed to healthcare outcomes, are “not only related to health spending and the performance of health systems, but also to a wide range of non-medical determinants of health.”[839] [840]
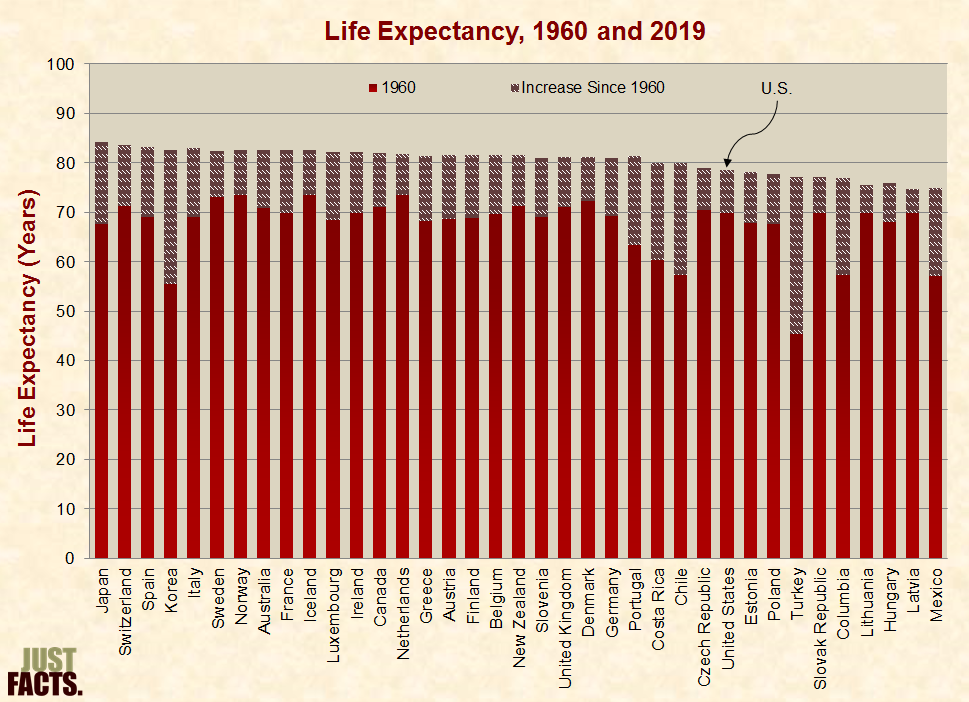
* Besides healthcare, other factors that can affect life expectancy include but are not limited to:
* When comparing health outcomes in the United States to those of other countries, a 2019 paper in the Journal of the American Medical Association explains that:
* From 1960 to 2019, OECD nations gained between five and 32 years of life expectancy. In 2019, prior to the outset of the Covid-19 pandemic,[846] life expectancy ranged from 75 to 84 years, with an average of 81 and a median of 82:
* Most non-communicable diseases are linked to tobacco use, physical inactivity, unhealthy diet, or alcohol overuse.[848] [849] Among people in OECD countries:
* In the United States, the death rate from non-health causes (like accidents, suicides, and assaults) is 78% higher than the average for developed countries.[854]
* Infant mortality rates can vary between countries because of differences in birth registration practices. For example, some countries use a minimum weight or gestational age to define a live birth.[855] [856] [857] Based on data that only includes births at or after 22 weeks of gestation or weighing at least 500 grams, the infant mortality rate in the U.S. is the fifth highest in the OECD:
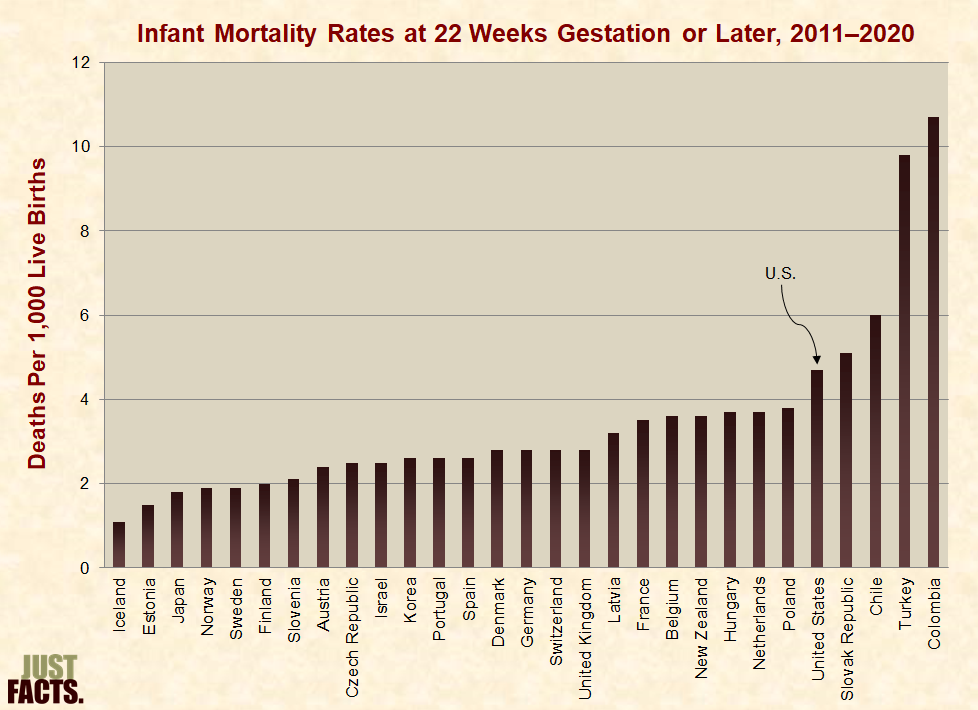
* Besides healthcare, other factors that can affect infant mortality rates include but are not limited to:
[1] Calculated with data from:
a) Dataset: “National Health Expenditures by Type of Service and Source of Funds: Calendar Years 1960 to 2020.” U.S. Department of Health & Human Services, Centers for Medicare and Medicaid Services, December 1, 2021. <www.cms.gov>
b) Dataset: “CPI—All Urban Consumers (Current Series).” U.S. Department of Labor, Bureau of Labor Statistics. Accessed March 5, 2021 at <www.bls.gov>
“Series Id: CUUR0000SA0; Series Title: All Items in U.S. City Average, All Urban Consumers, Not Seasonally Adjusted; Area: U.S. City Average; Item: All Items; Base Period: 1982–84=100”
c) Dataset: “Table 1.1.5: Gross Domestic Product [Billions of Dollars].” United States Department of Commerce, Bureau of Economic Analysis. Last revised February 25, 2021. <www.bea.gov>
Line 1: “Gross Domestic Product”
d) Dataset: “Table 7.1. Selected Per Capita Product and Income Series in Current and Chained Dollars.” U.S. Department of Commerce, Bureau of Economic Analysis. Last revised February 25, 2021. <www.bea.gov>
Line 18: “Population (Midperiod, Thousands)”
NOTE: An Excel file containing the data and calculations is available upon request.
[2] Calculated with data from:
a) Dataset: “National Health Expenditures by Type of Service and Source of Funds: Calendar Years 1960 to 2020.” U.S. Department of Health & Human Services, Centers for Medicare and Medicaid Services, December 1, 2021. <www.cms.gov>
b) Dataset: “Table 1.1.5: Gross Domestic Product (Billions of Dollars).” United States Department of Commerce, Bureau of Economic Analysis. Last revised February 25, 2021. <www.bea.gov>
Line 1: “Gross Domestic Product”
NOTE: An Excel file containing the data and calculations is available upon request.
[3] Receipt: Christ Hospital, 176 Palisade Avenue, Jersey City, NJ, 1942.
|
Service |
Price ($) |
|
Hospital room ($7.00 per day) |
70.00 |
|
Operating Room Fee (Baby circumcision) |
5.00 |
|
Laboratory Fee |
1.00 |
|
Maternity Room |
15.00 |
|
Care of Baby |
7.50 |
|
Total |
98.50 |
|
Special Allowance |
–33.50 |
|
Balance |
65.00 |
NOTE: Just Facts has examined the original receipt and has a scanned copy of it, but we are not publishing this image because it contains personal information.
[4] Webpage: “CPI Inflation Calculator.” Bureau of Labor Statistics. Accessed October 12, 2011 at <www.bls.gov>
“$7.00 in 1942 has the same buying power as $97.29 in 2011”
[5] Email from Christ Hospital, 176 Palisade Avenue, Jersey City, NJ, September 23, 2011.
For a normal vaginal delivery (limit of 2 days) the fee for the hospital service will be $4000.00. Any additional days over the normal 2 day stay will incur a charge of $1360.00 per day.
For a cesarean section delivery (limit of 4 days) the fee for the hospital service will be $5565.00. Any additional days over the normal 4 day stay will incur a charge of $1360.00 per day.
This quoted price is for a standard Vaginal Delivery/Cesarean Section and normal newborn birth barring any unforeseen complications which could add to this billable amount.
* This amount is payable in full prior to discharge.
* A $500.00 deposit is required at time of pre-registration.
* Patient Access staff will flag your account when they obtain your demographic information in order to insure a smooth admission process.
* The above amounts do not include physician fees, anesthesia, or any other professional component.
[6] Ohio Revised Code, Title 37, Chapter 3727, Section 3727.42: “Price Information List.” Ohio General Assembly. Accessed November 7, 2022 at <law.justia.com>
Effective: September 10, 2012 …
(A) Every hospital shall compile and make available for inspection by the public a price information list containing the information specified in division (B) of this section and shall periodically update the list to maintain current information. The price information list shall be compiled and made available in a format that complies with the electronic transaction standards and code sets adopted by the United States secretary of health and human services under 42 U.S.C. 1320d-2.
(B) Each price information list required by division (A) of this section shall contain all of the following information:
(1) The usual and customary room and board charges for each level of care within the hospital, including but not limited to private rooms, semiprivate rooms, other multiple patient rooms, and intensive care and other specialty units;
(2) Rates charged for nursing care, if the hospital charges separately for nursing care;
(3) The usual and customary charges, stated separately for inpatients and outpatients if different charges are imposed, for any of the following services provided by the hospital:
(a) The thirty most common x-ray and radiological procedures;
(b) The thirty most common laboratory procedures;
(c) Emergency room services;
(d) Operating room services;
(e) Delivery room services;
(f) Physical, occupational, and pulmonary therapy services;
(g) Any other services designated as high volume services by a rule which shall be adopted by the director of health.
(4) The hospital’s billing policies, including whether the hospital charges interest on an amount not paid in full by any person or government entity and the interest rate charged;
(5) Whether or not the charges listed include fees for the services of hospital-based anesthesiologists, radiologists, pathologists, and emergency room physicians and, if a charge does not include such fees, how such fee information can be obtained.
(C) Every hospital shall do all of the following with the price information list required by this section:
(1) At the time of admission, or as soon as practical thereafter, inform each patient of the availability of the list and on request provide the patient with a free copy of the list;
(2) On request, provide a paper copy of the list to any person or governmental agency, subject to payment of a reasonable fee for copying and processing;
(3) Make the list available free of charge on the hospital’s internet web site.
[7]
|
Hospital |
Price |
Type of Room |
|
$1,905 |
Semi-private |
|
|
$2,040 |
Routine care |
|
|
$2,828 |
Semi-private |
|
|
$2,166 |
Medical/surgical (no option for routine care or semi-private) |
|
|
$3,675 |
Medical/surgical private (no option for routine care or semi-private) |
|
|
$3,582 |
Medical/surgical (no option for routine care or semi-private) |
|
|
$1,849 |
Semi-private medical/surgical |
|
|
$1,659 |
Medical/surgical |
|
|
$2,246 |
Semi-private |
|
|
$2,460 |
Semi-private |
|
|
$1,894 |
Semi-private medical/surgical |
|
|
$1,155 |
Private |
|
|
$3,108 |
Private or semi-private |
|
|
$3,675 |
Medical/surgical (private or semi-private) |
|
|
$1,622 |
Private |
|
|
Average† |
$2,391 |
|
|
Median† |
$2,166 |
NOTES:
[8] Article: “70% Rise in Hospital Room Costs Since 1980.” Associated Press, November 5, 1986. <www.nytimes.com>
“The average daily cost of hospital rooms jumped nearly 70 percent over the last five years, from $127 in 1980, according to statistics published by the Census Bureau. The figures were drawn from data compiled by the Health Insurance Association of America and the American Hospital Association.”
NOTE: Just Facts searched the websites of the Census Bureau, Health Insurance Association of America [now America’s Health Insurance Plans], and the American Hospital Association for up-to-date data on the average price of hospital rooms, but we were unable to find such information. Just Facts also contacted the American Hospital Association, which was unable to provide any data beyond 2002. This data is cited in footnotes below.
[9] Webpage: “CPI Inflation Calculator.” Bureau of Labor Statistics. Accessed November 7, 2022 at <www.bls.gov>
“$127.00 in January 1980 has the same buying power as $458.94 in January 2022”
[10] Book: Current Trends in Health Care and Dental Costs Utilization. Mutual of Omaha, 2003.
Page 2: “The data in Current Trends represents Mutual of Omaha’s group business, and is not necessarily representative of other population subgroups. The data is based upon the actual experience of our policyholders. The data does not necessarily represent a cross section of all providers. No efforts have been made to adjust for differences in case mix.”
Page 3: “The average room and board charges are for all types of rooms (medical/surgical, intensive care, obstetrical, etc.), and they include charges for nursing care for those facilities with separate room and board charges from nursing charges.”
[11] Book: Current Trends in Health Care Costs and Utilization. Mutual of Omaha, 1990.
Page 5: “Average Daily Charges for Room and Board … 1988 … National Average [=] $270.”
[12] Webpage: “CPI Inflation Calculator.” Bureau of Labor Statistics. Accessed November 7, 2022 at <www.bls.gov>
“$270 in January 1988 has the same buying power as $656.09 in January 2022”
[13] Book: Current Trends in Health Care and Dental Costs Utilization. Mutual of Omaha, 2003.
Page 5: “Average Daily Charges for Room and Board … 2002 … National Average [=] $748.”
[14] Webpage: “CPI Inflation Calculator.” Bureau of Labor Statistics. Accessed November 7, 2022 at <www.bls.gov>
“$748 in January 2002 has the same buying power as $1,187.46 in January 2022”
[15] Book: Practical Decision Making in Health Care Ethics: Cases and Concepts (3rd edition). By Raymond J. Devettere. Georgetown University Press, 2010.
Pages 459–460:
Thanks to Medicare, Medicaid, and the various other insurance programs, by the last third of the twentieth century most people in the United States were not paying for hospitals and doctors with their own money. They were covered by nonprofit insurance plans such as Blue Cross or Blue Shield, commercial (for profit) insurance plans, or the government plans. All these plans became known as third-party payers. The phrase third-party payer means someone other than the patient (first party) or the providers (the second party—doctors, hospitals, pharmacies, etc.) is paying for medical care.
[16] Calculated with the dataset: “National Health Expenditures by Type of Service and Source of Funds: Calendar Years 1960 to 2020.” U.S. Department of Health & Human Services, Centers for Medicare and Medicaid Services, December 1, 2021. <www.cms.gov>
NOTE: An Excel file containing the data and calculations is available upon request.
[17] Article: “Scientific Survey Shows Voters Widely Accept Misinformation Spread By the Media.” By James D. Agresti. Just Facts, January 2, 2020. <www.justfacts.com>
The findings are from a nationally representative annual survey commissioned by Just Facts, a non-profit research and educational institute. The survey was conducted by Triton Polling & Research, an academic research firm that used sound methodologies to assess U.S. residents who regularly vote. …
The survey was conducted by Triton Polling & Research, an academic research firm that serves scholars, corporations, and political campaigns. The responses were obtained through live telephone surveys of 700 likely voters across the U.S. during December 2–11, 2019. This sample size is large enough to accurately represent the U.S. population. Likely voters are people who say they vote “every time there is an opportunity” or in “most” elections.
The margin of sampling error for the total pool of respondents is ±4% with at least 95% confidence. The margins of error for the subsets are 6% for Democrat voters, 6% for Trump voters, 5% for males, 5% for females, 12% for 18 to 34 year olds, 5% for 35 to 64 year olds, and 6% for 65+ year olds.
The survey results presented in this article are slightly weighted to match the ages and genders of likely voters. The political parties and geographic locations of the survey respondents almost precisely match the population of likely voters. Thus, there is no need for weighting based upon these variables.
NOTE: For facts about what constitutes a scientific survey and the factors that impact their accuracy, visit Just Facts’ research on Deconstructing Polls & Surveys.
[18] Dataset: “Just Facts 2019 U.S. Nationwide Survey.” Just Facts, December 2019. <www.justfacts.com>
Page 5:
Q22: In 1960, governments paid for 24% of all healthcare costs in the U.S. Do you think governments now pay a greater portion or a lesser portion of all healthcare costs in the U.S.?
Greater [=] 56.6%
Lesser [=] 38.0%
Unsure [=] 5.1%
[19] For facts about how surveys work and why some are accurate while others are not, click here.
[20] Article: “Nonprice Competition in Hospitals.” By John L. Mariotti. Encyclopedia of Health Care Management. Edited by Michael J. Stahl. Sage Publications, 2004.
Page 391: “In conclusion, because most medical care is delivered with third-party payments, and the purchaser is in dire need of the services, the typical patient has little interest in price. The result is that most medical care is bought on decision criteria other than price. Thus, nonprice competition seems to be the norm, not only in hospitals but also in a wide range of health and medical services.”
[21] Book: Practical Decision Making in Health Care Ethics: Cases and Concepts (3rd edition). By Raymond J. Devettere. Georgetown University Press, 2010.
Pages 459–460:
The shift from patient payment to third-party payment did not immediately disturb the basic FFS [fee-for-service] system. Providers of medical services—hospitals, physicians, pharmacies, and others—continued charging fees for their goods and services. The only major difference was that a party other than the patient or family paid the fees that were billed.
FFS Flaws
Two major structural flaws eventually undermined this combined FFS/third-party payment system. First, the third-party payers had no control over the extent or the cost of the services rendered. Patients decided when to seek treatment, physicians controlled what they would provide and, along with hospitals and pharmacies, what fees they would charge for their services. The third-party payers had no say in the services provided or the fees charged; they simply paid the bills.
The second structural flaw was the incredible built-in incentive for providers to raise their fees rapidly. In the FFS/third-party payer system, the government or the insurance company pays whatever fees are considered customary for the service or medicine. What determines a “customary” fee? Obviously a customary fee is a fee roughly the same as what other physicians, hospitals, and drug companies in the same geographical area are charging. Hence, the faster everyone raises their fees, the faster what is considered “customary” also rises. As long as patients and their families were paying the fees, physicians and hospitals tended to be sensitive to what they charged these people. But when the billing shifted to anonymous government and institutional payers—the third-party payers—it did not take long for everyone reimbursed by these third-party payers to begin to raise their fees rapidly, thereby raising the level of what was considered customary.
[22] Report: “Drug Industry: Profits, Research and Development Spending, and Merger and Acquisition Deals.” U.S. Government Accountability Office, November 17, 2017. <www.gao.gov>
Page 13:
According to economic experts, the usual mechanisms that enforce market discipline may not work in the same way in the health care market as they do in other markets. In most markets—automobiles, for example—consumers are expected to be conscious of the price of goods. If a company raises the price of its goods, consumers would likely purchase fewer goods, causing the company’s revenues to decline. However, in the health care market, the purchase of goods and services is largely influenced by health care providers, who may not be well-informed about, or incentivized to consider, the prices involved. In the case of drugs, some experts argue that marketing and advertising may further distort provider decision making. In addition, if the patients’ medical bills are largely paid by insurance plans (other than copayment or coinsurance costs), then patients’ demand may not be significantly influenced by changes in price to the extent that it might be in other markets where the consumers see and pay the bill themselves.
[23] Paper: “Some Interim Results From a Controlled Trial of Cost Sharing.” By Joseph P. Newhouse and others. Rand Corporation, January 1982. <www.rand.org>
Page iii: “[T]he first regular sample [of study participants] was enrolled in late 1974. Most participants have now completed their period of participation, and all will complete it by January 1982.”
Page v:
A total of 7706 participants in six cities have taken part in a controlled experiment related to cost sharing in health insurance policies. …
The families were assigned in an unbiased manner to insurance plans that covered a broad range of medical services but varied the coinsurance rate, i.e., the fraction of its medical bills that the family must pay. This out-of-pocket expenditure was subject to an upper limit of $1000 per year or 5, 10, or 15% of income, whichever was less.
Page 4: “A total of 2756 families, consisting of 7706 persons, have been enrolled in one of several different health insurance plans, 70 percent of them for 3 years and the rest for 5 years.”
[24] Calculated with data from the webpage: “CPI Inflation Calculator.” Bureau of Labor Statistics. Accessed November 7, 2022 at <www.bls.gov>
“$1,000 in January 1974 has the same buying power as $6,033.22 in January 2022”
“$1,000 in January 1982 has the same buying power as $2,981.42 in January 2022”
CALCULATION (to obtain an average of the figures above): ($6,033.22 + $2,981.42) / 2 = $4,507
[25] Paper: “Some Interim Results From a Controlled Trial of Cost Sharing.” By Joseph P. Newhouse and others. Rand, January 1982. <www.rand.org>
Page iii: “[T]he first regular sample [of study participants] was enrolled in late 1974. Most participants have now completed their period of participation, and all will complete it by January 1982.”
Page v:
A total of 7706 participants in six cities have taken part in a controlled experiment related to cost sharing in health insurance policies. …
The families were assigned in an unbiased manner to insurance plans that covered a broad range of medical services but varied the coinsurance rate, i.e., the fraction of its medical bills that the family must pay. This out-of-pocket expenditure was subject to an upper limit of $1000 per year or 5, 10, or 15% of income, whichever was less. …
Expenditure per person responds to variation in cost sharing. It is about 50 percent greater in the plan with no cost sharing [100% coverage] than in the one with 95-percent coinsurance [5% coverage] up to a maximum of $1000 in any one year. …
As cost sharing declines, the percentage of individuals seeking care rises, as does the number of ambulatory [outpatient] visits per user. The number of adults hospitalized increases, but the number of children hospitalized shows no systematic relationship to plan. Cost per person hospitalized does not appear to be related to plan.
Pages v–vi: “The implications of these findings are that: 1) Cost sharing unambiguously reduces expenditure; it is not ‘penny-wise and pound-foolish’ (with respect to expenditure) as some have argued.”
Page 4:
A total of 2756 families, consisting of 7706 persons, have been enrolled in one of several different health insurance plans, 70 percent of them for 3 years and the rest for 5 years. … Families were excluded in which heads were eligible for Medicare at the beginning of the study (or who would become so by virtue of age before the end of the study). Hence, our results do not necessarily apply to the aged population.
Pages 12, 15:
Per capita total expenditure (inpatient plus ambulatory [outpatient], excluding dental and outpatient mental health services) rises steadily as coinsurance falls (Table 3). Expenditure per person in the plan with no coinsurance (the most generous plan) is about 60-percent greater than in the plan with 95-percent coinsurance [5% coverage]….
Although the simple arithmetic mean provides acceptable precision for analyzing ambulatory expenditure, it does not do so for plan-related differences in total expenditure…. This lack of precision occurs because a few large medical expenditures account for a substantial portion of all expenditures on a given plan and can therefore affect the average quite dramatically….
Application of techniques better suited to such data yields a somewhat different, but probably more reliable, estimate of what per person expenditure would be if a larger number of families had been enrolled. … Averaged across all sites, predicted expenditure per person in the 95-percent coinsurance plan is 69 percent of that in the free care plan; in other words, free care causes expenditures to increase by nearly 50 percent (Table 5). … In some site-years, the predicted expenditure for the 50-percent coinsurance plan was smaller than that of the 95-percent coinsurance plan, but the difference is statistically insignificant. This misordering appears to be attributable to the sampling error, given the relatively few participants enrolled in the 50-percent coinsurance plan.
Page 13: “Table 3—Actual Annual Total and Ambulatory Expenditure Per Person, By Plan: Nine Site-Years”
|
Plan |
Total Expenditure† |
Free Plan $ Increase |
|
Free care |
$401 (±52) |
0% |
|
75% coverage |
$346 (±58) |
16% |
|
50% coverage |
$328 (±149) |
22% |
|
5% coverage |
$254 (±37) |
58% |
|
† 95-percent confidence intervals are shown in parentheses. NOTE: Just Facts has extracted, simplified, and systematized data from this table to make it more understandable. |
||
Page 16: “Table 5—Predicted Total Expenditure Per Person, By Plan, Site, and Year”
|
Plan |
Total Expenditure |
Free Plan $ Increase |
|
Free care |
$430 |
0% |
|
75% coverage |
$348 |
24% |
|
50% coverage |
$288 |
49% |
|
5% coverage |
$297 |
45% |
|
NOTE: Just Facts has extracted, simplified, and systematized data from this table to make it more understandable. |
||
Page 23:
Our results clearly show that the use of medical services responds to cost sharing; demand in an insurance plan with full coverage appears to be about 50 percent above that in an income-related catastrophe insurance plan [i.e., 5% coverage]. The fragmentary evidence now in the literature is roughly consistent with this value; for example, the 25-percent decline in visits observed in a natural experiment among Stanford University employees when their coinsurance rate was changed from zero to 25 percent … is similar to the 20-percent decline in ambulatory expenditures between the zero and 25-percent coinsurance plans (Table 3).
[26] Book: Free for All? Lessons from the Rand Health Insurance Experiment. By Joseph P. Newhouse and the Insurance Experiment Group. Harvard University Press, 1993.
Pages 339–340:
The reduced service use under the cost-sharing plans had little or no net adverse effect on health for the average person (Chapters 6 and 7). Indeed, restricted activity days fell with more cost sharing.
Health among the sick poor—approximately the most disadvantaged 6 percent of population—was adversely affected, however. In particular, the poor who began the Experiment with elevated blood pressure had their blood pressure lowered more on the free plan than on the cost-sharing plans. The effect on predicted mortality rates—a fall of about 10 percent—was substantial for this group. In addition, free care marginally improved both near and far corrected vision, primarily among the poor, and increased the likelihood that a decayed tooth would be filled—an effect found disproportionately among the less well educated. Health of gums was marginally better for those with free care. And serious symptoms were less prevalent on the free plan, especially for those who began the experiment poor and with serious symptoms. Finally, there appeared to be a beneficial effect on anemia for poor children. Although sample sizes made it impossible to detect any beneficial effects that free care might have had on relatively rare conditions, it is highly improbable that there were beneficial effects (one standard error of the mean changes) that we failed to detect in the physiologic measures of health taken as a group. Moreover, the confidence intervals are tight enough to rule out any beneficial effect of free care on the General Health Index, our best summary measure of health.
[27] Paper: “Some Interim Results From a Controlled Trial of Cost Sharing.” By Joseph P. Newhouse and others. Rand, January 1982. <www.rand.org>
Page 25:
Whatever merits or demerits cost sharing may have as an abstract principle, the plans we studied did not greatly affect patients once hospitalized. This absence of effect on cost per hospitalized patient could have occurred because any additional hospital services a physician might have ordered were usually not subject to cost sharing; 70 percent of the hospitalized patients exceeded the Maximum Dollar Expenditure.
Complete or nearly complete coverage for additional inpatient services is common in this country. Moreover, the additional expense that comes from being admitted to a relatively costly hospital is also fully insured, or nearly so. Thus, neither patients nor physicians have much incentive to choose an economically efficient rather than an inefficient hospital, or to economize on services once a patient is admitted—a situation that may partially explain the persistent above-average inflation in the hospital sector (Newhouse, 1978b).
[28] Paper: “Effects of Cost Sharing on Care Seeking and Health Status: Results From the Medical Outcomes Study.” By Mitchell D. Wong and others. American Journal of Public Health, November 2001. Pages 1889–1894. <www.ncbi.nlm.nih.gov>
Page 1889:
[W]e analyzed data from the Medical Outcomes Study, which prospectively followed chronically ill adults, to determine whether cost sharing deters use of care and leads to subsequent worse health outcomes among a population whose health may be more vulnerable to use disincentives. …
… [A]dults with 1 or more chronic illnesses were followed over 4 years. …
We analyzed data from the 1700 (67%) subjects who completed the 12- and 18-month surveys, which assessed individuals’ level of cost sharing and use of medical care.
Page 1890: “[W]e collapsed individuals into 3 cost-sharing categories: no copay (insurance pays all), low copay (insurance pays more than half but not all), and high copay (insurance pays half or less). Using insurance and employment data, we conducted logistic regression analyses to impute missing data on level of cost sharing for 92 (5.4%) subjects.”
Pages 1892–1893:
Previous studies have demonstrated little or no impact of cost sharing on health outcomes, but these studies have not primarily involved individuals who are chronically ill and, thus, particularly vulnerable. In contrast, the Medical Outcomes Study was designed to examine an older, chronically ill population and involved subjects who had diabetes, hypertension, coronary artery disease, congestive heart failure, or depression. In addition, 46% of these subjects were older than 62 years (the upper age cutoff for inclusion in the RAND Health Insurance Experiment). We hypothesized that cost sharing would have a significant negative impact on health status in this sample owing to the subjects’ advanced age and greater disease burden.
We found no association between cost sharing and health status at baseline or follow-up. Other studies of cost sharing examining acutely ill individuals have also failed to observe any negative health effect from cost sharing.9,27 This lack of finding is particularly surprising given that the RAND Health Insurance Experiment involved a comparatively younger and healthier population and revealed a small yet statistically significant effect on health. One explanation may be related to the influence of income on the effect of cost sharing. Health Insurance Experiment subjects who were in the lowest income category suffered the worst health outcomes due to cost sharing. Others have also shown that the health of the poor is particularly sensitive to limitations in access to care.11,28,29 Therefore, we may have failed to observe an association between cost sharing and worse health because subjects in the Medical Outcomes Study had relatively high incomes.
The time frame of our analysis may not have been optimal to detect a negative impact on health outcomes. The RAND Health Insurance Experiment demonstrated that cost sharing had its greatest impact through lowering use of general health examinations and preventive care.1 The effect on an individual’s health of receiving less preventive care would probably be delayed. Thus, the 1-year follow-up in our analysis may have been too brief. In addition, we observed subjects after they had already been exposed to cost sharing for some time, and thus cost sharing may have already affected their health by the time of our study. Consequently, the study may have been biased owing to a survival effect.
[29] Webpage: “Form W-2 Reporting of Employer-Sponsored Health Coverage.” United States Department of the Treasury, Internal Revenue Service. Last updated August 5, 2022. <www.irs.gov>
“The value of the employer’s excludable contribution to health coverage continues to be excludable from an employee’s income, and it is not taxable.”
[30] Pamphlet: “Medical and Dental Expenses.” United States Department of the Treasury, Internal Revenue Service, January 11, 2022. <www.irs.gov>
Page 2:
What Are Medical Expenses?
Medical expenses are the costs of diagnosis, cure, mitigation, treatment, or prevention of disease, and for the purpose of affecting any part or function of the body. These expenses include payments for legal medical services rendered by physicians, surgeons, dentists, and other medical practitioners. They include the costs of equipment, supplies, and diagnostic devices needed for these purposes.
Medical care expenses must be primarily to alleviate or prevent a physical or mental disability or illness. They don’t include expenses that are merely beneficial to general health, such as vitamins or a vacation.
Medical expenses include the premiums you pay for insurance that covers the expenses of medical care, and the amounts you pay for transportation to get medical care. Medical expenses also include amounts paid for qualified long-term care services and limited amounts paid for any qualified long-term care insurance contract.
Page 3:
How Much of the Expenses Can You Deduct?
Generally, you can deduct on Schedule A (Form 1040) only the amount of your medical and dental expenses that is more than 7.5% of your AGI [adjusted gross income].
[31] Public Law 116-260: “Consolidated Appropriations Act, 2021.” 116th U.S. Congress. Signed into law by Donald Trump on December 27, 2020. <www.congress.gov>
Title I—Extension of Certain Expiring Provisions
Subtitle A—Certain Provisions Made Permanent
Sec. 101. Reduction in Medical Expense Deduction Floor.
(a) In General.—Section 213 is amended—
(1) by striking “10 percent” in subsection (a) and inserting “7.5 percent,” and
(2) by striking subsection (f).
(b) Effective Date.—The amendments made by this section shall apply to taxable years beginning after December 31, 2020.
[32] Report: “Prescription for Change ‘Filled’: Tax Provisions in the Patient Protection and Affordable Care Act, Updated to Reflect Changes Approved in the Reconciliation Act of 2010.” Deloitte, March 30, 2010. <www2.deloitte.com>
Page 21:
The Act increases the threshold for claiming an itemized deduction for unreimbursed medical expenses for regular tax purposes from 7.5 percent of the taxpayer’s AGI [adjusted gross income] to 10 percent. The Act does not change the current-law 10 percent of AGI threshold that applies under the alternative minimum tax. Effective date – The change generally applies for taxable years beginning after December 31, 2012. For any taxpayer who is age 65 and older or whose spouse is 65 or older, the threshold for regular tax purposes remains at 7.5 percent until 2017.
[33] Calculated with data from:
a) Dataset: “Medicare Monthly Enrollment.” U.S. Department of Health & Human Services, Centers for Medicare and Medicaid Services, July 2022. <data.cms.gov>
“Total Beneficiaries … National … 2021 [=] 63,905,513”
b) Dataset: “Monthly Population Estimates for the United States: April 1, 2020 to December 1, 2022.” U.S. Census Bureau, December 2021. <data.census.gov>
“Resident population … 7/1/2021 population estimate [=] 331,893,745”
CALCULATION: 63,905,513 Medicare enrollees / 331,893,745 population = 19.2%
[34] Report: “Medicare Primer.” By Patricia A. Davis and others. Congressional Research Service. Updated May 21, 2020. <sgp.fas.org>
Page 1:
Part A (Hospital Insurance, or HI) covers inpatient hospital services, skilled nursing care, hospice care, and some home health services. The HI trust fund is mainly funded by a dedicated payroll tax of 2.9% of earnings, shared equally between employers and workers. …
Medicare serves approximately one in six Americans and virtually all of the population aged 65 and older.2 In 2020, the program will cover an estimated 63 million persons (54 million aged and 9 million disabled).
Page 6:
Most persons aged 65 or older are automatically entitled to premium-free Part A because they or their spouse paid Medicare payroll taxes for at least 40 quarters (about 10 years) on earnings covered by either the Social Security or the Railroad Retirement systems. Persons under the age of 65 who receive cash disability benefits from Social Security or the Railroad Retirement systems for at least 24 months are also entitled to Part A.
[35] Report: “Medicaid: A Primer.” By Elicia J. Herz. Congressional Research Service, July 18, 2012. <fas.org>
Page 2 (of PDF):
In existence for 47 years, Medicaid is a means-tested entitlement program that financed the delivery of primary and acute medical services as well as long-term care ….
Understanding the complex statutory and regulatory rules that govern Medicaid is further complicated by the fact that each state designs and administers its own version of the program under broad federal rules. State variability is the rule rather than the exception in terms of eligibility levels, covered services, and how those services are reimbursed and delivered.
Pages 1–2:
Even though Medicaid is an entitlement program in federal budget terms, states choose whether to participate, and all 50 states do so. …
The federal Medicaid statute … defines more than 50 distinct population groups as being potentially eligible. Historically, Medicaid eligibility was subject to categorical restrictions that generally limited coverage to the elderly, persons with disabilities … members of families with dependent children, certain other pregnant women and children, certain women with breast or cervical cancer, and uninsured individuals with tuberculosis. Recent changes in law (described below) provide eligibility for nonelderly, childless adults who do not fit into these traditional categories.
In addition, to qualify for Medicaid coverage, applicants’ income (for example, wages, Social Security benefits) and sometimes their resources, or assets (for example, value of a car, savings accounts), must meet program financial requirements. … In recent years, Medicaid has shifted largely to eligibility based on income, and most enrollees do not receive cash assistance. …
Some eligibility groups are mandatory, meaning that all states with a Medicaid program must cover them; others are optional. Examples of groups that states must provide Medicaid to include: …
• pregnant women and children through age 6 with family income below 133% of the federal poverty level (FPL),7 …
7 For example, in 2012, the FPL for a family of four is $23,050—133% of FPL for such a family would equal $30,656.50. See <aspe.hhs.gov>.
[36] “2010 Actuarial Report on the Financial Outlook for Medicaid.” By Christopher J. Truffer and others. U.S. Department of Health & Human Services, Centers for Medicare and Medicaid Services, Office of the Actuary, December 21, 2010. <www.cms.gov>
Page 2:
Beginning in 2014, the Affordable Care Act expands Medicaid eligibility to all individuals under age 65 in families with income below 138 percent of the Federal Poverty Level (FPL).2 …
2 … The Affordable Care Act technically specifies an upper income threshold of 133 percent of the FPL but also allows a 5-percent income disregard, making the effective threshold 138 percent.
Page 28:
The effective participation rate of persons who would have been uninsured for a full year, but are newly eligible for Medicaid as a result of the Affordable Care Act, is assumed to be 97 percent. This assumed participation rate is significantly higher than actual Medicaid participation rates to date and is based on the anticipated impacts of sections of the Affordable Care Act intended to make the process of enrolling easier. In particular, the legislation establishes State or federally operated health insurance exchanges that, among other responsibilities, will facilitate the determination of individuals’ and families’ eligibility for Federal financial assistance for health insurance, either through Medicaid or through the Federal premium and cost-sharing subsidies for private health insurance plans. The exchanges are assumed to perform this role effectively and, for those found to qualify for Medicaid, to assist the application and enrollment process. In this role, the exchanges would also serve as a valuable new resource for health providers who seek assistance in enrolling eligible persons in Medicaid. In addition, we anticipate that the more widespread availability of financial assistance under the Affordable Care Act (for individuals and families with incomes up to 400 percent of FPL) will reduce any stigma associated with receipt of such assistance through Medicaid.
Page iv:
The most significant change to Medicaid is the expansion of Medicaid eligibility beginning in 2014. This expansion, together with greater participation by individuals eligible under current rules, is projected to add 11.6 million people to enrollment in FY [fiscal year] 2014 and almost 20 million people by FY 2019, 21 percent and 34 percent, respectively, compared to pre-Affordable Care Act estimates. These increases reflect both the greater proportion of the population that will be eligible for Medicaid and an assumption that the new State health insurance exchanges will be very effective in assisting enrollment in Medicaid. Of the new enrollees … about 78 percent are projected to be eligible only under the new rules beginning in 2014.
[37] House Resolution 3590: “Patient Protection and Affordable Care Act.” Signed into law by Barack Obama on March 23, 2010 (became Public Law No: 111-148). <www.gpo.gov>
Page 162 (of PDF):
Title II—Role of Public Programs
Subtitle A—Improved Access to Medicaid …
Sec. 2002. Income Eligibility for Nonelderly Determined Using Modified Gross Income. …
(C) No Assets Test.—A State shall not apply any assets or resources test for purposes of determining eligibility for medical assistance under the State plan or under a waiver of the plan.
[38] Calculated with data from:
a) Report: “CMS [Centers for Medicare and Medicaid Services] Fast Facts.” U.S. Department of Health & Human Services, Centers for Medicare and Medicaid Services, August 2022. <data.cms.gov>
Page 1 (of PDF): “CMS Program Data – Populations1 … Medicaid (avg monthly)3 … Total … FY 2020 [=] 75.3 … 1 Populations are in millions and may not add due to rounding … 3 Projected estimates”
b) Dataset: “Monthly Population Estimates for the United States: April 1, 2020 to December 1, 2022.” U.S. Census Bureau, December 2021. <data.census.gov>
“Resident population … 7/1/2020 population estimate [=] 331,501,080”
CALCULATION: 75,300,000 enrollees / 331,501,080 population = 23%
[39] Report: “Medicaid and the State Children’s Health Insurance Program (CHIP) Provisions in PPACA: Summary and Timeline.” By Julie Stone and others. Congressional Research Service, August 19, 2010. <www.everycrsreport.com>
Page 48: “CHIP [Children’s Health Insurance Program] provides health care coverage to low-income, uninsured children in families with income above Medicaid income standards. States may also extend CHIP coverage to pregnant women when certain conditions are met. In designing their CHIP programs, states may choose to expand Medicaid, create a stand-alone program, or use a combined approach.”
[40] Webpage: “Medicaid, Children’s Health Insurance Program, & Basic Health Program Eligibility Levels.” Centers for Medicare and Medicaid Services, U.S. Department of Health and Human Services. Accessed November 6, 2022 at <www.medicaid.gov>
Medicaid and CHIP Eligibility Levels
The following table provides eligibility levels in each state for key coverage groups that use Modified Adjusted Gross Income (MAGI), as of July 1, 2022. The data represent the principal, but not all, MAGI coverage groups in Medicaid, the Children’s Health Insurance Program (CHIP), and the Basic Health Program (BHP). All income standards are expressed as a percentage of the federal poverty level (FPL). The MAGI-based rules generally include adjusting an individual’s income by an amount equivalent to a 5% FPL disregard. Other eligibility criteria also apply, such as citizenship, immigration status, and state residency.
State Medicaid, CHIP and BHP Income Eligibility Standards
(For Selected MAGI Groups, based on state decisions as of July 1, 2022) …
Children Separate CHIP2 … New York [=] 400%
[41] Final rule: “Medicaid Program; Eligibility Changes Under the Affordable Care Act of 2010.” Federal Register, March 23, 2012. <www.gpo.gov>
Page 17156:
Agency: Centers for Medicare & Medicaid Services (CMS), HHS.
7. No Resource Test or Income Disregards (§ 435.603(g))
Comment: Many commenters supported the proposal to prohibit consideration of assets in determining financial eligibility for Medicaid and CHIP [Children’s Health Insurance Program]. A few commenters recommended retaining the asset test because eliminating the test entirely could incentivize people with significant assets to stop working and could result in others with significant assets, but minimal income, being enrolled in Medicaid at the taxpayer’s expense.
Response: Section 1902(e)(14)(C) of the Act, as added by section 2002 of the Affordable Care Act, expressly prohibits consideration of assets in determining eligibility for individuals whose financial eligibility is based on MAGI [modified adjusted gross income methods]. We do not have the flexibility to issue regulations to the contrary and are finalizing the regulation at § 435.603(g) as proposed. We note that currently almost all States do not consider assets when determining children’s eligibility for Medicaid and nearly half of all States have also dropped the asset test for parents.
[42] Calculated with data from:
a) “Federal Fiscal Year (FFY) 2020 Statistical Enrollment Data System (SEDS) Reporting.” U.S. Department of Health & Human Services, Centers for Medicare and Medicaid Services, September 2021. <www.medicaid.gov>
Pages 3–4: “Unduplicated Number of Children Ever-Enrolled in CHIP and Medicaid … CHIP FFY 2020 … Totals [=] 9,062,750”
b) Dataset: “Monthly Population Estimates for the United States: April 1, 2020 to December 1, 2022.” U.S. Census Bureau, December 2021. <data.census.gov>
“Resident population … 7/1/2020 population estimate [=] 331,501,080”
CALCULATION: 9,062,750 enrollees / 331,501,080 population = 3%
[43] Report: “Private Health Insurance Provisions in PPACA [Patient Protection and Affordable Care Act] (P.L. 111-148).” By Hinda Chaikind and others. Congressional Research Service, April 15, 2010. <www.everycrsreport.com>
Page 2 (of PDF): “[The Affordable Care Act] will enable and support states’ creation by 2014 of ‘American Health Benefit Exchanges.’ … Based on income, certain individuals may qualify for a tax credit toward their [health insurance] premium costs and a subsidy for their cost-sharing; the credits and subsidies will be available only through an exchange.”
[44] Calculated with data from:
a) Report: “Effectuated Enrollment: Early 2022 Snapshot and Fully Year 2021 Average.” Centers for Medicare & Medicaid Services, September 2022. <www.cms.gov>
Page 6: “Table 3: Total Average Monthly Effectuated Marketplace Enrollment and Enrollees Receiving APTC [advance premium tax credits] and CSR [cost sharing reduction] by State for 2021 … Total … APTC Enrollment [=] 10,323,574”
b) Dataset: “Monthly Population Estimates for the United States: April 1, 2020 to December 1, 2022.” U.S. Census Bureau, December 2021. <data.census.gov>
“Resident population … 7/1/2021 population estimate [=] 331,893,745”
CALCULATION: 10,323,574 enrollees receiving tax credits / 331,893,745 population = 3.1%
[45] Report: “Prescription for Change ‘Filled’: Tax Provisions in the Patient Protection and Affordable Care Act, Updated to Reflect Changes Approved in the Reconciliation Act of 2010.” By Clint Stretch and others. Deloitte, March 30, 2010. <www2.deloitte.com>
Page 16:
Small businesses and eligible tax-exempt employers who are required to make certain non-elective contributions toward the costs of employee health benefits will be eligible for a small business credit to offset the cost of employee health insurance. …
In order to qualify, the business must have no more than 25 full-time equivalent employees, pay average annual wages of less than $50,000, and provide qualifying coverage. The full amount of the credit will be available to employers with 10 or fewer employees and average annual wages of less than $25,000, and will phase out when those thresholds are exceeded. The average wage threshold for determining the phase-out of credits will be adjusted for inflation after 2013. …
Effective date – The provision is effective for amounts paid or incurred after December 31, 2009, and to the determination of AMT [alternative minimum tax] credits after that date and their carryback.
[46] Webpage: “Small Business Health Care Tax Credit and the SHOP [Small Business Health Options Program] Marketplace.” Internal Revenue Service. Last reviewed or updated May 31, 2022. <www.irs.gov>
If you are a small employer, there is a tax credit that can put money in your pocket.
The small business health care tax credit benefits employers that:
• Have fewer than 25 full-time equivalent employees
• Pay average wages of less than $50,000 a year per full-time equivalent (indexed annually for inflation beginning in 2014)
• For tax year 2014, the inflation-adjusted amount is $51,000
• For tax year 2015, the inflation-adjusted amount is $52,000
• For tax year 2016, the inflation-adjusted amount is $52,000
• For tax year 2017, the inflation-adjusted amount is $53,000
• Offer a qualified health plan to its employees through a Small Business Health Options Program Marketplace (or qualify for a limited exception to this requirement)
• Pay at least 50 percent of the cost of employee-only—not family or dependent—health care coverage for each employee …
How Will the Credit Make a Difference for You?
The maximum credit is:
• 50 percent of premiums paid for small business employers and
• 35 percent of premiums paid for small tax-exempt employers
• The credit is available to eligible employers for two consecutive taxable years
The amount of the credit you receive works on a sliding scale. The smaller the employer, the bigger the credit. So if you have more than 10 full-time equivalent employees or if the average wage is more than $25,000 (as adjusted for inflation), the amount of the credit you receive will be less. For example, if you pay $50,000 a year toward employees’ health care premiums, and if you qualify for a $10,000 credit each year, you can save $20,000 over the course of two years.
Even if your small business does not owe tax during the year, you can carry the credit back or forward to other tax years. Also, since the amount of the health insurance premium payments is more than the total credit, eligible small businesses can still claim a business expense deduction for the premiums in excess of the credit. That’s both a credit and a deduction for employee premium payments.
Even if you are a small business employer who did not owe tax during the year, you can carry the credit back or forward to other tax years. Also, since the amount of the health insurance premium payments is more than the total credit, eligible small businesses can still claim a business expense deduction for the premiums in excess of the credit. That’s both a credit and a deduction for employee premium payments.
The credit is refundable, so if you’re tax-exempt and have no taxable income, you may be eligible to receive the credit as a refund so long as it does not exceed your income tax withholding and Medicare tax liability. Refund payments issued to small tax-exempt employers claiming the refundable portion of the credit are subject to sequestration.
[47] Paper: “Measuring the Economy: A Primer on GDP and the National Income and Product Accounts.” U.S. Department of Commerce, Bureau of Economic Analysis, December 2015. <www.bea.gov>
Page 1:
How fast is the economy growing? Is it speeding up or slowing down? How does the trade deficit affect economic growth? What’s happening to the pattern of spending on goods and services in the economy?
To answer these types of questions about the economy, economists and policymakers turn to the national income and product accounts (NIPAs) produced by the Bureau of Economic Analysis (BEA). … Featured in the NIPAs is gross domestic product (GDP), which measures the value of the goods and services produced by the U.S. economy in a given time period.
GDP is one of the most comprehensive and closely watched economic statistics: It is used by the White House and Congress to prepare the Federal budget, by the Federal Reserve to formulate monetary policy, by Wall Street as an indicator of economic activity, and by the business community to prepare forecasts of economic performance that provide the basis for production, investment, and employment planning.
Page 8: “… GDP—is defined as the market value of goods, services, and structures produced by the Nation’s economy during a given period less the value of the goods and services used up in production.”
[48] Report: “International Comparisons of GDP Per Capita and Per Hour, 1960–2011.” U.S. Department of Labor, Bureau of Labor Statistics, November 7, 2012. <www.bls.gov>
Page 1: “GDP per capita, when converted to U.S. dollars using purchasing power parities, is the most widely used income measure for international comparisons of living standards.”
Page 2:
Gross Domestic Product (GDP) is defined as the value of all market and some nonmarket goods and services produced within a country’s geographic borders. As such, it is the most comprehensive measure of a country’s economic output that is estimated by statistical agencies. GDP per capita may therefore be viewed as a rough indicator of a nation’s economic well-being, while GDP per hour worked can provide a general picture of a country’s productivity.
[49] Book: Economics: Principles and Policy (12th edition). By William Baumol and Alan Blinder. South-Western Cengage Learning, 2011.
Page 491:
To sharpen the point, observe that real GDP is, by definition, the product of the total hours of work in the economy times the amount of output produced per hour—what we have just called labor productivity:
GDP = Hours of work × Output per hour = Hours worked × Labor productivity
For example, in the United States today, in round numbers, GDP is about $15 trillion and total hours of work per year are about 230 billion. Thus labor productivity is roughly $15 trillion/230 billion hours, or about $65 per hour.
[50] Webpage: “Household Disposable Income.” Organization for Economic Cooperation and Development. Accessed November 7, 2022 at <data.oecd.org>
Disposable income is closest to the concept of income as generally understood in economics. Household disposable income is income available to households such as wages and salaries, income from self-employment and unincorporated enterprises, income from pensions and other social benefits, and income from financial investments (less any payments of tax, social insurance contributions and interest on financial liabilities). “Gross” means that depreciation costs are not subtracted. For gross household disposable income per capita, growth rates (percentage change from previous period) are presented; these are “real” growth rates adjusted to remove the effects of price changes. Information is also presented for gross household disposable income including social transfers in kind, such as health or education provided for free or at reduced prices by governments and not-for-profit organisations. This indicator is in US dollars per capita at current prices and PPPs [price purchasing parities]. In the System of National Accounts, household disposable income including social transfers in kind is referred to as “adjusted household disposable income.” All OECD [Organization for Economic Cooperation and Development] countries compile their data according to the 2008 System of National Accounts (SNA 2008).
[51] News release: “Personal Income, February 2019; Personal Outlays, January 2019.” U.S. Department of Commerce, Bureau of Economic Analysis, March 29, 2019. <www.bea.gov>
Personal income is the income received by, or on behalf of, all persons from all sources: from participation as laborers in production, from owning a home or business, from the ownership of financial assets, and from government and business in the form of transfers. It includes income from domestic sources as well as the rest of world. It does not include realized or unrealized capital gains or losses.
Disposable personal income is the income available to persons for spending or saving. It is equal to personal income less personal current taxes.
[52] Webpage: “Where: Global Reach.” Organization for Economic Cooperation and Development. Accessed November 6, 2022 at <www.oecd.org>
Today, our 38 Member countries span the globe.…
Australia, Austria, Belgium, Canada, Chile, Columbia, Costa Rica, Czech Republic, Denmark, Estonia, Finland, France, Germany, Greece, Hungary, Iceland, Ireland, Israel, Italy, Japan, [South] Korea, Latvia, Lithuania, Luxembourg, Mexico, Netherlands, New Zealand, Norway, Poland, Portugal, Slovak Republic, Slovenia, Spain, Sweden, Switzerland, Turkey, United Kingdom, United States …
The most recent countries to join the OECD [Organization for Economic Cooperation and Development] were Colombia, in April 2020, and Costa Rica, in May 2021. On 25 January 2022, the Council decided to take the first step in accession discussions with six candidate countries to OECD Membership – Argentina, Brazil, Bulgaria, Croatia, Peru and Romania. Accession Roadmaps for Brazil, Bulgaria, Croatia, Peru and Romania were adopted at the Council meeting at Ministerial level on 10 June 2022. Conversations regarding the next steps with Argentina are on-going.
[53] Book: Beyond Economic Growth: An Introduction to Sustainable Development (2nd edition). By Tatyana P. Soubbotina. World Bank, 2004. <openknowledge.worldbank.org>
Pages 132–133:
Developed countries (industrial countries, industrially advanced countries). High-income countries, in which most people have a high standard of living. Sometimes also defined as countries with a large stock of physical capital, in which most people undertake highly specialized activities. … Depending on who defines them, developed countries may also include middle-income countries with transition economies, because these countries are highly industrialized. Developed countries contain about 15 percent of the world’s population. They are also sometimes referred to as “the North.”
Page 141:
Organisation for Economic Cooperation and Development (OECD). … An organization that coordinates policy among developed countries. OECD member countries exchange economic data and create unified policies to maximize their countries’ economic growth and help nonmember countries develop more rapidly. The OECD arose from the Organisation for European Economic Cooperation (OEEC), which was created in 1948 to administer the Marshall Plan in Europe. In 1960, when the Marshall Plan was completed, Canada, Spain, and the United States joined OEEC members to form the OECD.
[54] Chart constructed with data from:
a) Dataset: “Health Expenditure and Financing: Current Expenditure on Health (All Functions), Share of Gross Domestic Product.” Organization for Economic Cooperation and Development. Accessed November 7, 2022 at <stats.oecd.org>
b) Dataset: “Household Disposable Income, Gross Adjusted, US Dollars Purchasing Power Parity per Capita, 2020.” Organization for Economic Cooperation and Development, July 11, 2022. <stats.oecd.org>
NOTE: An Excel file containing the data is available upon request.
[55] Webpage: “Current Health Expenditure (% of GDP).” World Health Organization. Accessed November 7, 2022 at <data.worldbank.org>
“Level of current health expenditure expressed as a percentage of GDP [gross domestic product]. Estimates of current health expenditures include healthcare goods and services consumed during each year. This indicator does not include capital health expenditures such as buildings, machinery, IT [information technology] and stocks of vaccines for emergency or outbreaks.”
[56] Webpage: “Household Disposable Income.” Organization for Economic Cooperation and Development. Accessed November 7, 2022 at <data.oecd.org>
Disposable income is closest to the concept of income as generally understood in economics. Household disposable income is income available to households such as wages and salaries, income from self-employment and unincorporated enterprises, income from pensions and other social benefits, and income from financial investments (less any payments of tax, social insurance contributions and interest on financial liabilities). “Gross” means that depreciation costs are not subtracted. For gross household disposable income per capita, growth rates (percentage change from previous period) are presented; these are “real” growth rates adjusted to remove the effects of price changes. Information is also presented for gross household disposable income including social transfers in kind, such as health or education provided for free or at reduced prices by governments and not-for-profit organisations. This indicator is in US dollars per capita at current prices and PPPs [price purchasing parities]. In the System of National Accounts, household disposable income including social transfers in kind is referred to as “adjusted household disposable income.” All OECD [Organization for Economic Cooperation and Development] countries compile their data according to the 2008 System of National Accounts (SNA 2008).
[57] Webpage: “Glossary of Statistical Terms: Purchasing Power Parities (PPPs).” Organization for Economic Cooperation and Development, September 25, 2001. Last updated 6/11/13. <stats.oecd.org>
“Purchasing power parities (PPPs) are the rates of currency conversion that equalise the purchasing power of different currencies by eliminating the differences in price levels between countries. In their simplest form, PPPs are simply price relatives which show the ratio of the prices in national currencies of the same good or service in different countries.”
[58] Textbook: Handbook of Health Economics (Volume 1A). Edited by Anthony J. Cuyler and Joseph P. Newhouse. Elsevier, 2000.
Chapter 1: “International Comparisons of Health Expenditure.” By Ulf-G. Gerdtham and Bengt Jönsson. Pages 11–53.
Pages 19–20:
[R]igorous assessment of the quality (accuracy and reliability) of the cross-national data is difficult. … There is ample scope for imperfect reliability with respect to international comparisons due to differential classification, especially on the borderline of health services such as care for the aged. For example, the care of the mentally retarded is not included in the expenditure for Denmark nor for Sweden after 1985, but it is included in the expenditure for Finland, Iceland and Norway. Another difference is that local nursing homes are not included in the Danish statistics, whereas they were included in Finland, Iceland, Norway and Sweden before 1992…. Thus heterogeneous definitions are present even if one selects apparently similar countries such as the Nordic countries…. Taken together, these problems indicate that results obtained with international comparisons should be treated with considerable caution.
Page 45: “A common and extremely robust result of international comparisons is that the effect of per capita GDP [gross domestic product] (income) on expenditures is clearly positive and significant and, further, that the estimated income elasticity† is clearly higher than zero and close to unity or even higher than unity. This result appears to be robust to the choice of variables included in the estimated models, data, the choice of conversion factors and methods of estimation.”
NOTE: † Income elasticity is a “measure of the responsiveness of demand to changes in income. … If the percent change in the quantity demanded is greater than the percent change in consumer income, the demand is said to be income elastic, or responsive to changes in consumer income.” [Webpage: “Glossary: Demand Elasticities.” U.S. Department of Agriculture, Economic Research Service. Last updated September 9, 2022. <www.ers.usda.gov>]
[59] Textbook: Health Economics: Theories, Insights, and Industry Studies (5th edition). By Rexford E. Santerre and Stephen P. Neun. South-Western, Cengage Learning, 2010.
Page 131:
The empirical estimates for the income elasticity of demand vary widely and merit discussion. Studies using household, or individual, data generally find healthcare to be a normal good with income elasticity below 1.0. These results are in direct contrast to studies that utilize country-level data to look at the relation between income and health care expenditures either over time or across countries. The goal of these studies is to ascertain how economic growth impacts national health care expenditures. Generally, these studies find the aggregate income elasticity to be slightly above 1. …
This difference between the micro and macro estimates is interesting and deserves explanation. According to Newhouse, the difference exists, because, for example, within the United States at any point in time the average consumer pays only a small portion of the price of medical care (approximately 14 percent in 2003), while over time the country as a whole must pay the full price of health care. As the out-of-pocket price of health care falls to zero, then the average individual is going to consume health care regardless of income. The income elasticity in the extreme equals zero. The country, as a whole, however, must face the entire burden of the cost of health care and, as a result, is going to be much more sensitive to price and income.
[60] Report: “National Health Expenditures Accounts: Definitions, Sources, and Methods, 2009.” U.S. Department of Health & Human Services. <www.cms.gov>
Page 4:
National Health Expenditures represents health care spending in the aggregate. The NHEA recognize several types of health care spending within this broad aggregate. “Personal Health Care Expenditures” (PHC) measures the total amount spent to treat individuals with specific medical conditions. “Health Consumption Expenditures” (HCE) represents spending for all medical care rendered during the year, and is the sum of personal health care expenditures, government public health activity, and government administration and the net cost of private health insurance. National Health Expenditures (NHE) equals Health Consumption Expenditures plus Investment, or the sum of medical sector purchases of structures and equipment and expenditures for noncommercial medical research.
Page 6:
Personal health care goods and services comprise all of the medical goods and services that are rendered to treat or prevent a specific disease or condition in a specific person. These include hospital, professional services, other health, residential, and personal care, home health, nursing care facilities and continuing care retirement communities, and the retail outlet sales of medical products (Exhibit 3).
[61] Calculated with the dataset: “Table 7 PHC. Total Personal Health Care Per-Capita Spending by Gender and Age Group, Calendar Years 2002, 2004, 2006, 2008, 2010, 2012, 2014 Level (Dollars).” U.S. Department of Health & Human Services, Centers for Medicare and Medicaid Services. Last modified April 26, 2019. <www.cms.gov>
“Age group [=] 65–84 … Levels … 2014 [=] $16,977”
CALCULATION: $16,977 / $4,856 = 3.5
[62] Report: “The Baby Boom Cohort in the United States: 2012 to 2060.” By Sandra L. Colby and Jennifer M. Ortman. U.S. Census Bureau, May 2014. <www.census.gov>
Page 1:
The cohort born during the post-World War II baby boom in the United States, referred to as the baby boomers, has been driving change in the age structure of the U.S. population since their birth. This cohort is projected to continue to influence characteristics of the nation in the years to come. The baby boomers began turning 65 in 2011 and are now driving growth at the older ages of the population.
Page 2: “The term ‘baby boomer’ refers to individuals born in the United States between mid-1946 and mid-1964 (Hogan, Perez, and Bell, 2008).”
[63] Report: “The 2017 Long-Term Budget Outlook.” Congressional Budget Office, March 2017. <www.cbo.gov>
Page 4 (of PDF):
Much of the spending growth for Social Security and Medicare results from the aging of the population: As members of the baby-boom generation age and as life expectancy continues to increase, the percentage of the population age 65 or older will grow sharply, boosting the number of beneficiaries of those programs.
In addition, growth in spending on Medicare and the other major health care programs is driven by rising health care costs per person, which are projected to increase more quickly than GDP [gross domestic product] per capita (after the effects of aging and other demographic changes are removed).
Page 15: “The retirement of the baby-boom generation and continued gains in life expectancy will increase the share of the population that is age 65 or older from 15 percent to 22 percent between 2017 and 2047.”
[64] Calculated with data from the: “2022 Annual Report of the Board of Trustees of the Federal Old-Age and Survivors Insurance and Federal Disability Insurance Trust Funds.” U.S. Social Security Administration, Office of the Chief Actuary, June 2, 2022. <www.ssa.gov>
Pages 97–98:“Table V.A3.–Social Security Area Population on July 1 and Dependency Ratios, Calendar Years 1945–2100 … Calendar year [=] 2011 … Population (in thousands) … 20–64 [=] 189,898 … 65 and over [=] 41,739 … Calendar year [=] 2030… 20–64 [=] 200,496 … 65 and over [=]71,153 … Calendar year [=] 2040 … 20–64 [=] 207,586 … 65 and over [=] 78,089”
CALCULATIONS:
[65] Paper: “The Impact of Prevention on Reducing the Burden of Cardiovascular Disease.” By Richard Kahn and others. American Heart Association, Circulation, July 7, 2008. Pages 576–585. <www.ahajournals.org>
Page 577: “Three chronic diseases—cancer, cardiovascular disease (CVD), and diabetes—are responsible for a majority of the morbidity, mortality, and health care costs in the United States.”
[66] Webpage: “About Chronic Diseases.” U.S. Centers for Disease Control and Prevention. Last reviewed July 21, 2022. <www.cdc.gov>
“Chronic diseases such as heart disease, cancer, and diabetes are the leading causes of death and disability in the United States. They are also leading drivers of the nation’s $4.1 trillion in annual health care costs.”
[67] Paper: “The Impact of Prevention on Reducing the Burden of Cardiovascular Disease.” By Richard Kahn and others. American Heart Association Circulation, July 7, 2008. Pages 576–585. <www.ahajournals.org>
Page 576:
Approximately 78% of adults aged 20–80 years alive today in the United States are candidates for at least one prevention activity. If everyone received the activities for which they are eligible, myocardial infarctions [heart attacks] and strokes would be reduced by 63% and 31%, respectively. If more feasible levels of performance are assumed, myocardial infarctions and strokes would be reduced 36% and 20%, respectively. Implementation of all prevention activities would add ≈221 million life-years and 244 million quality-adjusted life-years to the US adult population over the coming 30 years, or an average of 1.3 years of life expectancy for all adults.
Page 579:
Table 2. Cost of Interventions … Aspirin to high-risk patients … Total Cost/Year [=] $91 … Lower LDL cholesterol to < 130 mg/dL in high-risk individuals … Total Cost/Year [=] $1816 … Lower blood pressure in diabetic individuals … Total Cost/Year [=] $1582 …
For each of these simulated trials, we calculated the outcomes under two sets of assumptions about performance and compliance. In the first case, we analyzed the outcomes that would occur if 100% performance and compliance levels were achieved. This trial was done to estimate the maximum potential of prevention achievable by the recommended activities. In the second case, we applied more realistic, albeit aggressive, assumptions about what might constitute levels of performance that were feasible.
Page 580:
Table 3 also shows the effects on health care costs. The cost of caring for CVD [Cardiovascular Disease], diabetes, and CHD [Coronary Heart Disease] over the coming 30 years will be in the order of $9.5 trillion. If all the recommended prevention activities were applied with 100% success, those costs would be reduced by ≈$904 billion, or almost 10%. However, assuming the costs shown in Table 2, the prevention activities themselves would cost ≈$8.5 trillion, offsetting the savings by a factor of almost 10 and increasing total medical costs by ≈$7.6 trillion (162%).
[68] Letter: Douglas W. Elmendorf (Director, Congressional Budget Office) to Nathan Deal (Ranking Member, Subcommittee on Health, Committee on Energy and Commerce, U.S. House of Representatives). Congressional Budget Office, August 7, 2009. <www.cbo.gov>
Pages 1–2:
Preventive medical care includes services such as cancer screening, cholesterol management, and vaccines. In making its estimates of the budgetary effects of expanded governmental support for preventive care, CBO [Congressional Budget Office] takes into account any estimated savings that would result from greater use of such care as well as the estimated costs of that additional care. Although different types of preventive care have different effects on spending, the evidence suggests that for most preventive services, expanded utilization leads to higher, not lower, medical spending overall.
That result may seem counterintuitive. For example, many observers point to cases in which a simple medical test, if given early enough, can reveal a condition that is treatable at a fraction of the cost of treating that same illness after it has progressed. In such cases, an ounce of prevention improves health and reduces spending—for that individual. But when analyzing the effects of preventive care on total spending for health care, it is important to recognize that doctors do not know beforehand which patients are going to develop costly illnesses. To avert one case of acute illness, it is usually necessary to provide preventive care to many patients, most of whom would not have suffered that illness anyway. Even when the unit cost of a particular preventive service is low, costs can accumulate quickly when a large number of patients are treated preventively. Judging the overall effect on medical spending requires analysts to calculate not just the savings from the relatively few individuals who would avoid more expensive treatment later, but also the costs for the many who would make greater use of preventive care.2 As a result, preventive care can have the largest benefits relative to costs when it is targeted at people who are most likely to suffer from a particular medical problem; however, such targeting can be difficult because preventive services are generally provided to patients who have the potential to contract a given disease but have not yet shown symptoms of having it.
[69] Paper: “Lifetime Medical Costs of Obesity: Prevention No Cure for Increasing Health Expenditure.” By Pieter H. M. van Baal and others. PLoS Medicine, February 2008. Pages 0242–0249. <www.plosmedicine.org>
Page 0249:
Compared to people with a healthy weight (a BMI [body mass index] between 18.5 and 25), overweight and obese individuals have an increased risk of developing many diseases, such as diabetes, coronary heart disease and stroke, and tend to die younger. …
… life expectancy at age 20 was 5 years less for the obese group, and 8 years less for the smoking group, compared to the healthy-living group….
Page 0242: “Until age 56 y, annual health expenditure was highest for obese people. At older ages, smokers incurred higher costs. Because of differences in life expectancy, however, lifetime health expenditure was highest among healthy-living people and lowest for smokers.”
Page 0245: “Table 1. Life Expectancy (Years) and Expected Lifetime Health-Care Costs per Capita … at 20 Years of Age for the Three Cohorts … Expected remaining lifetime health-care costs (× €1,000) [in thousands of Euros] at age 20 … Obese Cohort [=] 250 [thousand Euros] … ‘Healthy-Living’ Cohort [=] 281 [thousand Euros] … Smoking Cohort [=] 220 [thousand Euros]”
CALCULATIONS:
[70] Paper: “Lifetime Medical Costs of Obesity: Prevention No Cure for Increasing Health Expenditure.” By Pieter H. M. van Baal and others. PLoS Medicine, February 2008. Pages 0242–0249. <www.plosmedicine.org>
Page 0242: “Although effective obesity prevention leads to a decrease in costs of obesity-related diseases, this decrease is offset by cost increases due to diseases unrelated to obesity in life-years gained. Obesity prevention may be an important and cost-effective way of improving public health, but it is not a cure for increasing health expenditures.”
[71] Paper: “Preventing Fatal Diseases Increases Healthcare Costs: Cause Elimination Life Table Approach.” By Luc Bonneux and others. British Medical Journal, January 3, 1998. Pages 26–29. <www.bmj.com>
Page 26:
Conclusion: The aim of prevention is to spare people from avoidable misery and death not to save money on the healthcare system. In countries with low mortality, elimination of fatal diseases by successful prevention increases healthcare spending because of the medical expenses during added life years. …
In a previous study all healthcare costs in the Netherlands in 1988 (… for 14.8 million inhabitants) were allocated to age, sex, health-care sector, and primary diagnosis on the basis of comprehensive data on morbidity, mortality, and direct costs.3–5 … To calculate the effect of eradication, a specific disease was eliminated both as cause of death and as cause of costs: the cause elimination life table recalculates life expectancy and life time expected costs as if the eliminated disease had never existed.
Pages 27–28:
Our analysis shows that lengthening life generally will increase healthcare needs, particularly needs for long term nursing care as most life years are added to old age. This is not a bad thing; prevention can hardly be blamed if it reaches its target and lowers mortality. …
Eliminating causes in a life table demonstrates an unquestionable truth: we all have to die. If we eliminate a specific cause of death, we simply die later from another. In the meantime we grow older, become generally more disabled, and need more care.9 In the Netherlands, cardiovascular diseases and cancer were jointly responsible for nearly 70% of all deaths, yet accounted for a mere 17% of all healthcare costs, whereas the largely non-fatal diseases of the brain, joints, and bones, causing under 2% of all deaths, generated 35% of all costs….
NOTE: Credit for bringing this paper to attention belongs to Sally C. Pipes [Book: The Top Ten Myths of American Health Care: A Citizen’s Guide. Pacific Research Institute, 2008. <www.pacificresearch.org>]
[72] Paper: “Preventing Fatal Diseases Increases Healthcare Costs: Cause Elimination Life Table Approach.” By Luc Bonneux and others. British Medical Journal, January 3, 1998. Pages 26–29. <www.bmj.com>
Page 26:
Conclusion: The aim of prevention is to spare people from avoidable misery and death not to save money on the healthcare system. In countries with low mortality, elimination of fatal diseases by successful prevention increases healthcare spending because of the medical expenses during added life years. …
In a previous study all healthcare costs in the Netherlands in 1988 (… for 14.8 million inhabitants) were allocated to age, sex, health-care sector, and primary diagnosis on the basis of comprehensive data on morbidity, mortality, and direct costs.3–5 … To calculate the effect of eradication, a specific disease was eliminated both as cause of death and as cause of costs: the cause elimination life table recalculates life expectancy and life time expected costs as if the eliminated disease had never existed.
Pages 27–28:
Our analysis shows that lengthening life generally will increase healthcare needs, particularly needs for long term nursing care as most life years are added to old age. This is not a bad thing; prevention can hardly be blamed if it reaches its target and lowers mortality. …
Eliminating causes in a life table demonstrates an unquestionable truth: we all have to die. If we eliminate a specific cause of death, we simply die later from another. In the meantime we grow older, become generally more disabled, and need more care.9 In the Netherlands, cardiovascular diseases and cancer were jointly responsible for nearly 70% of all deaths, yet accounted for a mere 17% of all healthcare costs, whereas the largely non-fatal diseases of the brain, joints, and bones, causing under 2% of all deaths, generated 35% of all costs….
NOTE: Credit for bringing this paper to attention belongs to Sally C. Pipes [Book: The Top Ten Myths of American Health Care: A Citizen’s Guide. Pacific Research Institute, 2008. <www.pacificresearch.org>]
[73] Article: “What Is EBITDA?” By Katherine Arline. Business News Daily, May 9, 2013. Updated February 25, 2015. <www.businessnewsdaily.com>
Having a reliable measure of your company’s financial health is invaluable both to you and to potential business partners. The accounting technique EBITDA—earnings before interest, taxes, depreciation and amortization—is an important standard measure of profitability. …
To calculate EBITDA, a business must know its income, expenses, interest, taxes, depreciation (the loss in value of operational assets, such as equipment) and amortization, which is expenses for intangible assets, such as patents, that are spread out over a number of years. With those numbers in hand, the formula is:
EBITDA = Revenue – Expenses (excluding tax, interest, depreciation and amortization)
One way to get a more realistic profit picture is to calculate EBITDA margin. To determine EBITDA margin, a business must first calculate its EBITDA and then divide that number by total revenue.
EBITDA Margin = EBITDA ÷ Total Revenue
This result helps show how much operating expenses are eating into a company’s profits. In the end, the higher the EBITDA margin, the less risky a company is considered financially.
[74] Email from Yardeni Research (<www.yardeni.com>) to Just Facts, March 29, 2016.
“EBITDA [earnings before interest, taxes, depreciation, and amortization] margins are the cleanest way to do comparisons across different types of industries.”
[75] Calculated with the dataset: “S&P 500 and Healthcare Earnings Before Interest, Tax, Depreciation, and Amortization [EBITDA] Margins.” Sent to Just Facts by Yardeni Research (<www.yardeni.com>) on May 28, 2019.
NOTE: An Excel file containing the data and calculations is available upon request.
[76] Webpage: “S&P Dow Jones Indices.” Standard and Poors. Accessed November 8, 2022 at <www.spglobal.com>
“The S&P 500 is widely regarded as the best single gauge of the large-cap U.S. equity market and is the world’s most tracked index by AUM. The index includes 500 leading companies and covers approximately 80% of the U.S. equity market’s available market cap..”
[77] Book: The Essentials of Finance and Budgeting. Harvard Business School Publishing, 2005.
Page 33:
Revenues – Expenses = Net Income (or Net Loss)
An income statement starts by showing he company’s revenues: the amount of money that resulted from selling products or services to customers. A company may have other revenues as well. In many cases, these additional revenues derive from investments or interest income from the firm’s cash holdings.
Various costs and expenses—from the costs of making and storing a company’s goods, to depreciation of plant and equipment, to interest expense and taxes—are then deducted from revenues. The bottom line—what’s left over—is the net income, or net profit or net earnings, for the period covered by the income statement.
Pages 47–48: “Profit Margin The profit margin—sometimes called return on sales, or ROS—indicates a rate of return on sales. It tells us what percentage of every dollar of sales makes it to the bottom line. Calculate the profit margin as follows: Profit Margin = Net Income / Net Sales”
[78] Dataset: “Healthcare Sector.” Yahoo! Finance. Accessed August 27, 2015 at <finance.yahoo.com>
Variable: “Net Profit Margin % (most recent quarter)”
[79] Webpage: “May 2021 National Occupational Employment and Wage Estimates.” U.S. Department of Labor, Bureau of Labor Statistics. Last modified March 31, 2022. <www.bls.gov>
[80] Webpage: “Technical Notes for May 2021 OEWS Estimates.” U.S. Department of Labor, Bureau of Labor Statistics. Last modified March 31, 2022. <www.bls.gov>
The Occupational Employment and Wage Statistics (OEWS) survey is a semiannual survey measuring occupational employment and wage rates for wage and salary workers in nonfarm establishments in the United States. …
Wages for the OEWS survey are straight-time, gross pay, exclusive of premium pay. Base rate; cost-of-living allowances; guaranteed pay; hazardous-duty pay; incentive pay, including commissions and production bonuses; and tips are included. Excluded are overtime pay, severance pay, shift differentials, nonproduction bonuses, employer cost for supplementary benefits, and tuition reimbursements.
[81] “Occupational Outlook Handbook: Highest Paying Occupations.” U.S. Department of Labor, Bureau of Labor Statistics. Last modified September 8, 2022. <www.bls.gov>
|
Highest Paying Occupations |
|
|
Occupation |
2021 Median Pay |
|
Ophthalmologists, except pediatric |
This wage is equal to or greater than $208,000 per year |
|
Physicians, all other |
This wage is equal to or greater than $208,000 per year |
|
Radiologists |
This wage is equal to or greater than $208,000 per year |
|
Psychiatrists |
This wage is equal to or greater than $208,000 per year |
|
Physicians, pathologists |
This wage is equal to or greater than $208,000 per year |
|
Obstetricians and gynecologists |
This wage is equal to or greater than $208,000 per year |
|
Neurologists |
This wage is equal to or greater than $208,000 per year |
|
General internal medicine physicians |
This wage is equal to or greater than $208,000 per year |
|
Family medicine physicians |
This wage is equal to or greater than $208,000 per year |
|
Emergency medicine physicians |
This wage is equal to or greater than $208,000 per year |
|
Dermatologists |
This wage is equal to or greater than $208,000 per year |
|
Cardiologists |
This wage is equal to or greater than $208,000 per year |
|
Anesthesiologists |
This wage is equal to or greater than $208,000 per year |
|
Orthodontists |
This wage is equal to or greater than $208,000 per year |
|
Oral and maxillofacial surgeons |
This wage is equal to or greater than $208,000 per year |
|
Surgeons, all other |
This wage is equal to or greater than $208,000 per year |
|
Pediatric surgeons |
This wage is equal to or greater than $208,000 per year |
|
Orthopedic surgeons, except pediatric |
This wage is equal to or greater than $208,000 per year |
|
Airline pilots, copilots, and flight engineers |
$202,180 per year |
|
Nurse anesthetists |
$195,610 per year |
[82] Report: “Key Issues in Analyzing Major Health Insurance Proposals.” Congressional Budget Office, December 18, 2008. <www.cbo.gov>
Page 100:
The process of educating and training new physicians can be lengthy, reflecting the complexity of medical care. After obtaining a four-year college degree (usually with a “pre-med” or related major), prospective physicians generally spend four years training in medical schools and then enroll in residency programs that can last from three to seven years, depending on the medical specialty they are pursuing.
[83] “2010 Financial Report of the United States Government.” U.S. Department of the Treasury, December 21, 2010. <www.fiscal.treasury.gov>
Page 245:
The federal government continues to make progress under the requirements of the Improper Payments Information Act of 2002 (IPIA)39 in reporting on the nature and extent of improper payments.40…
39 Pub. L. No. 107-300, 116 Stat. 2350 (Nov. 26, 2002), as amended by the Improper Payments Elimination And Recovery Act of 2010, Pub. L. No. 111-204, 124 Stat. 2224 (July 22, 2010). The IPIA requires federal executive branch entities to review all programs and activities, identify those that may be susceptible to significant improper payments, estimate and report the annual amount of improper payments for those programs, and implement actions to reduce improper payments.
40 IPIA defines an improper payment as any payment that should not have been made or that was made in an incorrect amount (including overpayments and underpayments) under statutory, contractual, administrative, or other legally applicable requirements. It includes any payment to an ineligible recipient, any payment for an ineligible service, any duplicate payment, payments for services not received, and any payment that does not account for credit for applicable discounts.
[84] Report: “Social Security Administration: Cases of Federal Employees and Transportation Drivers and Owners Who Fraudulently and/or Improperly Received SSA Disability Payments.” U.S. Government Accountability Office, June 25, 2010. <www.gao.gov>
Page 44:
The following are GAO’s [General Accountability Office’s] comments on the Social Security Administration’s [SSA] letter dated May 28, 2010.
1. In the report, we identify those cases where SSA has sent an overpayment notification letter to the individual. However, we do not believe that identifying fraudulent or improper payments after dollars have been disbursed is an effective internal control. Our work across the government has shown that once fraudulent or improper payments are made, the government is likely to only recover pennies on the dollar. Preventive controls are the most efficient and effective.
[85] Report: “Health Care Fraud: Information on Most Common Schemes and the Likely Effect of Smart Cards.” U.S. Government Accountability Office, January 2016. <www.gao.gov>
Page 1: “We have designated Medicare and Medicaid as high-risk programs because their size, scope, and complexity make them particularly vulnerable to fraud and abuse.”
[86] Report: “2020 Estimated Improper Payment Rates for Centers for Medicare & Medicaid Services (CMS) Programs.” U.S. Centers for Medicare & Medicaid Services, November 16, 2020. <www.cms.gov>
The Office of Management and Budget (OMB) has identified Medicare Fee-For-Service (FFS), Medicare Part C, Medicare Part D, Medicaid, and the Children’s Health Insurance Program (CHIP) as at-risk for significant improper payments. CMS [U.S. Centers for Medicare & Medicaid Services] utilizes improper payment measurement programs for these programs and continues to address the drivers of improper payment rates through aggressive corrective action plans.
[87] Report: “Health Care Fraud: Information on Most Common Schemes and the Likely Effect of Smart Cards.” U.S. Government Accountability Office, January 2016. <www.gao.gov>
Page 1: “Although there have been convictions for multimillion dollar schemes that defrauded federal health care programs, the extent of the problem is unknown as there are no reliable estimates of the magnitude of fraud within these programs or across the health care industry generally.”
[88] “Annual Report of the Departments of Health and Human Services and Justice: Health Care Fraud and Abuse Control Program FY 2021.” U.S. Departments of Health & Human Services and Justice, July 2022. <oig.hhs.gov>
Page 124:
Total Health Care Fraud and Abuse Control Resources
The table below sets forth HCFAC [Health Care Fraud and Abuse Control] funding, by agency, for health care fraud and abuse control activities in FY 2021, including sequester suspicion. The FBI also receives a stipulated amount of HIPAA [Health Insurance Portability and Accountability Act of 1996] funding for use in support of the Fraud and Abuse Control Program, which is shown below. Separately, CMS [Centers for Medicare and Medicaid Services] receives additional Mandatory Resources under the Medicare Integrity Program (section 1817(k)(4) of the Social Security Act). The inclusion of the activities supported with these funds is not required in this report, and this information is provided for informational purposes only. Since 2009, Congress has also appropriated annual amounts to help carry out health care fraud and abuse control activities within DOJ [Department of Justice] and HHS [Health and Human Services]. Those amounts are set forth as Discretionary Resources in the table below and the results of the efforts supported with these funds are contained within this report.
|
Mandatory Resources42 |
Fiscal Year 2021 |
|
Office of Inspector General |
$213,886,600 |
|
Health and Human Services Wedge43 |
40,908,373 |
|
Medicare Integrity Program44 |
941,463,113 |
|
MIP/Medicare (non-add) |
869,042,874 |
|
Medi-Medi (non-add) |
72,420,239 |
|
Department of Justice Wedge41 |
66,781,285 |
|
Federal Bureau of Investigation45 |
152,394,202 |
|
Subtotal, Mandatory HCFAC |
$1,415,433,573 |
|
Discretionary Resources |
|
|
Office of Inspector General |
$99,000,000 |
|
CMS Program Integrity |
616,000,000 |
|
CMS Program Integrity (Non-Add) |
596,000,000 |
|
Senior Medicare Patrols (ACL Non-Add) |
20,000,000 |
|
Department of Justice |
92,000,000 |
|
Subtotal, Discretionary HCFAC |
807,000,000 |
|
Grand Total, HCFAC |
$2,222,433,573 |
[89] Calculated with data from:
a) “FY2021 Payment Accuracy Dataset.” Payment Accuracy (An Official Website of the United States Government). Accessed November 8, 2022 at <www.paymentaccuracy.gov>
Tab: “All Program Results” <www.cfo.gov>
b) Dataset: “HH-1. Households by Type: 1940 to Present (Numbers in Thousands).” U.S. Census Bureau, Current Population Survey, November 2021. <www.census.gov>
NOTES:
[90] Calculated with data from:
a) “FY2021 Payment Accuracy Dataset.” Payment Accuracy (An Official Website of the United States Government). Accessed November 8, 2022 at <www.paymentaccuracy.gov>
Tab: “All Program Results” <www.cfo.gov>
b) Dataset: “HH-1. Households by Type: 1940 to Present (Numbers in Thousands).” U.S. Census Bureau, Current Population Survey, November 2021. <www.census.gov>
NOTES:
[91] Report: “2020 Estimated Improper Payment Rates for Centers for Medicare & Medicaid Services (CMS) Programs.” U.S. Centers for Medicare & Medicaid Services, November 16, 2020. <www.cms.gov>
In response to the COVID-19 Public Health Emergency (PHE), CMS [U.S. Centers for Medicare & Medicaid Services] exercised its enforcement discretion to adopt a temporary policy to suspend all improper payment-related engagement/communication or data requests to providers and state agencies between March and August. To minimize burden on providers and states, CMS modified some of the improper payment statistical methodologies to be able to timely report rates in the 2020 AFR [Agency Financial Report] based on data already collected at the time of the PHE or that providers or states voluntarily submitted. CMS will still meet the statutory national-level precision requirements that the rates are ± 3 percentage points at a 95% confidence interval. …
Medicaid and CHIP [Children’s Health Insurance Program] 2020 estimated improper payments are not comparable to years prior to 2019, due to the reintegration of the PERM [Payment Error Rate Measurement] eligibility component. …
CMS estimates Medicaid and CHIP improper payments through the Payment Error Rate Measurement (PERM) program. The improper payment rates are based on reviews of the FFS [fee-for-service], managed care, and eligibility components of Medicaid and CHIP in the year under review. The PERM program uses a 17-state rotational approach to measure the 50 states and the District of Columbia over a three-year period. By this approach, CMS measures each state once every three years and national improper payment rates include findings from the most recent three-year cycle measurements. Each time a cycle of states is measured, CMS utilizes the new findings and removes the respective cycle’s previous findings. The review period for the FY 2020 Medicaid and CHIP improper payment rate included claims submitted from July 1, 2018 through June 30, 2019.
The FY 2020 national Medicaid improper payment rate estimate is 21.36 percent, representing $86.49 billion in improper payments. The FY 2020 national CHIP improper payment rate estimate is 27.00 percent, representing $4.78 billion in improper payments. Factors that led to these improper payment rates include: …
• Based on the measurement of the first two cycles of states, the major drivers of the increased Medicaid and CHIP eligibility improper payments are a result of the following:
• Eligibility errors are mostly due to insufficient documentation to affirmatively verify eligibility determinations or non-compliance with eligibility redetermination requirements. The majority of the insufficient documentation errors represent both situations where:
• The required verification of eligibility data, such as income, was not done at all and
• There is indication the eligibility verification was initiated but there was no documentation to validate the verification process was completed, and non-compliance with eligibility redetermination requirements.
• The CHIP improper payment rate was also driven by claims where the beneficiary was incorrectly determined to be eligible for CHIP, but upon review was determined eligible for Medicaid, mostly related to beneficiary income calculations, household composition, and third party liability coverage.
• Non-compliance with requirements for provider revalidation of enrollment and rescreening.
• Continued non-compliance with provider enrollment, screening, and National Provider Identifier requirements.
[92] “FY2021 Payment Accuracy Dataset.” Payment Accuracy (An Official Website of the United States Government). Accessed November 8, 2022 at <www.paymentaccuracy.gov>
Tab: “All Program Results” (<www.cfo.gov>): “CHIP [Children’s Health Insurance Program] … Fiscal Year [=] 2021 … Outlays Amount ($M) [=] $16,879.46 … Improper Payment Amount ($M) [=] $5,373.67 … (FY20) IP Rate [=] 31.84%”
[93] Report: “2020 Estimated Improper Payment Rates for Centers for Medicare & Medicaid Services (CMS) Programs.” U.S. Centers for Medicare & Medicaid Services, November 16, 2020. <www.cms.gov>
In response to the COVID-19 Public Health Emergency (PHE), CMS [U.S. Centers for Medicare & Medicaid Services] exercised its enforcement discretion to adopt a temporary policy to suspend all improper payment-related engagement/communication or data requests to providers and state agencies between March and August. To minimize burden on providers and states, CMS modified some of the improper payment statistical methodologies to be able to timely report rates in the 2020 AFR [Agency Financial Report] based on data already collected at the time of the PHE or that providers or states voluntarily submitted. CMS will still meet the statutory national-level precision requirements that the rates are ± 3 percentage points at a 95% confidence interval. …
Medicaid and CHIP [Children’s Health Insurance Program] 2020 estimated improper payments are not comparable to years prior to 2019, due to the reintegration of the PERM [Payment Error Rate Measurement] eligibility component. …
CMS estimates Medicaid and CHIP improper payments through the Payment Error Rate Measurement (PERM) program. The improper payment rates are based on reviews of the FFS [fee-for-service], managed care, and eligibility components of Medicaid and CHIP in the year under review. The PERM program uses a 17-state rotational approach to measure the 50 states and the District of Columbia over a three-year period. By this approach, CMS measures each state once every three years and national improper payment rates include findings from the most recent three-year cycle measurements. Each time a cycle of states is measured, CMS utilizes the new findings and removes the respective cycle’s previous findings. The review period for the FY 2020 Medicaid and CHIP improper payment rate included claims submitted from July 1, 2018 through June 30, 2019.
The FY 2020 national Medicaid improper payment rate estimate is 21.36 percent, representing $86.49 billion in improper payments. The FY 2020 national CHIP improper payment rate estimate is 27.00 percent, representing $4.78 billion in improper payments. Factors that led to these improper payment rates include: …
• Based on the measurement of the first two cycles of states, the major drivers of the increased Medicaid and CHIP eligibility improper payments are a result of the following:
• Eligibility errors are mostly due to insufficient documentation to affirmatively verify eligibility determinations or non-compliance with eligibility redetermination requirements. The majority of the insufficient documentation errors represent both situations where:
• The required verification of eligibility data, such as income, was not done at all and
• There is indication the eligibility verification was initiated but there was no documentation to validate the verification process was completed, and non-compliance with eligibility redetermination requirements.
• The CHIP improper payment rate was also driven by claims where the beneficiary was incorrectly determined to be eligible for CHIP, but upon review was determined eligible for Medicaid, mostly related to beneficiary income calculations, household composition, and third party liability coverage.
• Non-compliance with requirements for provider revalidation of enrollment and rescreening.
• Continued non-compliance with provider enrollment, screening, and National Provider Identifier requirements.
[94] Webpage: “Health Care Services.” State of New Jersey Department of Human Services. Accessed November 25, 2011 at <www.state.nj.us>
Since 1995, most New Jersey Medicaid, including NJ FamilyCare beneficiaries, have been enrolled in managed care. With managed care, beneficiaries are enrolled in an HMO that manages their health care and provides services in addition to the wide array of Medicaid health benefits to which they are entitled. …
Health insurance for income-eligible families and children is provided through the NJ FamilyCare program, with assistance from the federally funded State Children’s Health Insurance Program or SCHIP. NJ FamilyCare helps financially eligible families (usually low-income workers in jobs without health benefits) obtain health insurance to cover the cost of routine physician visits, prescriptions, hospitalizations, lab tests, x-rays, eyeglasses for themselves and for their children and dental care for most children and for some adults.
[95] “Annual Report of the New Jersey Office of Legislative Services, Office of the State Auditor, For the Calendar Year Ended December 31, 2008.” By Richard L. Fair. NJ Office of the State Auditor, February 13, 2009. <www.njleg.state.nj.us>
Pages 18–19:
NJ FamilyCare Program
NJ FamilyCare (NJFC) is a federal and state funded health insurance program created to help New Jersey’s uninsured children and certain low-income parents and guardians have affordable health coverage. NJFC provides no cost or low-cost health insurance through managed care enrollment to uninsured parents and children with incomes up to 350 percent of the federal poverty level. …
Unreported Income
Some beneficiaries are underreporting income on their NJ FamilyCare (NJFC) application such as income from self-employment and rentals, interest, and dividends. NJFC applicants are required to list all jobs and employers for each working person in their household as well as other non-work income on their application and are asked to send in proof of all income. The vendor reviews the documentation submitted and screens applicants against the state’s wage, disability, and unemployment databases to verify the income reported. These databases do not include income from self-employment and rentals, interest, or dividends. Although beneficiaries authorize the Division of Taxation to release their tax returns to the NJFC program when signing their application, the division does not currently perform a computer match of all beneficiaries with state tax files.
A computer match of all 86,600 cases with eligible participants as of April 2007 with state tax files resulted in 60,800 cases with at least one household member that filed a 2006 state tax return. We identified 6,781 unique cases with $10,000 or more in self-employment income on their 2006 state tax return. A test of 70 of these cases disclosed that 21 failed to indicate that they were self-employed on their NJFC application. Based on the income reported on their tax returns, 18 of these 21 cases appeared ineligible and two appeared to be enrolled in the wrong plan. In three of these cases, participants were determined eligible in 2006 because they failed to report self-employment incomes of $295,000, $186,000, and $177,700 per their 2006 state tax returns.
The same computer match identified 873 cases with $85,000 or more in gross income reported on their 2006 state tax return. A test of 24 of these cases disclosed that five had either self-employment income, rental income, interest income, or dividend income that they failed to report on their application. Based on their tax returns, four of the five cases appeared ineligible and one appeared to be enrolled in the wrong plan. One case had eligible participants throughout 2006 despite unreported dividends of $137,000 and interest of $42,000 per their 2006 state tax return. Eligibility for the case continued despite the beneficiary failing to respond to the vendor’s request for tax returns.
The above test of 24 cases also disclosed that 15 had net gains of more than $100,000 on their 2006 state tax return with three having more than $700,000. Additional analysis identified 441 cases with eligible participants as of April 2007 with net gains of $10,000 or more on their 2006 state tax return. Sixty-five of those cases had a net gain of more than $100,000 while the median net gain was $34,000. Without access to a computer match against state tax returns, an unreported net gain would most likely go undetected. In addition, program regulations are unclear and do not provide sufficient guidance on how a net gain should be considered when determining eligibility. Program regulations should be changed to provide the vendor with better guidance on how to consider net gains when determining eligibility.
Although the vendor followed program regulations when verifying income, it appears that regulations that were intended to simplify the application process have made it easier for a beneficiary to underreport income. The addition of a post-enrollment and a periodic computer match of beneficiaries with state tax returns would assist the division in identifying unreported income.
[96] Report: “Covert Testing Exposes Weaknesses in the Durable Medical Equipment Supplier Screening Process.” United States Government Accountability Office, July 2008. <www.gao.gov>
Page 2 (of PDF):
Investigators easily set up two fictitious DMEPOS [durable medical equipment, prosthetics, orthotics, and supplies] companies using undercover names and bank accounts. GAO’s [Government Accountability Office’s] fictitious companies were approved for Medicare billing privileges despite having no clients and no inventory. CMS [Centers for Medicare and Medicaid Services] initially denied GAO’s applications in part because of this lack of inventory, but undercover GAO investigators fabricated contracts with nonexistent wholesale suppliers to convince CMS and its contractor, the National Supplier Clearinghouse (NSC), that the companies had access to DMEPOS items. The contact number GAO gave for these phony contracts rang on an unmanned undercover telephone in the GAO building. When NSC left a message looking for further information related to the contracts, a GAO investigator left a vague message in return pretending to be the wholesale supplier. As a result of such simple methods of deception, both fictitious DMEPOS companies obtained Medicare billing numbers. The following figure contains a redacted acceptance letter GAO received from CMS.
[97] Article: “Medicare Fraud: A $60 Billion Crime.” CBS News, October 23, 2009. <www.cbsnews.com>
The tiny medical supply company billed Medicare … a half million dollars while “60 Minutes” was there in August, but we never found anybody inside, and our phone calls were never returned.
[W]e went looking for a pharmacy at 7511 NW 73rd Street that billed Medicare $300,000 in charges. It turned out to be in the middle of a public warehouse storage area. …
[I]t’s usually people like 76-year-old Clara Mahoney who catch them.
She began to notice all sorts of crazy things turning up on her quarterly Medicare statements back in 2003—things that Medicare paid for on her behalf that she had never ordered, never wanted and never received. …
Mahoney … began calling Medicare to tell them that someone was ripping them off. But the only responses she received were letters saying that someone was looking into it. The bogus charges are still turning up on her statements. …
They have been “looking” into Mahoney’s issue for six years.
NOTE: Credit for bringing this article and its dating disparity to our attention belongs to Dustin Siggins [Commentary: “Occupy Debt.” By Dustin Siggins and Jonathan Rourke. <rightwingnews.com>]
[98] Article: “Confidentiality Cloaks Medicare Abuse.” By Mark Schoofs and Maurice Tamman. Wall Street Journal, December 22, 2010. <online.wsj.com>
Dr. Wayne took in more than $1.2 million from Medicare in 2008, according to a person familiar with the matter, a large portion of it from physical therapy. That’s more than 24 times the Medicare income of the average family doctor, according to a Wall Street Journal analysis of Medicare-claims data. …
Physical therapy, which cost Medicare almost $3.5 billion in 2008, offers a case study in how Medicare polices its payments. Even when Medicare identified providers whose physical-therapy billing raised red flags, it kept paying thousands or even millions of dollars, sometimes for years, The Wall Street Journal found. …
One Florida physician—not Dr. Wayne—made almost all his money from physical therapy, according to the Journal’s analysis of the 5% database. According to separate billing totals reviewed by The Wall Street Journal, this internal-medicine doctor took home more than $8.1 million from Medicare from 2007 through 2009. …
Dr. Rice billed Medicare nothing in 2007 for services she performed or supervised, according to a person familiar with her business. But starting in October 2008, billing under her provider number skyrocketed. In less than a year, Medicare received claims totaling over $11.6 million and paid out more than $7.1 million. …
Brooklyn physical therapist Aleksandr Kharkover billed Medicare for more than $2.5 million in 2008, according to a person familiar with his business, and received more than $1.8 million.
[99] “2009 Financial Crimes Report.” Federal Bureau of Investigation. <www.fbi.gov>
All health care programs are subject to fraud; however, Medicare and Medicaid programs are the most visible. Estimates of fraudulent billings to health care programs, both public and private, are estimated between three and ten percent of total health care expenditures. The fraud schemes are not specific to any area, but they are found throughout the entire country. The schemes target large health care programs, public and private, as well as beneficiaries. Certain schemes tend to be worked more often in certain geographical areas, and certain ethnic or national groups tend to also employ the same fraud schemes. The fraud schemes have, over time, become more sophisticated and complex and are now being perpetrated by more organized crime groups.
HCF [health care fraud] is expected to continue to rise as people live longer. This increase will produce a greater demand for Medicare benefits. As a result, it is expected that the utilization of long and short-term care facilities such as skilled nursing, assisted living, and hospice services will expand substantially in the future. Additionally, fraudulent billings and medically unnecessary services billed to health care insurers are prevalent throughout the country. These activities are becoming increasingly complex and can be perpetrated by corporate-driven schemes and systematic abuse by providers.
[100] Report: “Medicare Part D: Instances of Questionable Access to Prescription Drugs.” By Gregory D. Kutz. United States Government Accountability Office, October 4, 2011. <www.gao.gov>
Page 1:
My statement today summarizes our report,1 describing indications of doctor shopping in the Medicare Part D program for 14 categories of frequently abused prescription drugs.2 The objectives of the forensic audit and related investigation were to (1) determine the extent to which Medicare beneficiaries obtained frequently abused drugs from multiple prescribers, (2) identify examples of doctor shopping activity, and (3) determine the actions taken by the Centers for Medicaid & Medicare Services (CMS) to limit access to drugs for known abusers.
2 According to the Drug Enforcement Administration, doctor shopping generally refers to visits by an individual to several doctors, each of whom writes a prescription for a controlled substance. The individual will visit several pharmacies, receiving more of the drug than intended by any single physician, typically for the purpose of abuse.
Page 2:
Our analysis found that about 170,000 Medicare beneficiaries received prescriptions from five or more medical practitioners for the 12 classes of frequently abused controlled substances and 2 classes of frequently abused noncontrolled substances in calendar year 2008.3 This represented about 1.8 percent of the Medicare Part D beneficiaries who received prescriptions for these 14 classes of drugs during the same calendar year. These individuals incurred approximately $148 million in prescription drug costs4 for these drugs,5 much of which is paid by the Medicare program.
3 We selected the 14 classes of drugs and the five or more prescribers threshold based on our review of drug diversion literature and prior GAO [Government Accountability Office] work and discussions with a criminal investigator whose recognized expertise is in drug diversion and with an official representing state prescription drug monitoring programs.
5 The $148 million in prescription costs represents about 5 percent of total Medicare Part D prescription costs for these 14 classes of highly abused drugs. The prescription drug costs included in this study do not include related costs associated with obtaining prescriptions, such as the corresponding visits to the doctor’s office and emergency room. These costs are billed separately from the prescription drug claims.
Page 4: “According to the Department of Justice (DOJ), doctor shopping is the primary method to obtain highly addictive prescription opioids (for example, hydrocodone and oxycodone) for illegitimate use.8”
Page 7:
Case Details
• The beneficiary received prescriptions for a total of 3,655 oxycodone pills (a 1,679-day supply) from 58 different prescribers in 2008. The beneficiary received a prescription for at least 1 of the 14 selected drugs from at least 66 different prescribers, and she filled her prescriptions at 45 different pharmacies in 2008.
• A pharmacy discovered that the beneficiary was forging a prescription from a physician. The pharmacy has noted in its system that its store and other pharmacies in the chain should refuse to fill controlled substances prescriptions for this beneficiary.
• Another pharmacy refused to fill a prescription for the beneficiary, after believing that the beneficiary tried to fill a forged prescription at the store. The beneficiary has not returned to the store since that refusal.
• A physician who frequently treated the beneficiary was repeatedly asked for early refills of Oxycontin prescriptions. After the physician would no longer prescribe Oxycontin, the beneficiary’s medical visits to him ceased. The beneficiary did not inform the physician about seeing other physicians. The physician would not have prescribed any controlled substances had he known they were being prescribed by other physicians.
• Another physician stated that he was suspicious of the beneficiary’s need for the drugs because (1) the beneficiary stated a desire for Oxycontin because of an allergy to other drugs and (2) the beneficiary refused to see a specialist despite his repeated directions. The beneficiary quit seeing the physician after the physician refused to prescribe any more narcotics. The physician was not aware of any attempted forgeries, but stated that he would not be surprised because it is easy to forge prescriptions in Georgia. The physician stated that Georgia has no requirements that prescriptions be written on any type of special security paper and that an individual can simply print or copy a prescription at home using a personal computer and regular computer paper. …
Case Details
• The beneficiary received prescriptions for a total of 4,574 hydrocodone pills (a 994-day supply) from 25 different prescribers in 2008.
• A previous physician stated that the beneficiary was obligated to inform him about receiving other prescriptions for controlled substances. The physician stated that he did not know that other physicians were prescribing narcotics to the beneficiary. The physician stated that it was medically unnecessary, and possibly dangerous, to consume the amount of narcotics obtained by the beneficiary. Had he been informed that the beneficiary was receiving narcotics from other doctors, the physician would have ceased prescribing the drugs.
[101] Report: “Opioid Overdoses and the Limited Treatment of Opioid Use Disorder Continue to Be Concerns for Medicare Beneficiaries.” Office of Inspector General, U.S. Department of Health and Human Services, September 2022. <oig.hhs.gov>
Page 1:
As the nation continues to grapple with the effects of the COVID-19 pandemic, the opioid epidemic continues to surge. In 2021, there were an estimated 81,502 opioid-related overdose deaths in the United States—an all-time high.1
Accordingly, it is critical to monitor opioid use and access to treatment for beneficiaries with opioid use disorder as well as access to the opioid overdose-reversal drug naloxone. This data brief provides important information on these topics for beneficiaries in Medicare Part D in 2021. It builds on a series of data briefs released by the Office of Inspector General (OIG).2
Pages 12–13:
We based this study primarily on five data sources: Medicare Part D Prescription Drug Event (PDE) records, the First Databank, the Medicare Enrollment Database, the National Claims History File, and Part C Encounter Data. We also use the Center for Disease Control and Prevention’s (CDC’s) Morphine Milligram Equivalent (MME) conversion file.
PDE records are for prescriptions that beneficiaries received through Part D. They do not include prescriptions paid for through other programs, prescriptions paid for in cash, or illicitly purchased drugs. Part D sponsors submit a PDE record to CMS each time a drug is dispensed to a beneficiary enrolled in their plans. Each record contains information about the drug and beneficiary, as well as the identification numbers for the pharmacy and the prescriber.
To obtain descriptive information about the drugs, beneficiaries, and prescribers, we matched PDE records to data from the First DataBank, the National Claims History File, Part C Encounter Data, and CDC’s MME conversion file. The First DataBank contains information about each drug, such as the drug name, strength of the drug, and therapeutic class (for example, an opioid). The National Claims History File contains claims data from Medicare Parts A and B, including diagnosis codes and prescribed medications. Part C Encounter Data contain medical claims data, including diagnosis codes and prescribed medications, for beneficiaries enrolled in Medicare Advantage plans. CDC’s MME conversion file contains information about each opioid drug’s morphine milligram equivalence.41 For the purposes of this study, we use the term “prescription” to mean one PDE record.
Analysis of Opioid Overdoses
To determine the number of Part D beneficiaries who had an opioid overdose in 2021, we used inpatient and outpatient (including professional) claims data from the National Claims History File and Part C Encounter Data. We considered a beneficiary to have had an overdose if the beneficiary had at least one claim from Medicare Part A, B, or C with a diagnosis of an opioid poisoning from prescription or illicit opioids in 2021. …
Analysis of Part D Beneficiaries Receiving High Amounts of Opioids
We determined the amount of opioids that each beneficiary received in 2021. To do this, we calculated each beneficiary’s average daily morphine equivalent dose (MED).42 The MED converts opioids of different ingredients, strengths, and forms into equivalent milligrams of morphine. It allows us to sum dosages of different opioids to determine a beneficiary’s daily opioid level. …
We analyzed the MED data using the same criteria that we used in our previous analysis of the 2016, 2017, 2018, 2019, and 2020 data.45 We began by determining the extent to which beneficiaries received high amounts of opioids. To do this, we calculated each beneficiary’s average daily MED over each 90-day period in 2021. We determined that beneficiaries received high amounts of opioids if they exceeded an average daily MED of 120 mg for any 90-day period and had received opioids for 90 or more days in the year. The MED of 120 mg exceeds the 90-mg MED level that CDC recommends avoiding for patients with chronic pain.
[102] Report: “Opioid Overdoses and the Limited Treatment of Opioid Use Disorder Continue to Be Concerns for Medicare Beneficiaries.” Office of Inspector General, U.S. Department of Health and Human Services, September 2022. <oig.hhs.gov>
Page 3:
In 2021, a total of 199,169 beneficiaries received high amounts of opioids through Medicare Part D—i.e., each beneficiary had an average morphine equivalent dose (MED) of greater than 120 mg a day for at least 3 months. MED is a measure that converts all the various opioids and strengths into one standard value. These beneficiaries did not have cancer and were not in hospice care.9
The number of beneficiaries receiving high amounts of opioids is a decrease from 2020, when 225,463 beneficiaries received high amounts. It is also a decline from previous years. (See Appendix B for more information about previous years.)
Although beneficiaries may receive opioids for legitimate purposes, these amounts raise concern as opioids carry a number of health risks.10 CDC [U.S. Centers for Disease Control] recommends that prescribers use caution when ordering opioids at any dosage and avoid increasing dosages to the equivalent of 90 mg or more MED a day for chronic pain or carefully justify the decision to increase to this level.11
[103] Report: “Opioid Overdoses and the Limited Treatment of Opioid Use Disorder Continue to Be Concerns for Medicare Beneficiaries.” Office of Inspector General, U.S. Department of Health and Human Services, September 2022. <oig.hhs.gov>
Pages 3–4:
Two subgroups of beneficiaries in particular are at serious risk of misuse or overdose: (1) beneficiaries who receive extreme amounts of opioids and (2) beneficiaries who appear to be doctor shopping. Other Part D beneficiaries may also be at serious risk but do not fall into either group.
A total of 23,186 beneficiaries were in these subgroups.12 (This does not include beneficiaries who have cancer or were in hospice care.) Specifically, 21,493 beneficiaries received extreme amounts of opioids (i.e., had an average daily MED greater than 240 mg for 12 months) and 1,805 beneficiaries appeared to be doctor shopping (i.e., received high amounts of opioids and had 4 or more prescribers and 4 or more pharmacies). A total of 112 beneficiaries were in both groups.
The number of beneficiaries at serious risk in 2021 (23,186 beneficiaries) declined 21 percent from 2020, when OIG identified 29,306 beneficiaries.13 Of note, the larger drop occurred in the number of beneficiaries who received extreme amounts of opioids. In 2021, there were about a fifth fewer beneficiaries who received extreme amounts of opioids than in 2020.14 (See Appendix B for more detailed information.)
Receiving extreme amounts of opioids or receiving high amounts of opioids from multiple prescribers or pharmacies raises concern. It may signal that a beneficiary’s care is not being monitored or coordinated properly or that a beneficiary’s care needs to be reassessed.15 It may also indicate that a beneficiary is seeking medically unnecessary drugs—perhaps to use them recreationally or to divert them—or that a beneficiary is addicted to opioids and at risk of overdose.
Furthermore, a beneficiary’s receiving high amounts of opioids and having multiple prescribers and pharmacies may indicate that prescribers are not checking the beneficiary’s opioid history before prescribing. States maintain databases—called prescription drug monitoring programs—that track prescriptions for controlled substances.16 Prescribers can check these databases before ordering opioids to determine whether a beneficiary is already receiving opioids ordered by other prescribers.17
Raising particular concern, a total of 244 beneficiaries had an average daily MED of more than 1,000 mg a day for the entire year.
[104] Report: “Opioid Overdoses and the Limited Treatment of Opioid Use Disorder Continue to Be Concerns for Medicare Beneficiaries.” Office of Inspector General, U.S. Department of Health and Human Services, September 2022. <oig.hhs.gov>
Page 5:
In 2021, 1.1 million Medicare beneficiaries—1,100,884—had a diagnosis of opioid use disorder.18 Opioid use disorder is a problematic pattern of opioid use that leads to clinically significant impairment or distress.19 It is a chronic condition that can be treated with certain medications that have been shown to decrease illicit opioid use and opioid-related overdose deaths. When these medications are combined with behavioral therapy or counseling, it is referred to as medication-assisted treatment (MAT).20
Diagnosing opioid use disorder requires a thorough evaluation that may include checking a patient’s history of opioid prescriptions or testing a patient’s urine.21 To receive a diagnosis, a patient must meet two or more diagnostic criteria, such as craving opioids or taking opioids in larger amounts or over a longer period than intended.22
[105] Report: “Opioid Overdoses and the Limited Treatment of Opioid Use Disorder Continue to Be Concerns for Medicare Beneficiaries.” Office of Inspector General, U.S. Department of Health and Human Services, September 2022. <oig.hhs.gov>
Pages 4–5:
A total of 26,245 prescribers ordered opioids for at least 1 beneficiary at serious risk of opioid misuse or overdose (i.e., a beneficiary who received extreme amounts of opioids or appeared to be doctor shopping in 2021). The vast majority of these prescribers each ordered opioids for only one or two of these beneficiaries. Some prescribers ordered for many more.
A total of 98 prescribers stand out as having questionable prescribing; they were far outside the norm with their prescribing and warrant further scrutiny. They ordered opioids for the highest numbers of beneficiaries at serious risk. Specifically, 68 prescribers each ordered opioids for at least 27 beneficiaries who received extreme amounts of opioids in 2021. Further, 35 prescribers each ordered opioids for at least 6 beneficiaries who appeared to be doctor shopping. Five prescribers ordered opioids for high numbers of beneficiaries in both groups at serious risk.
The number of prescribers with questionable prescribing for beneficiaries at serious risk was steady, with 98 prescribers with questionable prescribing. By contrast, between 2016 and 2020 the number of prescribers with questionable opioid prescribing declined by about 30 percent each year. (See Appendix C for more information about previous years.)
Although opioids may be necessary for some patients, prescribing to an unusually high number of beneficiaries at serious risk raises concerns. It may indicate that beneficiaries are receiving poorly coordinated care and could be in danger of overdose or dependence. It may also signal that prescribers are not checking State prescription drug monitoring databases, or that these databases do not have current data.
Prescribing to an unusually high number of beneficiaries at serious risk could also indicate that the prescriber is ordering medically unnecessary drugs that could be diverted for resale or recreational use. Another possibility is that the prescriber’s identification has been sold or stolen and is being used for illegal purposes.
In total, these 98 prescribers ordered 50,554 opioid prescriptions—totaling $15.1 million of Part D costs—for beneficiaries at serious risk in 2021.
[106] Report: “Opioid Use in Medicare Part D Continued to Decline in 2019, but
Vigilance Is Needed as COVID-19 Raises New Concerns.” Office of Inspector General, U.S. Department of Health and Human Services, August 2020. <oig.hhs.gov>
Page 5:
Examples of Beneficiaries at Serious Risk of Misuse or Overdose
A Missouri beneficiary received 64 opioid prescriptions in 2019. In total, this beneficiary received 12,330 opioid pills and had an average daily MED [morphine equivalent dose] of 2,151 mg for the year. All of these prescriptions were ordered by just two prescribers: a family medicine physician and a nurse practitioner.
A beneficiary from Colorado received 36 opioid prescriptions from 10 prescribers and filled these prescriptions at 14 different pharmacies. In 1 month alone, this beneficiary filled seven opioid prescriptions at six pharmacies. These included prescriptions for hydromorphone and both short- and long-acting oxycodone. They were ordered by four different prescribers.
Page 7:
Examples of Prescribers Who Ordered Opioids for Large Numbers of Beneficiaries At Serious Risk
A Florida physician ordered 1,707 opioids for 72 beneficiaries who received extreme amounts of opioids in 2019. Almost half of these prescriptions were for oxycodone. In total, Part D paid almost $600,000 for these prescriptions.
A South Carolina physician ordered 130 opioids for 28 beneficiaries who appeared to be doctor shopping. This doctor ordered 14 prescriptions for fentanyl and oxycodone for a beneficiary who received extreme amounts of opioids and appeared to be doctor shopping.
[107] Webpage: “About the Survey.” U.S. Department of Health and Human Services, Substance Abuse and Mental Health Services Administration. Accessed November 9, 2022 at <nsduhweb.rti.org>
Project Description
The National Survey on Drug Use and Health (NSDUH) is a nationwide study that provides up-to-date information on tobacco, alcohol, and drug use, mental health and other health-related issues in the United States.
Each year, NSDUH interviews approximately 70,000 people age 12 and older for this important study. The study results are released each Fall, and are used to inform public health programs and policies.
NSDUH is authorized by Section 505 of the Public Health Service Act, which requires annual surveys to collect data on the level and patterns of substance use.
The Substance Abuse and Mental Health Services Administration (SAMHSA), an agency in the U.S. Department of Health and Human Services HHS, sponsors NSDUH. SAMHSA’s Center for Behavioral Health Statistics and Quality (CBHSQ), oversees all aspects of the study including data collection, analysis and reporting.
[108] Report: “Key Substance Use and Mental Health Indicators in the United States: Results From the 2020 National Survey on Drug Use and Health.” Substance Abuse and Mental Health Services Administration, U.S. Department of Health and Human Services, October 2021. <www.samhsa.gov>
Pages 16–17:
Misuse of Psychotherapeutic Drugs
The 2020 NSDUH assessed the use and misuse of psychotherapeutic drugs currently or recently available by prescription in the United States, including prescription stimulants, tranquilizers or sedatives (e.g., benzodiazepines), and pain relievers. In NSDUH, misuse of prescription drugs was defined as use in any way not directed by a doctor, including use without a prescription of one’s own; use in greater amounts, more often, or longer than told to take a drug; or use in any other way not directed by a doctor. Misuse of over-the-counter (OTC) drugs was not included.
Among people aged 12 or older in 2020, 5.8 percent (or 16.1 million people) misused prescription psychotherapeutic drugs in the past year…. The percentage was highest among young adults aged 18 to 25 (9.5 percent or 3.2 million people), followed by adults aged 26 or older (5.6 percent or 12.2 million people), then by adolescents aged 12 to 17 (2.8 percent or 688,000 people)….
Of the prescription drugs presented in this report, prescription pain relievers were the most commonly misused by people aged 12 or older. The 16.1 million people in 2020 who misused prescription psychotherapeutic drugs in the past year included 9.3 million people who misused prescription pain relievers, 6.2 million people who misused prescription tranquilizers or sedatives (including 4.8 million past year misusers of benzodiazepines), and 5.1 million people who misused prescription stimulants….
[109] Webpage: “Prescription Opioid Overdose Death Maps.” U.S. Centers for Disease Control and Prevention. Last updated June 6, 2022. <www.cdc.gov>
[110] Data on murders are more accurate than for any other crime because the act of murder produces a dead body.† However, the FBI’s national estimates of murder are incomplete because they:
A 2014 report by the U.S. Department of Justice (DOJ) explains that data reported by the CDC from death certificates provide “more accurate homicide trends at the national level” and “consistently” show “a higher number and rate of homicides in the United States compared” to FBI data.‡
Nevertheless, death certificates tend to overcount murders because they include:
The 2014 DOJ report states, “A more comprehensive understanding of homicide in the United States can perhaps be achieved by combining the strengths of the two data collection systems.”‡ Therefore, Just Facts uses data from both sources and a scholarly journal to produce murder estimates. This yields figures that are higher than the FBI’s estimates and 4.2% lower than the number of homicides recorded on death certificates. The precise sources used for these calculations are documented in the forthcoming footnote.
NOTES:
[111] Calculated with data from:
a) Dataset: “Homicide Injury Deaths and Rates Per 100,000, 1999–2020.” Centers for Disease Control and Prevention, National Center for Injury Prevention and Control. Accessed September 28, 2022 at <wisqars.cdc.gov>
b) Dataset: “Homicide Mortality, Quarterly Provisional Estimates.” U.S. Centers for Disease Control and Prevention, National Center for Health Statistics. Accessed October 26, 2022 at <www.cdc.gov>
c) Paper: “Homicides by Police: Comparing Counts From the National Violent Death Reporting System, Vital Statistics, and Supplementary Homicide Reports.” By Catherine Barber and others. American Journal of Public Health, May 2016. Pages 922–927. <ajph.aphapublications.org>
d) Report: “2019 Crime in the United States.” Federal Bureau of Investigation, Criminal Justice Information Services, September 2020. <ucr.fbi.gov>
“Expanded Homicide Data Table 15: Justifiable Homicide by Weapon, Private Citizen, 2015–2019.” <ucr.fbi.gov>
NOTE: An Excel file containing the data and calculations is available upon request.
[112] Report: “Underpayment by Medicare and Medicaid.” American Hospital Association, February 2022. <www.aha.org>
Page 1: “[A]s a condition for receiving federal tax exemption for providing health care to the community, not-for-profit hospitals are required to care for Medicare and Medicaid beneficiaries. Also, Medicare and Medicaid account for more than 60 percent of all care provided by hospitals. Consequently, very few hospitals can elect not to participate in Medicare and Medicaid.”
[113] Report: “Underpayment by Medicare and Medicaid.” American Hospital Association, February 2022. <www.aha.org>
Pages 1–2:
Each year, the American Hospital Association (AHA) collects aggregate information on the payments and costs associated with care delivered to beneficiaries of Medicare and Medicaid by U.S. hospitals. The data used to generate these numbers come from the AHA’s Annual Survey of Hospitals, which is the nation’s most comprehensive source of hospital financial data. …
Payment rates for Medicare and Medicaid, with the exception of managed care plans, are set by law rather than through a negotiation process, as with private insurers. These payment rates are currently set below the costs of providing care, resulting in underpayment.
Underpayment is the difference between the costs incurred and the reimbursement received for delivering care to patients. Underpayment occurs when the payment received is less than the costs of providing care, i.e., the amount paid by hospitals for the personnel, technology and other goods and services required to provide hospital care is more than the amount paid to them by Medicare or Medicaid for providing that care. …
In the aggregate, both Medicare and Medicaid payments fell below costs in 2020:
• Combined underpayments were $100.4 billion in 2020, up from $75.8 billion in 2019. The 2020 underpayment includes a shortfall of $75.6 billion for Medicare and $24.8 billion for Medicaid.
• For Medicare, hospitals received payment of only 84 cents for every dollar spent by hospitals caring for Medicare patients in 2020.
• For Medicaid, hospitals received payment of only 88 cents for every dollar spent by hospitals caring for Medicaid patients in 2020.
• In 2020, 67 percent of hospitals received Medicare payments less than cost, while 62 percent of hospitals received Medicaid payments less than cost.
[114] Webpage: “Medicaid Benefits: Inpatient Hospital Services, Other Than in an Institution for Mental Disease.” Henry J. Kaiser Family Foundation. Accessed November 9, 2022 at <www.kff.org>
Timeframe: 2018 … Limits on services … Alaska [=] Must be prior authorized … Colorado [=] Prior authorization is required for transplants and bariatric surgery … Connecticut [=] Prior authorization on inpatient admissions … Florida [=] Up to 45 days per fiscal year for recipients age 21 years or older … Georgia [=] Must be medically necessary … Indiana [=] Prior approval for non-emergency admissions other than deliveries; second opinions required for specified procedures … Missouri [=] Inpatient hospital admissions must be certified as medically necessary and appropriate … Oklahoma [=] General acute care inpatient hospital services are limited to 24 days per individual per State fiscal year … Oregon [=] In Oregon limits are based upon the condition/treatment pair and not the facility type. The physician would prior authorize the service to be performed in the hospital … Texas [=] Spell of illness limitation of 30 days … Virginia [=] service authorization required … Washington [=] Inpatient rehabilitation requires prior authorization and concurrent review for length of stay … West Virginia [=] All inpatient admissions, with the exception of those related to labor and delivery, are subject to medical necessity review and certification of admission by the Utilization Management Contractor … Wisconsin [=] A small number of services require prior approval to be covered or to receive enhanced reimbursement rates … Wyoming [=] Prior authorization is required for acute psych, rehab, transplants and some other surgeries
[115] United States Code Title 42, Chapter 7, Subchapter XVIII, Part E, Section 1395dd: “Examination and Treatment for Emergency Medical Conditions and Women in Labor.” Accessed November 9, 2022 at <www.law.cornell.edu>
(a) Medical Screening Requirement
In the case of a hospital that has a hospital emergency department, if any individual (whether or not eligible for benefits under this subchapter) comes to the emergency department and a request is made on the individual’s behalf for examination or treatment for a medical condition, the hospital must provide for an appropriate medical screening examination within the capability of the hospital’s emergency department, including ancillary services routinely available to the emergency department, to determine whether or not an emergency medical condition (within the meaning of subsection (e)(1)) exists.
(b) Necessary Stabilizing Treatment for Emergency Medical Conditions and Labor
(1) In General
If any individual (whether or not eligible for benefits under this subchapter) comes to a hospital and the hospital determines that the individual has an emergency medical condition, the hospital must provide either—
(A) within the staff and facilities available at the hospital, for such further medical examination and such treatment as may be required to stabilize the medical condition, or
(B) for transfer of the individual to another medical facility in accordance with subsection (c). …
(e) Definitions
In this section:
(1) The term “emergency medical condition” means—
(A) a medical condition manifesting itself by acute symptoms of sufficient severity (including severe pain) such that the absence of immediate medical attention could reasonably be expected to result in—
(i) placing the health of the individual (or, with respect to a pregnant woman, the health of the woman or her unborn child) in serious jeopardy,
(ii) serious impairment to bodily functions, or
(iii) serious dysfunction of any bodily organ or part; or
(B) with respect to a pregnant woman who is having contractions—
(i) that there is inadequate time to effect a safe transfer to another hospital before delivery, or
(ii) that transfer may pose a threat to the health or safety of the woman or the unborn child.
(2) The term “participating hospital” means a hospital that has entered into a provider agreement under section 1395cc of this title.
(3)
(A) The term “to stabilize” means, with respect to an emergency medical condition described in paragraph (1)(A), to provide such medical treatment of the condition as may be necessary to assure, within reasonable medical probability, that no material deterioration of the condition is likely to result from or occur during the transfer of the individual from a facility, or, with respect to an emergency medical condition described in paragraph (1)(B), to deliver (including the placenta).
[116] Report: “EMTALA: Access to Emergency Medical Care.” By Edward C. Liu. Congressional Research Service, July 1, 2010. <www.everycrsreport.com>
Page 2 (of PDF):
The Emergency Medical Treatment and Active Labor Act (EMTALA) ensures universal access to emergency medical care at all Medicare participating hospitals with emergency departments. Under EMTALA, any person who seeks emergency medical care at a covered facility, regardless of ability to pay, immigration status, or any other characteristic, is guaranteed an appropriate screening exam and stabilization treatment before transfer or discharge. Failure to abide by these requirements can subject hospitals or physicians to civil monetary sanctions or exclusion from Medicare. Hospitals may also be subject to civil liability under the statute for personal injuries resulting from the violation.
Page 1:
Only hospitals that (1) participate in Medicare and (2) maintain an emergency department are required to screen patients under EMTALA.7 …
7 … Although the screening and stabilization requirements are phrased such that they apply to “hospitals” generally, enforcement of EMTALA is only authorized against hospitals that have entered into a Medicare provider agreement.
[117] Report: “Underpayment by Medicare and Medicaid.” American Hospital Association, February 2022. <www.aha.org>
Page 1: “[A]s a condition for receiving federal tax exemption for providing health care to the community, not-for-profit hospitals are required to care for Medicare and Medicaid beneficiaries. Also, Medicare and Medicaid account for more than 60 percent of all care provided by hospitals. Consequently, very few hospitals can elect not to participate in Medicare and Medicaid.”
[118] Report: “The Impact of EMTALA on Physician Practices.” By Carol K. Kane. American Medical Association, February 2003. <www.researchgate.net>
Pages 2–3:
We measure the financial impact of EMTALA [Emergency Medical Treatment and Active Labor Act] on physicians’ practices by the amount of bad debt incurred from the provision of EMTALA mandated care. Bad debt is associated with the provision of services for which payment was expected but not received. It is not associated with the provision of charity care for which either no payment is expected, or only payment at a reduced rate. Moreover, bad debt is not associated with the provision of services for which a reduced fee has been negotiated with an insurer. For example, the difference between a physician’s usual charge for a certain service and the fee that a Medicaid HMO [health maintenance organization] pays does not amount to bad debt. If, however, a Medicaid HMO patient was obligated to make a copayment and did not, that portion of the bill would be considered bad debt; that payment was expected but not received. …
… Not surprisingly, these figures were largest among emergency medicine physicians, all of whom reported at least some bad debt associated with EMTALA in 2000, with an average of 61.0% of bad debt attributed to that source, or $138,300.
Page 4:
Emergency medicine physicians attributed 61.0% of the bad debt they incurred in 2000 to EMTALA, or $138,300 per year. Across all specialties EMTALA related bad debt amounted to $12,300 per self-employed physician in 2000, or nearly $4.2 billion dollars in the aggregate.
The $4.2 billion estimate likely overstates of the impact of EMTALA on physician net income. First, looking only at the level of bad debt ignores that EMTALA may have had, in part, a positive revenue impact on physicians. If patient volume is greater under EMTALA than it would have been in its absence, to the extent that physicians are able to collect payment for services covered under the scope of EMTALA, revenue from screening and stabilization will be greater than it otherwise would have been. Second, some of the bad debt attributable to EMTALA would have been incurred even in the absence of this legislation—providing screening and stabilization is, after all, the business of hospital EDs [emergency departments].
[119] Report: “The Impact of EMTALA on Physician Practices.” By Carol K. Kane. American Medical Association, February 2003. <www.researchgate.net>
Page 1:
The data in this report are from the American Medical Association’s 2001 Patient Care Physician Survey (PCPS). The PCPS is a nationally representative survey of post-residency, non-federal, patient care physicians that is conducted via mail and phone interviews. Physicians surveyed in the PCPS were asked how many hours they spent providing EMTALA [Emergency Medical Treatment and Active Labor Act] mandated care in a typical week of practice and asked for the percent of their 2000 bad debt that was associated with such care.
Page 3: “Emergency medicine physicians averaged 22.9 hours of EMTALA mandated care per week, about half of their total patient care hours, and 16.4% of those who provided such care averaged more than 40 hours per week.”
NOTE: For facts about what constitutes a scientific survey and the factors that impact their accuracy, visit Just Facts’ research on Deconstructing Polls & Surveys.
[120] Public Law 111-148: “Patient Protection and Affordable Care Act.” 111th U.S. Congress. Signed into law by Barack Obama on March 23, 2010. <www.congress.gov>
Title I—Quality, Affordable Health Care for All Americans …
Subtitle C—Quality Health Insurance Coverage for All Americans …
Part I—Health Insurance Market Reforms …
Subpart I—General Reform …
Sec. 2704. Prohibition of preexisting condition exclusions or other discrimination based on health status.
(a) In General.—A group health plan and a health insurance issuer offering group or individual health insurance coverage may not impose any preexisting condition exclusion with respect to such plan or coverage. …
Sec. 2708. Prohibition on Excessive Waiting Periods.
A group health plan and a health insurance issuer offering group or individual health insurance coverage shall not apply any waiting period (as defined in section 2704(b)(4)) that exceeds 90 days.
[121] Report: “Private Health Insurance Provisions in PPACA [Patient Protection and Affordable Care Act] (P.L. 111-148).” By Hinda Chaikind and others. Congressional Research Service, April 15, 2010. <www.everycrsreport.com>
Page 3: “Immediate Individual and Group Market Reforms … providing coverage for preexisting health conditions for enrollees under age 19….”
Pages 11–12:
The law will apply new federal health insurance standards to group health plans as well as health insurance coverage offered in the individual, small group, and large group markets (depending on the standard), effective for plan years beginning on or after January 1, 2014. Among the insurance reforms are provisions that will subject new plans to the following requirements: …
• Prohibit group health plans (new and grandfathered) and issuers in the individual and group markets from excluding coverage for preexisting health conditions.34 (A “preexisting health condition” is a medical condition that was present before the date of enrollment for health coverage, whether or not any medical advice, diagnosis, care, or treatment was recommended or received before such date. Excluding coverage for preexisting conditions refers to the case in which an applicant for coverage is offered a health insurance policy but that policy does not provide benefits for certain medical conditions.)
• Prohibit group health plans and issuers in the individual and group markets from basing eligibility for coverage on health status-related factors.35 (Such factors include health status, medical condition (including both physical and mental illness), claims experience, receipt of health care, medical history, genetic information, evidence of insurability (including conditions arising out of acts of domestic violence), disability, and any other health status-related factor determined appropriate by the Secretary). …
• Prohibit group health plans and issuers in the group market (new and grandfathered) from imposing a waiting period greater than 90 days.37 (A “waiting period” refers to the time period that must pass before an individual is eligible to use health benefits.)
• Require individual and group health insurance issuers to offer coverage on a guaranteed issue and guaranteed renewal basis.38 (“Guaranteed issue” in health insurance is the requirement that an issuer accept every applicant for health coverage. “Guaranteed renewal” in health insurance is the requirement on an issuer to renew group coverage at the option of the plan sponsor [for example, employer] or individual coverage at the option of the enrollee. Guaranteed issue and renewal alone would not guarantee that the insurance offered is affordable.)
• Require issuers in the individual and small group markets to determine premiums for such coverage using adjusted community rating rules.39 (“Adjusted, or modified, community rating” prohibits issuers from pricing health insurance policies based on health factors, but allows it for other key characteristics such as age or gender.) Under the law, premiums will vary based only on the following risk factors: self-only or family enrollment; rating area,40 as specified by the state; age (by no more than a 3:1 ratio across age rating bands established by the Secretary, in consultation with the National Association of Insurance Commissioners (NAIC)), and tobacco use (by no more than 1.5:1 ratio).
[122] Webpage: “Can I Get Coverage if I Have a Pre-Existing Condition?” U.S. Department of Health & Human Services. Accessed November 15, 2022 at <www.hhs.gov>
Can I get coverage if I have a pre-existing condition?
Yes. Under the Affordable Care Act, health insurance companies can’t refuse to cover you or charge you more just because you have a “pre-existing condition”—that is, a health problem you had before the date that new health coverage starts. They also can’t charge women more than men.
The only exception to the pre-existing coverage rule is for grandfathered individual health insurance plans—the kind you buy yourself, not through an employer. They don’t have to cover pre-existing conditions.
[123] Webpage: “Exploring Coverage Options for Small Businesses.” U.S. Department of Health & Human Services. Accessed November 15, 2022 at <www.healthcare.gov>
90-Day Maximum Waiting Period
If you offer health insurance to your employees, you must offer it to all eligible employees when they become eligible for health coverage.
[124] Book: Economics For Dummies (2nd edition). By Sean Flynn (PhD., Assistant Professor of Economics, Scripps College). Wiley 2011.
Page 223:
People who already have medical problems have preexisting conditions. Health insurance has difficulty coping with preexisting conditions due to adverse selection, which occurs when insurance is disproportionately purchased by those who are more likely to need costly reimbursements in the future. Adverse selection can drive up insurance rates and even kill off an insurance market altogether. (For details on adverse selection in auto insurance markets, see Chapter 11.)
To see how adverse selection wreaks havoc on health insurance markets, suppose an insurance company offers health insurance to a large group of people—say, the population of Massachusetts. For those with preexisting conditions, purchasing insurance is a no-brainer, because they’re certain that their future healthcare bills will be larger than their insurance premiums. But the money to pay for their future medical bills has to come from somewhere. With all the sick people purchasing insurance, the insurance company knows that future treatment costs will be high. The only way to cover those costs is to charge high premiums, getting enough money out of those without preexisting conditions to pay the expected costs.
Those without preexisting conditions will react the same way people react to higher prices when considering any good or service: Some will stop buying the product. Their dropping out of the insurance market makes things even worse for the insurance company, because it’ll be forced to raise premiums even higher. But by raising insurance premiums, even more healthy people will choose not to purchase health insurance, and premiums will go up again.
[125] Book: Accounting Fundamentals for Health Care Management (3rd edition). By Steven A. Finkler, Thad Calabrese, and David M. Ward. Jones & Bartlett Learning, 2019.
Page 26:
Why does the law [2010 Affordable Care Act] have penalties for those who do not purchase health insurance? Part of the law eliminates the ability of insurance companies to not cover services for preexisting medical conditions. Preexisting conditions would have to be covered by insurers, and the health insurance premium would be required by law to be the same for someone with such a condition as for someone without that condition. This is a great benefit to people who have long-term illnesses and attempt to get insurance coverage. However, unless there is a requirement or strong incentive for everyone to have health insurance, many people are likely to only buy health insurance when and if they become ill, and the illness would be covered. If many people went that route, then insurance would become prohibitively expensive. In other words, healthier populations (referred to as “young invincibles” in policy debates) are needed in the insured pool; these individuals pay for health insurance but are less likely to utilize services than those with long-term health concerns. Because insurance premiums do not differentiate between these two types of insured individuals, the healthier population pays higher premiums that effectively subsidize the sicker population that pays lower premiums. Imagine if no one purchased fire insurance until his or her house caught on fire. Insurance works by spreading risk across a large population, some of whom incur a loss, and most of whom don’t. Fire insurance works because many people pay small premiums (i.e., small compared to the cost of rebuilding their house if it burns down) and only a few houses actually burn down. All homeowners share the risk of a loss due to fire. If the only people who bought fire insurance were the ones who had fires, then the annual premium would cost as much or more than the cost of the house. No one could afford insurance under such conditions.
This means that if individuals are covered for preexisting conditions but don’t have to buy insurance until they get sick, premiums for everyone could rise so high as to make it nearly impossible for anyone to afford health insurance.
[126] Working paper: “The Effect of State Community Rating Regulations on Premiums and Coverage in the Individual Health Insurance Market.” By Bradley Herring and Mark V. Pauley. U.S. Department of Health and Human Services, August 2006. <aspe.hhs.gov>
Page 9:
The log of condition-related expense is also statistically significant in both data sets, implying that families with the presence of high-risk chronic conditions do appear to pay, on average, higher premiums in the individual market. However, the economic magnitude of this effect is modest, implying that there is a high level of pooling. Families with health conditions that are twice as expensive to treat pay premiums that are only 11.5–15.5 percent higher than average. If insurers knew or could have known about the chronic condition and its effect on expected expense, this result implies that, somehow, those with chronic conditions that make them twice as expensive as average spread 85 percent or more of that risk to premiums paid by others.
[127] Article: “New York Offers Costly Lessons on Insurance.” By Anemona Hartocollis. New York Times, April 17, 2010. <www.nytimes.com>
In 1993, motivated by stories of suffering AIDS [acquired immunodeficiency syndrome] patients, the state became one of the first to require insurers to extend individual or small group coverage to anyone with pre-existing illnesses. …
Healthy people, in effect, began to subsidize people who needed more health care. The healthier customers soon discovered that the high premiums were not worth it and dropped out of the plans. The pool of insured people shrank to the point where many of them had high health care needs. Without healthier people to spread the risk, their premiums skyrocketed, a phenomenon known in the trade as the “adverse selection death spiral.” …
At the same time, New York has the highest average annual premiums for individual policies: $6,630 for single people and $13,296 for families in mid-2009, more than double the nationwide average, according to America’s Health Insurance Plans, an industry group.
[128] Report: “Newly Enrolled Members in the Individual Health Insurance Market After Health Care Reform: The Experience From 2014 and 2015.” Blue Cross and Blue Shield Association, March 20, 2016. <www.bcbs.com>
Page 2:
Comparing the health status and use of medical services among those who enrolled in individual coverage before and after the ACA [Affordable Care Act] took effect, as well as those with employer-based health insurance, the study finds that:
• Members who newly enrolled in BCBS [Blue Cross and Blue Shield] individual health plans in 2014 and 2015 have higher rates of certain diseases such as hypertension, diabetes, depression, coronary artery disease, human immunodeficiency virus (HIV) and Hepatitis C than individuals who already had BCBS individual coverage.
• Consumers who newly enrolled in BCBS individual health plans in 2014 and 2015 received significantly more medical services in their first year of coverage, on average, than those with BCBS individual plans prior to 2014 who maintained BCBS individual health coverage into 2015, as well as those with BCBS employer-based group health coverage.
• The new enrollees used more medical services across all sites of care—including inpatient hospital admissions, outpatient visits, medical professional services, prescriptions filled and emergency room visits.
Page 3:
Percentage Difference in 2015 Prevalence of Select Conditions Between Individuals Who Enrolled Prior to 2014 Versus Newly Enrolled in 2014 and 2015 (Based on the First Nine Months of 2015 Medical Claims Data)
Hypertension 24%
Diabetes 94%
Depression 52%
Coronary Artery Disease 32%
Hepatitis C 140%
HIV 242%
[129] Report: “Uncompensated Hospital Care Cost Fact Sheet.” American Hospital Association, February 2022. <www.aha.org>
Uncompensated care is an overall measure of hospital care provided for which no payment was received from the patient or insurer. It is the sum of a hospital’s bad debt and the financial assistance it provides. Financial assistance includes care for which hospitals never expected to be reimbursed and care provided at a reduced cost for those in need. A hospital incurs bad debt when it cannot obtain reimbursement for care provided; this happens when patients are unable to pay their bills, but do not apply for financial assistance, or are unwilling to pay their bills. Uncompensated care excludes other unfunded costs of care, such as underpayment from Medicaid and Medicare. …
Uncompensated care data are sometimes expressed in terms of hospital charges, but charge data can be misleading, particularly when comparisons are being made among types of hospitals, or hospitals with very different payer mixes. For this reason, the AHA [American Hospital Association] data on hospitals’ uncompensated care are expressed in terms of costs not charges. It should be noted that the uncompensated care figures do not include Medicaid or Medicare underpayment costs.
[130] Report: “Medical Debt Burden in the United States.” Consumer Financial Protection Bureau, February 2022. <files.consumerfinance.gov>
Page 2:
Key findings of this report include:
• CFPB [Consumer Financial Protection Bureau] research shows $88 billion in medical debt on consumer credit records as of June 2021. The total amount of medical debt in collections in the U.S. is likely higher, since not all medical debts in collections are furnished to consumer reporting companies.
• Most medical debt collection tradelines on consumer credit reports are under $500, although many people with medical debt have multiple medical collection tradelines.
• As of 2021, 58 percent of all third-party debt collection tradelines were for medical debt, making medical debt the most common debt collection tradeline on credit records. The next most common collections tradeline was telecommunications debt, at only 15 percent of tradelines.
[131] Report: “Market Snapshot: Third-Party Debt Collections Tradeline Reporting.” By Michael Furey and Ryan Kelly. Consumer Financial Protection Bureau, July 18, 2019. <files.consumerfinance.gov>
Pages 2–3:
This report provides a brief overview of two types of third-party debt collections2 tradelines reflected on credit reports compiled by the nationwide consumer reporting agencies (NCRAs)3….
A tradeline is information about a consumer account that is sent, generally on a regular basis, to a consumer reporting agency.6 Tradelines contain data such as the account balance, payment history, and the status of the account (for example current, past due, or charged-off). Debt collections tradelines, which are considered negative, generally may appear on a consumer report for up to seven years.7
2 The term “third-party debt collections” refers to a situation where collections on a consumer account are not handled by the original creditor. When a creditor collects on its own account, the term used is “first party debt collections.”
3 The three NCRAs are Equifax, Experian, and TransUnion. These three firms are sometimes referred to as “credit bureaus.”
Page 5: “Medical debt accounted for 58 percent of total third-party collections tradelines in Q2 2018.”
[132] Report: “Uncompensated Hospital Care Cost Fact Sheet.” American Hospital Association, February 2022. <www.aha.org>
Each year, the American Hospital Association (AHA) publishes aggregate information on the level of uncompensated care—care provided for which no payment is received—delivered by all types of U.S. hospitals. The data used to generate these numbers come from the AHA’s Annual Survey of Hospitals, which is the nation’s most comprehensive source of hospital financial data. …
National Uncompensated Care Based on Costii: 1990–2020 (in Billions), Community Hospitals … 2020 … Uncompensated Care Cost [=] $42.67
[133] Calculated with data from:
a) Report: “Uncompensated Hospital Care Cost Fact Sheet.” American Hospital Association, February 2022. <www.aha.org>
“National Uncompensated Care Based on Costii: 1990–2020 (in Billions), Community Hospitals … 2020 … Uncompensated Care Cost [=] $42.67”
b) Webpage: “Fast Facts on U.S. Hospitals, 2022.” American Hospital Association. Updated January 2022. <www.aha.org>
Pages 1–2 (of PDF): “The data below, from the 2020 AHA [American Hospital Association] Annual Survey, are a sample of what you will find in AHA Hospital Statistics, 2022 edition. … Total Expenses for All U.S. Hospitals [=] $1,213,881,001,000”
CALCULATION: $42,670,000,000 uncompensated care / $1,213,881,001,000 total expenses = 3.5%
[134] “Position Statement: Medical Liability Reform.” American Academy of Orthopaedic Surgeons, January 19, 2021. <www.aaos.org>
Page 2 (of PDF): “Defensive medicine includes the practice of ordering excessive or unnecessary tests, procedures, visits, or consultations solely for reducing liability risk to the physician, and/or the practice of avoiding high-risk patients or procedures.24 The threat of frivolous lawsuits places significant pressure on physicians to request or perform unnecessary tests including invasive ones.27,29”
[135] Report: “2011 Update on U.S. Tort Cost Trends.” Towers Watson, January 2012.
Page 8:
The methodology used to develop estimates of tort costs in this study is similar to the methodology used in prior Towers Watson studies of U.S. tort costs. This study incorporates three cost components:
• Benefits paid or expected to be paid to third parties (hereafter referred to as “losses”)
• Defense costs
• Administrative expenses
Page 17: “Appendix 5 – Medical malpractice tort costs … Total cost … 2010 [=] $29,844,869 … All dollar amounts are in $000s.”
NOTE: Willis Towers Watson informed Just Facts that an updated study to this report has not been conducted as of November 2022.
[136] Calculated with data from: “National Health Expenditures by Type of Service and Source of Funds: Calendar Years 1960 to 2020.” U.S. Department of Health & Human Services, Centers for Medicare and Medicaid Services, December 1, 2021. <www.cms.gov>
“Total National Health Expenditures … 2010 [=] $2,589,394 million”
CALCULATION: $29,844,869,000 / $2,589,394,000,000 = 1.152%
[137] Report: “Medical Malpractice Law in the United States.” By Peter P. Budetti and Teresa M. Waters. Henry J. Kaiser Family Foundation, May 1, 2005. <www.kff.org>
Page 1: “Medical malpractice law in this country traditionally has been under the authority of the states, not the federal government. And, unlike many other areas of the law, the framework and legal rules governing malpractice actions were, prior to the last thirty years, largely established through decisions in lawsuits in state courts rather than through statutes enacted by state legislatures.”
Page 4:
State legislatures have responded to a number of issues concerning the malpractice tort claims system and passed statutes that changed a number of different aspects of malpractice law, some of which had dramatic effects. Those statutes are often referred to as “tort reforms.” More recently, the United States Congress has also considered legislation that would make federal laws more prominent in medical malpractice cases and would override at least some aspects of state laws.
Page 15: “Even when an insurance company sells malpractice insurance in multiple states, premiums are still based on the expected experience of physicians within a single state or an even smaller geographic area. As a result, the differences in medical malpractice law among the states can lead to substantial differences in the cost of malpractice insurance from one state to another, even for the same specialty, and to wide fluctuations from year to year.”
[138] Dataset: “Population Estimates: County Totals.” U.S. Census Bureau, May 4, 2021. <www2.census.gov>
“Population Estimate 2019 … [Rank 1] … Los Angeles County, California [=] 10,011,602”
[139] Webpage: “California Medical Malpractice Insurance.” Cunningham Group. Accessed November 9, 2022 at <www.cunninghamgroupins.com>
“2019 … The Doctors Company … Kern, Los Angeles, Orange and Ventura Counties … Ob/Gyn [=] $49,804”
[140] Dataset: “Population Estimates: County Totals.” U.S. Census Bureau, May 4, 2021. <www2.census.gov>
“Population Estimate 2019 … [Rank 2] … Cook County, Illinois [=] 5,145,326”
[141] Webpage: “Illinois Medical Malpractice Insurance.” Cunningham Group. Accessed November 9, 2022 at <www.cunninghamgroupins.com>
“2019 … Medical Protective – MedPro … County [=] Cook, Jackson, Madison, St. Clair and Will Counties … OB/GYN [=] $127,083”
[142] Webpage: “California Medical Malpractice Insurance.” Cunningham Group. Accessed November 9, 2022 at <www.cunninghamgroupins.com>
“2019 … The Doctors Company … Alameda, Contra Costa, Madera, Mariposa, Merced, Monterey, San Benito, San Francisco, San Luis Obispo, San Mateo, Santa Clara, and Santa Cruz Counties … Ob/Gyn [=] $16,240”
[143] Webpage: “Illinois Medical Malpractice Insurance.” Cunningham Group. Accessed November 9, 2022 at <www.cunninghamgroupins.com>
“2019 … Medical Protective (MedPro) … County [=] Adams, Knox, Peoria and Rock Island Counties [=] $57,192”
[144] NOTE: On December 8, 2011, Just Facts contacted MyMedicalMalpracticeInsurance.com to determine the most reliable way to make “apples-to-apples” comparisons between states and localities. Based on this information, Just Facts decided to compare California and Illinois, a high-cost and low-cost state with equal malpractice insurance coverage limits ($1 million per incident and $3 million aggregate per year).†
† Article: “Medical Liability Insurance – Factors That Can Affect What You Pay.” By Carol Power. CoverMD. Accessed December 8, 2011 at <www.covermd.com>
The most common limit of liability option chosen by doctors is $1 million / $3 million. This is the limit of liability required by most hospitals in order to grant a physician hospital privileges.
The $1 million refers to the amount that the insurance company will pay per Occurrence (per claim) for indemnity purposes and the $3 million is the aggregate (total) amount the insurance company will pay out for a year.
Some states have different limits of liability for example in New York it is $1.3 million / $3.9 million, Florida allows $250,000 / $750,000 while Texas has a $200,000 / $600,000 limit of liability. Also hospitals in some states require $2 million / $6 million limits of liability in order to grant hospital privileges.
[145] Calculated with data from: “Adverse Action and Medical Malpractice Payment Reports.” U.S. Department of Health & Human Services, National Practitioner Data Bank. Updated June 30, 2022. <www.npdb.hrsa.gov>
“Display: Graph; Rows: Report Type, Columns: State; Start Year: 2012; End Year: 2021 Report Type: Medical Malpractice Payment; Range: All; State: All; Practitioner Type: Physician (MD) and Physician (DO); Display Value: Report Counts; Malpractice Inflation Adjusted: Yes”
“Display: Graph; Rows: Report Type, Columns: State; Start Year: 2012; End Year: 2021; Report Type: Medical Malpractice Payment; Range: All; State: All; Practitioner Type: Physician (MD) and Physician (DO); Display Value: Dollar Amounts ($M); Malpractice Inflation Adjusted: Yes”
NOTE: An Excel file containing the data and calculations is available upon request.
[146] “Quantifying the Cost of Defensive Medicine: Summary of Findings.” Jackson Healthcare, February 2010. <www.jacksonhealthcare.com>
Page 1: “Based upon these findings, and in an effort to validate the scope and impact of defensive medicine, Jackson Healthcare retained Gallup to conduct an independent national physician poll using their world-renowned methodology.”
Page 2:
Key Findings from Gallup Survey
• Physicians attribute 26 percent of overall healthcare costs to the practice of defensive medicine
• Of the physicians surveyed, 73 percent agreed that they had practiced some form of defensive medicine in the past 12 months
• Physicians indicating they had practiced a form of defensive medicine in the last twelve months attribute 21 percent of their practice to be defensive in nature
Page 4: “Gallup Survey Methodology Between December 2009 and January 2010, Gallup conducted telephone interviews with 462 randomly selected practicing physicians from across the U.S.”
[147] Just Facts has spent about 75 hours investigating studies that attempt to quantify the costs of defensive medicine in the U.S. All of these studies suffer from one or more of the following methodological shortcomings:
NOTE: † Paper: “Response Rates to Mail Surveys Published in Medical Journals.” By David A. Asch and others. Journal of Clinical Epidemiology, 1997. Pages 1129–1136. <www.ncbi.nlm.nih.gov>
Page 1129:
The purpose of this study was to characterize response rates for mail surveys published in medical journals…. The mean response rate among mail surveys published in medical journals is approximately 60%. However, response rates vary according to subject studied and techniques used. Published surveys of physicians have a mean response rate of only 54%, and those of non-physicians have a mean response rate of 68%. … Although several mail survey techniques are associated with higher response rates, response rates to published mail surveys tend to be moderate. However, a survey’s response rate is at best an indirect indication of the extent of non-respondent bias. Investigators, journal editors, and readers should devote more attention to assessments of bias, and less to specific response rate thresholds.
Page 1135:
The level of art and interpretation in calculating response rates reflects the indirect and therefore limited use of the response rate in evaluating survey results. So long as one has sufficient cases for statistical analyses, non-response to surveys is a problem only because of the possibility that respondents differ in a meaningful way from non-respondents, thus biasing the results.22,23 Although there are more opportunities for non-response bias when response rates are low than high, there is no necessary relationship between response rates and bias. Surveys with very low response rates may provide a representative sample of the population of interest, and surveys with high response rates may not.
Nevertheless, because it is so easy to measure response rates, and so difficult to identify bias, response rates are a conventional proxy for assessments of bias. In general, investigators do not seem to help editors and readers in this regard. As we report, most published surveys make no mention of attempts to ascertain non-respondent bias. Similarly, some editors and readers may discredit the results of a survey with a low response rate even if specific tests limit the extent or possibility of this bias.
[148] Article: “Defensive Medicine: A Case and Review of Its Status and Possible Solutions.” By Eric D. Katz. Western Journal of Emergency Medicine, June 6, 2020. <westjem.com>
Quality of Evidence and Confounding Variables
While opinions on the presence and magnitude of defensive medicine are profound, there is little evidence to support those opinions. The majority of studies of defensive medicine in Medline and Westlaw (57%) were based on physician surveys, with only 9% based on primary statistical analysis and 7% on literature reviews (mostly of survey studies).2 Many studies are based on a single specialty or specific disease (such as heart attacks, spinal disc disease, etc.). The presence of author bias is palpable on all sides of the issue.
Medical decision-making is a complex process that incorporates defensive medicine with other influencers. Those influencers include quality care, financial incentive, patient satisfaction, self-image, professional reputation, and the desire to avoid conflict. Isolating any one variable is exceptionally difficult, and most surveys cannot single out malpractice concerns except through hypothetical simulation. Many use graded scales of perceived malpractice risk to try to simulate situations in which defensive medicine can be identified. Others will attempt to quantify the respondents’ malpractice-avoidance and correlate that with costs.6,10
[149] Paper: “National Costs of the Medical Liability System.” By Michelle M. Mello and others. Health Affairs, September 2010. Pages 1569–1577. <content.healthaffairs.org>
Page 1573: “In our analysis, we used a value of 5.4 percent for the effects of defensive medicine on hospital spending…. Our 5.4 percent estimate suggests that $38.8 billion of this spending could be reduced through direct tort reforms.”
Page 1574: “Thus, our estimate range for the cost of defensive medicine in 2008 for physician and clinical services is $5.4–$8.2 billion. This midpoint of this range is $6.8 billion.”
NOTE: For examples of news outlets that have cited this study, see the last sets of facts in this section.
[150] Paper: “National Costs of the Medical Liability System.” By Michelle M. Mello and others. Health Affairs, September 2010. Pages 1569–1577. <content.healthaffairs.org>
Pages 1572–1573:
Kessler and McClellan examined the effect of tort reforms that directly reduce expected malpractice awards—such as caps on noneconomic damages—on Medicare hospital spending for acute myocardial infarction and ischemic heart disease from 1984 to 1990.7 …
… In a further analysis incorporating information about levels of managed care through 1994, they [Kessler and McClellan] estimated that direct reforms reduced hospital spending by 3.8 percent for myocardial infarction and 7.1 percent for heart disease.30
Two other studies could not replicate these findings for other health conditions.6, 31 Consequently, national extrapolations from Kessler and McClellan’s estimates should be interpreted with considerable caution.
[151] Paper: “National Costs of the Medical Liability System.” By Michelle M. Mello and others. Health Affairs, September 2010. Pages 1569–1577. <content.healthaffairs.org>
Page 1573:
Treatment intensity for other diagnoses may be less subject to physician discretion than cardiac care. …
This estimate understates the magnitude of defensive medicine under two conditions: first, if the passage of direct tort reforms reduces only a portion of defensive medicine, as we believe it does; and second, if physicians perceive that elderly Americans—recall that Kessler and McClellan’s estimates come from a Medicare population—are less likely than other patients to sue or, if they sue, to recover large awards.
However, the estimate overstates the magnitude of defensive medicine if physician responses to liability in the realm of cardiac care are more dramatic than in other clinical areas, or if responses are larger for Medicare patients than for privately insured patients. The latter might be the case because higher levels of managed care outside of Medicare reduce physicians’ discretion.
Balancing these competing sources of bias is difficult, but the two sets of concerns probably serve as counterweights to one another.
[152] Paper: “National Costs of the Medical Liability System.” By Michelle M. Mello and others. Health Affairs, September 2010. Pages 1569–1577. <content.healthaffairs.org>
Pages 1573–1574:
The above cost estimate relates solely to hospital spending, but defensive medicine also occurs in other settings. Our prior work found that between 1993 and 2001, malpractice payments per physician grew by 11 percent and were associated with a 1.1 percent increase in Medicare reimbursement for all physician and professional services in Medicare Part B. Similar results were obtained when malpractice premiums were used as a measure of liability.33,34
We could use these figures to estimate the level of current annual spending that can be attributed to malpractice premium growth. A first step was to estimate the increase in Part B spending that may be attributed to malpractice liability between 1993 and 2001. The total is $2.9 billion, or 1.1 percent of Part B spending in 1993.
However, this calculation ignored the role of malpractice payments made on behalf of physicians before and after that period in contributing to the current level of spending. We estimated the increase in defensive medicine since 2001 by making two assumptions.
First, we assumed that the association between malpractice payments and health spending is the same in the period after 2001 as it was in the 1993–2001 period. That is, we assumed that an 11 percent average annual growth in malpractice payments was associated with 1.1 percent average annual growth in reimbursements. Second, we assumed that malpractice payments grew at the same average annual rate after 2001 that they did in 1993–2001.
With these assumptions, we estimated that a total of $2.5 billion in physician and clinical spending since 2001 was attributable to defensive medicine. Adding this amount to the $2.9 billion spent in the 1993–2001 period resulted in a total of $5.4 billion for the cost of defensive medicine in the area of physician and clinical services since 1993.
As noted earlier, this calculation still ignored the contribution of defensive medicine to the absolute level of health care spending in 1993. This is an extremely difficult parameter to estimate (see the Online Appendix).16 We can provide only a rough estimate.
In 1960, spending on physician and clinical services was $39.3 billion in 2008 dollars. Assuming that malpractice payments per physician grew at an average annual rate of 1.3 percent, we would expect spending on this class of services to be $2.8 billion more in 2008. Thus, our estimate range for the cost of defensive medicine in 2008 for physician and clinical services is $5.4–$8.2 billion. This midpoint of this range is $6.8 billion.
[153] “Position Statement: Medical Liability Reform.” American Academy of Orthopaedic Surgeons, January 19, 2021. <www.aaos.org>
Page 2 (of PDF): “Defensive medicine includes the practice of ordering excessive or unnecessary tests, procedures, visits, or consultations solely for reducing liability risk to the physician, and/or the practice of avoiding high-risk patients or procedures.24 The threat of frivolous lawsuits places significant pressure on physicians to request or perform unnecessary tests including invasive ones.27,29”
[154] Paper: “National Costs of the Medical Liability System.” By Michelle M. Mello and others. Health Affairs, September 2010. Pages 1569–1577. <content.healthaffairs.org>
Page 1574: “Combining the amounts for hospital and physician spending, we arrived at an overall estimate of $45.6 billion in defensive medicine costs for 2008.”
[155] Calculated with data from: “National Health Expenditures by Type of Service and Source of Funds, Calendar Years 1960–2009.” U.S. Department of Health & Human Services, Centers for Medicare and Medicaid Services, January 5, 2011. <www.cms.gov>
“Total National Health Expenditures … 2008 [=] $2,391,383.7 million … Total Hospital Expenditures … 2008 [=] $722,143.8 million … Total Physician and Clinical Expenditures … 2008 [=] $486,486.2 million”
CALCULATION: ($722,143.8 + $486,486.2) / $2,391,383.7 = 50.54%
[156] Report: “National Health Expenditures Accounts: Definitions, Sources, and Methods, 2009.” U.S. Department of Health & Human Services, Centers for Medicare and Medicaid Services, 2009. <www.cms.gov>
Page 7:
Exhibit 4: Assembly and Data Sources in the NHEA [National Health Expenditures Accounts], For Types of Services and Goods … Hospital Care … Physician and Clinical Services … Other Professional Services … Dental Services … Other Health, Residential, and Personal Care … Home Health … Nursing Care Facilities and Continuing Care Retirement Communities … Prescription Drugs … Durable Medical Equipment … Other Non-durable Medical Products
NOTE: See the two footnotes above for the fact that total national health expenditures in 2008 were about $2.4 trillion, and the study only accounted for hospital care and physician/clinical services, which comprised about half of this spending. As shown in the calculation in the footnote below, this study used a figure of $2.3 trillion in the denominator when calculating that medical liability costs were 2.4% of total health care spending in 2008.
[157] Paper: “National Costs of the Medical Liability System.” By Michelle M. Mello and others. Health Affairs, September 2010. Pages 1569–1577. <content.healthaffairs.org>
Page 1569: “Overall annual medical liability system costs, including defensive medicine, are estimated to be $55.6 billion in 2008 dollars, or 2.4 percent of total health care spending.”
CALCULATION: $55.6 billion medical liability costs / .024 portion of total health care spending = $2.3 trillion total health care spending
[158] Article: “Malpractice Liability Costs U.S. $55.6 Billion: Study.” By Maggie Fox. Reuters, September 7, 2010. <www.reuters.com>
Medical malpractice liability costs the U.S. healthcare system more than $55 billion a year, most of it in “defensive” medical practices such as extra tests and scans, according to a report released on Tuesday.
These costs, which also include administrative costs, payments to plaintiffs and lawyer fees, account for 2.4 percent of annual U.S. healthcare spending, Michelle Mello of the Harvard School of Public Health and colleagues reported.
[159] Article: “Medical Liability Costs Make Up 2.4% of U.S. Health Spending.” By Pat Wechsler. Bloomberg, September 7, 2010. <www.bloomberg.com>
“Medical malpractice and guarding against suits cost the U.S. about $55.6 billion annually, or 2.4 percent of the total health-care bill, according to Harvard University’s Atul Gawande and co-authors.”
[160] Article: “Malpractice Lawsuits and the National Debt.” By Paula Reid. CBS News, December 3, 2010. <www.cbsnews.com>
“Even if all of these [legal] reforms were enacted the total savings would be a fraction of a percent of the national debt. The United States spend about $2.4 trillion dollars a year on health care. Of that figure, it’s estimated that medical liability costs about $55.6 billion or 2.4%.”
[161] Article: “Malpractice Costs Top $55 Billion a Year in U.S., Harvard Study Says.” By Bruce Japsen. Chicago Tribune, September 8, 2010. <www.chicagotribune.com>
“A comprehensive analysis by researchers at Harvard University found the annual overall cost of medical liability to be $55.6 billion, or 2.4 percent of total health care spending, according to an article published in the September issue of the journal Health Affairs.”
[162] Article: “Cost of Medical Malpractice Tops $55 Billion a Year in U.S.” U.S. News & World Report, September 7, 2010. <health.usnews.com>
“The cost of medical malpractice in the United States is $55.6 billion a year, which is 2.4 percent of annual health-care spending, a new study shows.”
[163] Book: Health Insurance: Current Issues and Background. Edited by William S. Stevens and others. Nova Science Publishers, 2003.
Chapter 2: “The Health Insurance Portability and Accountability Act (HIPPA): Summary of the Administrative Simplification Provisions.” By Celinda Franco. Pages 27–40.
Page 28:
Each year the health care industry generates billions of financial and administrative transactions in both paper and electronic form that result from the delivery of health care services. …
Currently, there are no standardized formats for the electronic or paper transmission of health care information, or standards for identifying providers, health plans, employers, or individuals participating in the health care system. There are approximately 400 formats for electronic health claims used in the United States today. The absence of standardized formats for health care claims means that payers and providers must frequently invest in multiple computer systems or programs, as well as additional human resources in order to process claims with different format requirements. This increases the administrative costs of health care delivery. The lack of standardization limits the efficient flow of information between payers and providers, increases the complexity and costs of processing of health care claims and other financial and administrative transactions, and hinders efforts to direct fraud and abuse.
Page 29: “HIPPA does not, however, provide for the collection of clinical data or the electronic maintenance of patient medical records. As such, HIPPA’s overarching goal in this area is to serve as a catalyst for the health care industry to increasingly use electronic transactions and standard formats so that significant administrative savings can be achieved.”
NOTE: See the next footnote for information on how the “administrative simplification provisions” in the Health Insurance Portability and Accountability Act are faring in practice.
[164] Letter: Michael D. Maves (Executive Vice President and CEO of the American Medical Association) to Donald Berwick (Administrator, U.S. Centers for Medicare and Medicaid Services), April 13, 2011. <www.ama-assn.org>
Page 2:
Drug Plan Authorizations: Despite their ongoing support for Medicare drug coverage, physicians have many complaints about associated burdens, including formulary changes and time-consuming pre-authorization requirements of drug and Medicare Advantage plans. A separate AMA [American Medical Association] survey found that drug pre-authorizations also delay care with 69 percent of physicians waiting several days for approval and 10 percent waiting more than a week.
Page 5:
In addition, we cannot overemphasize the importance of considering the aggregate impact of the unprecedented scope of changes physicians are being ordered to absorb over a very short period of time. Provisions of one law have not even been implemented before additional requirements are mandated in the next one. Along with the ACA [Affordable Care Act] provisions, physicians are coping with earlier mandates, including most notably the upcoming Health Insurance Portability and Accountability (HIPAA) deadlines for 5010 on January 1, 2012 and ICD-10 [International Classification of Diseases code 10] on October 1, 2013. To date, there has never been a return on investment for physicians for the implementation of any HIPAA administrative simplification requirement. The human and technological investments needed to participate in quality incentives are competing for physician time and resources needed to move to an enormous new set of diagnosis codes in ICD-10. The struggle to keep up leaves little time to get engaged in the practice redesign and payment and delivery reforms envisioned in the ACA and detracts from patient care just as the ACA is promising access to millions of uninsured Americans. We strongly urge the Administration and CMS [Centers for Medicare and Medicaid Services] to carefully consider the impact the collision of these compliance deadlines will have on physicians, patients and the ACA’s promise of better care for more people.
[165] Letter: Michael D. Maves (Executive Vice President and CEO of the American Medical Association) to Donald Berwick (Administrator, U.S. Centers for Medicare and Medicaid Services), April 13, 2011. <www.ama-assn.org>
Page 7:
Over the past few years, physicians have experienced tremendous problems with CMS’ [Centers for Medicare and Medicaid Services’] enrollment program. These difficulties have led to serious cash flow disruptions for many practices. Some 12 percent of our administrative burden survey respondents found this to have been a problem and one physician told us it “took me eight months to get a Medicare number. I still haven’t been paid and will have to take bankruptcy soon.” In fact, according to CMS’ own Provider Contractor Satisfaction Survey, physicians’ experience with the Medicare enrollment process has ranked at the bottom and essentially amounts to a score of “C–.” Enrollment has perennially been an area where CMS contractors have struggled to implement agency changes with limited resources and within artificially short deadlines.
Page 8:
In our significant experience with educating physicians about federal policies, the AMA [American Medical Association] has found that it usually takes at least six months to adequately reach out and inform physicians about new requirements. Lawmakers’ growing propensity for cramming hundreds of program changes into massive legislative vehicles with retroactive effective dates and inadequate lead time has greatly complicated things for both CMS and physicians and we sympathize with the agency’s struggle to provide adequate notice and education in the current environment. Nonetheless, the critical mass of regulatory change in any given year has become so great that something has to give. Keeping up with the swelling number of Medicare rules has become a full time job that is an enormous challenge even for large practices and can be almost impossible for smaller practitioners. The problem is compounded when, as has happened with increasing frequency, they are confronted with a host of new rules contained in a voluminous physician fee schedule rule published in November and effective on January 1 of the next year. A large number of physicians thus are completely unaware of the requirements because there has been so little opportunity to educate them before the requirement begins. Moreover, in many instances, details needed to implement the policy are lacking until well into the new year and in some cases new information comes out in a corrective regulation that never becomes widely available.
[166] Report: “Prescription for Change ‘Filled’: Tax Provisions in the Patient Protection and Affordable Care Act, Updated to Reflect Changes Approved in the Reconciliation Act of 2010.” By Clint Stretch and others. Deloitte, March 30, 2010. <www2.deloitte.com>
Page 19:
Reporting Related to Individual Mandate, Employer Penalties …
Generally the information to be reported with respect to insured individuals includes identifying information, dates of coverage, and any premium tax credit or cost sharing subsidy received by the individual with respect to such coverage, and any other information required by the Treasury Secretary. For insurance provided through an employer’s group health plan, the insurer must report the name, address, and EIN [employer identification number] of the employer maintaining the plan, the portion of the premium required to be paid by the employer, and any information the Secretary may require to administer the new tax credit for qualified small employers. Failure to comply with the requirement would trigger existing penalties associated with the filing of information returns.
Reporting by large employers – Any large employer subject to rules for maintaining minimum essential coverage, must file a return that identifies the employer; certifies whether it offers to its full-time employees the option to enroll in a minimum essential coverage plan; and provides the number of full-time employees during each month of the calendar year and information identifying each full-time employee covered under the employer-provided health plan.
Effective date – These new reporting requirements apply for calendar years beginning after 2013.
Disclosure of Tax Return Information
The Act also authorizes the Treasury to disclose to the Secretary of Health and Human Services relevant individual income tax return information used for determining eligibility for premium tax credits; cost-sharing reduction; and participation in a State Medicaid program, a State children’s health insurance program, or a basic health program under the Act. The Health and Human Services agency could in turn provide the information to an exchange created by the Act.
Effective date – The change in disclosure rules is effective upon enactment.
Observation
These new reporting requirements will significantly increase the amount of information that must be reported to the IRS as well as the number of information returns that businesses must file. Employers will need to implement the appropriate record keeping and data collection processes to meet the reporting requirements, including, where necessary, processes to effectively communicate the required information to third parties providing payroll administration or managing other reporting obligations.
Information reporting requirements bring with them the necessity of obtaining appropriate taxpayer identification numbers from payees to avoid backup withholding obligations. Businesses will need to implement additional procedures to collect the data necessary to meet these new obligations.
[167] Memo: “State Health Insurance Mandates and the ACA [Affordable Care Act] Essential Benefits Provisions.” National Conference of State Legislatures, April 12, 2018. <www.ncsl.org>
Appendix I …
Mandated benefits (also known as “mandated health insurance benefits” and “mandates”) are benefits that are required to cover the treatment of specific health conditions, certain types of healthcare providers, and some categories of dependents, such as children placed for adoption. A number of health care benefits are mandated by either state law, federal law—or in some cases—both. Prior to the passage of the PPACA [Patient Protection and Affordable Care Act], between the states and the federal government there are upwards of 2,000 health insurance mandates.
Although mandates continue to be added as health insurance requirements, they are controversial. Patient advocates claim that mandates help to ensure adequate health insurance protection while others (especially health insurance companies) complain that mandates increase the cost of healthcare and health insurance.
Mandated Health Insurance Benefit Laws
Mandated health insurance laws passed at either the federal or state level usually fall into one of three categories:
• Health care services or treatments that must be covered, such as substance abuse treatment, contraception, in vitro fertilization, maternity services, prescription drugs, and smoking cessation.
• Healthcare providers other than physicians, such as acupuncturists, chiropractors, nurse midwives, occupational therapists, and social workers.
• Dependents and other related individuals, such as adopted children, dependent students, grandchildren, and domestic partners.
The mandated benefit laws most often apply to health insurance coverage offered by employers and private health insurance purchased directly by an individual.
Mandated Insurance Benefits and the Cost of Health Insurance
Most people—whether for or against mandates—agree that mandated health benefits increase health insurance premiums. Depending on the mandated benefit and how that benefit is defined, the increase cost of a monthly premium can increase from less than 0.1% to more than 5%.
Trying to figure out how a mandated benefit will impact an insurance premium has been very complicated. The mandate laws differ from state to state and even for the same mandate, the rules and regulations may vary.
For example: Most states mandate coverage for chiropractors, but the number of allowed visits may vary from state to state. One state may limit the number of chiropractor visits to four each year, while another state may allow up to 12 chiropractor visits each year. Since chiropractor services can be expensive, the impact on health insurance premiums may be greater in the state with the more generous benefit.
Additionally, the lack of mandates could also increase the cost of healthcare and health insurance premiums. If someone who has a medical problem goes without necessary health care because it is not covered by his or her insurance, he or she may become sicker and need more expensive services in the future.
[168] Article: “Obama Reaffirms Insurers Must Cover Contraception.” By Robert Pear. New York Times, January 20, 2012. <www.nytimes.com>
The Obama administration said Friday that most health insurance plans must cover contraceptives for women free of charge, and it rejected a broad exemption sought by the Roman Catholic Church for insurance provided to employees of Catholic hospitals, colleges and charities.
Federal officials said they would give such church-affiliated organizations one additional year—until Aug. 1, 2013—to comply with the requirement. Most other employers and insurers must comply by this Aug. 1. …
The 2010 health care law says insurers must cover “preventive health services” and cannot charge for them.
The new rule interprets this mandate. It requires coverage of the full range of contraceptive methods approved by the Food and Drug Administration. Among the drugs and devices that must be covered are emergency contraceptives including pills known as ella and Plan B. The rule also requires coverage of sterilization procedures for women without co-payments or deductibles.
[169] Paper: “The Price of Innovation: New Estimates of Drug Development Costs.” By Joseph A. DiMasi, Ronald W. Hansen, and Henry G. Grabowski. Journal of Health Economics, 2003. Pages 151–185. <www.cptech.org>
Page 151:
The research and development costs of 68 randomly selected new drugs were obtained from a survey of 10 pharmaceutical firms. These data were used to estimate the average pre-tax cost of new drug development. The costs of compounds abandoned during testing were linked to the costs of compounds that obtained marketing approval. The estimated average out-of-pocket cost per new drug is US$ 403 million (2000 dollars). Capitalizing out-of-pocket costs to the point of marketing approval at a real discount rate of 11% yields a total pre-approval cost estimate of US$ 802 million (2000 dollars).
Page 156: “In the United States, manufacturers submit a new drug application (NDA) or a biological license application (BLA) to the FDA [U.S. Food & Drug Administration] for review and approval.”
Pages 164–165:
The time between the start of clinical testing and submission of an NDA or BLA with the FDA was estimated to be 72.1 months, which is 3.5 months longer than the same period estimated in the previous study. However, the time from the start of clinical testing to marketing approval in our timeline for a representative drug averaged 90.3 months for the current study, compared to 98.9 months for the earlier study. The difference is accounted for by the much shorter FDA approval times in the mid to late 1990s that were associated with the implementation of the Prescription Drug Use Fee Act of 1992. While the approval phase averaged 30.3 months for the earlier paper’s study period, that phase averaged only 18.2 months for drugs covered by the current study.
[170] Article: “Medical Treatment, Out of Reach.” By Andrew Pollack. New York Times, February 9, 2011. <www.nytimes.com>
Late last year, Biosensors International, a medical device company, shut down its operation in Southern California, which had once housed 90 people, including the company’s top executives and researchers.
The reason, executives say, was that it would take too long to get its new cardiac stent approved by the Food and Drug Administration.
“It’s available all over the world, including Mexico and Canada, but not in the United States,” said the chief executive, Jeffrey B. Jump, an American who runs the company from Switzerland. “We decided, let’s spend our money in China, Brazil, India, Europe.”
[171] Book: Vaccinology: An Essential Guide. Edited by Gregg N. Milligan and Alan D. T. Barrett. Wiley-Blackwell, 2015.
Page 234:
In addition, the length of time for the field trials, any modifications that arc made to the product or application, and the time the pharmaceutical company takes to respond to correspondence with the regulatory authorities can influence the time frame and the associated costs related to vaccine development. Lastly, the nature of the pathogen itself can also affect how efficiently a vaccine can be developed and manufactured.
The policies and regulations for registering and licensing veterinary vaccines vary among countries, which can also affect the time frame for developing and licensing veterinary vaccines. This factor also has implications on the regulations regarding the importation and exportation of vaccines between countries. Since some countries use different quality standards for the approval of the use of a vaccine, imported vaccines during nonemergency situations may be required to go through a conventional licensing process, which can be costly and time consuming. There has been some effort by different organizations to harmonize the testing procedures used by different countries to prevent duplicate testing of imported vaccines that are undergoing registration.
[172] Report: “A Physician’s Guide to Language Interpreter Services.” Minnesota Medical Association, 2004. <www.mnmed.org>
Page 3:
The legal requirements for physicians and clinics to provide interpreter services are not newly enacted but instead stem from Title VI of the Civil Rights Act of 1964.
Title VI of the Civil Rights Act of 1964 states, “No person in the United States shall, on grounds of race, color, or national origin, be excluded from participation in, be denied the benefits of, or be subjected to discrimination under any program or activity receiving Federal financial assistance.” Title VI applies to all recipients of federal funds, without regard to the amount of federal funds that they have received. It covers physicians who treat Medicaid or Medicare patients.
Under federal law, providers are prohibited from singling out patients based on race or national origin, and cannot employ practices that have a discriminatory impact on individuals based upon their race or national origin. Federal regulations that implement Title VI provide that:
A recipient … may not … utilize criteria or methods of administration which have the effect of subjecting individuals to discrimination because of their race, color or national origin, or have the effect of defeating or substantially impairing accomplishment of the objectives of the program [with] respect [to] individuals of a particular race, color or national origin. [42 C.F.R. 80.3(b)(2)]
The federal law covers all entities that receive federal financial assistance, including funds from the Department of Health and Human Services, either directly or indirectly. These entities include physicians, clinics, and hospitals that operate, provide, or engage in health programs and activities that receive federal financial assistance.
Page 4:
This means that physicians who receive financial reimbursement or payments under the Medicaid and/or Medicare programs are required to comply with Title VI. If a clinic is participating in either or both programs, it is obligated under federal law to ensure that all of its patients, including all LEP [limited English proficiency] patients, are able to receive effective communication in the course of the office visit. The federal law requires clinics to provide access to health care services, including language interpreting services, when needed, for all patients who have limited English proficiency, not only those patients who are actually enrolled in a public financial health program.
Under the law, physicians and other health care providers need to notify LEP patients regarding their right to language assistance services when needed. Physicians and clinics have a responsibility to ensure that their policies and procedures do not deny their patients access to health care services because of a language barrier.
The key to providing access to health care services for LEP persons is to ensure that the language assistance provided results in accurate and effective communication between the provider and the LEP patient. The U.S. Department of Health and Human Services’ Office for Civil Rights recommends doing the following to ensure compliance with the law:
1. Assessing the language needs of the patient population;
2. Developing a written policy regarding language access that will ensure meaningful communication;
3. Training staff members so they understand the policy and are capable of carrying it out; and
4. Monitoring to ensure LEP patients have meaningful access to health care.
Failure to implement one or more of these procedures does not necessarily mean noncompliance with Title VI. In case of a complaint or an investigation, the Office for Civil Rights will review the circumstances involved and determine compliance on a case-by-case basis. The assessment will take into account a number of factors, including the size of the clinic, the size of the LEP population, the nature of the services provided, the resources available, the frequency of different languages encountered, and the frequency with which LEP persons come into contact with the services.
[173] Webpage: “Guidance to Federal Financial Assistance Recipients Regarding Title VI Prohibition Against National Origin Discrimination Affecting Limited English Proficient Persons.” U.S. Department of Health and Human Services, August 4, 2003. Last reviewed 7/26/13. <www.hhs.gov>
III. Who Is Covered?
Department of Health and Human Services [HHS] regulations, 45 CFR 80.3(b)(2), require all recipients of federal financial assistance from HHS to provide meaningful access to LEP [limited English proficient] persons.(3) Federal financial assistance includes grants, training, use of equipment, donations of surplus property, and other assistance.
(3) Pursuant to Executive Order 13166, the meaningful access requirement of the Title VI regulations and the four-factor analysis set forth in the DOJ [Department of Justice] LEP Guidance are to apply additionally to the programs and activities of federal agencies, including HHS.
Recipients of HHS assistance may include, for example:
• Hospitals, nursing homes, home health agencies, and managed care organizations.
• Universities and other entities with health or social service research programs.
• State, county, and local health agencies.
• State Medicaid agencies.
• State, county and local welfare agencies.
• Programs for families, youth, and children.
• Head Start programs.
• Public and private contractors, subcontractors and vendors.
• Physicians and other providers who receive Federal financial assistance from HHS.
Recipients of HHS assistance do not include, for example, providers who only receive Medicare Part B payments.
[174] Article: “New York Offers Costly Lessons on Insurance.” By Anemona Hartocollis. New York Times, April 17, 2010. <www.nytimes.com>
In 1993, motivated by stories of suffering AIDS [Acquired Immunodeficiency Syndrome] patients, the state became one of the first to require insurers to extend individual or small group coverage to anyone with pre-existing illnesses. …
Healthy people, in effect, began to subsidize people who needed more health care. The healthier customers soon discovered that the high premiums were not worth it and dropped out of the plans. The pool of insured people shrank to the point where many of them had high health care needs. Without healthier people to spread the risk, their premiums skyrocketed, a phenomenon known in the trade as the “adverse selection death spiral.” …
At the same time, New York has the highest average annual premiums for individual policies: $6,630 for single people and $13,296 for families in mid-2009, more than double the nationwide average, according to America’s Health Insurance Plans, an industry group.
[175] Webpage: “FAQ: Selling Health Insurance Across State Lines.” By Phil Galewitz and Lexie Verdon. Kaiser Health News, January 25, 2011. <www.kaiserhealthnews.org>
What Currently Restricts Insurers From Selling Policies Outside of Their Home States?
Insurers are allowed to sell policies only in states where they are licensed to do business. Most insurers obtain licenses in multiple states. States have different laws regulating benefits, consumer protections and financial and solvency requirements.
[176] Brief: “Rate Regulation.” National Association of Insurance Commissioners, February 17, 2011. <www.naic.org>
Page 1 (of PDF):
Concerns over the fairness and equity of insurer rating practices that attempt to charge higher premiums to those with higher actual and expected claims costs have increased as insurers have identified case characteristics that allow them to pinpoint with increasing accuracy those individuals who will incur high costs. While these practices may have the effect of accurately assigning actuarially appropriate premiums to higher risks, they also tend to reduce the pooling of risk between low-cost and high-cost individuals, the core function of insurance.
In response to these concerns, states have developed a number of ways to regulate the characteristics that insurers use to vary premiums charged to different individuals and businesses in the marketplace. In developing rate regulations, policymakers must be aware that any decisions regarding the variation of premiums will create winners and losers in the marketplace. Loose restrictions will be generally favorable to low-cost individuals and businesses, resulting in higher premiums for older, sicker individuals. Tighter restrictions, on the other hand, result in higher premiums for young, healthy individuals and businesses to offset lower premiums for older, sicker individuals and businesses. The desire for equity must also be balanced with the need to avoid the adverse selection that can arise when low-cost individuals decide that the higher premiums they pay are not worthwhile given their expected needs and drop out of the market, resulting in a sicker risk pool and higher premiums.
[177] Public Law 111-148: “Patient Protection and Affordable Care Act.” 111th U.S. Congress. Signed into law by Barack Obama on March 23, 2010. <www.congress.gov>
Page 37:
Title I—Quality, Affordable Health Care for All Americans …
Subtitle C—Quality Health Insurance Coverage for All Americans …
Part I—Health Insurance Market Reforms …
Subpart I—General Reform …
Sec. 2701. Fair Health Insurance Premiums.
(a) Prohibiting Discriminatory Premium Rates.—
(1) In General.—With respect to the premium rate charged by a health insurance issuer for health insurance coverage offered in the individual or small group market—
(A) such rate shall vary with respect to the particular plan or coverage involved only by—
(i) whether such plan or coverage covers an individual or family;
(ii) rating area, as established in accordance with paragraph (2);
(iii) age, except that such rate shall not vary by more than 3 to 1 for adults (consistent with section 2707(c)); and
(iv) tobacco use, except that such rate shall not vary by more than 1.5 to 1; and
(B) such rate shall not vary with respect to the particular plan or coverage involved by any other factor not described in subparagraph (A).
(2) Rating Area.—
(A) In General.—Each State shall establish 1 or more rating areas within that State for purposes of applying the requirements of this title.
(B) Secretarial Review.—The Secretary shall review the rating areas established by each State under subparagraph (A) to ensure the adequacy of such areas for purposes of carrying out the requirements of this title. If the Secretary determines a State’s rating areas are not adequate, or that a State does not establish such areas, the Secretary may establish rating areas for that State.
[178] Book: Basics of the U.S. Health Care System. By Nancy J. Niles. Jones and Bartlett, 2011.
Pages 118–119:
Hospital Licensure, Certification, and Accreditation
State governments oversee the licensure of healthcare facilities including hospitals. States set their own standards. It is important to note that all facilities must be licensed but do not have to be accredited. State licensure focuses on building codes, sanitation, equipment, and personnel. Hospitals must be licensed to operate with a certain number of beds.
Certification of hospitals enables them to obtain Medicare and Medicaid enrollment. This type of certification is mandated by the Department of Health and Human Services (HHS). All hospitals that receive Medicare and Medicaid reimbursement must adhere to conditions of participation that emphasize patient health and safety. Accreditation is a private standard developed by accepted organizations as a way to meet certain standards. For example, accreditation of a hospital by The Joint Commission (TJC) means that hospitals have met Medicare and Medicaid standards and do not have to be certified.
[179] Report: “Patients or Paperwork: The Regulatory Burden Facing America’s Hospitals.” PricewaterhouseCoopers (commissioned by the American Hospital Association), 2001. <procentive.com>
Page 12: “But this is only federal-level regulation. Hospitals also are regulated by local and state agencies, as well as other private accrediting organizations. Figure 3 shows how many agencies are involved in regulating hospitals—almost 30 at the federal level alone. Almost no coordination exists among various federal agencies or between similar agencies at local and state levels, and private-sector accreditation.”
[180] Letter: Michael D. Maves (Executive Vice President and CEO of the American Medical Association) to Donald Berwick (Administrator, U.S. Centers for Medicare and Medicaid Services), April 13, 2011. <www.ama-assn.org>
Pages 5–6:
We ask CMS [Centers for Medicare and Medicaid Services] to consider that physicians are already subject to claims review by multiple contractors including Medicare Parts A and B (FFS [Fee-For-Service]) RAC [Recovery Audit Contractor] Medicare Administrative Contractors (MAC), Medicaid Integrity Contractors (MIC), Comprehensive Error Rate Testing Contractors (CERT), and Zone Program Integrity Contractors (ZPIC). In addition, physicians will soon be subject to Medicaid RAC audits. These audits, identified as a problem by 19 percent of our survey respondents, present a paramount example of the redundant, inconsistent or overlapping administrative burdens that President Obama’s recent executive order asked CMS to identify, streamline, and, if appropriate, repeal. At the very least, the regulations that control these programs should be coordinated to maximize net benefits. CMS recently issued a proposed rule on Medicaid RAC audits. During the RAC Medicare pilots, the AMA [American Medical Association] worked extensively with CMS to reduce the burden and to ensure that the RAC program was equitable. CMS’ proposed rule on Medicaid RAC did not reflect these improvements.
Also, in the event that CMS requires Medicare Parts C and D RAC to conduct claims review similar to the model already employed by the Medicare FFS RAC program, we urge the agency to establish clear criteria and require Medicare Parts C and D plans to compensate physicians for the office staff time required to pull, review, copy, and re-file medical records, as well as photocopying and postage charges. Further, we ask CMS to utilize notices that ensure that physicians can identify the entity that is requesting information, the reason for the request, and the reason for any deadline that is given for responding to the request. Lastly, we urge CMS to implement policies in the Medicaid RAC program which are consistent with the Medicare RAC audits.
[181] Webpage: “Physician Licensure: An Update of Trends.” American Medical Association. Accessed January 18, 2012 at <www.ama-assn.org>
Each of the 50 states, the District of Columbia, and the United States territories and their respective boards of medical licensure have rules that govern the ability of health care practitioners, including allopathic and osteopathic physicians, to practice medicine. These laws were enacted under the police power reserved to the states by the U.S. Constitution to adopt laws to protect the health, safety and general welfare of their citizens. This gives the states the ability to effectively monitor the quality of persons wishing to practice medicine in that area. In addition, most state statutes delegate authority for enforcing licensure laws to the state Boards of Medical Examiners. Osteopathic physicians are licensed for the full practice of medicine and surgery in all 50 states. Each state determines the tests and procedures for licensing its physicians. In some states, the same tests are given to DO’s [osteopathic doctors] and MD’s [medical doctors]; other states administer separate licensing exams. …
Until recently, a physician could provide an opinion or interpretation to a physician in another state who had primary patient care responsibility, and this practice was not regarded as practicing out of his/her state. Today, however, the out-of-state practice of medicine without a license is prohibited, whether the physician is treating the patient in person or from a distant location. In this day and age, a physician is considered to be practicing medicine in the state where the patient is located and is subject to that state’s laws regarding medical practice, which typically means a license in that particular state is necessary. Thus, state boards have denied requests from out-of-state psychiatrists, for example, to conduct therapy with their patients located in another state via telephone or videoconferencing. Imprecise definitions regarding just what is “out-of-state” medicine (for example, phone calls from patients who live in one state, but who seek care from an adjacent state, across a state line for care) also abound. Some states consider all out-of-state practice to be telemedicine, whether it utilizes phone calls, e-mail or online discussions. Even definitions from organizations such as the American Medical Informatics Association, the United States Department of Commerce, and various state and specialty medical societies vary considerably. …
A physician who seeks multiple state licenses for whatever reason may find the current system burdensome in terms of the time, expenses and varying licensure requirements. A patchwork of medical record, patient confidentiality, continuing medical education requirements, and mandatory reporting laws, along with differing medical practice acts, complicate the process. Difficulties are further exacerbated for physicians who practice telemedicine.
Licensure “by endorsement” is the process by which a physician licensed in one state seeks a license from a second state. A physician who physically practices in his/her home state but provides consultative or telemedicine services to patients in five other states, even adjacent states, must complete one in-state and five out-of-state applications for licensure, with six sets of accompanying documentation, and pay six registration fees. Each state has an independent application process with separate requirements. Fees for licenses by endorsement, including processing, application, and administrative fees, range from $1,108 in California to $20 in Pennsylvania; the average is $339. Moreover, most states require a physical appearance for some applicants before the local licensing board, which contributes to the time and expense.
Also, many states require the current licensing exam to be taken and passed if it has been more than 7 to 10 years since the applicant passed the then-current exam. There can be considerable expenses in terms of time and cost associated with preparing and taking the exam, particularly for specialists, who have limited the scope of their practice and who may have had no recent exposure to some areas covered in the general exam. For physicians who have only one or two years of postgraduate training, or who are international medical graduates, the application requirements in some states are more prohibitive.
[182] Textbook: Nurse Anesthesia (4th edition). By John J. Nagelhout and Karen Plaus. Saunders Elsevier, 2009.
Page 19:
In all states, it is a physician, usually the patient’s attending physician or surgeon, who determines the patient’s need for anesthesia or anesthesia-related services; therefore, anesthesiology has always been a referral service to anesthesiologists or CRNAs [Certified Registered Nurse Anesthetist]. It must be noted that the idiosyncratic language between doctors and nurses has reflected that referral over the years in the terminology of “ordering,” for example, “anesthetic.” For the most part, such ordering has not been technique, drug, or device specific. It may have been as simple as posting a patient for anesthesia and surgery within the operating room. Historically, it has been accepted that each anesthesia provider knows what techniques, drugs, and devices are safest in his or her hands for a particular patient.
The changing regulatory scene regarding physician supervision and the continual complaints of CRNAs regarding the TEFRA [Tax Equity and Fiscal Responsibility Act of 1982] regulations, which are believed by many CRNAs to adversely affect their ability to practice, came to a head in two additional initiatives pursued by the AANA [American Association of Nurse Anesthetists] in the 1990s.
Page 20: “In this age of cost containment in health-care services, the TEFRA rules preclude cost-effective use of both CRNAs and anesthesiologists without the anesthesiologists’ risking a crossing of the line into fraudulent practice. Some anesthesia groups consisting of both types of providers have decided to eliminate TEFRA as a concern by billing for each provider’s services as though the provider were practicing alone.”
[183] Report: “Patients or Paperwork: The Regulatory Burden Facing America’s Hospitals.” PricewaterhouseCoopers (commissioned by the American Hospital Association), 2001. <procentive.com>
Page 2: “Because hospitals, health systems and their caregivers are increasingly frustrated with regulatory red tape, the American Hospital Association (AHA) asked PricewaterhouseCoopers (PwC) to survey hospitals and assess the significance of the paperwork burden. The study illustrates a typical episode of care—an elderly woman who falls and fractures her hip—and the resulting patient care—and paperwork—which ensues….”
NOTE: The layers of paperwork are detailed on pages 25–29.
[184] Report: “Patients or Paperwork: The Regulatory Burden Facing America’s Hospitals.” PricewaterhouseCoopers (commissioned by the American Hospital Association), 2001. <procentive.com>
Page 21:
The summary of the number of patient care and paperwork minutes reported by the hospitals for each setting within “Ida Smith’s” episode of care were converted to ratios and averaged for all respondents. The resulting ratios, shown below, present the proportion of paperwork time for each unit (for example hour) of patient care time. …
|
Care Setting |
Ratio of Patient Care to Paperwork Time |
|
Emergency Department Care |
1 to 1 |
|
Surgery and Acute Inpatient Care |
1 to 0.6 |
|
Skilled Nursing Care |
1 to 0.5 |
|
Home Health Care |
1 to 0.8 |
[185] Report: “Patients or Paperwork: The Regulatory Burden Facing America’s Hospitals.” PricewaterhouseCoopers (commissioned by the American Hospital Association), 2001. <procentive.com>
Page 4:
Each time a physician orders a test or a procedure, the physician documents the order in the patient’s record. But the government requires additional documentation to prove the necessity for the test or procedure. Although the physician made a clinical judgment, the decision-making process—which resulted in the medical order—must be documented using an established diagnosis assignment process mandated by the government.
[186] Report: “Patients or Paperwork: The Regulatory Burden Facing America’s Hospitals.” PricewaterhouseCoopers (commissioned by the American Hospital Association), 2001. <procentive.com>
Page 11: “Many forms, such as the ‘Activities of Daily Living,’ must be completed daily by clinical staff to submit to the government to justify the care provided to skilled nursing facility patients.”
[187] Report: “Patients or Paperwork: The Regulatory Burden Facing America’s Hospitals.” PricewaterhouseCoopers (commissioned by the American Hospital Association), 2001. <procentive.com>
Page 5: “Because of the complexity and continuous changes in Medicare program requirements, medical records must be reviewed by at least four people to ensure compliance.”
Page 12:
Even within the Department of Health and Human Services (HHS)—the major federal regulator of hospitals—there is little coordination among its different divisions. HCFA [predecessor agency to the Centers for Medicare and Medicaid Services], for example, has trouble coordinating its Medicare and Medicaid rules and instructions—more than 130,000 pages. (That’s three times the size of the Internal Revenue Service Code and its federal tax regulations.)
[188] Report: “Patients or Paperwork: The Regulatory Burden Facing America’s Hospitals.” PricewaterhouseCoopers (commissioned by the American Hospital Association), 2001. <procentive.com>
Page 4: “A Medicare patient arriving at the emergency department is required to review and sign eight different forms—just for Medicare alone.”
[189] Report: “Patients or Paperwork: The Regulatory Burden Facing America’s Hospitals.” PricewaterhouseCoopers (commissioned by the American Hospital Association), 2001. <procentive.com>
Page 5: “Each time a patient is discharged, even if only from the acute unit of the hospital to the on-site skilled nursing unit, multiple care providers must write a discharge plan for the patient. This documentation, as long as 30 pages, applies to all patients, regardless of the complexity of care received within the hospital or required post-hospital setting.”
[190] Report: “Patients or Paperwork: The Regulatory Burden Facing America’s Hospitals.” PricewaterhouseCoopers (commissioned by the American Hospital Association), 2001. <procentive.com>
Page 12: “But this is only federal-level regulation. Hospitals also are regulated by local and state agencies, as well as other private accrediting organizations. Figure 3 shows how many agencies are involved in regulating hospitals—almost 30 at the federal level alone. Almost no coordination exists among various federal agencies or between similar agencies at local and state levels, and private-sector accreditation.”
[191] Dataset: “Table 3.16. Government Current Expenditures by Function [Billions of Dollars].” U.S. Department of Commerce, Bureau of Economic Analysis. Last revised November 17, 2023. <apps.bea.gov>
“Government … Health … 2022 [=] 2,238.8”
[192] Calculated with the dataset: “HH-1. Households by Type: 1940 to Present.” U.S. Census Bureau, Current Population Survey, November 2022. <www.census.gov>
“Total households (in thousands) … All [=] 131,202”
CALCULATION: $2,238,800,000,000 health spending / 131,202,000 households = $17,064
[193] Calculated with the dataset: “Table 3.16. Government Current Expenditures by Function [Billions of Dollars].” U.S. Department of Commerce, Bureau of Economic Analysis. Last revised November 17, 2023. <apps.bea.gov>
“2022 … Government [=] 8,691.7 … Health [=] 2,238.8”
CALCULATION: $2,238.8 billion / $8,691.7 billion = 26%
[194] As documented below, government “total expenditures” is a more inclusive measure of spending than “current expenditures,” but the U.S. Bureau of Economic Analysis (BEA) —which provides the only comprehensive and timely estimates of government spending at all levels—does not publish total expenditures broken down by function (for example, education, healthcare, etc.). Instead, it only publishes current expenditures by function.† ‡
“Current expenditures” include “all spending by government on current-period activities,” such as:
“Total expenditures” include all current expenditures plus:
NOTES:
[195] Calculated with the dataset: “Table 1.1.5. Gross Domestic Product [Billions of Dollars].” United States Department of Commerce, Bureau of Economic Analysis. Last revised December 21, 2023. <apps.bea.gov>
“Gross domestic product … 2022 [=] 25,744.1”
CALCULATION: $2,238.8 billion health spending / $25,744.1 billion GDP = 8.7%
[196] Calculated with data from:
a) Dataset: “Table 3.16. Government Current Expenditures by Function [Billions of Dollars].” U.S. Department of Commerce, Bureau of Economic Analysis. Last revised November 17, 2023. <apps.bea.gov>
b) Report: “Fiscal Year 2024 Historical Tables: Budget Of The U.S. Government.” White House Office of Management and Budget, March 2023. <www.whitehouse.gov>
“Table 3.1—Outlays by Superfunction and Function: 1940–2028.” <www.whitehouse.gov>
NOTE: An Excel file containing the data and calculations is available here.
[197] Calculated with the dataset: “Table 3.16. Government Current Expenditures by Function [Billions of Dollars].” U.S. Department of Commerce, Bureau of Economic Analysis. Last revised November 17, 2023. <apps.bea.gov>
NOTE: An Excel file containing the data and calculations is available here.
[198] Report: “CBO’s 2011 Long-Term Budget Outlook.” Congressional Budget Office, June 2011. <www.cbo.gov>
Page 4:
Mandatory programs are programs that do not require annual appropriations by the Congress; the funding available for them is generally not limited. Most mandatory spending is for entitlement programs, in which the federal government is required to make payments to any person or entity that meets the eligibility criteria set in law. Discretionary spending, by contrast, is controlled by annual appropriation acts.
[199] “A Glossary of Terms Used in the Federal Budget Process.” U.S. Government Accountability Office. September, 2005. <www.gao.gov>
Page 46:
Discretionary
A term that usually modifies either “spending,” “appropriation,” or “amount.” “Discretionary spending” refers to outlays from budget authority that is provided in and controlled by appropriation acts. “Discretionary appropriation” refers to those budgetary resources that are provided in appropriation acts, other than those that fund mandatory programs. “Discretionary amount” refers to the level of budget authority, outlays, or other budgetary resources (other than those which fund mandatory programs) that are provided in, and controlled by, appropriation acts.
Page 66:
Mandatory
A term that usually modifies either “spending” or “amount.” “Mandatory spending,” also known as “direct spending,” refers to budget authority that is provided in laws other than appropriation acts and the outlays that result from such budget authority. Mandatory spending includes entitlement authority (for example, the Food Stamp, Medicare, and veterans’ pension programs), payment of interest on the public debt, and non-entitlements such as payments to states from Forest Service receipts. By defining eligibility and setting the benefit or payment rules, Congress controls spending for these programs indirectly rather than directly through appropriations acts. “Mandatory amount” refers to the level of budget authority, outlays, or other budgetary resources that are controlled by laws other than appropriations acts. Budget authority provided in annual appropriations acts for certain programs is treated as mandatory because the authorizing legislation entitles beneficiaries to receive payment or otherwise obligates the government to make payment. (See also Appropriated Entitlement; Appropriations under Forms of Budget Authority under Budget Authority; Multiple-Year Authority and No-Year Authority under Duration under Budget Authority; Committee Allocation; Direct Spending Authority; Discretionary; Entitlement Authority; Gramm-Rudman-Hollings.)
[200] Report: “CBO’s 2011 Long-Term Budget Outlook.” Congressional Budget Office, June 2011. <www.cbo.gov>
Page ix: “[T]he major mandatory health care programs consist of Medicare, Medicaid, the Children’s Health Insurance Program,† and health insurance subsidies that will be provided through the exchanges established by the March 2010 health care legislation [i.e., the Affordable Care Act, a.k.a. Obamacare].”
NOTE: † CHIP could also be considered a discretionary program (as opposed to mandatory) because it requires ongoing appropriations, although Congress has thus far appropriated funding for the program in 10-year, 3-year, and 2-year increments. More details about CHIP follow below.
[201] Report: “Private Health Insurance Provisions in PPACA [Patient Protection and Affordable Care Act] (P.L. 111-148).” By Hinda Chaikind and others. Congressional Research Service, April 15, 2010. <www.everycrsreport.com>
Page 2 (of PDF): “[The Affordable Care Act] will enable and support states’ creation by 2014 of ‘American Health Benefit Exchanges.’ … Based on income, certain individuals may qualify for a tax credit toward their [health insurance] premium costs and a subsidy for their cost-sharing; the credits and subsidies will be available only through an exchange.”
[202] Calculated with data from:
a) Dataset: “The 2011 Long-Term Budget Outlook.” Congressional Budget Office, June 2011. <www.cbo.gov>
Tab: “Figure B-1. Primary Spending and Revenues, by Category, Under CBO’s Long-Term Budget Scenarios Through 2085”
b) Dataset: “The 2016 Long-Term Budget Outlook.” Congressional Budget Office, July 12, 2016. <www.cbo>
Tab: “Figure 3-5. Medicare’s Dedicated Taxes and Offsetting Receipts as a Share of Medicare Spending”
c) Dataset: “The 2018 Long-Term Budget Outlook.” Congressional Budget Office, June 26, 2018. <www.cbo.gov>
Tab: “Figure 2. Federal Debt, Spending, and Revenues”
Tab: “Figure 8. Federal Spending on the Major Health Care Programs, by Category”
d) Dataset: “An Update to the Budget and Economic Outlook: 2017 to 2027.” Congressional Budget Office, June 29, 2017. <www.cbo.gov>
Tab: “Table 1. CBO’s Baseline Budget Projections, by Category”
Tab: “Table 2. Mandatory Outlays Projected in CBO’s Baseline”
e) Dataset: “The Budget and Economic Outlook: 2018 to 2028.” Congressional Budget Office, April 9, 2018. <www.cbo.gov>
Tab: “Table 2-2. Mandatory Outlays Projected in CBO’s Baseline”
Tab: “Table 4-1. CBO’s Baseline Budget Projections, by Category”
f) Dataset: “Updated Budget Projections: 2019 to 2029.” Congressional Budget Office, May 2, 2019. <www.cbo.gov>
Tab: “Table 1. CBO’s Baseline Budget Projections, by Category”
Tab: “Table 5 Supplement. CBO’s Baseline Projections of Mandatory Outlays”
g) Dataset: “An Update to the Budget Outlook: 2020 to 2030.” Congressional Budget Office, September 2, 2020. <www.cbo.gov>
Tab: “Table 1. CBO’s Baseline Budget Projections, by Category”
Tab: “Table 3. Mandatory Outlays Projected in CBO’s Baseline”
h) Dataset: “Additional Information About the Updated Budget and Economic Outlook: 2021 to 2031.” Congressional Budget Office, July 21, 2021. <www.cbo.gov>
Tab: “Table 1-1. CBO’s Baseline Budget Projections, by Category”
Tab: “Table 1-3. CBO’s Baseline Projections of Mandatory Outlays”
i) Dataset: “The Budget and Economic Outlook: 2022 to 2032.” Congressional Budget Office, May 2022. <www.cbo.gov>
Tab: “Table 1-1. CBO’s Baseline Budget Projections, by Category”
Tab: “Table 3-2, Unadjusted. CBO’s Baseline Budget Projections of Mandatory Outlays”
j Dataset: “The Budget and Economic Outlook: 2022 to 2032.” Congressional Budget Office, May 2022. <www.cbo.gov>
Tab: “1a. Revenues, Outlays, Deficits, Surpluses, and Debt Held by the Public Since 1962, as a Share of GDP”
Tab: “5a. Mandatory Outlays Since 1962, as a Share of GDP”
k) Dataset: “The 2014 Long-Term Budget Outlook.“ Congressional Budget Office, July 15, 2014. <cbo.gov>
Tab: “6. Summary Data for the Extended Alternative Fiscal Scenario, Without Economic Feedback”
NOTE: An Excel file containing the data and calculations is available upon request.
[203] Report: “Medicare Primer.” By Patricia A. Davis and others. Congressional Research Service. Updated May 21, 2020. <sgp.fas.org>
Page 1: “Medicare is a federal program that pays for covered health care services of qualified beneficiaries. It was established in 1965 under Title XVIII of the Social Security Act to provide health insurance to individuals 65 and older, and has been expanded over the years to include permanently disabled individuals under 65.”
Page 3:
Medicare was enacted in 1965 (P.L. 89-97) in response to the concern that only about half of the nation’s seniors had health insurance, and most of those had coverage only for inpatient hospital costs. The new program, which became effective July 1, 1966, included Part A coverage for hospital and posthospital services and Part B coverage for doctors and other medical services. As is the case for the Social Security program, Part A is financed by payroll taxes levied on current workers and their employers; persons must pay into the system for 40 quarters to become entitled to premium-free benefits. Medicare Part B is voluntary, with a monthly premium required of beneficiaries who choose to enroll.
[204] Report: “Medicare Primer.” By Patricia A. Davis and others. Congressional Research Service. Updated May 21, 2020. <sgp.fas.org>
Page 1: “Medicare serves … virtually all of the population aged 65 and older.2”
Page 6:
Most persons aged 65 or older are automatically entitled to premium-free Part A because they or their spouse paid Medicare payroll taxes for at least 40 quarters (about 10 years) on earnings covered by either the Social Security or the Railroad Retirement systems. Persons under the age of 65 who receive cash disability benefits from Social Security or the Railroad Retirement systems for at least 24 months are also entitled to Part A.
[205] Dataset: “Medicare Monthly Enrollment.” U.S. Department of Health & Human Services, Centers for Medicare and Medicaid Services, July 2022. <data.cms.gov>
“Total Beneficiaries … National … 2021 [=] 63,905,513 … Aged Total Beneficiaries [=] 55,858,782 … Disabled Total Beneficiaries [=] 8,046,731”
[206] Dataset: “2021 American Community Survey 1-Year Estimates: Age and Sex.” U.S. Census Bureau. Accessed November 9, 2022 at <data.census.gov>
“65 years and over [=] 55,892,014”
[207] Calculated with data from:
a) Dataset: “Medicare Monthly Enrollment.” U.S. Department of Health & Human Services, Centers for Medicare and Medicaid Services, July 2022. <data.cms.gov>
“Total Beneficiaries … National … 2021 [=] 63,905,513”
b) Dataset: “Monthly Population Estimates for the United States: April 1, 2020 to December 1, 2022.” U.S. Census Bureau, December 2021. <data.census.gov>
“Resident population … 7/1/2021 population estimate [=] 331,893,745”
CALCULATION: 63,905,513 Medicare enrollees / 331,893,745 population = 19.2%
[208] Booklet: “Medicare Coverage of Skilled Nursing Facility Care.” U.S. Department of Health & Human Services, Centers for Medicare and Medicaid Services, July 2019. <www.medicare.gov>
Page 5:
Skilled nursing facility (SNF) care is health care given when you need skilled nursing or therapy staff to treat, manage, observe, and evaluate your care. Examples of SNF care include intravenous injections and physical therapy. Care that can be given by non-professional staff isn’t considered skilled care. People don’t usually stay in a SNF until they’re completely recovered because Medicare only covers certain SNF care services that are needed daily on a short-term basis (up to 100 days in a benefit period).
Skilled care is nursing and therapy care that’s so complex it can be safely and effectively performed only by, or under the supervision of, skilled nursing and therapy professionals. Skilled nursing and therapy professionals include:
• Registered nurses
• Licensed practical and vocational nurses
• Physical and occupational therapists
• Speech-language pathologists
• Audiologists
Medicare doesn’t cover custodial care if it’s the only kind of care you need. Custodial care is care that helps you with usual daily activities, like getting in and out of bed, eating, bathing, dressing, and using the bathroom. It may also include care that most people do themselves, like using eye drops, oxygen, and taking care of colostomy or bladder catheters. Custodial care is often given in a nursing facility. See page 20 for ways to get help paying for custodial care. Generally, SNF care is covered by Medicare only for a short time after a hospitalization. Custodial care may be needed for a much longer period of time.
[209] “2022 Annual Report of the Board of Trustees of the Federal Hospital Insurance and Federal Supplementary Medical Insurance Trust Funds.” United States Department of Health and Human Services, Centers for Medicare and Medicaid Services, June 2, 2022. <www.cms.gov>
Page 1:
The Medicare program … has two separate trust funds, the Hospital Insurance Trust Fund (HI) and the Supplementary Medical Insurance Trust Fund (SMI). HI, otherwise known as Medicare Part A, helps pay for inpatient hospital services, hospice care, and skilled nursing facility and home health services following hospital stays. SMI consists of Medicare Part B and Part D. Part B helps pay for physician, outpatient hospital, home health, and other services for individuals who have voluntarily enrolled. Part D provides subsidized access to drug insurance coverage on a voluntary basis for all beneficiaries and premium and cost-sharing subsidies for low-income enrollees. Medicare also has a Part C, which serves as an alternative to traditional Part A and Part B coverage. Under this option, beneficiaries can choose to enroll in and receive care from private Medicare Advantage and certain other health insurance plans. Medicare Advantage and Program of All-Inclusive Care for the Elderly (PACE) plans receive prospective, capitated payments for such beneficiaries from the HI and SMI Part B trust fund accounts; the other plans are paid from the accounts on the basis of their costs.
Page 22:
[Under Medicare Part C] Most beneficiaries have the option to enroll in private health insurance plans that contract with Medicare to provide Part A and Part B medical services. The share of Medicare beneficiaries in such plans has risen rapidly in recent years; it reached 43 percent in 2021 from 12.8 percent in 2004. Payments to Medicare Advantage plans are based on benchmarks that range from 95 to 115 percent of local fee-for-service Medicare costs, with bonus amounts payable for plans meeting high quality-of-care standards. The Trustees project that the overall participation rate for private health plans will continue to increase—from about 46 percent in 2022 to about 53 percent in 2031 and thereafter.19
[210] Report: “Medicare Primer.” By Patricia A. Davis and others. Congressional Research Service. Updated May 21, 2020. <sgp.fas.org>
Page 1:
• Part A (Hospital Insurance, or HI) covers inpatient hospital services, skilled nursing care, hospice care, and some home health services. The HI trust fund is mainly funded by a dedicated payroll tax of 2.9% of earnings, shared equally between employers and workers. …
• Part B (Supplementary Medical Insurance, or SMI) covers physician services, outpatient services, and some home health and preventive services. The SMI trust fund is funded through beneficiary premiums (set at 25% of estimated program costs for the aged) and general revenues (the remaining amount, approximately 75%).
• Part C (Medicare Advantage, or MA) is a private plan option for beneficiaries that covers all Parts A and B services, except hospice. Individuals choosing to enroll in Part C must also enroll in Part B. Part C is funded through the HI and SMI trust funds.
• Part D covers outpatient prescription drug benefits. Funding is included in the SMI trust fund and is financed through beneficiary premiums, general revenues, and state transfer payments.
Page 4:
In 2003, Congress enacted the Medicare Prescription Drug, Improvement, and Modernization Act of 2003 (MMA; P.L. 108-173),10 which included a major benefit expansion and placed increasing emphasis on the private sector to deliver and manage benefits. The MMA included provisions that (1) created a new voluntary outpatient prescription drug benefit to be administered by private entities….
Pages 6–7:
Most persons aged 65 or older are automatically entitled to premium-free Part A because they or their spouse paid Medicare payroll taxes for at least 40 quarters (about 10 years) on earnings covered by either the Social Security or the Railroad Retirement systems. Persons under the age of 65 who receive cash disability benefits from Social Security or the Railroad Retirement systems for at least 24 months are also entitled to Part A. …
Persons over the age of 65 who are not entitled to premium-free Part A may obtain coverage by paying a monthly premium ($458 in 2020) or, for persons with at least 30 quarters of covered employment, a reduced monthly premium ($252 in 2020).24 In addition, disabled persons who lose their cash benefits solely because of higher earnings, and subsequently lose their extended Medicare coverage, may continue their Medicare Part A enrollment by paying a premium, subject to limitations.
Generally, enrollment in Medicare Part B is voluntary. All persons entitled to Part A (and persons over the age of 65 who are not entitled to premium-free Part A) may enroll in Part B by paying a monthly premium.25 In 2020, the monthly premium is $144.60; however, about 3% of Part B enrollees pay less, due to a “hold-harmless” provision in the Social Security Act.26 Since 2007, higher-income Part B enrollees pay higher premiums. (See “Part B Financing.”) Although enrollment in Part B is voluntary for most individuals, in most cases, those who enroll in Part A by paying a premium also must enroll in Part B. Additionally, ESRD [end-stage renal disease] beneficiaries and Medicare Advantage enrollees (discussed below) also must enroll in Part B. …
Finally, each individual enrolled in either Part A or Part B is also entitled to obtain qualified prescription drug coverage through enrollment in a Part D prescription drug plan. Similar to Part B, enrollment in Part D is voluntary and the beneficiary pays a monthly premium. Since 2011, some higher-income enrollees pay higher premiums, similar to enrollees in Part B. Generally, beneficiaries enrolled in an MA plan providing qualified prescription drug coverage (MA–PD plan) must obtain their prescription drug coverage through that plan.
[211] Brief: “Spending Patterns for Prescription Drugs Under Medicare Part D.” By Tamara Hayford. Congressional Budget Office, December 1, 2011. <www.cbo.gov>
The centerpiece of the Medicare Prescription Drug, Improvement, and Modernization Act of 2003 (Medicare Modernization Act) was the creation of Medicare Part D, a subsidized pharmaceutical benefit that went into effect in 2006. That additional coverage constituted the most substantial expansion of the Medicare program since its inception in 1965. In 2010, the federal government spent $62 billion on Part D, representing 12 percent of total federal spending for Medicare that year.
[212] Calculated with data from:
a) Report: “Baseline Projections: Medicare.” Congressional Budget Office, May 2022. <www.cbo.gov>
Page 2: “By Fiscal Year, Billions of Dollars … Budget Information … Actual, 2021 … Total Benefits [=] 865 … Components of Offsetting Receipts† … Part A Premiums [=] –4 … Part B Premiumsg [=] –114 … Part D Premiumsh [=] –6”
b) Dataset: “Medicare Monthly Enrollment.” U.S. Department of Health & Human Services, Centers for Medicare and Medicaid Services, July 2022. <data.cms.gov>
“Total Beneficiaries … National … 2021 [=] 63,905,513”
CALCULATIONS:
NOTE: † Offsetting receipts are funds that the government collects from “ ‘business-like’ activities with the public, such as the sale of products or the rendering of services….” They are deposited in the U.S. Treasury and generally used to pay for mandatory programs such as Medicare and Social Security. Medicare premiums are the largest source of offsetting receipts, and the other “offsetting receipts” referenced above may come from a variety of sources unrelated to Medicare. [Report: “The Congressional Budget Process: An Explanation.” U.S. Senate, Committee on the Budget, 1998. Page 3. <www.congress.gov>]
[213] Report: “Medicare Primer.” By Patricia A. Davis and others. Congressional Research Service. Updated May 21, 2020. <sgp.fas.org>
Page 3:
Medicare was enacted in 1965 (P.L. 89-97) in response to the concern that only about half of the nation’s seniors had health insurance, and most of those had coverage only for inpatient hospital costs. The new program, which became effective July 1, 1966, included Part A coverage for hospital and posthospital services and Part B coverage for doctors and other medical services. As is the case for the Social Security program, Part A is financed by payroll taxes levied on current workers and their employers; persons must pay into the system for 40 quarters to become entitled to premium-free benefits. Medicare Part B is voluntary, with a monthly premium required of beneficiaries who choose to enroll.
Pages 6–7:
Most persons aged 65 or older are automatically entitled to premium-free Part A because they or their spouse paid Medicare payroll taxes for at least 40 quarters (about 10 years) on earnings covered by either the Social Security or the Railroad Retirement systems. Persons under the age of 65 who receive cash disability benefits from Social Security or the Railroad Retirement systems for at least 24 months are also entitled to Part A. …
Persons over the age of 65 who are not entitled to premium-free Part A may obtain coverage by paying a monthly premium ($458 in 2020) or, for persons with at least 30 quarters of covered employment, a reduced monthly premium ($252 in 2020).24 In addition, disabled persons who lose their cash benefits solely because of higher earnings, and subsequently lose their extended Medicare coverage, may continue their Medicare Part A enrollment by paying a premium, subject to limitations.
Generally, enrollment in Medicare Part B is voluntary. All persons entitled to Part A (and persons over the age of 65 who are not entitled to premium-free Part A) may enroll in Part B by paying a monthly premium.25 In 2020, the monthly premium is $144.60; however, about 3% of Part B enrollees pay less, due to a “hold-harmless” provision in the Social Security Act.26 Since 2007, higher-income Part B enrollees pay higher premiums.
[214] Report: “Health Care Spending and the Medicare Program.” U.S. Congress, Medicare Payment Advisory Commission, July 2022. <www.medpac.gov>
Page 28:
Chart 3-4. Total spending on health care services for noninstitutionalized FFS† Medicare beneficiaries, by source of payment, 2019
Per capita total spending = $15,973 … Medicare 66% … Public supplements 6% … Private supplements 14% … Beneficiaries’ direct spending 14% …
Note: FFS (fee-for-service). “Private supplements” include employer-sponsored plans and individually purchased coverage. “Public supplements” includes Medicaid, Department of Veterans Affairs, and other public coverage. “Beneficiaries’ direct spending” is on Medicare cost sharing and noncovered services, but not supplemental premiums. Analysis includes only FFS beneficiaries not living in institutions such as nursing homes.
NOTE: † FFS (fee-for-service) refers to the “traditional Medicare program, under which a fee generally is paid each time a service is used, with Medicare paying a share and the beneficiary paying the portion of the bill Medicare does not pay. … This contrasts with managed care and other health plan options offered through Medicare Advantage.” [Webpage: “Medicare Part D Glossary.” Omnicare. Accessed December 21, 2011 at <www.omnicare.com>]
[215] “2022 Annual Report of the Board of Trustees of the Federal Hospital Insurance and Federal Supplementary Medical Insurance Trust Funds.” United States Department of Health and Human Services, Centers for Medicare and Medicaid Services, June 2, 2022. <www.cms.gov>
Page 186: “About 10 million Medicare beneficiaries receive supplemental coverage through the Medicaid program; neither the growth rates for Medicare nor those for private health insurance reflect the Medicaid costs for these dual beneficiaries.”
[216] “2022 Annual Report of the Board of Trustees of the Federal Hospital Insurance and Federal Supplementary Medical Insurance Trust Funds.” United States Department of Health and Human Services, Centers for Medicare and Medicaid Services, June 2, 2022. <www.cms.gov>
Page 8: “Total expenditures in 2021 were $839.3 billion….”
[217] Calculated with data from: “Table 3.2. Federal Government Current Receipts and Expenditures.” United States Department of Commerce, Bureau of Economic Analysis. Last revised on October 27, 2022. <apps.bea.gov>
“(Billions of dollars) … 2021 … Current receipts [=] 4,319.0 … Current expenditures [=] 7,154.4”
CALCULATIONS:
[218] Calculated with data from: “2022 Annual Report of the Board of Trustees of the Federal Hospital Insurance and Federal Supplementary Medical Insurance Trust Funds.” United States Department of Health and Human Services, Centers for Medicare and Medicaid Services, June 2, 2022. <www.cms.gov>
Page 12: “Table II.B1.—Medicare Data for Calendar Year 2021”
Page 183: “Dedicated Medicare financing sources include HI [Hospital Insurance, a.k.a. Part A] payroll taxes; income from taxation of Social Security benefits; State transfers for the prescription drug benefit; premiums paid under Parts A, B, and D; fees on brand-name prescription drugs paid to Part B; and any gifts received by the Medicare trust funds.”
NOTE: An Excel file containing the data and calculations is available upon request.
[219] Report: “Analytical Perspectives: Budget of the United States Government, Fiscal Year 2005.” White House Office of Management and Budget, February 2004. <fraser.stlouisfed.org>
Page 339: “The main financing component of the Federal funds group is the general fund, which is used to carry out the general purposes of Government rather than being restricted by law to a specific program. It consists of all collections not earmarked by law to finance other funds, including virtually all income taxes and many excise taxes….”
[220] The Encyclopedia of Taxation & Tax Policy. Edited by Joseph J. Cordes and others. Urban Institute Press, 2005.
Page 469: “Spending from the general fund is financed by general revenues, which include the individual and corporation income taxes, some excise taxes, estate and gift taxes, tariffs, and miscellaneous receipts.”
[221] The table below shows the average federal general revenue taxes paid by various income groups in 2019, prior to the Covid-19 pandemic†:
|
Average Federal General Revenue Taxes (2019) |
|||
|
Household Income Group |
Full Income |
Effective Tax Rate |
Taxes Per Household |
|
Lowest 20% |
$39,100 |
–6.0% |
–$2,359 |
|
Second 20% |
$59,600 |
–0.7% |
–$424 |
|
Middle 20% |
$85,500 |
3.9% |
$3,300 |
|
Fourth 20% |
$124,900 |
7.0% |
$8,682 |
|
Highest 20% |
$333,100 |
17.6% |
$58,658 |
|
81st–90th% |
$181,300 |
10.2% |
$18,552 |
|
91st–95th% |
$250,400 |
13.0% |
$32,523 |
|
96th–99th% |
$417,400 |
17.6% |
$73,428 |
|
Top 1% |
$1,998,700 |
27.6% |
$551,879 |
The figures above were calculated with data from:
a) Dataset: “The Distribution of Household Income, 2019.” Congressional Budget Office, November 2022. <www.cbo.gov>
“Table 3. Average Household Income, by Income Source and Income Group, 1979 to 2019, 2019 Dollars”
“Table 7. Components of Federal Taxes, by Income Group, 1979 to 2019, 2019 Dollars”
b) Dataset: “Table 2.4 – Composition of Social Insurance and Retirement Receipts and of Excise Taxes: 1940–2027.” Executive Office of the President of the United States, Office of Management and Budget, March 28, 2022. <www.govinfo.gov>
c) Encyclopedia of Taxation & Tax Policy. Edited by Joseph J. Cordes and others. Urban Institute Press, 2005.
Page 469: “Spending from the general fund is financed by general revenues, which include the individual and corporation income taxes, some excise taxes, estate and gift taxes, tariffs, and miscellaneous receipts.”
d) Report: “Present Law and Background Information on Federal Excise Taxes.” United States Congress, Joint Committee on Taxation, January 2011. <www.jct.gov>
Page 1: “Revenues from certain Federal excise taxes are dedicated to trust funds (e.g., the Highway Trust Fund) for designated expenditure programs, and revenues from other excise taxes (e.g., alcoholic beverages) go to the General Fund for general purpose expenditures.”
NOTES:
“11 Mar 2020: Deeply concerned both by the alarming levels of spread and severity, and by the alarming levels of inaction, WHO made the assessment that Covid-19 could be characterized as a pandemic.”
[222] Report: “The Distribution of Household Income, 2019.” Congressional Budget Office, November 2022. <www.cbo.gov>
Page 16:
In this analysis, federal taxes consist of individual income taxes, payroll taxes, corporate income taxes, and excise taxes. The taxes allocated to households in the analysis account for approximately 93 percent of all federal revenues collected in 2019.12 …
… Among households in the lowest two quintiles, individual income taxes are negative, on average, because they include refundable tax credits, which can result in net payments from the government.
12 The remaining federal revenue sources not allocated to U.S. households include states’ deposits for unemployment insurance, estate and gift taxes, net income earned by the Federal Reserve System, customs duties, and miscellaneous fees and fines.
Pages 33–34:
Data
The core data used in CBO’s [Congressional Budget Office’s] distributional analyses come from the Statistics of Income (SOI), a nationally representative sample of individual income tax returns collected by the Internal Revenue Service (IRS). The number of returns sampled grew over the period studied—1979 to 2019—rising from roughly 90,000 in some of the early years to more than 350,000 in later years. That sample of tax returns becomes available to CBO approximately two years after the returns are filed. …
Information from tax returns is supplemented with data from the Annual Social and Economic Supplement of the Census Bureau’s Current Population Survey (CPS), which contains survey data on the demographic characteristics and income of a large sample of households.5 The two sources are combined by statistically matching each SOI record to a corresponding CPS record on the basis of demographic characteristics and income. Each pairing results in a new record that takes on some characteristics of the CPS record and some characteristics of the SOI record.6
Page 35:
Measures of Income, Federal Taxes, and Means-Tested Transfers
Most distributional analyses rely on a measure of annual income as the metric for ranking households. In CBO’s analyses, information on taxable income sources for tax-filing units that file individual income tax returns comes from the SOI, whereas information on nontaxable income sources and income for tax-filing units that do not file individual income tax returns comes from the CPS. Among households at the top of the distribution, the majority of income data are drawn from the SOI. In contrast, among households in the lower and middle quintiles, a larger portion of income data is drawn from the CPS….
Pages 39–40:
Household income, unless otherwise indicated, refers to income before accounting for the effects of means-tested transfers and federal taxes. Throughout this report, that income concept is called income before transfers and taxes. It consists of market income plus social insurance benefits.
Market income consists of the following:
• Labor income. Wages and salaries, including those allocated by employees to 401(k) and other employment-based retirement plans; employer-paid health insurance premiums (as measured by the Census Bureau’s Current Population Survey); the employer’s share of Social Security, Medicare, and federal unemployment insurance payroll taxes; and the share of corporate income taxes borne by workers.
• Business income. Net income from businesses and farms operated solely by their owners, partnership income, and income from S corporations.
• Capital income (including capital gains). Net profits realized from the sale of assets (but not increases in the value of assets that have not been realized through sales); taxable and tax-exempt interest; dividends paid by corporations (but not dividends from S corporations, which are considered part of business income); positive rental income; and the share of corporate income taxes borne by capital owners.†
• Other income sources. Income received in retirement for past services and other nongovernmental sources of income.
Social insurance benefits consist of benefits from Social Security (Old Age, Survivors, and Disability Insurance), Medicare (measured by the average cost to the government of providing those benefits), unemployment insurance, and workers’ compensation.
Means-tested transfers are cash payments and in-kind services provided through federal, state, and local government assistance programs. Eligibility to receive such transfers is determined primarily on the basis of income, which must be below certain thresholds. Means-tested transfers are provided through the following programs: Medicaid and the Children’s Health Insurance Program (measured by the average cost to the government of providing those benefits); the Supplemental Nutrition Assistance Program (formerly known as the Food Stamp program); housing assistance programs; Supplemental Security Income; Temporary Assistance for Needy Families and its predecessor, Aid to Families With Dependent Children; child nutrition programs; the Low Income Home Energy Assistance Program; and state and local government general assistance programs.
Average means-tested transfer rates are calculated as means-tested transfers divided by income before transfers and taxes.
Federal taxes consist of individual income taxes, payroll (or social insurance) taxes, corporate income taxes, and excise taxes. Those four sources accounted for 93 percent of federal revenues in fiscal year 2019. Revenue sources not examined in this report include states’ deposits for unemployment insurance, estate and gift taxes, net income of the Federal Reserve System that is remitted to the Treasury, customs duties, and miscellaneous fees and fines.
In this analysis, taxes for a given year are the amount a household owes on the basis of income received that year, regardless of when the taxes are paid. Those taxes comprise the following:
• Individual income taxes. Individual income taxes are paid by U.S. citizens and residents on their income from all sources, except those sources exempted under the law. Individual income taxes can be negative because they include the effects of refundable tax credits, which can result in net payments from the government. Specifically, if the amount of a refundable tax credit exceeds a filer’s tax liability before the credit is applied, the government pays that excess to the filer. Statutory marginal individual income tax rates are the rates set in law that apply to the last dollar of income.
• Payroll taxes. Payroll taxes are levied primarily on wages and salaries and generally have a single rate and few exclusions, deductions, or credits. Payroll taxes include those that fund the Social Security trust funds, the Medicare trust fund, and unemployment insurance trust funds. The federal portion of the unemployment insurance payroll tax covers only administrative costs for the program; state-collected unemployment insurance payroll taxes are not included in the Congressional Budget Office’s measure of federal taxes (even though they are recorded as revenues in the federal budget). Households can be entitled to future social insurance benefits, including Social Security, Medicare, and unemployment insurance, as a result of paying payroll taxes. In this analysis, average payroll tax rates capture the taxes paid in a given year and do not capture the benefits households may receive in the future.
• Corporate income taxes. Corporate income taxes are levied on the profits of U.S.-based corporations organized as C corporations. In its analysis, CBO allocated 75 percent of corporate income taxes in proportion to each household’s share of total capital income (including capital gains) and 25 percent to households in proportion to their share of labor income.
• Excise taxes. Sales of a wide variety of goods and services are subject to federal excise taxes. Most revenues from excise taxes are attributable to the sale of motor fuels (gasoline and diesel fuel), tobacco products, alcoholic beverages, and aviation-related goods and services (such as aviation fuel and airline tickets).
Average federal tax rates are calculated as federal taxes divided by income before transfers and taxes.
Income after transfers and taxes is income before transfers and taxes plus means-tested transfers minus federal taxes.
Income groups are created by ranking households by their size-adjusted income before transfers and taxes. A household consists of people sharing a housing unit, regardless of their relationships. The income quintiles (fifths) contain approximately the same number of people but slightly different numbers of households…. Similarly, each full percentile (hundredth) contains approximately the same number of people but a different number of households. If a household has negative income (that is, if its business or investment losses are larger than its other income), it is excluded from the lowest income group but included in totals.
NOTE: † See Just Facts’ research on the distribution of the federal tax burden for details about how the Congressional Budget Office determines the share of corporate income taxes borne by workers and owners of capital.
[223] Economists typically use a “comprehensive measure of income” to calculate effective tax rates, because this provides a complete “measure of ability to pay” taxes.† In keeping with this, Just Facts determines effective tax rates by dividing all measurable taxes by all income. The Congressional Budget Office (CBO) previously did the same,‡ but in 2018, CBO announced that it would exclude means-tested transfers from its measures of income and effective tax rates.§ #
Given this change, Just Facts now uses CBO data to determine comprehensive income and effective tax rates by adding back the means-tested transfers that CBO publishes but takes out of these measures. To do this, Just Facts makes a simplifying assumption that households in various income quintiles do not significantly change when these transfers are added. This is mostly true, but as CBO notes:
Almost one-fifth of the households in the lowest quintile of income before transfers and taxes would have been in higher quintiles if means-tested transfers were included in the ranking measure (see Table 5). Because net movement into a higher income quintile entails a corresponding net movement out of those quintiles, more than one-fifth of the households in the second quintile of income before transfers and taxes would have been bumped down into the bottom before-tax income quintile. Because before-tax income excludes income in the form of means-tested transfers, almost one-fifth of the people in the lowest quintile of income before transfers and taxes were in higher before-tax income quintiles. There is no fundamental economic change represented by those changes in income groups—just a change in the income definition used to rank households. Because means-tested transfers predominantly go to households in the lower income quintiles, there is not much shuffling across income quintile thresholds toward the top of the distribution.§
NOTES:
[224] The table below shows the average federal general revenue taxes paid by various income groups in 2020—amid Covid-19 government lockdowns and intensified social spending† ‡ §:
|
Average Federal General Revenue Taxes (2020) |
|||
|
Household Income Group |
Full Income |
Effective Tax Rate |
Taxes Per Household |
|
Lowest 20% |
$42,200 |
–13.7% |
–$5,798 |
|
Second 20% |
$63,600 |
–6.7% |
–$4,230 |
|
Middle 20% |
$90,500 |
–1.4% |
–$1,295 |
|
Fourth 20% |
$131,800 |
3.6% |
$4,739 |
|
Highest 20% |
$360,900 |
17.1% |
$61,609 |
|
81st–90th% |
$191,500 |
8.2% |
$15,707 |
|
91st–95th% |
$265,100 |
12.0% |
$31,775 |
|
96th–99th% |
$440,000 |
17.3% |
$76,077 |
|
Top 1% |
$2,291,800 |
27.6% |
$633,629 |
The figures above were calculated with data from:
a) Dataset: “The Distribution of Household Income, 2020.” Congressional Budget Office, November 2023. <www.cbo.gov>
“Table 3. Average Household Income, by Income Source and Income Group, 1979 to 2020, 2020 Dollars”
“Table 7. Components of Federal Taxes, by Income Group, 1979 to 2020, 2020 Dollars”
b) Dataset: “Table 2.4 – Composition of Social Insurance and Retirement Receipts and of Excise Taxes: 1940–2028.” Executive Office of the President of the United States, Office of Management and Budget, March 13, 2023. <www.govinfo.gov>
c) The Encyclopedia of Taxation & Tax Policy. Edited by Joseph J. Cordes and others. Urban Press Institute, 2005.
Page 469: “Spending from the general fund is financed by general revenues, which include the individual and corporation income taxes, some excise taxes, estate and gift taxes, tariffs, and miscellaneous receipts.”
d) Report: “Present Law and Background Information on Federal Excise Taxes.” United States Congress, Joint Committee on Taxation, January 2011. <www.jct.gov>
Page 1: “Revenues from certain Federal excise taxes are dedicated to trust funds (for example, the Highway Trust Fund) for designated expenditure programs, and revenues from other excise taxes (for example, alcoholic beverages) go to the General Fund for general purpose expenditures.”
NOTES:
Page 1: “To reduce the spread of coronavirus disease 2019 (Covid-19), nearly all states have issued stay-at-home orders and shut down establishments deemed nonessential.”
“Throughout the pandemic, officials across the United States have rolled out a patchwork of restrictions on social distancing, masking and other aspects of public life. The orders vary by state, county and even city. At the height of restrictions in late March and early April 2020, more than 310 million Americans were under directives ranging from “shelter in place” to “stay at home.” Restrictions are now ramping down in many places, as most states have fully reopened their economies.”
Calculated with data from:
a) Report: “CBO Estimate for H.R. 6074, the Coronavirus Preparedness and Response Supplemental Appropriations Act, 2020, as Posted on March 4, 2020.” Congressional Budget Office, March 4, 2020. <www.cbo.gov>
b) Report: “Cost Estimate for H.R. 6201, Families First Coronavirus Response Act, Enacted as Public Law 116-127 on March 18, 2020.” Congressional Budget Office, April 2, 2020. <www.cbo.gov>
c) Report: “Cost Estimate for H.R. 748, CARES Act, Public Law 116-136.” Congressional Budget Office, April 16, 2020. <www.cbo.gov>
d) Report: “CBO Estimate for H.R. 266, the Paycheck Protection Program and Health Care Enhancement Act as Passed by the Senate on April 21, 2020.” Congressional Budget Office, April 22, 2020. <www.cbo.gov>
e) Report: “Estimate for Division N—Additional Coronavirus Response and Relief, H.R. 133, Consolidated Appropriations Act, 2021, Public Law 116-260, Enacted on December 27, 2020.” Congressional Budget Office, January 14, 2021. <www.cbo.gov>
f) Report: “Estimated Budgetary Effects of H.R. 1319, American Rescue Plan Act of 2021 as Passed by the Senate on March 6, 2021.” Congressional Budget Office, March 10, 2021. <www.cbo.gov>
g) Dataset: “HH-1. Households by Type: 1940 to Present.” U.S. Census Bureau, Current Population Survey, November 2021. <www.census.gov>
An Excel file containing the data and calculations is available upon request.
[225] Report: “The Distribution of Household Income, 2020.” Congressional Budget Office, November 2023. <www.cbo.gov>
Page 8:
In this analysis, federal taxes consist of individual income taxes, payroll taxes, corporate income taxes, and excise taxes.7 Taken together, those taxes accounted for over 90 percent of all federal revenues collected in 2020. Among the sources of revenues, individual income taxes and payroll taxes are the largest, followed by corporate taxes and excise taxes.8
7 The remaining federal revenue sources not allocated to U.S. households are states’ deposits for unemployment insurance, estate and gift taxes, net income earned by the Federal Reserve System, customs duties, and miscellaneous fees and fines.
Pages 31–32: “Individual income taxes can be negative because they include the effects of refundable tax credits, which can result in net payments from the government. Specifically, if the amount of a refundable tax credit exceeds a filer’s tax liability before the credit is applied, the government pays that excess to the filer.”
Page 20:
Data
The core data used in CBO’s distributional analyses come from the Statistics of Income (SOI), a nationally representative sample of individual income tax returns collected by the IRS. That sample of tax returns becomes available to CBO approximately two years after the returns are filed. Data on household income are systematically and consistently reported in the SOI. The sample is therefore considered a reliable resource to use when analyzing the effects of fiscal policy on income. However, certain types of income are not reported in the SOI. In 2020, for example, the portion of payments from the Paycheck Protection Program that was not used to pay for employees’ wages was not taxable and therefore not available in the SOI data.
SOI data include information about tax filers’ family structure and age, but they do not include certain demographic information or data on people who do not file taxes. For that information, CBO uses data from the Annual Social and Economic Supplement of the Census Bureau’s Current Population Survey (CPS), which has data on the demographic characteristics and income of a large sample of households.6
CBO combines the two data sources, statistically matching each SOI record to a corresponding CPS record on the basis of demographic characteristics and income. Each pairing results in a new record that takes on some characteristics of the CPS record and some characteristics of the SOI record.7
Page 22:
Measures of Income, Federal Taxes, and Means-Tested Transfers
Most distributional analyses rely on a measure of annual income as the metric for ranking households. In CBO’s analyses of the distribution of household income, information about taxable income sources for tax-filing units that file individual income tax returns comes from the SOI, whereas information about nontaxable income sources and income for tax-filing units that do not file individual income tax returns comes from the CPS. Among households at the top of the income distribution, the majority of income data are drawn from the SOI. In contrast, among households in the lower and middle quintiles, a larger portion of income data is drawn from the CPS….
Pages 31–32:
Household income, unless otherwise indicated, refers to income before the effects of means-tested transfers and federal taxes are accounted for. Throughout this report, that income concept is called income before transfers and taxes. It consists of market income plus social insurance benefits.
Market income consists of the following five elements:
• Labor income. Wages and salaries, including those allocated by employees to 401(k) and other employment-based retirement plans; employer-paid health insurance premiums (as measured by the Census Bureau’s Current Population Survey); the employer’s share of payroll taxes for Social Security, Medicare, and federal unemployment insurance; and the share of corporate income taxes borne by workers.
• Business income. Net income from businesses and farms operated solely by their owners, partnership income, and income from S corporations.
• Capital gains. Net profits realized from the sale of assets (but not increases in the value of assets that have not been realized through sales).
• Capital income. Taxable and tax-exempt interest, dividends paid by corporations (but not dividends from S corporations, which are considered part of business income), rental income, and the share of corporate income taxes borne by capital owners.
• Other income sources. Income received in retirement for past services and other nongovernmental sources of income.
Social insurance benefits consist of benefits from Social Security (Old Age, Survivors, and Disability Insurance), Medicare (measured by the average cost to the government of providing those benefits), regular unemployment insurance (but not expanded unemployment compensation), and workers’ compensation.
Means-tested transfers are cash payments and in-kind services provided through federal, state, and local government assistance programs. Eligibility to receive such transfers is determined primarily on the basis of income, which must be below certain thresholds. Means-tested transfers are provided through the following programs: Medicaid and the Children’s Health Insurance Program (measured by the average cost to the federal government and state governments of providing those benefits); the Supplemental Nutrition Assistance Program (formerly known as the Food Stamp program); housing assistance programs; Supplemental Security Income; Temporary Assistance for Needy Families and its predecessor, Aid to Families With Dependent Children; child nutrition programs; the Low Income Home Energy Assistance Program; and state and local governments’ general assistance programs. For 2020, CBO included expanded unemployment compensation in means-tested transfers.
Average means-tested transfer rates are calculated as means-tested transfers (totaled within an income group) divided by income before transfers and taxes (totaled within an income group).
Federal taxes consist of individual income taxes, payroll (or social insurance) taxes, corporate income taxes, and excise taxes. Those four sources accounted for 94 percent of federal revenues in fiscal year 2020. Revenue sources not examined in this report include states’ deposits for unemployment insurance, estate and gift taxes, net income of the Federal Reserve System that is remitted to the Treasury, customs duties, and miscellaneous fees and fines.
In this analysis, taxes for a given year are the amount a household owes on the basis of income received in that year, regardless of when the taxes are paid. Those taxes comprise the following four categories:
• Individual income taxes. Individual income taxes are levied on income from all sources, except those excluded by law. Individual income taxes can be negative because they include the effects of refundable tax credits (including recovery rebate credits), which can result in net payments from the government. Specifically, if the amount of a refundable tax credit exceeds a filer’s tax liability before the credit is applied, the government pays that excess to the filer. Statutory marginal individual income tax rates are the rates set in law that apply to the last dollar of income.
• Payroll taxes. Payroll taxes are levied primarily on wages and salaries. They generally have a single rate and few exclusions, deductions, or credits. Payroll taxes include those that fund the Social Security trust funds, the Medicare trust fund, and unemployment insurance trust funds. The federal portion of the unemployment insurance payroll tax covers only administrative costs for the program; state-collected unemployment insurance payroll taxes are not included in the Congressional Budget Office’s measure of federal taxes (even though they are recorded as revenues in the federal budget). Households can be entitled to future social insurance benefits, including Social Security, Medicare, and unemployment insurance, as a result of paying payroll taxes. In this analysis, average payroll tax rates capture the taxes paid in a given year and do not capture the benefits that households may receive in the future.
• Corporate income taxes. Corporate income taxes are levied on the profits of U.S.–based corporations organized as C corporations. In this analysis, CBO allocated 75 percent of corporate income taxes in proportion to each household’s share of total capital income (including capital gains) and 25 percent to households in proportion to their share of labor income.
• Excise taxes. Sales of a wide variety of goods and services are subject to federal excise taxes. Most revenues from excise taxes are attributable to the sale of motor fuels (gasoline and diesel fuel), tobacco products, alcoholic beverages, and aviation-related goods and services (such as aviation fuel and airline tickets).
Average federal tax rates are calculated as federal taxes (totaled within an income group) divided by income before transfers and taxes (totaled within an income group).
Income after transfers and taxes is income before transfers and taxes plus means-tested transfers minus federal taxes.
Income groups are created by ranking households by their size-adjusted income before transfers and taxes. A household consists of people sharing a housing unit, regardless of their relationship. The income quintiles (or fifths of the distribution) contain approximately the same number of people but slightly different numbers of households…. Similarly, each full percentile (or hundredth of the distribution) contains approximately the same number of people but a different number of households. If a household has negative income (that is, if its business or investment losses exceed its other income), it is excluded from the lowest income group but included in totals.
NOTE: † See Just Facts’ research on the distribution of the federal tax burden for details about how the Congressional Budget Office determines the share of corporate income taxes borne by workers and owners of capital.
[226] Economists typically use a “comprehensive measure of income” to calculate effective tax rates because this provides a complete “measure of ability to pay” taxes.† In keeping with this, Just Facts determines effective tax rates by dividing all measurable taxes by all income. The Congressional Budget Office (CBO) previously did the same,‡ but in 2018, CBO announced that it would exclude means-tested transfers from its measures of income and effective tax rates.§ #
Given this change, Just Facts now uses CBO data to determine comprehensive income and effective tax rates by adding back the means-tested transfers that CBO publishes but takes out of these measures. To do this, Just Facts makes a simplifying assumption that households in various income quintiles do not significantly change when these transfers are added. This is mostly true, but as CBO notes:
Almost one-fifth of the households in the lowest quintile of income before transfers and taxes would have been in higher quintiles if means-tested transfers were included in the ranking measure (see Table 5). Because net movement into a higher income quintile entails a corresponding net movement out of those quintiles, more than one-fifth of the households in the second quintile of income before transfers and taxes would have been bumped down into the bottom before-tax income quintile. Because before-tax income excludes income in the form of means-tested transfers, almost one-fifth of the people in the lowest quintile of income before transfers and taxes were in higher before-tax income quintiles. There is no fundamental economic change represented by those changes in income groups—just a change in the income definition used to rank households. Because means-tested transfers predominantly go to households in the lower income quintiles, there is not much shuffling across income quintile thresholds toward the top of the distribution.§
NOTES:
[227] “2022 Annual Report of the Board of Trustees of the Federal Hospital Insurance and Federal Supplementary Medical Insurance Trust Funds.” United States Department of Health and Human Services, Centers for Medicare and Medicaid Services, June 2, 2022. <www.cms.gov>
Page 12:
For HI [Hospital Insurance, a.k.a. Medicare Part A], the primary source of financing is the payroll tax on covered earnings. Employers and employees each pay 1.45 percent of a worker’s wages, while self-employed workers pay 2.9 percent of their net earnings. Starting in 2013, high-income workers pay an additional 0.9-percent tax on their earnings above an unindexed threshold ($200,000 for single taxpayers and $250,000 for married couples).
[228] Report: “Reducing the Deficit: Spending and Revenue Options.” Congressional Budget Office, March 2011. <www.cbo.gov>
Pages 133–134: “Households generally bear the economic cost, or burden, of the taxes that they pay themselves, such as individual income taxes and employees’ share of payroll taxes. But households also bear the burden of the taxes paid by businesses. In the judgment of CBO [Congressional Budget Office] and most economists, the employers’ share of payroll taxes is passed on to employees in the form of lower wages.”
NOTE: For more details about the economic incidence of payroll taxes, see Just Facts’ research on tax distribution.
[229] Report: “Overview of the Federal Tax System as in Effect for 2022.” U.S. Congress, Joint Committee on Taxation, June 28, 2022. <www.jct.gov>
Page 23:
Additional Hospital Insurance Tax on Certain High-Income Individuals
The employee portion of the HI [Hospital Insurance, a.k.a. Medicare Part A] tax is increased by an additional tax of 0.9 percent on wages received in excess of a specific threshold amount.113 Employers are required to withhold the additional 0.9 percent on wages of the employee in excess of $200,000. However, unlike the general 1.45 percent HI tax on wages, this additional tax is on the combined wages of the employee and the employee’s spouse, in the case of a joint return. The threshold amount is $250,000 in the case of married filing jointly, $125,000 in the case of married filing separately, and $200,000 in any other case (unmarried individual, head of household or surviving spouse).114 Any difference between the amount withheld on wages in excess of $200,000 and the applicable tax based on the thresholds is reconciled on the individual’s personal income tax return.
The same additional HI tax applies to the HI portion of SECA [Self-Employment Contributions Act] tax on self-employment income in excess of the threshold amount. Thus, an additional tax of 0.9 percent is imposed on every self-employed individual on self-employment income in excess of the applicable threshold amount.115
113 Sec. 3101(b), as amended by the Patient Protection and Affordable Care Act, Pub. L. No. 111-148.
114 These threshold amounts are not indexed for inflation.
115 Sec. 1402(b).
[230] “2022 Annual Report of the Board of Trustees of the Federal Hospital Insurance and Federal Supplementary Medical Insurance Trust Funds.” United States Department of Health and Human Services, Centers for Medicare and Medicaid Services, June 2, 2022. <www.cms.gov>
Page 40:
The value of SMI [Supplementary Medical Insurance, i.e., Medicare Parts B and D] benefits to individual enrollees and their cost-sharing payments vary … depending on their income, assets, and use of covered health services in a given year. In particular, Medicaid pays Part B premiums and cost-sharing amounts for beneficiaries with very low incomes, and the Medicare low-income drug subsidy pays the corresponding Part D amounts (except for nominal copayments). Moreover, high-income beneficiaries have paid an income-related premium for Part B since 2007 and for Part D since 2011.
[231] Report: “Medicare Primer.” By Patricia A. Davis and others. Congressional Research Service. Updated May 21, 2020. <sgp.fas.org>
Page 4: “In 2003, Congress enacted the Medicare Prescription Drug, Improvement, and Modernization Act of 2003 (MMA; P.L. 108-173),10 which … introduced the concept of income testing into Medicare, with higher-income persons paying larger Part B premiums beginning in 2007….”
[232] Brief: “Spending Patterns for Prescription Drugs Under Medicare Part D.” By Tamara Hayford. Congressional Budget Office, December 1, 2011. <www.cbo.gov>
The centerpiece of the Medicare Prescription Drug, Improvement, and Modernization Act of 2003 (Medicare Modernization Act) was the creation of Medicare Part D, a subsidized pharmaceutical benefit that went into effect in 2006. …
Under Medicare Part D, all enrollees receive a subsidy for prescription drug insurance. For enrollees with sufficiently low income and assets, an additional low-income subsidy (LIS) is available (enrollees who receive the LIS benefit are referred to here as LIS enrollees). …
• The federal government paid for approximately 95 percent of spending for LIS beneficiaries, by covering nearly all of LIS beneficiaries’ premiums for the basic benefit and by subsidizing most of LIS beneficiaries’ out-of-pocket spending. (In fact, 75 percent of federal spending on Part D is for LIS beneficiaries.)
• The federal government covered roughly 40 percent of spending for non-LIS beneficiaries through premium subsidies. Beneficiaries covered most of the remainder through premiums and out-of-pocket spending.
[233] “2022 Annual Report of the Board of Trustees of the Federal Hospital Insurance and Federal Supplementary Medical Insurance Trust Funds.” United States Department of Health and Human Services, Centers for Medicare and Medicaid Services, June 2, 2022. <www.cms.gov>
Page 49:
Up to 85 percent of an individual’s or couple’s OASDI [Social Security] benefits may be subject to Federal income taxation if their income exceeds certain thresholds.† The income tax revenue attributable to the first 50 percent of OASDI benefits is allocated to the OASI and DI [Social Security] trust funds. The revenue associated with the amount between 50 and 85 percent of benefits is allocated to the HI [Hospital Insurance, a.k.a. Medicare Part A] trust fund.
NOTE: † These thresholds are exceeded if the “total of one-half of your benefits and all your other income is more than $34,000 ($44,000 if you are married filing jointly).” [Pamphlet: “Social Security and Equivalent Railroad Retirement Benefits for Use in Preparing 2021 Returns.” United States Department of the Treasury, Internal Revenue Service, January 6, 2022. <www.irs.gov> Page 6.]
[234] “2022 Annual Report of the Board of Trustees of the Federal Hospital Insurance and Federal Supplementary Medical Insurance Trust Funds.” United States Department of Health and Human Services, Centers for Medicare and Medicaid Services, June 2, 2022. <www.cms.gov>
Page 183: “Dedicated Medicare financing sources include … State transfers for the prescription drug benefit….”
[235] Report: “Effects of the Patient Protection and Affordable Care Act on the Federal Budget and the Balance in the Hospital Insurance Trust Fund.” Congressional Budget Office, December 23, 2009. <www.cbo.gov>
The HI [Hospital Insurance or Medicare Part A] trust fund, like other federal trust funds, is essentially an accounting mechanism. In a given year, the sum of specified HI receipts and the interest that is credited on the previous trust fund balance, less spending for Medicare Part A benefits, represents the surplus (or deficit, if the latter is greater) in the trust fund for that year. Any cash generated when there is an excess of receipts over spending is not retained by the trust fund; rather, it is turned over to the Treasury, which provides government bonds to the trust fund in exchange and uses the cash to finance the government’s ongoing activities. This same description applies to the Social Security trust funds; those funds have run cash surpluses for many years, and those surpluses have reduced the government’s need to borrow to fund other federal activities. The HI trust fund is not currently running an annual surplus.
The HI trust fund is part of the federal government, so transactions between the trust fund and the Treasury are intragovernmental and leave no imprint on the unified budget. From a unified budget perspective, any increase in revenues or decrease in outlays in the HI trust fund represents cash that can be used to finance other government activities without requiring new government borrowing from the public. Similarly, any increase in outlays or decrease in revenues in the HI trust fund in some future year represents a draw on the government’s cash in that year. Thus, the resources to redeem government bonds in the HI trust fund and thereby pay for Medicare benefits in some future year will have to be generated from taxes, other government income, or government borrowing in that year.
Reports on HI trust fund balances from the Medicare trustees and others show the extent of prefunding of benefits that theoretically is occurring in the trust fund. However, because the government has used the cash from the trust fund surpluses to finance other current activities rather than saving the cash by running unified budget surpluses, the government as a whole has not been truly prefunding Medicare benefits. The nature of trust fund accounting within a unified budget framework implies that trust fund balances convey little information about the extent to which the federal government has prepared for future financial burdens, and therefore that trust funds have important legal meaning but little economic meaning.
[236] Report: “Medicare Financial Status: In Brief.” By Patricia A. Davis. Congressional Research Service, July 2, 2018. Updated 10/21/2021. <fas.org>
Page 3: “Other sources of income to the HI [Hospital Insurance, i.e., Part A] Trust Fund include … interest on federal securities held by the trust fund.”
Page 4: “When the government receives Medicare revenues … income is credited by the Treasury to the HI Trust Fund in the form of special-issue interest-bearing government securities.11 (Interest on these securities also is credited to the trust fund.)”
[237] “2022 Annual Report of the Board of Trustees of the Federal Hospital Insurance and Federal Supplementary Medical Insurance Trust Funds.” United States Department of Health and Human Services, Centers for Medicare and Medicaid Services, June 2, 2022. <www.cms.gov>
Page 13: “Other HI [Hospital Insurance, i.e., Part A] revenue sources include a portion of the Federal income taxes that Social Security recipients with incomes above certain unindexed thresholds pay on their benefits, as well as interest earned on the securities held in the HI trust fund.”
Page 249: “For the HI and SMI [Supplementary Medical Insurance, i.e., Parts B and D] trust funds, monies not withdrawn for current benefit payments and administrative expenses are invested in interest-bearing Federal securities, as required by law; the interest earned is also deposited in the trust funds.”
Pages 24–25: “Moreover, in the absence of legislation to address the financial imbalance, interest earnings on trust fund assets and redemption of those assets will cover the difference between HI [Hospital Insurance, i.e., Part A] dedicated revenues and expenditures until 2028.23”
[238] “2022 Annual Report of the Board of Trustees of the Federal Hospital Insurance and Federal Supplementary Medical Insurance Trust Funds.” United States Department of Health and Human Services, Centers for Medicare and Medicaid Services, June 2, 2022. <www.cms.gov>
Page 183: “Dedicated Medicare financing sources include … fees on brand-name prescription drugs paid to Part B; and any gifts received by the Medicare trust funds.”
[239] Report: “Physician Acceptance of New Medicaid Patients: Findings from the National Electronic Health Records Survey.” U.S. Medicaid and CHIP [Children’s Health Insurance Program] Payment and Access Commission, June 2021. <www.macpac.gov>
Page 2:
Similar to prior analysis, physicians were significantly less likely to accept new patients covered by Medicaid than those with Medicare or private insurance, although acceptance varied by specialty and by state. …
Table 1. Percentage of Physicians Accepting Payments for New Patients by Specialty and Coverage Type, 2017 … Specialty [=] Primary care … Medicaid [=] 75.8% … Medicare [=] 80.6% … Private [=] 96.8%
[240] Report: “Underpayment by Medicare and Medicaid.” American Hospital Association, February 2022. <www.aha.org>
Page 1: “[A]s a condition for receiving federal tax exemption for providing health care to the community, not-for-profit hospitals are required to care for Medicare and Medicaid beneficiaries. Also, Medicare and Medicaid account for more than 60 percent of all care provided by hospitals. Consequently, very few hospitals can elect not to participate in Medicare and Medicaid.”
[241] Report: “Projected Medicare Expenditures Under an Illustrative Scenario with Alternative Payment Updates to Medicare Providers.” By John D. Shatto and M. Kent Clemens. United States Department of Health and Human Services, Centers for Medicare and Medicaid Services, Office of the Actuary, June 2, 2022. <www.cms.gov>
Page 5:
For inpatient hospital services, Medicare payment rates in 2011 were about 68 percent, and Medicaid payment rates were about 71 percent, of private health insurance payment rates (including Medicaid disproportionate share hospital, or DSH, payments).10 As shown in figure 1, Medicare and Medicaid payment rates fell to roughly 60 percent and 62 percent, respectively, of private health insurance rates in 2019, in part due to the productivity adjustments that started in 2012.
10 American Hospital Association, 2020 TrendWatch Chartbook.
[242] Report: “Underpayment by Medicare and Medicaid.” American Hospital Association, February 2022. <www.aha.org>
Pages 1–2:
Each year, the American Hospital Association (AHA) collects aggregate information on the payments and costs associated with care delivered to beneficiaries of Medicare and Medicaid by U.S. hospitals. The data used to generate these numbers come from the AHA’s Annual Survey of Hospitals, which is the nation’s most comprehensive source of hospital financial data. …
Payment rates for Medicare and Medicaid, with the exception of managed care plans, are set by law rather than through a negotiation process, as with private insurers. These payment rates are currently set below the costs of providing care, resulting in underpayment.
Underpayment is the difference between the costs incurred and the reimbursement received for delivering care to patients. Underpayment occurs when the payment received is less than the costs of providing care, i.e., the amount paid by hospitals for the personnel, technology and other goods and services required to provide hospital care is more than the amount paid to them by Medicare or Medicaid for providing that care. …
In the aggregate, both Medicare and Medicaid payments fell below costs in 2020:
• Combined underpayments were $100.4 billion in 2020, up from $75.8 billion in 2019. The 2020 underpayment includes a shortfall of $75.6 billion for Medicare and $24.8 billion for Medicaid.
• For Medicare, hospitals received payment of only 84 cents for every dollar spent by hospitals caring for Medicare patients in 2020.
• For Medicaid, hospitals received payment of only 88 cents for every dollar spent by hospitals caring for Medicaid patients in 2020.
• In 2020, 67 percent of hospitals received Medicare payments less than cost, while 62 percent of hospitals received Medicaid payments less than cost.
[243] Report: “Projected Medicare Expenditures Under an Illustrative Scenario with Alternative Payment Updates to Medicare Providers.” By John D. Shatto and M. Kent Clemens. United States Department of Health and Human Services, Centers for Medicare and Medicaid Services, Office of the Actuary, June 2, 2022. <www.cms.gov>
Page 5:
For inpatient hospital services, Medicare payment rates in 2011 were about 68 percent, and Medicaid payment rates were about 71 percent, of private health insurance payment rates (including Medicaid disproportionate share hospital, or DSH, payments).10 As shown in figure 1, Medicare and Medicaid payment rates fell to roughly 60 percent and 62 percent, respectively, of private health insurance rates in 2019, in part due to the productivity adjustments that started in 2012. Payment rates for the two programs decline in tandem over the next 75 years (because of the UPLs [upper payment limits]), and, by the end of the long-range projection period [2097], Medicare and Medicaid payment rates for inpatient hospital services would each represent roughly 40 percent of the average level for private health insurance.
[244] “2011 Annual Report of the Board of Trustees of the Federal Hospital Insurance and Federal Supplementary Medical Insurance Trust Funds.” United States Department of Health and Human Services, Centers for Medicare and Medicaid Services, May 13, 2011. <www.cms.gov>
Pages 265–266:
Statement of Actuarial Opinion …
While the Part B projections in this report are reasonable in their portrayal of future costs under current law, they are not reasonable as an indication of actual future costs. …
Further, while the Affordable Care Act makes important changes to the Medicare program and substantially improves its financial outlook, there is a strong likelihood that certain of these changes will not be viable in the long range. Specifically, the annual price updates for most categories of non-physician health services will be adjusted downward each year by the growth in economy-wide productivity. The best available evidence indicates that most health care providers cannot improve their productivity to this degree—or even approach such a level—as a result of the labor-intensive nature of these services.
Without major changes in health care delivery systems, the prices paid by Medicare for health services are very likely to fall increasingly short of the costs of providing these services. By the end of the long-range projection period, Medicare prices for hospital, skilled nursing facility, home health, hospice, ambulatory surgical center, diagnostic laboratory, and many other services would be less than half of their level under the prior law. Medicare prices would be considerably below the current relative level of Medicaid prices, which have already led to access problems for Medicaid enrollees, and far below the levels paid by private health insurance. Well before that point, Congress would have to intervene to prevent the withdrawal of providers from the Medicare market and the severe problems with beneficiary access to care that would result. Overriding the productivity adjustments, as Congress has done repeatedly in the case of physician payment rates, would lead to far higher costs for Medicare in the long range than those projected under current law.
[245] Report: “Rural Hospital Closures: Number and Characteristics of Affected Hospitals and Contributing Factors.” U.S. Government Accountability Office, August 29, 2018. <www.gao.gov>
Page 2 (of PDF):
GAO’s [Government Accountability Office’s] analysis of data from HHS [Department of Health & Human Services] and an HHS-funded research center shows that 64 rural hospitals closed from 2013 through 2017. This represents approximately 3 percent of all the rural hospitals in 2013 and more than twice the number of closures of the prior 5-year period. …
According to literature GAO reviewed and stakeholders GAO interviewed, rural hospital closures were generally preceded and caused by financial distress. In particular, rural hospitals that closed typically had negative margins that made it difficult to cover their fixed costs. According to these sources, financial distress has been exacerbated in recent years by multiple factors, including the decrease in patients seeking inpatient care and across-the-board Medicare payment reductions.
Page 20:
Medicare Dependent Hospitals—one of three Medicare rural hospital payment designations in which hospitals were eligible to receive a payment rate other than standard Medicare inpatient payment rate—were disproportionately represented among hospital closures. Specifically, Medicare Dependent Hospitals represented 9 percent of the rural hospitals in 2013, but accounted for 25 percent of the rural hospital closures from 2013 through 2017. Rural hospitals that did not receive one of these three Medicare rural hospital payment designations also represented a disproportionate share of the closures (see fig. 3). In addition, hospitals designated as Low Volume Hospitals had a disproportionate share of the rural hospital closures.39
Page 21:
Figure 3: Percentage of Rural Hospitals in 2013 Relative to Percentage of Rural Hospital Closures from 2013 through 2017, by Medicare Rural Hospital Payment Designation …
Medicare Dependent Hospital … All rural hospitals nationwide 2013 [=] 9% … All rural hospital closures nationwide 2013–2017 [=] 25% … Hospitals receiving Medicare standard inpatient paymenta … All rural hospitals nationwide 2013 [=] 22% … All rural hospital closures nationwide 2013–2017 [=] 30% … a Hospitals that did not qualify as a Critical Access Hospital, Sole Community Hospital, or Medicare Dependent Hospital are included in this figure as hospital receiving Medicare standard inpatient payment. Medicare paid these hospitals for inpatient services based on the inpatient prospective payment system methodology.
Pages 25–26:
Another factor highlighted by literature we reviewed and stakeholders we interviewed as contributing to rural hospitals’ increased financial distress was across-the-board Medicare payment reductions. Rural hospitals are sensitive to changes to Medicare payments because, on average, Medicare accounted for approximately 46 percent of their gross patient revenues in 2016.48 A 2016 study found that Medicare Dependent Hospitals’ operating margins decreased each year from 2012 through 2014, which could explain the disproportionate number of closures among the Medicare Dependent Hospital payment designation.49 The literature we reviewed and stakeholders we interviewed highlighted the recent Medicare payments cuts as contributing to rural hospital closures, which included the following:
• Reductions in nearly all Medicare reimbursements. Under sequestration—the cancellation of budgetary resources under presidential order implemented pursuant to the Balanced Budget and Emergency Deficit Control Act of 1985, as amended—each fiscal year since 2013, nearly all Medicare’s budget authority is subject to a reduction not exceeding 2 percent, which is implemented through reductions in payment amounts.50 According to stakeholders we interviewed, these payment reductions have contributed to negative margins for rural hospitals.
• Reductions in Medicare bad debt payments. Under the Middle Class Tax Relief and Job Creation Act of 2012, Medicare bad debt reimbursements for hospitals were reduced beginning in fiscal year 2013.51 According to stakeholders, Medicare bad debt cuts have been one of the most important factors contributing to the recent increase in rural hospital closures.
48 Revenue estimate is from the American Hospital Association, which defined rural as non-metropolitan counties. In comparison, Medicare accounted for approximately 43 percent of urban hospitals’ gross revenues in 2016.
49 One of the eligibility requirements for the Medicare Dependent Hospitals is the hospital must have greater than or equal to 60 percent of inpatient days or discharges from Medicare beneficiaries. See app. I, table 2, for a description of each of the five Medicare rural hospital payment designations. See S.R. Thomas and others, 2012–14 Profitability of Urban and Rural Hospitals by Medicare Payment Classification (Chapel Hill, N.C.: North Carolina Rural Health Research Program. 2016), 3.
[246] Article: “Scientific Survey Shows Voters Widely Accept Misinformation Spread By the Media.” By James D. Agresti. Just Facts, January 2, 2020. <www.justfacts.com>
The survey was conducted by Triton Polling & Research, an academic research firm that serves scholars, corporations, and political campaigns. The responses were obtained through live telephone surveys of 700 likely voters across the U.S. during December 2–11, 2019. This sample size is large enough to accurately represent the U.S. population. Likely voters are people who say they vote “every time there is an opportunity” or in “most” elections.
The margin of sampling error for the total pool of respondents is ±4% with at least 95% confidence. The margins of error for the subsets are 6% for Democrat voters, 6% for Trump voters, 5% for males, 5% for females, 12% for 18 to 34 year olds, 5% for 35 to 64 year olds, and 6% for 65+ year olds.
The survey results presented in this article are slightly weighted to match the ages and genders of likely voters. The political parties and geographic locations of the survey respondents almost precisely match the population of likely voters. Thus, there is no need for weighting based upon these variables.
NOTE: For facts about what constitutes a scientific survey and the factors that impact their accuracy, visit Just Facts’ research on Deconstructing Polls & Surveys.
[247] Dataset: “Just Facts 2019 U.S. Nationwide Survey.” Just Facts, December 2019. <www.justfacts.com>
Page 5:
Q24. In 2010, Congress passed and President Obama signed the Affordable Care Act, also known as “Obamacare.” This law uses price controls to save money in the Medicare program. Do you think these price controls will worsen Medicare patients’ access to care?
Yes [=] 49.6%
No [=] 45.0%
Unsure [=] 4.9%
[248] For facts about how surveys work and why some are accurate while others are not, click here.
[249] Webpage: “H.R.1 – Medicare Prescription Drug, Improvement, and Modernization Act of 2003: Actions Overview.” U.S. Congress. Accessed October 28, 2021 at <www.congress.gov>
“12/8/2003 Signed by President … 12/8/2003 Became Public Law No: 108-173.”
[250] Report: “Spending Patterns for Prescription Drugs Under Medicare Part D.” By Tamara Hayford. Congressional Budget Office, December 1, 2011. <www.cbo.gov>
Page 1:
The centerpiece of the Medicare Prescription Drug, Improvement, and Modernization Act of 2003 (Medicare Modernization Act) was the creation of Medicare Part D, a subsidized pharmaceutical benefit that went into effect in 2006.1 That additional coverage—which provides outpatient prescription drug insurance to seniors and to people under age 65 with certain disabilities—constituted the most substantial expansion of the Medicare program since its inception in 1965. In 2010, the federal government spent $62.0 billion on Part D, representing 12 percent of total federal spending for Medicare that year.2
[251] Calculated with data from:
a) Vote 669: “Medicare Prescription Drug, Improvement, and Modernization Act.” U.S. House of Representatives, November 22, 2003. <clerk.house.gov>
b) Vote 459: “Medicare Prescription Drug, Improvement, and Modernization Act.” U.S. Senate, November 25, 2003. <www.senate.gov>
|
Party |
Voted “Yes” |
Voted “No” |
Voted “Present” or Did Not Vote † |
|||
|
Number |
Portion |
Number |
Portion |
Number |
Portion |
|
|
Republican |
246 |
88% |
34 |
12% |
0 |
0% |
|
Democrat |
27 |
11% |
224 |
89% |
2 |
1% |
|
Independent |
1 |
50% |
1 |
50% |
0 |
0% |
|
NOTE: † Voting “Present” is effectively the same as not voting. |
||||||
[252] Cost estimate: “H.R. 1, Medicare Prescription Drug, Improvement, and Modernization Act of 2003.” Congressional Budget Office, November 20, 2003. <www.cbo.gov>
Page 1 (of PDF): “CBO [Congressional Budget Office] estimates that enacting this legislation would result in direct spending outlays totaling $395 billion over the 2004–2013 period. It would also lead to an increase in federal revenues totaling $0.5 billion over that 10-year period.”
[253] Press release: “Michael Steele: Republicans’ Glass House is Shattering.” Democratic Congressional Campaign Committee, March 10, 2010. <www.usnews.com>
“The Republican culture of corruption under Tom DeLay and Republican leadership had devastating consequences that the American people are still paying the price for: a complex and costly prescription drug bill written by drug companies, an energy policy written by the Big Oil companies, and record deficits to pay for tax breaks for their most wealthy friends.”
[254] Calculated with data from Vote 330: “Rangel of New York Substitute Amendment to H.R. 1, Medicare Prescription Drug, Improvement, and Modernization Act of 2003.” U.S. House of Representatives, June 27, 2003. <clerk.house.gov>
|
Party |
Voted “Yes” |
Voted “No” |
Voted “Present” or Did Not Vote † |
|||
|
Number |
Portion |
Number |
Portion |
Number |
Portion |
|
|
Republican |
0 |
0% |
226 |
99% |
3 |
1% |
|
Democrat |
174 |
85% |
29 |
14% |
2 |
1% |
|
Independent |
1 |
100% |
0 |
0% |
0 |
0% |
|
NOTE: † Voting “Present” is effectively the same as not voting. |
||||||
[255] Calculated with data from the cost estimate: “Democratic Amendment to H.R. 1, Medicare Prescription Drug, Improvement, and Modernization Act of 2003.” Congressional Budget Office, June 26, 2003. <www.cbo.gov>
Page 1 (of PDF):
The net effect of the bill, we estimate, would be an increase in the deficit of $0.4 billion in 2003, $5.1 billion in 2003, $255.0 billion over the 2004–2008 period, and $968.7 billion over the 2004–2013 period. These estimates are preliminary and subject to revision after we have had an opportunity to carefully review the legislative language. CBO [Congressional Budget Office] has not yet completed its estimate of the discretionary costs of the bill.
CALCULATION: $969 billion / $395 billion = 2.45
[256] Report: “Medicare Primer.” By Patricia A. Davis and others. Congressional Research Service. Updated May 21, 2020. <sgp.fas.org>
Page 3: “Medicare was enacted in 1965 (P.L. 89-97) in response to the concern that only about half of the nation’s seniors had health insurance, and most of those had coverage only for inpatient hospital costs. The new program, which became effective July 1, 1966, included Part A coverage for hospital and posthospital services and Part B coverage for doctors and other medical services.”
[257] Calculated with the Dataset: “Table V.A3.–Social Security Area Population on July 1 and Dependency Ratios, Calendar Years 1941–2100.” United States Social Security Administration, Office of the Chief Actuary, June 2, 2022. <www.ssa.gov>
NOTE: An Excel file containing the data and calculations is available upon request.
[258] Paper: “The New Workforce: Age and Ethnic Changes.” By Judi L. McClellan and Richard Holden. U.S. Department of Labor, Employment and Training Administration, Biennial National Research Conference, 2003. <wdr.doleta.gov>
Page 1 (of PDF): “California’s primary working age population (20–64 years of age) will shrink as a share of the state population after 2010.”
[259] Report: “The 2022 Long-Term Budget Outlook.” Congressional Budget Office, July 2022. <www.cbo.gov>
Page 46: “The slower improvement in labor quality is expected to be partly offset by improvements in health and increases in life expectancy that will lead people (particularly highly educated people) to continue working past the ages at which previous generations retired, thus boosting the total stock of experience in the workforce.”
Page 42:
The projected decline in the overall labor force participation rate in the coming decades stems mainly from the aging of the population: People age 65 or older tend to participate in the labor force at lower rates than younger people do. In 2019, for example, the average participation rate was 82.5 percent among the civilian noninstitutionalized population ages 25 to 54, and it was 20.1 percent among those age 65 or older.6 As members of the baby-boom generation started to turn 65 in the early 2010s, the share of people age 65 or older in the civilian noninstitutionalized population increased rapidly, growing from 16.3 percent in 2010 to 20.4 percent in 2019. (The baby-boom generation encompasses people born between 1946 and 1964.) In CBO’s projections, the percentage of people age 65 or older continues to rise (reaching 25.2 percent by 2032) and averages 27.1 percent during the third decade of the projection period.
[260] Calculated with the dataset: “Table V.A3.–Social Security Area Population on July 1 and Dependency Ratios, Calendar Years 1941–2100.” United States Social Security Administration, Office of the Chief Actuary, June 2, 2022. <www.ssa.gov>
NOTE: An Excel file containing the data and calculations is available upon request.
[261] Report: “Medicare Primer.” By Patricia A. Davis and others. Congressional Research Service. Updated May 21, 2020. <sgp.fas.org>
Page 1: “Medicare is a federal program that pays for covered health care services of qualified beneficiaries. It was established in 1965 under Title XVIII of the Social Security Act to provide health insurance to individuals 65 and older, and has been expanded over the years to include permanently disabled individuals under 65.”
[262] Report: “Raising the Age of Eligibility for Medicare to 67: An Updated Estimate of the Budgetary Effects.” Congressional Budget Office, October 24, 2013. <www.cbo.gov>
Page 1:
Medicare, one of the federal government’s largest programs, provides health care benefits primarily to elderly people. The usual age of eligibility for those benefits is 65, although certain people qualify for the program earlier. (Medicare is available to people under age 65 who have been eligible for Social Security disability benefits for at least 24 months or who have end-stage renal disease.) Outlays for Medicare are projected to increase rapidly in coming decades because of the retirement of the baby-boom generation and because growth in per capita spending for health care is expected to continue to exceed growth in per capita gross domestic product over the long term. Moreover, increases in life expectancy mean that the average length of time that people are covered by Medicare has risen significantly since the program began in 1965. That trend, which increases the program’s costs, will almost certainly continue.
[263] Dataset: “Table V.A4.–Period Life Expectancy.” U.S. Social Security Administration, June 2, 2022. <www.ssa.gov>
“1965 … At age 65 … Male [=] 12.9 … a The period life expectancy at a given age for a given year is the average remaining number of years expected prior to death for a person at that exact age, born on January 1, using the mortality rates for that year over the course of his or her remaining life.”
[264] Calculated with the dataset: “Table V.A4.–Period Life Expectancy.” U.S. Social Security Administration, June 2, 2022. <www.ssa.gov>
1965 … At age 65 … Male [=] 12.9 …
2019b … At age 65 … Male [=] 18.1 …
a The period life expectancy at a given age for a given year is the average remaining number of years expected prior to death for a person at that exact age, born on January 1, using the mortality rates for that year over the course of his or her remaining life. …
b Estimated using final data for ages below 65 and preliminary data for ages 65 and older.
CALCULATION: (18.1 – 12.9) / 12.9 = 40%
[265] “WHO Director-General’s Opening Remarks at the Media Briefing on Covid-19.” World Health Organization, March 11, 2020. <bit.ly>
[Dr. Tedros Adhanom Ghebreyesus:] …
WHO [World Health Organization] has been assessing this outbreak around the clock and we are deeply concerned both by the alarming levels of spread and severity, and by the alarming levels of inaction.
We have therefore made the assessment that COVID-19 can be characterized as a pandemic.
[266] Press release: “COVID-19 and Other Global Health Issues.” World Health Organization, May 5, 2023. <www.justfacts.com>
[Dr. Tedros Adhanom Ghebreyesus:] …
Yesterday, the Emergency Committee met for the 15th time and recommended to me that I declare an end to the public health emergency of international concern. I have accepted that advice. It’s therefore with great hope that I declare COVID-19 over as a global health emergency.
[267] Calculated with the dataset: “Table V.A4.–Period Life Expectancy.” U.S. Social Security Administration, June 2, 2022. <www.ssa.gov>
1965 … At age 65 … Male [=] 12.9 …
2021c … At age 65 … Male [=] 16.9 …
a The period life expectancy at a given age for a given year is the average remaining number of years expected prior to death for a person at that exact age, born on January 1, using the mortality rates for that year over the course of his or her remaining life. …
c Estimated using the intermediate assumptions for all ages.
CALCULATION: (16.9 – 12.9) / 12.9 = 31%
[268] Calculated with the dataset: “Table V.A4.–Period Life Expectancy.” U.S. Social Security Administration, June 2, 2022. <www.ssa.gov>
1965 … At age 65 … Male [=] 12.9 … Female [=] 16.3 …
2030 … Intermediate [projection] … At age 65 … Male [=] 18.8 … Female [=] 21.3 …
a The period life expectancy at a given age for a given year is the average remaining number of years expected prior to death for a person at that exact age, born on January 1, using the mortality rates for that year over the course of his or her remaining life. …
c Estimated using the intermediate assumptions for all ages.
CALCULATIONS:
[269] Dataset: “Table V.A4.–Period Life Expectancy.” U.S. Social Security Administration, June 2, 2022. <www.ssa.gov>
“1965 … At age 65 … Female [=] 16.3 … a The period life expectancy at a given age for a given year is the average remaining number of years expected prior to death for a person at that exact age, born on January 1, using the mortality rates for that year over the course of his or her remaining life.”
[270] Dataset: “Table V.A4.–Period Life Expectancy.” U.S. Social Security Administration, June 2, 2022. <www.ssa.gov>
1965 … At age 65 … Female [=] 16.3 …
2019b … At age 65 … Female [=] 20.7 …
a The period life expectancy at a given age for a given year is the average remaining number of years expected prior to death for a person at that exact age, born on January 1, using the mortality rates for that year over the course of his or her remaining life. …
b Estimated using final data for ages below 65 and preliminary data for ages 65 and older.
CALCULATION: (20.7 – 16.3) / 16.3 = 27%
[271] “WHO Director-General’s Opening Remarks at the Media Briefing on Covid-19.” World Health Organization, March 11, 2020. <bit.ly>
[Dr. Tedros Adhanom Ghebreyesus:] …
WHO [World Health Organization] has been assessing this outbreak around the clock and we are deeply concerned both by the alarming levels of spread and severity, and by the alarming levels of inaction.
We have therefore made the assessment that COVID-19 can be characterized as a pandemic.
[272] Press release: “COVID-19 and Other Global Health Issues.” World Health Organization, May 5, 2023. <www.justfacts.com>
[Dr. Tedros Adhanom Ghebreyesus:] …
Yesterday, the Emergency Committee met for the 15th time and recommended to me that I declare an end to the public health emergency of international concern. I have accepted that advice. It’s therefore with great hope that I declare COVID-19 over as a global health emergency.
[273] Dataset: “Table V.A4.–Period Life Expectancy.” U.S. Social Security Administration, June 2, 2022. <www.ssa.gov>
1965 … At age 65 … Female [=] 16.3 …
2021c … At age 65 … Female [=] 19.5 …
a The period life expectancy at a given age for a given year is the average remaining number of years expected prior to death for a person at that exact age, born on January 1, using the mortality rates for that year over the course of his or her remaining life. …
c Estimated using the intermediate assumptions for all ages.
CALCULATION: (19.5 – 16.3) / 16.3 = 20%
[274] Dataset: “Table V.A4.–Period Life Expectancy.” U.S. Social Security Administration, June 2, 2022. <www.ssa.gov>
1965 … At age 65 … Male [=] 12.9 … Female [=] 16.3 …
2030 … Intermediate [projection] … At age 65 … Male [=] 18.8 … Female [=] 21.3 …
a The period life expectancy at a given age for a given year is the average remaining number of years expected prior to death for a person at that exact age, born on January 1, using the mortality rates for that year over the course of his or her remaining life. …
c Estimated using the intermediate assumptions for all ages.
CALCULATIONS:
[275] Paper: “Statistical Security for Social Security.” By Samir Soneji and Gary King. Demography, May 17, 2012. Pages 1037–1060. <gking.harvard.edu>
Page 1 (of PDF):
We begin by detailing information necessary for replicating the Social Security Administration’s (SSA’s) forecasting procedures, which until now has been unavailable in the public domain. … The most recent SSA mortality forecasts were based on the best available technology at the time, which was a combination of linear extrapolation and qualitative judgments. Unfortunately, linear extrapolation excludes known risk factors and is inconsistent with long-standing demographic patterns, such as the smoothness of age profiles. Modern statistical methods typically outperform even the best qualitative judgments in these contexts. We show how to use such methods, enabling researchers to forecast using far more information, such as the known risk factors of smoking and obesity and known demographic patterns. Including this extra information makes a substantial difference. For example, by only improving mortality forecasting methods, we predict three fewer years of net surplus, $730 billion less in Social Security trust funds, and program costs that are 0.66% greater for projected taxable payroll by 2031 compared with SSA projections.
Page 20 (of PDF):
We predict higher life expectancy and an older age distribution of death, when considering the steady decline in smoking and rapid rise in obesity, than do the SSA projections, which use no covariates except implicitly. The result indicates that Social Security, especially the OASI [Old-Age and Survivors Insurance] program, may be in a considerably more precarious position than officially thought.
[276] “2022 Annual Report of the Board of Trustees of the Federal Hospital Insurance and Federal Supplementary Medical Insurance Trust Funds.” United States Department of Health and Human Services, Centers for Medicare and Medicaid Services, June 2, 2022. <www.cms.gov>
Page 14: “To illustrate the uncertainty and sensitivity inherent in estimates of future Medicare trust fund operations, the Board has prepared current-law projections under a low-cost and a high-cost set of economic and demographic assumptions as well as under an intermediate set.”
[277] “2022 Annual Report of the Board of Trustees of the Federal Hospital Insurance and Federal Supplementary Medical Insurance Trust Funds.” United States Department of Health and Human Services, Centers for Medicare and Medicaid Services, June 2, 2022. <www.cms.gov>
Pages 209–210:
From the 75-year budget perspective, the present value of the additional resources that would be necessary to meet projected expenditures, for the three programs combined [Medicare Hospital Insurance (HI or Part A), Medicare Supplementary Medical Insurance (SMI or Parts B and D), and Social Security], is $75.9 trillion.103 To put this very large figure in perspective, it would represent 4.4 percent of the present value of projected GDP over the same period ($1,724 trillion). The components of the $75.9-trillion total are as follows:
|
Unfunded Medicare [Part A] and OASDI [Social Security] obligations (trust fund perspective)104 |
$25.3 trillion |
(1.5% of GDP) |
|
HI, SMI, and OASDI asset [trust fund] redemptions |
$3.2 trillion |
(0.2% of GDP) |
|
SMI [Parts B and D] general revenue financing |
$47.4 trillion |
(2.7% of GDP) |
These resource needs would be in addition to the payroll taxes, benefit taxes, and premium payments. As noted, the asset redemptions and SMI general revenue transfers represent formal budget commitments, but no provision exists for covering the HI and OASDI trust fund deficits once assets are depleted.
103 As noted previously, the long-range HI and OASDI financial imbalances could instead be partially addressed by expenditure reductions, thereby reducing the need for additional revenues. Similarly, SMI expenditure reductions would reduce the need for general fund transfers.
104 Additional revenues and/or expenditure reductions totaling $25.3 trillion, together with $3.2 trillion in asset redemptions, would cover the projected financial imbalance but would leave the HI and OASDI trust funds depleted at the end of the 75-year period. The long-range actuarial deficits for HI and OASDI include a cost factor to allow for a normal level of fund assets. See section III.B3 in this report, and section IV.B4 in the OASDI Trustees Report, for the numerical relationship between the actuarial deficit and the unfunded obligations of each program.
Page 71: “As noted previously, over the full 75-year period, the [HI trust] fund has a projected present value unfunded obligation of $4.9 trillion. This unfunded obligation indicates that if $4.9 trillion were added to the trust fund at the beginning of 2022, the program would meet the projected cost of expenditures over the next 75 years.”
Page 1:
Medicare also has a Part C, which serves as an alternative to traditional Part A and Part B coverage. Under this option, beneficiaries can choose to enroll in and receive care from private Medicare Advantage and certain other health insurance plans. Medicare Advantage and Program of All-Inclusive Care for the Elderly (PACE) plans receive prospective, capitated payments for such beneficiaries from the HI and SMI Part B trust fund accounts; the other plans are paid from the accounts on the basis of their costs.
Page 8: “Total expenditures in 2021 were $839.3 billion….”
CALCULATION: $4.9 trillion in unfunded obligations for the HI Trust Fund (Part A) + $47.4 trillion in general revenue financing needed to fund SMI (Parts B and D) = $52.3 trillion
[278] See footnote above.
[279] Calculated with data from the footnotes above.
CALCULATION: $52,300 billion in unfunded obligations and general revenue financing / $839.3 billion in Medicare spending during 2021 = 62
[280] “2011 Annual Report of the Board of Trustees of the Federal Hospital Insurance and Federal Supplementary Medical Insurance Trust Funds.” United States Department of Health and Human Services, Centers for Medicare and Medicaid Services, May 13, 2011. <www.cms.gov>
Pages 85–86:
Some experts, however, have expressed concern that overemphasis on summary measures (such as the actuarial balance and open-group unfunded obligations) can obscure the underlying year-by-year patterns of the long-range financial deficits. If legislative solutions were designed only to eliminate the overall actuarial deficit, without consideration of such year-by-year patterns, then under some scenarios a substantial financial imbalance could still remain at the end of the period, and the long-range sustainability of the program could still be in doubt. …
Concern has also been expressed that limiting the projections to 75 years understates the magnitude of the long-range unfunded obligations for HI because summary measures reflect the full amount of taxes paid by the next two or three generations of workers, but not the full amount of their benefits.
[281] “2017 Annual Report of the Board of Trustees of the Federal Hospital Insurance and Federal Supplementary Medical Insurance Trust Funds.” United States Department of Health and Human Services, Centers for Medicare and Medicaid Services, July 13, 2017. <www.cms.gov>
Page 213: “Experts have noted that limiting the projections to 75 years understates the magnitude of the long-range unfunded obligations because summary measures (such as the actuarial balance and open-group unfunded obligations) reflect the full amount of taxes paid by the next two or three generations of workers, but not the full amount of their benefits.”
[282] “2021 Financial Report of the United States Government.” U.S. Department of the Treasury, February 17, 2022. <fiscal.treasury.gov>
Page 150: “Current participants in the Social Security and Medicare programs are the ‘closed group’ of taxpayers and/or beneficiaries who are at least age 15 years at the start of the projection period.”
Page 203:
Experts have noted that limiting the projections to 75 years understates the magnitude of the long-range unfunded obligations because summary measures (such as the actuarial balance and open-group unfunded obligations) reflect the full amount of taxes paid by the next two or three generations of workers, but not the full amount of their benefits. … The shorter horizon understates the total financial needs by capturing relatively more of the revenues from current and future workers and not capturing all the benefits that are scheduled to be paid to them.
[283] The following points provide important context for understanding the data and calculation in the next footnote:
[284] Calculated with data from the “2022 Annual Report of the Board of Trustees of the Federal Hospital Insurance and Federal Supplementary Medical Insurance Trust Funds.” United States Department of Health and Human Services, Centers for Medicare and Medicaid Services, June 2, 2022. <www.cms.gov>
Page 12: “Table II.B1.—Medicare Data for Calendar Year 2021 … Assets at end of 2020 (billions) … Total [=] $277.4”
Page 212:
The first line of table V.G2 [which displays unfunded Part A obligations] shows the present value of future expenditures less future taxes for current participants, including both beneficiaries and covered workers [i.e., taxpayers]. Subtracting the current value of the HI [Hospital Insurance or Part A] trust fund (the accumulated value of past HI taxes less outlays) results in a closed-group unfunded obligation of $14.5 trillion.
Page 215: “Table V.G4.—Unfunded Part B Obligations for Current and Future Program Participants through the Infinite Horizon [Present values as of January 1, 2022; dollar amounts in trillions] … Equals unfunded obligations for past and current participants1 … General revenue contributions [=] $32.2”
Page 217: “Table V.G6.—Unfunded Part D Obligations for Current and Future Program Participants through the Infinite Horizon [Present values as of January 1, 2022; dollar amounts in trillions] … Equals unfunded obligations for past and current participants1 … General revenue contributions [=] $5.9”
CALCULATION: $14.5 trillion in closed-group unfunded obligations for Medicare Part A + $32.2 trillion in closed-group unfunded obligations for Part B + $5.9 trillion in closed-group unfunded obligations for Part D = $52.6 trillion in closed-group unfunded obligations for the Medicare program
[285] Calculated with the dataset: “Population Level.” Federal Reserve Bank of St. Louis, Economic Research Division. Updated November 4, 2022. <fred.stlouisfed.org>
“2021: 261,445 … Units: Thousands of Persons, Not Seasonally Adjusted … Civilian noninstitutional population is defined as persons 16 years of age and older residing in the 50 states and the District of Columbia, who are not inmates of institutions (for example, penal and mental facilities, homes for the aged), and who are not on active duty in the Armed Forces.”
CALCULATION: $52,600,000,000,000 closed group deficit / 261,445,000 Americans aged 16 or older = $201,572 per person
[286] Report: “Enron: Selected Securities, Accounting, and Pension Laws Possibly Implicated in its Collapse.” By Michael V. Seitzinger, Marie B. Morris, and Mark Jickling. Congressional Research Service, January 16, 2002. <www.justfacts.com>
Page 2 (of PDF):
Among the disclosures of publicly traded companies are accounting statements. Since financial information is of little use to investors unless all firms use comparable accounting methods, the securities laws give the Securities and Exchange Commission broad authority to establish standards for financial reporting. The SEC [Securities and Exchange Commission] has delegated the task of writing accounting standards to private sector bodies, and since 1973 the Financial Accounting Standards Board has been charged with formulating accounting and financial reporting standards.
[287] Report: “Summary of Statement No. 106: Employers’ Accounting for Postretirement Benefits Other Than Pensions.” Financial Accounting Standards Board (FASB), December 1990. <www.fasb.org>
This Statement establishes accounting standards for employers’ accounting for postretirement benefits other than pensions…. It will significantly change the prevalent current practice of accounting for postretirement benefits on a pay-as-you-go (cash) basis by requiring accrual, during the years that the employee renders the necessary service, of the expected cost of providing those benefits to an employee and the employee’s beneficiaries and covered dependents. …
… The Board believes that measurement of the obligation and accrual of the cost based on best estimates are superior to implying, by a failure to accrue, that no obligation exists prior to the payment of benefits. The Board believes that failure to recognize an obligation prior to its payment impairs the usefulness and integrity of the employer’s financial statements. …
The provisions of this Statement are similar, in many respects, to those in FASB Statements No. 87, Employers’ Accounting for Pensions, and No. 88, Employers’ Accounting for Settlements and Curtailments of Defined Benefit Pension Plans and for Termination Benefits. …
This Statement relies on a basic premise of generally accepted accounting principles that accrual accounting provides more relevant and useful information than does cash basis accounting. …
[L]ike accounting for other deferred compensation agreements, accounting for postretirement benefits should reflect the explicit or implicit contract between the employer and its employees.
[288] Book: Finance for Managers. By Richard Luecke and Samuel L. Hayes. Harvard Business School Press, 2002.
Page 39:
In contrast to cash-basis accounting, accrual accounting records transactions as they are made, whether or not the cash has actually changed hands. Most companies of any size use accrual accounting. This system provides a better matching between revenues and their associated cost, which helps companies understand the true causes and effect of business activities. Accordingly, revenues are recognized during the period in which the sales activities occur, whereas expenses are recognized in the same period as their associated revenues.
[289] Report: “Understanding Similarities and Differences Between Accrual and Cash Deficits.” U.S. Government Accountability Office. January 2007, <www.gao.gov>
Page 7:
Net Operating Cost—The Accrual Deficit
Similar to a corporation’s annual report, the Financial Report [i.e., the Treasury Department’s annual “Financial Report of the United States Government”] is the federal government’s annual general-purpose report of its finances.
Page 8:
Accrual measures are useful for understanding the government’s annual operating cost, including costs incurred today but not payable for years to come. As such, it adds a longer-term focus to the government’s financial picture by providing more information on longer-term consequences of today’s policy decisions and operations. Under federal accounting standards, the long-term costs for social insurance (primarily Medicare and Social Security) are not included in the accrual deficit. However, the Statement of Social Insurance provides information about the future costs of these programs.13
[290] “2022 Annual Report of the Board of Trustees of the Federal Hospital Insurance and Federal Supplementary Medical Insurance Trust Funds.” United States Department of Health and Human Services, Centers for Medicare and Medicaid Services, June 2, 2022. <www.cms.gov>
Pages 1–2:
With one exception, the projections are based on the current-law provisions of the Social Security Act. The one exception is that the Part A projections disregard payment reductions that would result from the projected depletion of the Medicare HI [Hospital Insurance] trust fund. Under current law, payments would be reduced to levels that could be covered by incoming tax and premium revenues when the HI trust fund was depleted. If the projections reflected such payment reductions, then any imbalances between payments and revenues would be automatically eliminated, and the report would not fulfill one of its critical functions, which is to inform policymakers and the public about the size of any trust fund deficits that would need to be resolved to avert program insolvency. To date, lawmakers have never allowed the assets of the Medicare HI trust fund to become depleted.
[291] “2022 Annual Report of the Board of Trustees of the Federal Hospital Insurance and Federal Supplementary Medical Insurance Trust Funds.” United States Department of Health and Human Services, Centers for Medicare and Medicaid Services, June 2, 2022. <www.cms.gov>
Page 188: “The Social Security Act requires the Trustees to evaluate the financial status of the Medicare trust funds. To comply with this mandate, the Trustees must assess whether the financing provided under current law is adequate to cover the benefit payments and other expenditures required under current law.”
Pages 189–190:
Over time, unless providers could alter their use of inputs to reduce their cost per service correspondingly, Medicare’s payments for health services would fall increasingly below providers’ costs. Providers could not sustain continuing negative margins and would have to withdraw from serving Medicare beneficiaries or (if total facility margins remained positive) shift substantial portions of Medicare costs to their non-Medicare, non-Medicaid payers. Under such circumstances, lawmakers might feel substantial pressure to override the productivity adjustments, much as they did to prevent reductions in physician payment rates while the sustainable growth rate (SGR) system was in effect. …
In view of these issues, it is important to note that the actual future costs for Medicare may exceed the projections shown in this report, possibly by substantial amounts.
[292] “2022 Annual Report of the Board of Trustees of the Federal Hospital Insurance and Federal Supplementary Medical Insurance Trust Funds.” United States Department of Health and Human Services, Centers for Medicare and Medicaid Services, June 2, 2022. <www.cms.gov>
Page 188:
The Social Security Act requires the Trustees to evaluate the financial status of the Medicare trust funds. To comply with this mandate, the Trustees must assess whether the financing provided under current law is adequate to cover the benefit payments and other expenditures required under current law. Accordingly, the estimates shown in this report are based on all of the current statutory requirements, including (i) the reductions in payment updates by the increase in economy-wide productivity for most non-physician provider categories; (ii) the physician payment updates specified by the Medicare Access and CHIP [Children’s Health Insurance Program] Reauthorization Act of 2015 (MACRA) for all future years; and (iii) the expiration in 2025 of the 5-percent bonuses for qualified physicians in advanced alternative payment models (advanced APMs) and of the $500-million payments for physicians in the merit-based incentive payment system (MIPS).
Pages 189–190:
Over time, unless providers could alter their use of inputs to reduce their cost per service correspondingly, Medicare’s payments for health services would fall increasingly below providers’ costs. Providers could not sustain continuing negative margins and would have to withdraw from serving Medicare beneficiaries or (if total facility margins remained positive) shift substantial portions of Medicare costs to their non-Medicare, non-Medicaid payers. Under such circumstances, lawmakers might feel substantial pressure to override the productivity adjustments, much as they did to prevent reductions in physician payment rates while the sustainable growth rate (SGR) system was in effect.
While the physician payment system put in place by MACRA avoided the significant short-range physician payment issues resulting from the SGR system approach, it nevertheless raises important long-range concerns that will almost certainly need to be addressed by future legislation. In particular, additional updates totaling $500 million per year and 5-percent annual bonuses are scheduled to expire in 2025, resulting in a payment reduction for most physicians. In addition, the law specifies the physician payment updates for all years in the future, and these updates do not vary based on underlying economic conditions, nor are they expected to keep pace with the average rate of physician cost increases. The specified rate updates could be an issue in years when levels of inflation are high and would be problematic when the cumulative gap between the price updates and physician costs becomes large. The Trustees previously estimated that physician payment rates under current law will be lower than they would have been under the SGR formula by 2048 and will be about 30 percent lower by the end of the projection period. Absent a change in the delivery system or level of update by subsequent legislation, the Trustees expect access to Medicare-participating physicians to become a significant issue in the long term.
In view of these issues, it is important to note that the actual future costs for Medicare may exceed the projections shown in this report, possibly by substantial amounts.
Page 256:
Statement of Actuarial Opinion …
The annual reports of the Board of Trustees and the accompanying Actuarial Opinions have cautioned for a number of years about the challenges of adhering to current-law Medicare payment updates especially in the long range. For physician services, not only are updates below the rate of inflation in all future years, but there are more immediate concerns because updates for these services are projected to be −2.9 percent in 2023 and 0.0 percent for 2024 and 2025 and certain bonuses paid to physicians are scheduled to expire in 2025. Should payment rates prove to be inadequate for any service, beneficiaries’ access to and the quality of Medicare benefits would deteriorate over time, or future legislation would need to be enacted that would likely increase program costs beyond those projected under current law in this report.
[293] “2014 Annual Report of the Board of Trustees of the Federal Hospital Insurance and Federal Supplementary Medical Insurance Trust Funds.” Centers for Medicare and Medicaid Services, July 28, 2014. <www.cms.gov>
Pages 276–277:
Statement of Actuarial Opinion …
The Affordable Care Act [ACA] is making important changes to the Medicare program that are designed, in part, to substantially improve its financial outlook. While the ACA has been successful in reducing many Medicare expenditures to date, there is a strong possibility that certain of these changes will not be viable in the long range. Specifically, the annual price updates for most categories of non-physician health services will be adjusted downward each year by the growth in economy-wide productivity. The ability of health care providers to sustain these price reductions will be challenging, as the best available evidence indicates that most providers cannot improve their productivity to this degree for a prolonged period given the labor-intensive nature of these services.†
Absent an unprecedented change in health care delivery systems and payment mechanisms, the prices paid by Medicare for health services will fall increasingly short of the costs of providing these services. By the end of the long-range projection period, Medicare prices for many services would be less than half of their level without consideration of the productivity price reductions. Before such an outcome would occur, lawmakers would likely intervene to prevent the withdrawal of providers from the Medicare market and the severe problems with beneficiary access to care that would result. Overriding the productivity adjustments, as lawmakers have done repeatedly in the case of physician payment rates, would lead to substantially higher costs for Medicare in the long range than those projected in this report.
† NOTE: The Affordable Care Act’s cuts in Medicaid payment rates affect “hospital, skilled nursing facility, home health, hospice, ambulatory surgical center, diagnostic laboratory, and many other services.” [“2013 Annual Report of the Board of Trustees of the Federal Hospital Insurance and Federal Supplementary Medical Insurance Trust Funds.” Centers for Medicare and Medicaid Services, May 31, 2013. <www.cms.gov>. Page 273.]
[294] Report: “Projected Medicare Expenditures Under an Illustrative Scenario with Alternative Payment Updates to Medicare Providers.” By John D. Shatto and M. Kent Clemens. United States Department of Health and Human Services, Centers for Medicare and Medicaid Services, Office of the Actuary, June 2, 2022. <www.cms.gov>
Page 1:
The Trustees Report is based on current law; as a result of questions regarding the operations of certain Medicare provisions, however, the projections shown in the report under current law may well understate expenditures for most categories of health care providers. The purpose of this memorandum is to present a Medicare projection under a hypothetical alternative to these provisions to help illustrate and quantify the magnitude of the potential cost understatement under current law.
[295] Calculated with data from the report: “Projected Medicare Expenditures Under an Illustrative Scenario with Alternative Payment Updates to Medicare Providers.” By John D. Shatto and M. Kent Clemens. United States Department of Health and Human Services, Centers for Medicare and Medicaid Services, Office of the Actuary, June 2, 2022. <www.cms.gov>
Page 12: “Table 4. Projected Total Medicare Expenditures as a Percentage of GDP Under Current Law and the Illustrative Alternative, Selected Years 2021–2096”
NOTE: An Excel file containing the data and calculations is available upon request.
[296] Calculated with data from the “2021 Financial Report of the United States Government.” U.S. Department of the Treasury, February 17, 2022. <fiscal.treasury.gov>
Page 150: “The estimates in the consolidated SOSI [Statement of Social Insurance] of the open group measures are for persons who are participants or eventually will participate in the programs as contributors (workers) or beneficiaries (retired workers, survivors, dependents, and disabled) during the 75-year projection period.”
Page 151:
The financial projections for the Medicare program reflect substantial, but very uncertain, cost savings deriving from specific provisions of the PPACA [Patient Protection and Affordable Care Act] and the MACRA [Medicare Access and Children’s Health Insurance Program Reauthorization Act] that lowered increases in Medicare payment rates to most categories of health care providers. Certain features of current law may result in some challenges for the Medicare program including physician payments, payment rate updates for most non-physician categories, and productivity adjustments. For those providers affected by the productivity adjustments and the specified updates to physician payments, sustaining the price reductions will be challenging, as the best available evidence indicates that most providers cannot improve their productivity to this degree for a prolonged period given the labor-intensive nature of these services and that physician costs will grow at a faster rate than the specified updates. As a result, actual Medicare expenditures are highly uncertain for reasons apart for the inherent difficulty in projecting health care cost growth over time. …
To help illustrate and quantify the potential magnitude of the cost understatement, the Trustees asked the Office of the Actuary at CMS [Centers for Medicare and Medicaid Services] to prepare the following illustrative Medicare Trust Fund projections under a hypothetical alternative. This scenario illustrates the impact that would occur if the payment updates that are affected by the productivity adjustments were to gradually transition from current law to the payment updates assumed for private health plans, the physician updates transition to the Medicare Economic Index, and the 5.0 percent bonuses paid to qualified physicians in advance APM [alternative payment models] did not expire. The extent to which actual future Part A and Part B costs exceed the projected amounts due to changes to the productivity adjustments and physician updates depends on what specific changes might be legislated and whether Congress would pass further provisions to help offset such costs. This alternative was developed for illustrative purposes only and the calculations have not been audited.
Page 150:
Social Security and Medicare projections are based on current law and the Social Security and Medicare trustees’ intermediate set of assumptions, except that the projections assume full Social Security and Medicare Part A benefits are paid after fund depletion contrary to current law. The projections in the 2021 Trustees’ Report are the first to include the Trustees best estimates of the effects of the COVID-19 pandemic and ensuing recession on the Social Security and Medicare Projections. It should be noted that there is an unusually large degree of uncertainty with these covid-related impacts and that future projections could change significantly as more information becomes available.
Page 152: “Medicare Present Values (in trillions) (Unaudited) … Excess of Expenditures over Income … 2021 Consolidated SOSI Current Law [=] $48.2… Illustrative Alternative Scenario1,2 [=] $58.1”
CALCULATION: ($58.1 trillion – $48.2 trillion) / $48.2 trillion = 20.5%
[297] “Annual Message to the Congress on the State of Union.” By Lyndon B. Johnson, January 8, 1964. <www.presidency.ucsb.edu>
“We must provide hospital insurance for our older citizens financed by every worker and his employer under Social Security, contributing no more than $1 a month during the employee’s working career to protect him in his old age in a dignified manner without cost to the Treasury, against the devastating hardship of prolonged or repeated illness.”
[298] Webpage: “CPI Inflation Calculator.” Bureau of Labor Statistics. Accessed May 1, 2023 at <www.bls.gov>
“$1.00 in January 1964 has the same buying power as $9.68 in January 2023”
[299] “2022 Annual Report of the Board of Trustees of the Federal Hospital Insurance and Federal Supplementary Medical Insurance Trust Funds.” United States Department of Health and Human Services, Centers for Medicare and Medicaid Services, June 2, 2022. <www.cms.gov>
Pages 12–13:
For HI [Hospital Insurance, a.k.a. Medicare Part A], the primary source of financing is the payroll tax on covered earnings. Employers and employees each pay 1.45 percent of a worker’s wages, while self-employed workers pay 2.9 percent of their net earnings. Starting in 2013, high-income workers pay an additional 0.9-percent tax on their earnings above an unindexed threshold ($200,000 for single taxpayers and $250,000 for married couples). Other HI revenue sources include a portion of the Federal income taxes that Social Security recipients with incomes above certain unindexed thresholds pay on their benefits, as well as interest earned on the securities held in the HI trust fund.
NOTE: An Excel file containing the data and calculations is available upon request.
[300] See the section above on Medicare spending.
[301] Determined by examining varied paychecks.
[302] Report: “Understanding the Tax Reform Debate: Background, Criteria, & Questions.” United States Government Accountability Office, September 2005. <www.gao.gov>
Page 48:
Transparent tax systems include the following elements: …
• Taxpayers know their own tax burden and the tax burden of others: Irrespective of who actually writes a check to the government, taxpayers can identify who actually bears the burden of a tax. For example, the payroll tax is not transparent to the extent that taxpayers in general are unaware of the incidence of the tax. Even though payroll taxes are divided equally between employees and employers, economists generally agree that employees bear the entire burden of payroll taxes in the form of reduced wages.
Page 68: “Payroll Taxes Often synonymous with social insurance taxes. However, in some cases the term ‘payroll taxes’ may be used more generally to include all tax withholding. For the purposes of this report, payroll taxes are synonymous with social insurance taxes.”
Page 69: “Social Insurance Taxes Tax payments to the federal government for Social Security, Medicare, and unemployment compensation. While employees and employers pay equal amounts in social insurance taxes, economists generally agree that employees bear the entire burden of social insurance taxes in the form of reduced wages.”
[303] Webpage: “Historical Effective Federal Tax Rates: 1979 to 2005.” Congressional Budget Office, December 2007. <www.cbo.gov>
Page 2:
The Congressional Budget Office uses a multistep methodology to produce its estimates of the distribution of income and taxes. The Current Population Survey (CPS) and the Statistics of Income (SOI) are the primary sources of data for CBO’s estimates of population and household income. CBO estimates federal taxes for each household on the basis of income, demographic characteristics, and existing laws in the relevant year. CBO then groups the households into quintiles on the basis of their income and tabulates the income and taxes for each quintile.
Page 3:
Who Pays Taxes?
CBO’s [Congressional Budget Office’s] analysis of effective tax rates … assumes—as do most economists—that employers’ share of payroll taxes is passed on to employees in the form of lower wages than would otherwise be paid. Therefore, the amount of those taxes is included in employees’ income, and the taxes are counted as part of employees’ tax burden.
[304] Textbook: Public Finance (2nd edition). By John E. Anderson. South-Western Cengage Learning, 2012.
Page 397:
When we consider the burden of a tax, we must distinguish between the burden as it is specified in the tax law and the true economic burden. Statutory incidence refers to tax incidence required by legal statutes. Of course, it is not possible to specify true economic incidence in law, but that does not stop lawmakers from trying. Consider a simple example. The U.S. Social Security payroll tax requires that employers and employees split the tax, each paying one-half of the total. Hence, the statutory incidence of the tax is that half the tax falls on the employer and half falls on the employee. … But, the true economic incidence of the payroll tax is quite different. The employer has some ability to adjust the employee’s wage and pass the employer’s half of the tax on to the employee. In fact, the employee may bear the entire tax. Of course, the extent to which the employer can pass the tax on to the employee depends on the labor supply elasticity of the employee; that is, the willingness of the employee to accept a lower wage and supply the same, or nearly the same, quantity of labor. Recent evidence in Gruber (1997), based on the Chilean payroll tax, for example, suggests that workers bear most of the burden of any increase in the tax rate.
[305] Webpage: “Current Law Distribution of Taxes.” Tax Policy Center, October 26, 2013. <www.taxpolicycenter.org>
“A key insight from economics is that taxes are not always borne by the individual or business that writes the check to the IRS. Sometimes taxes are shifted. For example, most economists believe that the employer portion of payroll taxes translate into lower wages and are thus ultimately borne by workers.”
[306] Webpage: “Contribution and Benefit Base.” United States Social Security Administration, Office of the Chief Actuary. Accessed September 22, 2015 at <www.ssa.gov>
Social Security’s Old-Age, Survivors, and Disability Insurance (OASDI) program limits the amount of earnings subject to taxation for a given year. … This limit changes each year with changes in the national average wage index. …
For Medicare’s Hospital Insurance (HI) program, the taxable maximum was the same as that for the OASDI [Social Security] program for 1966–1990. Separate HI taxable maximums of $125,000, $130,200, and $135,000 were applicable in 1991–93, respectively. After 1993, there has been no limitation on HI-taxable earnings.
[307] Webpage: “History of SSA-Related Legislation—103rd Congress.” United States Social Security Administration. Accessed September 22, 2015 at <www.socialsecurity.gov>
“PL 103-66 The Omnibus Budget Reconciliation Act of 1993 (enacted 8/10/93). Section 13207 repeals the limitation on the amount of earnings subject to the HI [Medicare Hospital Insurance] tax beginning in 1994.”
[308] Calculated with data from:
a) Vote 406: “Omnibus Budget Reconciliation Act of 1993.” U.S. House of Representatives, August 5, 1993. <clerk.house.gov>
b) Vote 247: “Omnibus Budget Reconciliation Act of 1993.” U.S. Senate, August 6, 1993. <www.senate.gov>
|
Party |
Voted “Yes” |
Voted “No” |
Voted “Present” or Did Not Vote † |
|||
|
Number |
Portion |
Number |
Portion |
Number |
Portion |
|
|
Republican |
0 |
0% |
219 |
100% |
0 |
0% |
|
Democrat |
268 |
85% |
47 |
15% |
0 |
0% |
|
Independent |
1 |
100% |
0 |
0% |
0 |
0% |
|
NOTE: † Voting “Present” is effectively the same as not voting. |
||||||
[309] “2022 Annual Report of the Board of Trustees of the Federal Hospital Insurance and Federal Supplementary Medical Insurance Trust Funds.” United States Department of Health and Human Services, Centers for Medicare and Medicaid Services, June 2, 2022. <www.cms.gov>
Page 49:
Up to 85 percent of an individual’s or couple’s OASDI [Social Security] benefits may be subject to Federal income taxation if their income exceeds certain thresholds.† The income tax revenue attributable to the first 50 percent of OASDI benefits is allocated to the … [Social Security] trust funds. The revenue associated with the amount between 50 and 85 percent of benefits is allocated to the HI [Hospital Insurance, a.k.a. Medicare Part A] trust fund.
NOTE: † These thresholds are exceeded if the “total of one-half of your benefits and all your other income is more than $34,000 ($44,000 if you are married filing jointly).” [Pamphlet: “Social Security and Equivalent Railroad Retirement Benefits for Use in Preparing 2021 Returns.” United States Department of the Treasury, Internal Revenue Service, January 6, 2022. <www.irs.gov> Page 6.]
[310] Report: “Taxation of Social Security Benefits.” By Larry DeWitt. U.S. Social Security Administration Historian’s Office, February 2001. <www.ssa.gov>
In 1993, as part of Omnibus Budget Reconciliation Act, the Social Security taxation provision was modified to add a secondary set of thresholds and a higher taxable percentage for beneficiaries who exceeded the secondary thresholds. Specifically, the 1993 did the following:
Modified for a taxpayer with combined income exceeding a secondary threshold amount ($34,000 for an individual, $44,000 for a married couple filing a joint return, and zero for a married person filing separately), so that the amount of benefits subject to income tax is increased to the sum of (1) the smaller of (a) $4,500 for an individual, $6,000 for a married couple filing a joint return, or zero for a married person filing separately, or (b) 50% of the benefit, plus (2) 85% of the excess of the taxpayer’s combined income over the secondary threshold. However, no more than 85% of the benefit amount is subject to income tax. The additional income tax revenues resulting from the increase in the taxable percentage from 50% to 85% are transferred to the HI [Hospital Insurance, a.k.a. Medicare Part A] Trust Fund. Effective for taxable years beginning after 1993.
[311] “2022 Annual Report of the Board of Trustees of the Federal Hospital Insurance and Federal Supplementary Medical Insurance Trust Funds.” United States Department of Health and Human Services, Centers for Medicare and Medicaid Services, June 2, 2022. <www.cms.gov>
Page 29: “… HI [Hospital Insurance, a.k.a. Medicare Part A] income from taxation of Social Security benefits will also increase faster than taxable payroll because the income thresholds determining taxable benefits are not indexed for inflation and because the income tax brackets are indexed to the chained CPI (C-CPI-U) [Consumer Price Index], which increases at a slower rate than average wages.”
[312] Report: “Overview of the Federal Tax System as in Effect for 2012.” U.S. Congress, Joint Committee on Taxation, February 24, 2012. <www.jct.gov>
Page 15:
Additional Hospital Insurance Tax on Certain High-Income Individuals
For remuneration received in taxable years beginning after December 31, 2012, the employee portion of the HI [Hospital Insurance, a.k.a. Medicare Part A] tax is increased by an additional tax of 0.9 percent on wages received in excess of a specific threshold amount.22 However, unlike the general 1.45 percent HI tax on wages, this additional tax is on the combined wages of the employee and the employee’s spouse, in the case of a joint return. The threshold amount is $250,000 in the case of a joint return or surviving spouse, $125,000 in the case of a married individual filing a separate return, and $200,000 in any other case (unmarried individual or head of household).
The same additional HI tax applies to the HI portion of SECA [Self-Employment Contributions Act] tax on self-employment income in excess of the threshold amount. Thus, an additional tax of 0.9 percent is imposed on every self-employed individual on self-employment income in excess of the threshold amount.23
22 Sec, 3101(b), as amended by the Patient Protection and Affordable Care Act (“PPACA”), Pub. L. No. 111-148.
23 Sec. 1402(b).
[313] “2011 Annual Report of the Board of Trustees of the Federal Hospital Insurance and Federal Supplementary Medical Insurance Trust Funds.” United States Department of Health and Human Services, Centers for Medicare and Medicaid Services, May 13, 2011. <www.cms.gov>
Page 9: “Starting in 2013, high-income workers will pay an additional 0.9 percent tax on their earnings above an unindexed threshold ($200,000 for single taxpayers and $250,000 for married couples).”
[314] Calculated with data from:
a) Vote 165: “Patient Protection and Affordable Care Act.” U.S. House of Representatives, March 21, 2010. <clerk.house.gov>
b) Vote 396: “Patient Protection and Affordable Care Act.” U.S. Senate, December 24, 2009. <www.senate.gov>
|
Party |
Voted “Yes” |
Voted “No” |
Voted “Present” or Did Not Vote † |
|||
|
Number |
Portion |
Number |
Portion |
Number |
Portion |
|
|
Republican |
0 |
0% |
217 |
100% |
1 |
0% |
|
Democrat |
277 |
89% |
34 |
11% |
0 |
0% |
|
Independent |
2 |
100% |
0 |
0% |
0 |
0% |
|
NOTE: † Voting “Present” is effectively the same as not voting. |
||||||
[315] “2010 Actuarial Report on the Financial Outlook for Medicaid.” By Christopher J. Truffer and others. U.S. Department of Health & Human Services, Centers for Medicare and Medicaid Services, Office of the Actuary, December 21, 2010. <www.cms.gov>
Page 1: “Medicaid is a cooperative program between the Federal and State governments to pay for health care and medical services for certain low-income persons in the United States and its Territories.”
Page 2: “Authorized by Title XIX of the Social Security Act, Medicaid was signed into law in 1965 and is an optional program for the States. Currently all States, the District of Columbia, and all of the Territories have Medicaid programs.”
[316] Report: “Medicaid: A Primer.” By Elicia J. Herz. Congressional Research Service, July 18, 2012. <fas.org>
Page 1: “Medicaid was enacted in 1965 in the same legislation that created the Medicare program (i.e., the Social Security Amendments of 1965; P.L. 89-97). Medicaid grew out of and replaced two earlier programs of federal grants to states that provided medical care to welfare recipients and the elderly.”
[317] Report: “CMS [Centers for Medicare and Medicaid Services] Fast Facts.” U.S. Department of Health & Human Services, Centers for Medicare and Medicaid Services, August 2022. <data.cms.gov>
Page 1 (of PDF): “CMS Program Data – Populations1 … Medicaid (avg monthly)3 … Total … FY2019 [=] 73.9 … FY 2020 [=] 75.3 … FY 2021 [=] 83.5 … 1 Populations are in millions and may not add due to rounding … 3 Projected estimates”
[318] “2018 Actuarial Report on the Financial Outlook for Medicaid.” By Christopher J. Truffer and others. U.S. Department of Health & Human Services, Centers for Medicare and Medicaid Services, Office of the Actuary, April 9, 2020. <www.cms.gov>
Pages 6–7:
Enrollment is measured as person-year equivalents, or the average enrollment over the course of a year. In 2017, 73.4 million individuals are estimated to have been enrolled in Medicaid (including enrollment in the U.S. Territories).9
9 Since data for some States are not available for 2013 and 2014, and no data are available for 2015, 2016, and 2017, enrollment figures in this report are estimates for these years, as described further in section IV of the report. In addition, past reports have provided figures for ever-enrolled enrollment, or the number of people who were enrolled at any time during the year. As no data are currently available that show the number of expansion adults who were ever-enrolled, and since there is no historical experience with this population, this report does not provide an estimate of ever-enrolled enrollment for 2017.
[319] Article: “How Many Workers Are Employed in Sectors Directly Affected by Covid-19 Shutdowns, Where Do They Work, and How Much Do They Earn?” By Matthew Dey and Mark A. Loewenstein. U.S. Bureau of Labor Statistics Monthly Labor Review, April 2020. <www.bls.gov>
Page 1:
To reduce the spread of coronavirus disease 2019 (Covid-19), nearly all states have issued stay-at-home orders and shut down establishments deemed nonessential. Answering the following questions is crucial to assessing the potential labor market impacts of the shutdown policy: How many jobs are in the industries that are shut down? Where are these jobs located? What wages do they pay?
We provide answers to these questions by using data from the U.S. Bureau of Labor Statistics (BLS) Quarterly Census of Employment and Wages (QCEW) and Occupational Employment Statistics (OES) programs.1
[320] Working paper: “Tracking Labor Market Developments During the Covid-19 Pandemic: A Preliminary Assessment.” By Tomas Cajner and others. Board of Governors of the Federal Reserve System, Division of Research & Statistics and Monetary Affairs, April 15, 2020 <www.federalreserve.gov>
Page 2 (of PDF):
Many traditional official statistics are not suitable for measuring high-frequency developments that evolve over the course of weeks, not months. In this paper, we track the labor market effects of the Covid-19 pandemic with weekly payroll employment series based on microdata from ADP [a payroll processing firm]. These data are available essentially in real-time, and allow us to track both aggregate and industry effects. Cumulative losses in paid employment through April 4 are currently estimated at 18 million; just during the two weeks between March 14 and March 28 the U.S. economy lost about 13 million paid jobs. For comparison, during the entire Great Recession less than 9 million private payroll employment jobs were lost. In the current crisis, the most affected sector is leisure and hospitality, which has so far lost or furloughed about 30 percent of employment, or roughly 4 million jobs.
[321] Report: “CMS [Centers for Medicare and Medicaid Services] Fast Facts.” U.S. Department of Health & Human Services, Centers for Medicare and Medicaid Services, August 2022. <data.cms.gov>
Page 1 (of PDF): “CMS Program Data – Populations1 … Medicaid (avg monthly)3 … Total … FY2019 [=] 73.9 … FY 2020 [=] 75.3 … FY 2021 [=] 83.5 … 1 Populations are in millions and may not add due to rounding … 3 Projected estimates”
[322] Calculated with data from:
a) Dataset: “Table V.A3.–Social Security Area Population on July 1 and Dependency Ratios, Calendar Years 1941–2100.” United States Social Security Administration, Office of the Chief Actuary, June 2, 2022. <www.ssa.gov>
b) “2018 Actuarial Report on the Financial Outlook for Medicaid.” By Christopher J. Truffer and others. U.S. Department of Health & Human Services, Centers for Medicare and Medicaid Services, Office of the Actuary, April 9, 2020. <www.cms.gov>
Pages 6–7: “Enrollment is measured as person-year equivalents, or the average enrollment over the course of a year. … Since data for some States are not available for 2013 and 2014, and no data are available for 2015, 2016, and 2017, enrollment figures in this report are estimates for these years, as described further in section IV of the report. In addition, past reports have provided figures for ever-enrolled enrollment, or the number of people who were enrolled at any time during the year. As no data are currently available that show the number of expansion adults who were ever-enrolled, and since there is no historical experience with this population, this report does not provide an estimate of ever-enrolled enrollment for 2017.”
Page 12: “Table 2—Historical and Projected Medicaid Enrollment and Expenditures and Average Federal Share of Expenditures, Selected Years (Enrollment in millions of person-year equivalents, expenditures in billions of dollars)”
c) “Medicaid and CHIP Data Book.” Medicaid and CHIP [Children’s Health Insurance Program] Payment and Access Commission, December 2021. <www.macpac.gov>
Pages 27–28: “Exhibit 10. Medicaid Enrollment and Total Spending Levels and Annual Growth, FYs 1970–2020 … FYE is full-year equivalent, which also may be referred to as average monthly enrollment.”
d) Report: “CMS Fast Facts.” U.S. Department of Health & Human Services, Centers for Medicare and Medicaid Services, August 2022. <data.cms.gov>
Page 1 (of PDF): “CMS Program Data – Populations”
NOTE: An Excel file containing the data and calculations is available upon request.
[323] Calculated with data from: “Medicaid and CHIP Data Book.” Medicaid and CHIP [Children’s Health Insurance Program] Payment and Access Commission, December 2021. <www.macpac.gov>
Pages 42–43: “Exhibit 15. Medicaid Full-Year Equivalent Enrollment by State and Eligibility Group, FY 2019 (thousands) … All enrollees … Total [=] 70,179 … Child [=] 26,609 … New adult group1 [=] 15,852 … Other adult2 [=] 11,353 … Disabled [=] 9,152 … Aged [=] 7,213”
CALCULATIONS:
[324] Calculated with data from: “Medicaid and CHIP Data Book.” Medicaid and CHIP [Children’s Health Insurance Program] Payment and Access Commission, December 2021. <www.macpac.gov>
Pages 42–43: “Exhibit 15. Medicaid Full-Year Equivalent Enrollment by State and Eligibility Group, FY 2019 (thousands) … All enrollees … New adult group1 [=] 15,852 … Other adult2 [=] 11,353”
Page 51: “Exhibit 18. Distribution of Medicaid Benefit Spending by Eligibility Group and Service Category, FY 2019 … New adult group2 [=] $102.3 billion … Other adult [=] $55.7 billion”
Page 52:
Exhibit 19. Medicaid Benefit Spending Per Full-Year Equivalent (FYE) Enrollee by Eligibility Group and Service Category, FY 2019 … All enrollees [=] $8,141 … Child1 [=] $3,336 … Disabled [=] $21,368 … Aged [=] $17,885 …
2 Includes both newly eligible and not newly eligible adults who are eligible under [the Affordable Care Act]. Newly eligible adults include those who are not eligible for Medicaid under the rules that a state had in place on December 1, 2009. Not newly eligible adults include those who would have previously been eligible for Medicaid under the rules that a state had in place on December 1, 2009; this includes states that had already expanded to adults with incomes greater than 100 percent of the federal poverty level as of March 23, 2010, and receive the expansion state transitional matching rate.
CALCULATION: ($102,300,000,000 + $55,700,000,000) / (15,852,000 + 11,353,000) = $5,808 per adult
[325] Calculated with data from: “Medicaid and CHIP Data Book.” Medicaid and CHIP [Children’s Health Insurance Program] Payment and Access Commission, December 2021. <www.macpac.gov>
Pages 54–56:
Exhibit 21. Medicaid Spending by State, Eligibility Group, and Dually Eligible Status, FY 2019 (millions) … Total [=] $571,303 … Basis of eligibility1 … Child [=] 15.5% … New adult group3 [=] 17.9% … Other adult4 [=] 9.8% … Disabled [=] 34.2% … Aged [=] 22.6% …
1 Children and adults under age 65 who qualify for Medicaid on the basis of disability are included in the disabled category. Individuals age 65 and older eligible through an aged, blind, or disabled pathway are included in the aged category. …
3 Includes both newly eligible and not newly eligible adults who are eligible under [the Affordable Care Act]. Newly eligible adults include those who are not eligible for Medicaid under the rules that a state had in place on December 1, 2009. Not newly eligible adults include those who would have previously been eligible for Medicaid under the rules that a state had in place on December 1, 2009; this includes states that had already expanded to adults with incomes greater than 100 percent of the federal poverty level as of March 23, 2010, and receive the expansion state transitional matching rate.
4 Includes adults under age 65 who qualify through a pathway other than disability or [the Affordable Care Act] (e.g., parents and caretakers, pregnant women).
CALCULATION: 17.9% spending on new adult group + 9.8% spending on other adult = 28%
[326] “2018 Actuarial Report on the Financial Outlook for Medicaid.” By Christopher J. Truffer and others. U.S. Department of Health & Human Services, Centers for Medicare and Medicaid Services, Office of the Actuary, April 9, 2020. <www.cms.gov>
Page 1: “Medicaid is a cooperative program between the Federal and State governments to pay for health care and medical services for certain low-income persons in the United States and its Territories.”
Page 2:
Authorized by Title XIX of the Social Security Act, Medicaid was signed into law in 1965 and is an optional program for the States. Currently all States, the District of Columbia, and five U.S. Territories have Medicaid programs.2
The Federal government establishes certain requirements for the States’ Medicaid programs. The States then administer their own programs, determining the eligibility of applicants, deciding which health services to cover, setting provider reimbursement rates, paying for a portion of the total program, and processing claims.
Eligibility for enrollment in Medicaid is determined by both Federal and State law. Title XIX of the Social Security Act specifies which groups of people must be eligible, and States have the flexibility to extend coverage to additional groups. In addition to income, eligibility is typically based on several other factors, including age, disability status, other government assistance, other health or medical conditions such as pregnancy, and in some cases financial resources (or assets). As of January 2014, States have had the authority to expand Medicaid eligibility to almost all individuals under age 65 who are living in families with income below 138 percent of the Federal poverty level (FPL) (and who are citizens or eligible legal residents), with the Federal government initially paying 100 percent of the costs for expansion adults, to be reduced to 90 percent by 2020.3
Title XIX specifies that certain medical services must be covered under Medicaid, while also granting the States flexibility to cover many other benefits.
[327] Report: “Medicaid: A Primer.” By Elicia J. Herz. Congressional Research Service, July 18, 2012. <fas.org>
Page 2 (of PDF): “[E]ach state designs and administers its own version of the program [Medicaid] under broad federal rules. State variability is the rule rather than the exception in terms of eligibility levels, covered services, and how those services are reimbursed and delivered.”
Pages 1–2:
Even though Medicaid is an entitlement program in federal budget terms, states choose whether to participate, and all 50 states do so. …
The federal Medicaid statute … defines more than 50 distinct population groups as being potentially eligible. Historically, Medicaid eligibility was subject to categorical restrictions that generally limited coverage to the elderly, persons with disabilities … members of families with dependent children, certain other pregnant women and children, certain women with breast or cervical cancer, and uninsured individuals with tuberculosis. Recent changes in law (described below) provide eligibility for nonelderly, childless adults who do not fit into these traditional categories.
In addition, to qualify for Medicaid coverage, applicants’ income (for example, wages, Social Security benefits) and sometimes their resources, or assets (for example, value of a car, savings accounts), must meet program financial requirements. … In recent years, Medicaid has shifted largely to eligibility based on income, and most enrollees do not receive cash assistance. …
Some eligibility groups are mandatory, meaning that all states with a Medicaid program must cover them; others are optional. Examples of groups that states must provide Medicaid to include …
• pregnant women and children through age 6 with family income at or below 133% of the federal poverty level (FPL)7 …
7 For example, in 2012, the FPL for a family of four is $23,050—133% of FPL for such a family would equal $30,656.50.
[328] Webpage: “Medicaid.” National Conference of State Legislatures, March 25, 2022. <www.ncsl.org>
Medicaid—a federal/state partnership with shared authority and financing—is a health insurance program for low-income individuals, children, their parents, the elderly and people with disabilities. Although participation is optional, all 50 states participate in the Medicaid program with significant variation across states in spending, eligibility, covered services and other program features. Once certain minimum federal standards are met, each state determines how its program is administered, who to cover, what services to cover, and how providers are paid.
[329] Report: “Medicaid: A Primer.” By Elicia J. Herz. Congressional Research Service, July 18, 2012. <fas.org>
Pages 1–2:
The federal Medicaid statute (Title XIX of the Social Security Act) defines more than 50 distinct population groups as being potentially eligible. Historically, Medicaid eligibility was subject to categorical restrictions that generally limited coverage to the elderly, persons with disabilities (as generally defined under the federal Supplemental Security Income Program, or SSI3), members of families with dependent children, certain other pregnant women and children, certain women with breast or cervical cancer, and uninsured individuals with tuberculosis. Recent changes in law (described below) provide eligibility for nonelderly, childless adults who do not fit into these traditional categories.
In addition, to qualify for Medicaid coverage, applicants’ income (for example, wages, Social Security benefits) and sometimes their resources, or assets (for example, value of a car, savings accounts), must meet program financial requirements. Medicaid began with eligibility based on receipt of cash assistance under other programs such as Aid to Families with Dependent Children (AFDC), or the SSI program, as noted above. In recent years, Medicaid has shifted largely to eligibility based on income, and most enrollees do not receive cash assistance. However, states are still required to apply rules used by their former AFDC programs4 or the federal SSI program when determining countable income for Medicaid. Generally, SSI rules are applicable to the elderly and those with disabilities, while AFDC rules are applicable to other groups. These programs differ on what counts as income and how much is disregarded (ignored) for determining financial eligibility for Medicaid. States have the option to apply additional disregards in order to reduce countable income.
Some eligibility groups are mandatory, meaning that all states with a Medicaid program must cover them; others are optional. Examples of groups that states must provide Medicaid to include:
• poor families that meet the financial requirements (based on family size) of the former AFDC cash assistance program;5
• families losing Medicaid eligibility due to increased earnings from work who receive up to 12 months of Medicaid coverage;6
• pregnant women and children through age 6 with family income at or below 133% of the federal poverty level (FPL);7
• children ages 6 through 18 with family income at or below 100% FPL, rising to 133% FPL beginning in 2014 (or sooner at state option);
• low-income individuals who are age 65 and older, or blind, or under age 65 and disabled who qualify for cash assistance under the SSI program;8
• certain groups of legal permanent resident immigrants (for example, refugees for the first seven years after entry into the U.S.; asylees for the first seven years after asylum is granted; lawful permanent aliens with 40 quarters of creditable coverage under Social Security; immigrants who are honorably discharged U.S. military veterans) who meet all other financial and categorical Medicaid eligibility requirements….
5 AFDC income standards are well below the federal poverty level, but states can modify (liberalize or potentially further restrict) these criteria. Although TANF [Temporary Assistance for Needy Families] recipients are not automatically eligible for Medicaid, some states have aligned income rules for TANF and Medicaid, thus facilitating Medicaid coverage for some TANF recipients.
7 For example, in 2012, the FPL for a family of four is $23,050—133% of FPL for such a family would equal $30,656.50.
8 Some states use income, resource and disability standards that differ from current SSI standards.
[330] Report: “Medicaid: A Primer.” By Elicia J. Herz. Congressional Research Service, July 18, 2012. <fas.org>
Page 14: “[T]raditional Medicaid … compared to both Medicare and employer-sponsored health care plans, offers the broadest array of medical care and related services available in the United States today.”
[331] Report: “American Recovery and Reinvestment Act: Development of a Medicaid/CHIP Environmental Scanning and Program Characteristics (ESPC) Database.” Submitted by IMPAQ International and RTI International. Department of Health and Human Services, Centers for Medicare and Medicaid Services, March 31, 2011.
Page 27:
Appendix E: Medicaid-Covered Services in the Environmental Scanning and Program Characteristics Database
Medicaid-Covered Services
• Ambulance
• Certified registered nurse anesthetist
• Chiropractor
• Dental
• Dentures
• Diagnostic, screening, and preventive
• Early and periodic screening, diagnosis and treatment
• Extended services for pregnant women
• Eyeglasses
• Family planning
• Federally qualified health center
• Freestanding ambulatory surgery center
• Hearing aids
• Home- and community-based services waiver
• Home health services
• Hospice care
• ICF [intermediate care facility] services for the mentally retarded
• Inpatient hospital services, other than in an IMD [institution for mental diseases]
• Inpatient hospital, nursing facility and ICF/IMD
• Inpatient psychiatric services, under age 21
• Laboratory and x-ray, outside hospital or clinic
• Medical and remedial care—other practitioners
• Medical equipment and supplies
• Medical/surgical services of a dentist
• Mental health and substance abuse rehabilitation
• Nonemergency medical transportation
• Nurse midwife
• Nurse practitioner
• Nursing facility services, other than in an IMD
• Occupational therapy
• Optometrist
• Outpatient hospital
• Personal care
• Physical therapy
• Physician
• Podiatrist
• Prescription drugs
• Private duty nursing
• Program of All-inclusive Care for the Elderly
• Prosthetic and orthotic devices
• Psychologist
• Public health and mental health clinics
• Religious nonmedical HCI [health care institution] and practitioner
• Rural health clinic
• Speech, hearing and language disorders
• Targeted case management
[332] Report: “Medicaid: A Primer.” By Elicia J. Herz. Congressional Research Service, July 18, 2012. <fas.org>
Page 2 (of PDF): “[E]ach state designs and administers its own version of the program [Medicaid] under broad federal rules. State variability is the rule rather than the exception in terms of eligibility levels, covered services, and how those services are reimbursed and delivered. The Patient Protection and Affordable Care Act … makes both mandatory and optional changes to Medicaid along some of these dimensions.”
[333] “2018 Actuarial Report on the Financial Outlook for Medicaid.” By Christopher J. Truffer and others. U.S. Department of Health & Human Services, Centers for Medicare and Medicaid Services, Office of the Actuary, April 9, 2020. <www.cms.gov>
Page 3: “Medicaid costs are met primarily by Federal and State general revenues, on an as-needed basis; the States may also rely on local government revenues to finance a portion of their share of Medicaid costs. The Federal financing is authorized through an annual appropriation by Congress.”
[334] Report: “Analytical Perspectives: Budget of the United States Government, Fiscal Year 2005.” White House Office of Management and Budget, February 2004. <fraser.stlouisfed.org>
Page 339: “The main financing component of the Federal funds group is the general fund, which is used to carry out the general purposes of Government rather than being restricted by law to a specific program. It consists of all collections not earmarked by law to finance other funds, including virtually all income taxes and many excise taxes….”
[335] Article: “Ways and Means Committee.” By Albert Buckberg. The Encyclopedia of Taxation & Tax Policy. Urban Institute Press, 2005.
Page 469: “Spending from the general fund is financed by general revenues, which include the individual and corporation income taxes, some excise taxes, estate and gift taxes, tariffs, and miscellaneous receipts.”
[336] The tables below shows the average federal general revenue taxes paid by various income groups prior to the Covid-19 pandemic in 2019 and during it in 2020:
|
Average Federal General Revenue Taxes (2019) |
|||
|
Household Income Group |
Full Income |
Effective Tax Rate |
Taxes Per Household |
|
Lowest 20% |
$39,100 |
–6.0% |
–$2,359 |
|
Second 20% |
$59,600 |
–0.7% |
–$424 |
|
Middle 20% |
$85,500 |
3.9% |
$3,300 |
|
Fourth 20% |
$124,900 |
7.0% |
$8,682 |
|
Highest 20% |
$333,100 |
17.6% |
$58,658 |
|
81st–90th% |
$181,300 |
10.2% |
$18,552 |
|
91st–95th% |
$250,400 |
13.0% |
$32,523 |
|
96th–99th% |
$417,400 |
17.6% |
$73,428 |
|
Top 1% |
$1,998,700 |
27.6% |
$551,879 |
|
Average Federal General Revenue Taxes (2020) |
|||
|
Household Income Group |
Full Income |
Effective Tax Rate |
Taxes Per Household |
|
Lowest 20% |
$42,200 |
–13.7% |
–$5,798 |
|
Second 20% |
$63,600 |
–6.7% |
–$4,230 |
|
Middle 20% |
$90,500 |
–1.4% |
–$1,295 |
|
Fourth 20% |
$131,800 |
3.6% |
$4,739 |
|
Highest 20% |
$360,900 |
17.1% |
$61,609 |
|
81st–90th% |
$191,500 |
8.2% |
$15,707 |
|
91st–95th% |
$265,100 |
12.0% |
$31,775 |
|
96th–99th% |
$440,000 |
17.3% |
$76,077 |
|
Top 1% |
$2,291,800 |
27.6% |
$633,629 |
The figures above were calculated with data from:
a) Dataset: “The Distribution of Household Income, 2019.” Congressional Budget Office, November 2022. <www.cbo.gov>
“Table 3. Average Household Income, by Income Source and Income Group, 1979 to 2019, 2019 Dollars”
“Table 7. Components of Federal Taxes, by Income Group, 1979 to 2019, 2019 Dollars”
b) Dataset: “Table 2.4 – Composition of Social Insurance and Retirement Receipts and of Excise Taxes: 1940–2027.” Executive Office of the President of the United States, Office of Management and Budget, March 28, 2022. <www.govinfo.gov>
c) Dataset: “The Distribution of Household Income, 2020.” Congressional Budget Office, November 2023. <www.cbo.gov>
“Table 3. Average Household Income, by Income Source and Income Group, 1979 to 2020, 2020 Dollars”
“Table 7. Components of Federal Taxes, by Income Group, 1979 to 2020, 2020 Dollars”
d) Dataset: “Table 2.4 – Composition of Social Insurance and Retirement Receipts and of Excise Taxes: 1940–2028.” Executive Office of the President of the United States, Office of Management and Budget, March 13, 2023. <www.govinfo.gov>
e) The Encyclopedia of Taxation & Tax Policy. Edited by Joseph J. Cordes and others. Urban Press Institute, 2005.
Page 469: “Spending from the general fund is financed by general revenues, which include the individual and corporation income taxes, some excise taxes, estate and gift taxes, tariffs, and miscellaneous receipts.”
f) Report: “Present Law and Background Information on Federal Excise Taxes.” United States Congress, Joint Committee on Taxation, January 2011. <www.jct.gov>
Page 1: “Revenues from certain Federal excise taxes are dedicated to trust funds (for example, the Highway Trust Fund) for designated expenditure programs, and revenues from other excise taxes (for example, alcoholic beverages) go to the General Fund for general purpose expenditures.”
NOTES:
[337] Report: “The Distribution of Household Income, 2020.” Congressional Budget Office, November 2023. <www.cbo.gov>
Page 8:
In this analysis, federal taxes consist of individual income taxes, payroll taxes, corporate income taxes, and excise taxes.7 Taken together, those taxes accounted for over 90 percent of all federal revenues collected in 2020. Among the sources of revenues, individual income taxes and payroll taxes are the largest, followed by corporate taxes and excise taxes.8
7 The remaining federal revenue sources not allocated to U.S. households are states’ deposits for unemployment insurance, estate and gift taxes, net income earned by the Federal Reserve System, customs duties, and miscellaneous fees and fines.
Pages 31–32: “Individual income taxes can be negative because they include the effects of refundable tax credits, which can result in net payments from the government. Specifically, if the amount of a refundable tax credit exceeds a filer’s tax liability before the credit is applied, the government pays that excess to the filer.”
Page 20:
Data
The core data used in CBO’s distributional analyses come from the Statistics of Income (SOI), a nationally representative sample of individual income tax returns collected by the IRS. That sample of tax returns becomes available to CBO approximately two years after the returns are filed. Data on household income are systematically and consistently reported in the SOI. The sample is therefore considered a reliable resource to use when analyzing the effects of fiscal policy on income. However, certain types of income are not reported in the SOI. In 2020, for example, the portion of payments from the Paycheck Protection Program that was not used to pay for employees’ wages was not taxable and therefore not available in the SOI data.
SOI data include information about tax filers’ family structure and age, but they do not include certain demographic information or data on people who do not file taxes. For that information, CBO uses data from the Annual Social and Economic Supplement of the Census Bureau’s Current Population Survey (CPS), which has data on the demographic characteristics and income of a large sample of households.6
CBO combines the two data sources, statistically matching each SOI record to a corresponding CPS record on the basis of demographic characteristics and income. Each pairing results in a new record that takes on some characteristics of the CPS record and some characteristics of the SOI record.7
Page 22:
Measures of Income, Federal Taxes, and Means-Tested Transfers
Most distributional analyses rely on a measure of annual income as the metric for ranking households. In CBO’s analyses of the distribution of household income, information about taxable income sources for tax-filing units that file individual income tax returns comes from the SOI, whereas information about nontaxable income sources and income for tax-filing units that do not file individual income tax returns comes from the CPS. Among households at the top of the income distribution, the majority of income data are drawn from the SOI. In contrast, among households in the lower and middle quintiles, a larger portion of income data is drawn from the CPS….
Pages 31–32:
Household income, unless otherwise indicated, refers to income before the effects of means-tested transfers and federal taxes are accounted for. Throughout this report, that income concept is called income before transfers and taxes. It consists of market income plus social insurance benefits.
Market income consists of the following five elements:
• Labor income. Wages and salaries, including those allocated by employees to 401(k) and other employment-based retirement plans; employer-paid health insurance premiums (as measured by the Census Bureau’s Current Population Survey); the employer’s share of payroll taxes for Social Security, Medicare, and federal unemployment insurance; and the share of corporate income taxes borne by workers.
• Business income. Net income from businesses and farms operated solely by their owners, partnership income, and income from S corporations.
• Capital gains. Net profits realized from the sale of assets (but not increases in the value of assets that have not been realized through sales).
• Capital income. Taxable and tax-exempt interest, dividends paid by corporations (but not dividends from S corporations, which are considered part of business income), rental income, and the share of corporate income taxes borne by capital owners.
• Other income sources. Income received in retirement for past services and other nongovernmental sources of income.
Social insurance benefits consist of benefits from Social Security (Old Age, Survivors, and Disability Insurance), Medicare (measured by the average cost to the government of providing those benefits), regular unemployment insurance (but not expanded unemployment compensation), and workers’ compensation.
Means-tested transfers are cash payments and in-kind services provided through federal, state, and local government assistance programs. Eligibility to receive such transfers is determined primarily on the basis of income, which must be below certain thresholds. Means-tested transfers are provided through the following programs: Medicaid and the Children’s Health Insurance Program (measured by the average cost to the federal government and state governments of providing those benefits); the Supplemental Nutrition Assistance Program (formerly known as the Food Stamp program); housing assistance programs; Supplemental Security Income; Temporary Assistance for Needy Families and its predecessor, Aid to Families With Dependent Children; child nutrition programs; the Low Income Home Energy Assistance Program; and state and local governments’ general assistance programs. For 2020, CBO included expanded unemployment compensation in means-tested transfers.
Average means-tested transfer rates are calculated as means-tested transfers (totaled within an income group) divided by income before transfers and taxes (totaled within an income group).
Federal taxes consist of individual income taxes, payroll (or social insurance) taxes, corporate income taxes, and excise taxes. Those four sources accounted for 94 percent of federal revenues in fiscal year 2020. Revenue sources not examined in this report include states’ deposits for unemployment insurance, estate and gift taxes, net income of the Federal Reserve System that is remitted to the Treasury, customs duties, and miscellaneous fees and fines.
In this analysis, taxes for a given year are the amount a household owes on the basis of income received in that year, regardless of when the taxes are paid. Those taxes comprise the following four categories:
• Individual income taxes. Individual income taxes are levied on income from all sources, except those excluded by law. Individual income taxes can be negative because they include the effects of refundable tax credits (including recovery rebate credits), which can result in net payments from the government. Specifically, if the amount of a refundable tax credit exceeds a filer’s tax liability before the credit is applied, the government pays that excess to the filer. Statutory marginal individual income tax rates are the rates set in law that apply to the last dollar of income.
• Payroll taxes. Payroll taxes are levied primarily on wages and salaries. They generally have a single rate and few exclusions, deductions, or credits. Payroll taxes include those that fund the Social Security trust funds, the Medicare trust fund, and unemployment insurance trust funds. The federal portion of the unemployment insurance payroll tax covers only administrative costs for the program; state-collected unemployment insurance payroll taxes are not included in the Congressional Budget Office’s measure of federal taxes (even though they are recorded as revenues in the federal budget). Households can be entitled to future social insurance benefits, including Social Security, Medicare, and unemployment insurance, as a result of paying payroll taxes. In this analysis, average payroll tax rates capture the taxes paid in a given year and do not capture the benefits that households may receive in the future.
• Corporate income taxes. Corporate income taxes are levied on the profits of U.S.–based corporations organized as C corporations. In this analysis, CBO allocated 75 percent of corporate income taxes in proportion to each household’s share of total capital income (including capital gains) and 25 percent to households in proportion to their share of labor income.
• Excise taxes. Sales of a wide variety of goods and services are subject to federal excise taxes. Most revenues from excise taxes are attributable to the sale of motor fuels (gasoline and diesel fuel), tobacco products, alcoholic beverages, and aviation-related goods and services (such as aviation fuel and airline tickets).
Average federal tax rates are calculated as federal taxes (totaled within an income group) divided by income before transfers and taxes (totaled within an income group).
Income after transfers and taxes is income before transfers and taxes plus means-tested transfers minus federal taxes.
Income groups are created by ranking households by their size-adjusted income before transfers and taxes. A household consists of people sharing a housing unit, regardless of their relationship. The income quintiles (or fifths of the distribution) contain approximately the same number of people but slightly different numbers of households…. Similarly, each full percentile (or hundredth of the distribution) contains approximately the same number of people but a different number of households. If a household has negative income (that is, if its business or investment losses exceed its other income), it is excluded from the lowest income group but included in totals.
NOTE: † See Just Facts’ research on the distribution of the federal tax burden for details about how the Congressional Budget Office determines the share of corporate income taxes borne by workers and owners of capital.
[338] Economists typically use a “comprehensive measure of income” to calculate effective tax rates because this provides a complete “measure of ability to pay” taxes.† In keeping with this, Just Facts determines effective tax rates by dividing all measurable taxes by all income. The Congressional Budget Office (CBO) previously did the same,‡ but in 2018, CBO announced that it would exclude means-tested transfers from its measures of income and effective tax rates.§ #
Given this change, Just Facts now uses CBO data to determine comprehensive income and effective tax rates by adding back the means-tested transfers that CBO publishes but takes out of these measures. To do this, Just Facts makes a simplifying assumption that households in various income quintiles do not significantly change when these transfers are added. This is mostly true, but as CBO notes:
Almost one-fifth of the households in the lowest quintile of income before transfers and taxes would have been in higher quintiles if means-tested transfers were included in the ranking measure (see Table 5). Because net movement into a higher income quintile entails a corresponding net movement out of those quintiles, more than one-fifth of the households in the second quintile of income before transfers and taxes would have been bumped down into the bottom before-tax income quintile. Because before-tax income excludes income in the form of means-tested transfers, almost one-fifth of the people in the lowest quintile of income before transfers and taxes were in higher before-tax income quintiles. There is no fundamental economic change represented by those changes in income groups—just a change in the income definition used to rank households. Because means-tested transfers predominantly go to households in the lower income quintiles, there is not much shuffling across income quintile thresholds toward the top of the distribution.§
NOTES:
[339] Calculated with data from:
a) Table 3.12: “Government Social Benefits.” United States Department of Commerce, Bureau of Economic Analysis. Last revised September 30, 2022. <apps.bea.gov>
“(Billions of dollars) … Medicaid … 2021 [=] 735.6”
b) Table 3.1: “Government Current Receipts and Expenditures.” United States Department of Commerce, Bureau of Economic Analysis. Last revised October 27, 2022. <apps.bea.gov>
“(Billions of dollars) … 2021 … Current receipts [=] 6,731.8 … Current expenditures [=] 9,342.3”
CALCULATIONS:
[340] Report: “Medicaid’s Federal Medical Assistance Percentage (FMAP).” By Alison Mitchell. Congressional Research Service, February 9, 2016. Updated 7/29/20. <fas.org>
Page 2 (of PDF):
Generally determined annually, the FMAP formula is designed so that the federal government pays a larger portion of Medicaid costs in states with lower per capita incomes relative to the national average (and vice versa for states with higher per capita incomes). FMAP rates have a statutory minimum of 50% and a statutory maximum of 83%. For FY [fiscal year] 2021, regular FMAP rates range from 50.00% (13 states) to 77.76% (Mississippi).
The FMAP rate is used to reimburse states for the federal share of most Medicaid expenditures. However, exceptions to the regular FMAP rate have been made for certain states (for example, the District of Columbia and the territories), situations (for example, during economic downturns), populations (for example, individuals covered by the Patient Protection and Affordable Care Act’s … Medicaid expansion and individuals with breast or cervical cancer), providers (for example, Indian Health Service facilities), and services (for example, family planning and home health services). In addition, the federal share for most Medicaid administrative costs does not vary by state and is generally 50%.
[341] Report: “Medicaid: A Primer.” By Elicia J. Herz. Congressional Research Service, July 18, 2012. <fas.org>
Page 9:
The federal and state governments share the cost of Medicaid. States are reimbursed by the federal government for a portion (the “federal share”) of a state’s Medicaid program costs. Because Medicaid is an open-ended entitlement, there is no upper limit or cap on the amount of federal funds a state may receive. Medicaid costs in a given state and year are primarily determined by the expansiveness of eligibility rules and beneficiary participation, the breadth of benefits offered, the generosity of provider reimbursement rates, and other supplemental payments.
[342] Paper: “States’ Use of Medicaid Maximization Strategies to Tap Federal Revenues: Program Implications and Consequences.” By Teresa A. Coughlin and Stephen Zuckerman. Urban Institute, June 1, 2002. <www.urban.org>
Page 1: “Medicaid financing rules require states to spend their own funds to receive a federal financial match for Medicaid services, but there are no federal limits on program spending. This open-ended commitment of federal resources invites states to be generous in designing their programs. At the same time, because states share in the costs, it encourages states to use federal Medicaid dollars judiciously.”
[343] Calculated with data from: “National Health Expenditures by Type of Service and Source of Funds, Calendar Years 1960–2020.” U.S. Department of Health & Human Services, Centers for Medicare and Medicaid Services, December 1, 2021. <www.cms.gov>
NOTE: An Excel file containing the data and calculations is available upon request.
[344] “2010 Actuarial Report on the Financial Outlook for Medicaid.” By Christopher J. Truffer and others. U.S. Department of Health & Human Services, Centers for Medicare and Medicaid Services, Office of the Actuary, December 21, 2010. <www.cms.gov>
Page 18:
The more notable effect of ARRA [2009 American Recovery & Reinvestment Act; a.k.a. the “Obama stimulus”], however, was that it provided for a higher temporary FMAP [federal medical assistance percentage] for all States retroactive to the beginning of FY [fiscal year] 2009. This change resulted in an average effective Federal share for FY 2009 of about 65 percent (benefits and administration costs)….
Page 20:
From FY 2005 through FY 2008, the average Federal share was about 57 percent. For FYs 2009, 2010, and 2011, the ARRA provided for temporary FMAP increases, in part based on changes in each State’s unemployment rate. This act led to a higher Federal share in FY 2009 of about 65 percent and is projected to result in a slightly higher share in FY 2010 of about 67 percent. As a result of an extension of the temporary FMAP increase through June 30, 2011, as provided for in the Education, Jobs, and Medicaid Assistance Act of 2010, the Federal share for FY 2011 is projected to be about 63 percent.
[345] “2016 Actuarial Report on the Financial Outlook for Medicaid.” By Christopher J. Truffer and others. U.S. Department of Health & Human Services, Centers for Medicare and Medicaid Services, Office of the Actuary, 2016. <www.cms.gov>
Page 16:
For much of history, the average annual Federal share [of Medicaid expenditures] has been about 57 percent of total expenditures, with several years of greater Federal shares due to changes specified in legislation. Over the next 10 years, the Federal share of Medicaid expenditures is projected to vary, largely due to the Affordable Care Act. The average Federal share was 58 percent in 2013 and increased to 61 percent in 2014 due mainly to the higher FMAP [federal medical assistance percentage] for newly eligible Medicaid beneficiaries, and it is estimated to have increased to 63 percent in 2015 and to have remained at 63 percent through 2016. The average Federal share is expected to decline to 61 percent by 2021 and to remain at that level through 2025, as the matching rate for the newly eligible adults is gradually reduced from 100 percent in 2016 to 90 percent in 2020.
[346] Dataset: “National Health Expenditures by Type of Service and Source of Funds: Calendar Years 1960 to 2020.” U.S. Department of Health & Human Services, Centers for Medicare and Medicaid Services, December 1, 2021. <www.cms.gov>
2020 … Expenditure Amount (Millions) … Total National Health Expenditures [=] 4,124,005 … Medicaid (Title XIX) [=] 671,190 …
Total Dental Services Expenditures [=] 142,405 … Medicaid (Title XIX) [=] 12,637 …
Total Prescription Drug Expenditures [=] 348,411 … Medicaid (Title XIX) [=] 34,546 …
Total Physician and Clinical Expenditures [=] 809,460 … Medicaid (Title XIX) [=] 86,766 …
Total Hospital Expenditures [=] 1,270,149 … Medicaid (Title XIX) [=] 220,838 …
Total Nursing Care Facilities and Continuing Care Retirement Communities [=] 196,804 … Medicaid (Title XIX) [=] 53,232 …
Total Home Health Care Expenditures [=] 123,717 … Medicaid (Title XIX) [=] 40,187
CALCULATIONS:
[347] “2018 Actuarial Report on the Financial Outlook for Medicaid.” By Christopher J. Truffer and others. U.S. Department of Health & Human Services, Centers for Medicare and Medicaid Services, Office of the Actuary, April 9, 2020. <www.cms.gov>
Pages 24–25:
Among the different types of health care services, Medicaid plays the largest role in the funding of long-term care. According to the 2017 NHEA [national health expenditure accounts], during that year Medicaid is estimated to have paid for 36.1 percent of all freestanding† home health care and 30.2 percent of all freestanding nursing home care in the United States. In addition, Medicaid covered an estimated 57.8 percent of other health, personal, and residential care in 2017, including Medicaid payments for intermediate care facilities for individuals with intellectual and developmental disabilities and such payments for home and community-based waivers.34 Medicaid has a major responsibility for providing long-term care because the program covers some aged persons and many persons with disabilities of all ages—individuals who tend to be the most frequent and most costly users of such care—and because private health insurance and Medicare often furnish only limited coverage for these benefits. Many people who pay privately for nursing home care or community-based long-term care become impoverished due to the expense; as a result, these people eventually become eligible for Medicaid. …
Figure 6—Medicaid Expenditures as Percentage of Total U.S. Health Expenditures, by Service Category, Calendar Year 2017 … Total [=] 16.7% … Dental [=] 9.7% … Drugs [=] 9.9% … Physician [=] 10.8% … Hospital [=] 17.0% … Nursing Home [=] 30.2% … Home Health [=] 36.1%
34 A. Martin and others, “National Health Care Spending in 2017: Growth Slows to Post-Great Recession Rates; Share of GDP [gross domestic product] Stabilizes.”
NOTE: † See the next footnote for the definition of “freestanding” in this context.
[348] Book: The U.S. Nursing Home Industry. By Joseph A. Giacalone. M. E. Sharpe, 2011.
Page 6:
Expenditures for freestanding nursing home care reached $87.8 billion in 1998. The “freestanding” designation is important because HCFA [Health Care Financing Administration, now the Centers for Medicare and Medicaid Services] data on national health expenditures do not include skilled nursing care provided by hospital-based facilities. Such nursing care expenditures are included in the hospital care component of national expenditures.
[349] Report: “Births: Final Data for 2020.” By Michelle J.K. Osterman and others. U.S. Centers for Disease Control and Prevention, National Center for Health Statistics, February 7, 2022. <www.cdc.gov>
Page 2: “Medicaid was the source of payment for 42.0% of all 2020 births.”
[350] Report: “Medicaid: A Primer.” By Elicia J. Herz. Congressional Research Service, July 18, 2012. <fas.org>
Page 7:
Unauthorized aliens (i.e., illegal aliens, foreign nationals who are not lawfully present in the United States) are ineligible for Medicaid. Such individuals who meet the eligibility requirements for Medicaid, but are ineligible due to immigration status, may receive Medicaid coverage for emergency conditions (i.e., emergency Medicaid) only, which includes costs associated with emergency labor and delivery for pregnant women and excludes costs for organ transplants.
[351] Report: “Review of Medicaid Funding for Emergency Services Provided to Nonqualified Aliens.” By Daniel R. Levinson. U.S. Department of Health & Human Services, Office of Inspector General, September 2010. <oig.hhs.gov>
Page 1:
Pursuant to Title XIX of the Social Security Act (the Act), the Medicaid program provides medical assistance to low-income individuals and low income individuals with disabilities. …
Federal Emergency Medicaid Funding for Aliens
Section 1903(v) of the Act states that Federal Medicaid funding is available to States for medical services provided to aliens who are not lawfully admitted for permanent residence or otherwise permanently residing in the United States under color of law only when those services are necessary to treat an emergency medical condition. Further, 42 CFR § 440.255 states that Federal Medicaid funding is available to States for medical services provided to aliens granted lawful temporary resident status or lawful permanent resident status and who meet all other requirements for Medicaid only when those services are necessary to treat an emergency medical condition.
Section 1903(v) of the Act and 42 CFR § 440.255 define an emergency medical condition as one manifested by acute symptoms of such severity that the absence of immediate medical attention could reasonably be expected to result in (1) placing the patient’s health in serious jeopardy, (2) serious impairment to bodily functions, or (3) serious dysfunction of any body part or organ. Further, 42 CFR § 440.255 specifies that there must be “sudden onset” of the condition. In addition, 42 CFR § 440.255 states that Federal Medicaid funding is available to States for services provided to pregnant women if a provision is included in the approved State plan. These services include routine prenatal care, labor and delivery, and routine postpartum care.
[352] Article: “Across Texas, 60,000 Babies of Noncitizens Get U.S. Birthright.” By Sherry Jacobson. Dallas Morning News, August 8, 2010. <www.dallasnews.com>
“Parkland Memorial Hospital delivers more of those babies than any other hospital in the state. Last year at Parkland, 11,071 babies were born to women who were noncitizens, about 74 percent of total deliveries. Most of these women are believed to be in the country illegally.”
[353] Just Facts has verified all of the information quoted below with official government sources but is citing these sources because they are clearly worded and succinct:
a) Webpage: “Medicaid Rules.” ElderLawAnswers. Accessed November 14, 2022 at <attorney.elderlawanswers.com>
“While Congress and the federal Centers for Medicare and Medicaid Services (CMS) set out the main rules under which Medicaid operates, each state runs its own program. As a result, the rules are somewhat different in every state, although the framework is the same throughout the country.”
b) Webpage: “How Much Money Can You Have and Still Qualify for Medicaid?” ElderLawAnswers, January 7, 2022. <www.elderlawanswers.com>
The spouse of a nursing home resident—called the “community spouse”—is limited to one half of the couple’s joint assets up to $137,400 (in 2022) in “countable” assets. This figure changes each year to reflect inflation. Called the “community spouse resource allowance,” this is the most that a state may allow a community spouse to retain without a hearing or a court order. The least that a state may allow a community spouse to retain is $27,480 (in 2022). …
Some states, however, are more generous toward the community spouse. In these states, the community spouse may keep up to $137,400 (in 2022), regardless of whether or not this represents half the couple’s assets. …
All assets are counted against these limits unless the assets fall within the short list of “noncountable” assets. These include the following:
• Personal possessions, such as clothing, furniture, and jewelry
• One motor vehicle, regardless of value, as long as it is used for transportation of the applicant or a household member. The value of an additional automobile may be excluded if needed for health or self-support reasons (check your state’s rules).
• The applicant’s principal residence, provided it is in the same state in which the individual is applying for coverage. … [P]rincipal residences may be deemed noncountable only to the extent their equity is less than $636,000 (in 2022), with the states having the option of raising this limit to $955,000 (in 2022). In all states … the house may be kept with no equity limit if the Medicaid applicant’s spouse or another dependent relative lives there
c) Webpage: “Medicaid’s Attempt to Ensure the Healthy Spouse Has Enough Income: The MMMNA.” ElderLawAnswers, January 7, 2022. <www.elderlawanswers.com>
Although Medicaid limits the assets that the spouse of a Medicaid applicant can retain, the income of the “community spouse” is not counted in determining the Medicaid applicant’s eligibility. Only income in the applicant’s name is counted. Thus, even if the community spouse is still working and earning, say, $5,000 a month, he or she will not have to contribute to the cost of caring for a spouse in a nursing home if the spouse is covered by Medicaid. In some states, however, if the community spouse’s income exceeds certain levels, he or she does have to make a monetary contribution towards the cost of the institutionalized spouse’s care. The community spouse’s income is not considered in determining eligibility, but there is a subsequent contribution requirement.
But what if most of the couple’s income is in the name of the institutionalized spouse and the community spouse’s income is not enough to live on? In such cases, the community spouse is entitled to some or all of the monthly income of the institutionalized spouse. How much the community spouse is entitled to depends on what the local Medicaid agency determines to be a minimum income level for the community spouse. This figure, known as the minimum monthly maintenance needs allowance or MMMNA, is calculated for each community spouse according to a complicated formula based on his or her housing costs. The MMMNA may range from a low of $2,177 to a high of $3,435 a month (in 2022). If the community spouse’s own income falls below his or her MMMNA, the shortfall is made up from the nursing home spouse’s income.
CALCULATION: $3,435 per month personal income × 12 months per year = $41,220
[354] “2018 Actuarial Report on the Financial Outlook for Medicaid.” By Christopher J. Truffer and others. U.S. Department of Health & Human Services, Centers for Medicare and Medicaid Services, Office of the Actuary, April 9, 2020. <www.cms.gov>
Page 3: “Beneficiary cost sharing, such as deductibles or co-payments, and beneficiary premiums are very limited in Medicaid and do not represent a significant share of the total cost of health care goods and services for Medicaid enrollees.”
Page 63: “In particular, Medicaid pays almost all health care costs for enrolled children and adults. However, many aged beneficiaries or beneficiaries with disabilities are also enrolled in Medicare, which is the primary payer of benefits before Medicaid; thus, the per enrollee Medicaid estimates are less than the total cost of such beneficiaries’ annual health care across all payers.57”
[355] Article: “You Paid For It: Ambulance Rides, Health Care Reform.” By Michael Wooten. WGRZ (Local NBC affiliate in Buffalo NY), July 30, 2009. <www.wgrz.com>
Graham doesn’t have a job, insurance or car. So, when he feels bad, he doesn’t call a cab. He calls 911 to have an ambulance drive him to the hospital.
A 2 On Your Side investigation found that from January 2006 to May of this year, Rural Metro Ambulance picked him up 603 times.
Medicaid picked up the tab for each ride, costing taxpayers at least $118,158.
[356] Report: “Underpayment by Medicare and Medicaid.” American Hospital Association, February 2022. <www.aha.org>
Page 1: “Hospital participation in Medicare and Medicaid is voluntary. However, as a condition for receiving federal tax exemption for providing health care to the community, not-for-profit hospitals are required to care for Medicare and Medicaid beneficiaries. Also, Medicare and Medicaid account for more than 60 percent of all care provided by hospitals. Consequently, very few hospitals can elect not to participate in Medicare and Medicaid.”
[357] Report: “Projected Medicare Expenditures Under an Illustrative Scenario with Alternative Payment Updates to Medicare Providers.” By John D. Shatto and M. Kent Clemens. United States Department of Health and Human Services, Centers for Medicare and Medicaid Services, Office of the Actuary, June 2, 2022. <www.cms.gov>
Page 5: “As shown in figure 1, Medicare and Medicaid payment rates fell to roughly 60 percent and 62 percent, respectively, of private health insurance rates in 2019, in part due to the productivity adjustments that started in 2012.”
[358] Report: “Underpayment by Medicare and Medicaid.” American Hospital Association, February 2022. <www.aha.org>
Pages 1–2:
Each year, the American Hospital Association (AHA) collects aggregate information on the payments and costs associated with care delivered to beneficiaries of Medicare and Medicaid by U.S. hospitals. The data used to generate these numbers come from the AHA’s Annual Survey of Hospitals, which is the nation’s most comprehensive source of hospital financial data. …
Payment rates for Medicare and Medicaid, with the exception of managed care plans, are set by law rather than through a negotiation process, as with private insurers. These payment rates are currently set below the costs of providing care, resulting in underpayment.
Underpayment is the difference between the costs incurred and the reimbursement received for delivering care to patients. Underpayment occurs when the payment received is less than the costs of providing care, i.e., the amount paid by hospitals for the personnel, technology and other goods and services required to provide hospital care is more than the amount paid to them by Medicare or Medicaid for providing that care. …
In the aggregate, both Medicare and Medicaid payments fell below costs in 2020:
• Combined underpayments were $100.4 billion in 2020, up from $75.8 billion in 2019. The 2020 underpayment includes a shortfall of $75.6 billion for Medicare and $24.8 billion for Medicaid.
• For Medicare, hospitals received payment of only 84 cents for every dollar spent by hospitals caring for Medicare patients in 2020.
• For Medicaid, hospitals received payment of only 88 cents for every dollar spent by hospitals caring for Medicaid patients in 2020.
• In 2020, 67 percent of hospitals received Medicare payments less than cost, while 62 percent of hospitals received Medicaid payments less than cost.
[359] Report: “Projected Medicare Expenditures Under an Illustrative Scenario with Alternative Payment Updates to Medicare Providers.” By John D. Shatto and M. Kent Clemens. United States Department of Health and Human Services, Centers for Medicare and Medicaid Services, Office of the Actuary, June 2, 2022. <www.cms.gov>
Page 5:
For inpatient hospital services, Medicare payment rates in 2011 were about 68 percent, and Medicaid payment rates were about 71 percent, of private health insurance payment rates (including Medicaid disproportionate share hospital, or DSH, payments).10 As shown in figure 1, Medicare and Medicaid payment rates fell to roughly 60 percent and 62 percent, respectively, of private health insurance rates in 2019, in part due to the productivity adjustments that started in 2012. Payment rates for the two programs decline in tandem over the next 75 years (because of the UPLs [upper payment limits]), and, by the end of the long-range projection period [2097], Medicare and Medicaid payment rates for inpatient hospital services would each represent roughly 40 percent of the average level for private health insurance.
[360] Report: “Projected Medicare Expenditures Under an Illustrative Scenario with Alternative Payment Updates to Medicare Providers.” By John D. Shatto and M. Kent Clemens. United States Department of Health and Human Services, Centers for Medicare and Medicaid Services, Office of the Actuary, June 2, 2022. <www.cms.gov>
Page 6:
Figure 2 shows the resulting comparison of future Medicare and Medicaid payment rates for physician services relative to private health insurance payment rates. Medicare payment levels represented about 72 percent of private health insurance payment rates in 2020; these levels have been declining steadily since 2011 and are estimated to continue to decline throughout the projection period relative to the private rates. For Medicaid, payment rates in 2019 constituted about 54 percent of private health insurance payment rates, and they remain at that level for the rest of the projection period.12 Under current law, the Medicare rates would eventually fall to 26 percent of private health insurance levels by 2096 and to less than half of the projected Medicaid rates.
[361] “2013 Annual Report of the Board of Trustees of the Federal Hospital Insurance and Federal Supplementary Medical Insurance Trust Funds.” United States Department of Health and Human Services, Centers for Medicare and Medicaid Services, May 31, 2013. <downloads.cms.gov>
Pages 273–274:
Statement of Actuarial Opinion …
Without unprecedented changes in health care delivery systems and payment mechanisms, the prices paid by Medicare for health services are very likely to fall increasingly short of the costs of providing these services. By the end of the long-range projection period, Medicare prices for hospital, skilled nursing facility, home health, hospice, ambulatory surgical center, diagnostic laboratory, and many other services would be less than half of their level without consideration of the productivity price reductions. Medicare prices would be considerably below the current relative level of Medicaid prices, which have already led to access problems for Medicaid enrollees, and far below the levels paid by private health insurance. Well before that point, Congress would have to intervene to prevent the withdrawal of providers from the Medicare market and the severe problems with beneficiary access to care that would result.
[362] Article: “Matt Bevin, Owner Of East Hampton Bell Factory, Elected Kentucky Governor.” Associated Press, November 3, 2015. <www.courant.com>
Stanley and Deborah Harp own their own business in Georgetown. They had health insurance, but the type of plan they had vanished after the Affordable Care Act went into effect. They couldn’t afford their new health insurance premiums, but they did qualify for the expanded Medicaid program. Even though they now have free health insurance, they aren’t happy about it. They had to leave the doctor they had been using for 20 years.
“We’ve had the same doctor groups for the past 20 years who have our history, our kids had as pediatricians,” said Deborah Harp, adding that she voted for Bevin.
[363] Paper: “Auditing Access to Specialty Care for Children with Public Insurance.” By Joanna Bisgaier and Karin V. Rhodes. New England Journal of Medicine, June 16, 2011. Pages 2324–2333. <www.nejm.org>
Page 2324:
Methods
Between January and May 2010, research assistants called a stratified, random sample of clinics representing eight specialties in Cook County, Illinois, which has a high proportion of specialists. Callers posed as mothers of pediatric patients with common health conditions requiring outpatient specialty care. Two calls, separated by 1 month, were placed to each clinic by the same person with the use of a standardized clinical script that differed by insurance status.
Results
We completed 546 paired calls to 273 specialty clinics and found significant disparities in provider acceptance of Medicaid-CHIP [Children’s Health Insurance Program] versus private insurance across all tested specialties. Overall, 66% of Medicaid-CHIP callers (179 of 273) were denied an appointment as compared with 11% of privately insured callers (29 of 273) (relative risk, 6.2; 95% confidence interval [CI], 4.3 to 8.8; P<0.001). Among 89 clinics that accepted both insurance types, the average wait time for Medicaid-CHIP enrollees was 22 days longer than that for privately insured children (95% CI, 6.8 to 37.5; P=0.005).
[364] Report: “Medicaid Patients Increasingly Concentrated Among Physicians.” By Peter J. Cunningham and Jessica H. May. Center for Studying Health System Change, August 2006. <www.hschange.org>
Medicaid payment rates, which are considerably lower than physician payment rates under Medicare or private insurance, historically have deterred physician participation in Medicaid. About one-fifth of physicians (21 percent) reported accepting no new Medicaid patients in 2004–05, a rate six times higher than for Medicare patients and five times higher than for privately insured patients, according to HSC’s [Health System Change’s] nationally representative Community Tracking Study Physician Survey (see Data Source and Table 1). Moreover, about half of physicians reported accepting all new Medicaid patients in 2004–05, compared with more than 70 percent for Medicare and privately insured patients. Low physician participation in Medicaid has been shown to negatively affect enrollee access to medical care.
[365] Report: “Physician Acceptance of New Medicaid Patients: Findings from the National Electronic Health Records Survey.” U.S. Medicaid and CHIP [Children’s Health Insurance Program] Payment and Access Commission, June 2021. <www.macpac.gov>
Page 2:
Similar to prior analysis, physicians were significantly less likely to accept new patients covered by Medicaid than those with Medicare or private insurance, although acceptance varied by specialty and by state. …
Table 1. Percentage of Physicians Accepting Payments for New Patients by Specialty and Coverage Type, 2017 … Specialty [=] Primary care … Medicaid [=] 75.8% … Medicare [=] 80.6% … Private [=] 96.8%
[366] “2016 Actuarial Report on the Financial Outlook for Medicaid.” By Christopher J. Truffer and others. U.S. Department of Health & Human Services, Centers for Medicare and Medicaid Services, Office of the Actuary, 2016. <www.cms.gov>
Page 2:
As of January 2014, the Affordable Care Act granted the States the authority under their State plans to expand Medicaid eligibility to almost all individuals under age 65 who are living in families with income below 138 percent of the Federal poverty level (FPL) (and who are citizens or eligible legal residents), with the Federal government currently paying 100 percent of the costs for newly eligible adults, to be reduced to 90 percent by 2020.2 (The Affordable Care Act also simplified eligibility processes for most adults, children, and pregnant women who are covered by Medicaid.)
2 … The Affordable Care Act technically specifies an upper income threshold of 133 percent of the FPL but also allows a 5-percent income disregard, making the effective threshold 138 percent.
[367] Public Law 111-148: “Patient Protection and Affordable Care Act.” 111th U.S. Congress. Signed into law by Barack Obama on March 23, 2010. <www.congress.gov>
Title II, Subtitle A, Section 2002a: …
(C) No Assets Test.—A State shall not apply any assets or resources test for purposes of determining eligibility for medical assistance under the State plan or under a waiver of the plan. …
Effective Date.—The amendments made by subsections (a) and (b) take effect on January 1, 2014.
[368] Calculated with data from the webpage: “Poverty Guidelines.” U.S. Department of Health & Human Services, Assistant Secretary for Planning and Evaluation, January 12, 2022. <aspe.hhs.gov>
“Persons in family/household [=] 4 … 2022 Poverty Guidelines for the 48 Contiguous States and the District Of Columbia … [=] $27,750 … 2022 Poverty Guidelines for Alaska [=] $34,690 … 2022 Poverty Guidelines for Hawaii [=] $31,920”
CALCULATION: $27,750 × 138% = $38,295
[369] Ruling: National Federation of Independent Business v. Sebelius. U.S. Supreme Court, June 28, 2012. <www.law.cornell.edu>
Pages 1–2:
Another key provision of the Act is the Medicaid expansion. The current Medicaid program offers federal funding to States to assist pregnant women, children, needy families, the blind, the elderly, and the disabled in obtaining medical care. … The Affordable Care Act expands the scope of the Medicaid program and increases the number of individuals the States must cover. For example, the Act requires state programs to provide Medicaid coverage by 2014 to adults with incomes up to 133 percent of the federal poverty level, whereas many States now cover adults with children only if their income is considerably lower, and do not cover childless adults at all. … The Act increases federal funding to cover the States’ costs in expanding Medicaid coverage. … But if a State does not comply with the Act’s new coverage requirements, it may lose not only the federal funding for those requirements, but all of its federal Medicaid funds. …
Twenty-six States, several individuals, and the National Federation of Independent Business brought suit in Federal District Court, challenging the constitutionality of the individual mandate and the Medicaid expansion.
[370] Ruling: National Federation of Independent Business v. Sebelius. U.S. Supreme Court, June 28, 2012. <www.law.cornell.edu>
Partly decided 7–2: Majority: Alito, Breyer, Kagan, Kennedy, Roberts, Scalia, Thomas. Dissenting: Ginsburg, Sotomayor.
Partly decided 5–4: Majority: Breyer, Ginsburg, Kagan, Roberts, Sotomayor. Dissenting: Alito, Kennedy, Scalia, Thomas.
Pages 4–6:
5. Chief Justice Roberts, joined by Justice Breyer and Justice Kagan, concluded in Part IV that the Medicaid expansion violates the Constitution by threatening States with the loss of their existing Medicaid funding if they decline to comply with the expansion. …
(a) The Spending Clause grants Congress the power “to pay the Debts and provide for the … general Welfare of the United States.” … Congress may use this power to establish cooperative state-federal Spending Clause programs. The legitimacy of Spending Clause legislation, however, depends on whether a State voluntarily and knowingly accepts the terms of such programs. Pennhurst State School and Hospital v. Halderman … “[T]he Constitution simply does not give Congress the authority to require the States to regulate.” New York v. United States…. When Congress threatens to terminate other grants as a means of pressuring the States to accept a Spending Clause program, the legislation runs counter to this Nation’s system of federalism. …
(b) Section 1396c gives the Secretary of Health and Human Services the authority to penalize States that choose not to participate in the Medicaid expansion by taking away their existing Medicaid funding. … The threatened loss of over 10 percent of a State’s overall budget is economic dragooning that leaves the States with no real option but to acquiesce in the Medicaid expansion. The Government claims that the expansion is properly viewed as only a modification of the existing program, and that this modification is permissible because Congress reserved the “right to alter, amend, or repeal any provision” of Medicaid. … But the expansion accomplishes a shift in kind, not merely degree. The original program was designed to cover medical services for particular categories of vulnerable individuals. Under the Affordable Care Act, Medicaid is transformed into a program to meet the health care needs of the entire nonelderly population with income below 133 percent of the poverty level. A State could hardly anticipate that Congress’s reservation of the right to “alter” or “amend” the Medicaid program included the power to transform it so dramatically. The Medicaid expansion thus violates the Constitution by threatening States with the loss of their existing Medicaid funding if they decline to comply with the expansion. …
(c) The constitutional violation is fully remedied by precluding the Secretary from applying §1396c to withdraw existing Medicaid funds for failure to comply with the requirements set out in the expansion. … The other provisions of the Affordable Care Act are not affected. Congress would have wanted the rest of the Act to stand, had it known that States would have a genuine choice whether to participate in the Medicaid expansion. …
6. Justice Ginsburg, joined by Justice Sotomayor, is of the view that the Spending Clause does not preclude the Secretary from withholding Medicaid funds based on a State’s refusal to comply with the expanded Medicaid program. But given the majority view, she agrees with The Chief Justice’s conclusion in Part IV-B that the Medicaid Act’s severability clause … determines the appropriate remedy. Because The Chief Justice finds the withholding—not the granting—of federal funds incompatible with the Spending Clause, Congress’ extension of Medicaid remains available to any State that affirms its willingness to participate. Even absent §1303’s command, the Court would have no warrant to invalidate the funding offered by the Medicaid expansion, and surely no basis to tear down the ACA [Affordable Care Act] in its entirety. When a court confronts an unconstitutional statute, its endeavor must be to conserve, not destroy, the legislation. …
Roberts, C. J., announced the judgment of the Court and delivered the opinion of the Court with respect to Parts I, II, and III-C, in which Ginsburg, Breyer, Sotomayor, and Kagan, JJ., joined; an opinion with respect to Part IV, in which Breyer and Kagan, JJ., joined; and an opinion with respect to Parts III-A, III-B, and III-D. Ginsburg, J., filed an opinion concurring in part, concurring in the judgment in part, and dissenting in part, in which Sotomayor, J., joined, and in which Breyer and Kagan, JJ., joined as to Parts I, II, III, and IV. Scalia, Kennedy, Thomas, and Alito, JJ., filed a dissenting opinion. Thomas, J., filed a dissenting opinion.
[371] Report: “Medicaid and CHIP [Children’s Health Insurance Program] Eligibility, Enrollment, and Cost-Sharing Policies as of January 2022: Findings From a 50-State Survey.” By Tricia Brooks and others. Georgetown University Center for Children and Families and Kaiser Family Foundation, March 16, 2022. <files.kff.org>
Pages 22–24:
As of January 2022, Medicaid and CHIP eligibility were stable as the public health emergency protections remained in effect for the entirety of 2021. To provide economic relief to the states and promote stability of coverage during the COVID-19 pandemic, the FFCRA provides a 6.2 percentage point increase in the federal share (FMAP) of certain Medicaid spending if states meet MOE requirements. The MOE provisions prohibit states from reducing eligibility levels, implementing stricter enrollment procedures, or increasing premiums beyond policies in place as of January 1, 2020. States are also required to provide continuous enrollment through the end of the month in which the PHE ends and must cover COVID-19 testing and treatment for Medicaid enrollees. The COVID-related MOE does not apply to separate CHIP programs, but other MOE requirements remain in place for CHIP.
In 2021, Oklahoma and Missouri implemented the ACA Medicaid adult expansion, leaving only 12 states that have not filled the coverage gap for low-income adults (Figure 13). As of January 2022, 39 states cover parents and adults without dependent children with incomes at least up to 138% FPL (the FPL is $13,590 for an individual; $23,030 for a family of three in 2022). Just half of the states (25) and DC immediately expanded coverage to adults in January 2014. Since then, an additional 13 states have adopted the Medicaid expansion; six via state ballot initiatives, including Missouri and Oklahoma. In 2022, South Dakota will be the seventh state where voters will have a say in the state’s decision to expand Medicaid.
In the 12 states that have not implemented the Medicaid expansion, eligibility for parents remains extremely low, and only Wisconsin covers adults without dependent children (Figures 14 and 15). The median eligibility level for parents and caretakers in the 12 non-expansion states now stands at 38.5% FPL ($8,866 annually for a family of three), ranging from a low of 16% FPL in Texas to 100% FPL in Wisconsin. Nine non-expansion states base eligibility on a fixed dollar threshold that is converted to the equivalent federal poverty level for comparison purposes. Over time, the equivalent eligibility level will decrease when annual updates adjust federal poverty levels upward to account for inflation. In a year when the jump in the federal poverty levels is more significant, as it was in 2022, this erosion is more evident. For example, Tennessee’s parent eligibility declined from 93% FPL to 88% FPL between 2021 and 2022. Wisconsin is the only non-expansion that has aligned eligibility for adults without dependent children with that for parents at 100% FPL, through a waiver.
Page 25: “Table 4: Medicaid Income Eligibility Limits for Adults as a Percent of the Federal Poverty Level, January 20221 … Parents (in a family of three) Upper Limit … Connecticut [=] 160% … District of Columbia [=] 221%”
[372] Webpage: “Status of State Medicaid Expansion Decisions: Interactive Map.” Kaiser Family Foundation, November 9, 2022. <www.kff.org>
To date, 40 states (including DC) have adopted the Medicaid expansion and 11 states have not adopted the expansion. …
Coverage under the Medicaid expansion became effective January 1, 2014 in all states that have adopted the Medicaid expansion except for the following: Michigan (4/1/2014), New Hampshire (8/15/2014), Pennsylvania (1/1/2015), Indiana (2/1/2015), Alaska (9/1/2015), Montana (1/1/2016), Louisiana (7/1/2016), Virginia (1/1/2019), Maine (1/10/2019 with coverage retroactive to 7/2/2018), Idaho (1/1/2020), Utah (1/1/2020), Nebraska (10/1/2020), Oklahoma (7/1/2021), Missouri (Processing applications beginning 10/1/2021 with coverage retroactive to 7/1/2021), and South Dakota (Planned for 7/1/2023).
[373] Webpage: “Medicaid Expansion Enrollment.” Kaiser Family Foundation. Accessed November 14, 2022 at <www.kff.org>
“Timeframe: Sept 2021 … Location [=] United States … Expansion Group Enrollment [=] 20,415,800 … Expansion Group Enrollment: Total number of adults who have enrolled in Medicaid as a result of the ACA [Affordable Care Act] expansion of the program.”
[374] Report: “Medicaid and CHIP [Children’s Health Insurance Program] Eligibility, Enrollment, and Cost-Sharing Policies as of January 2022: Findings From a 50-State Survey.” By Tricia Brooks and others. Georgetown University Center for Children and Families and Kaiser Family Foundation, March 16, 2022. <files.kff.org>
Pages 23–24:
In 2021, Oklahoma and Missouri implemented the ACA Medicaid adult expansion, leaving only 12 states that have not filled the coverage gap for low-income adults (Figure 13). As of January 2022, 39 states cover parents and adults without dependent children with incomes at least up to 138% FPL (the FPL is $13,590 for an individual; $23,030 for a family of three in 2022). Just half of the states (25) and DC immediately expanded coverage to adults in January 2014. Since then, an additional 13 states have adopted the Medicaid expansion; six via state ballot initiatives, including Missouri and Oklahoma. In 2022, South Dakota will be the seventh state where voters will have a say in the state’s decision to expand Medicaid.
In the 12 states that have not implemented the Medicaid expansion, eligibility for parents remains extremely low, and only Wisconsin covers adults without dependent children (Figures 14 and 15). The median eligibility level for parents and caretakers in the 12 non-expansion states now stands at 38.5% FPL ($8,866 annually for a family of three), ranging from a low of 16% FPL in Texas to 100% FPL in Wisconsin. Nine non-expansion states base eligibility on a fixed dollar threshold that is converted to the equivalent federal poverty level for comparison purposes. Over time, the equivalent eligibility level will decrease when annual updates adjust federal poverty levels upward to account for inflation. In a year when the jump in the federal poverty levels is more significant, as it was in 2022, this erosion is more evident. For example, Tennessee’s parent eligibility declined from 93% FPL to 88% FPL between 2021 and 2022. Wisconsin is the only non-expansion that has aligned eligibility for adults without dependent children with that for parents at 100% FPL, through a waiver.
[375] Transcript: “Remarks by the President on the Economy—Port of New Orleans.” White House, Office of the Press Secretary, November 8, 2013. <www.presidency.ucsb.edu>
So we want to work with everybody—mayor, governor, insurance—whoever it is that wants to work with us here in Louisiana to make sure that even if you don’t support the overall plan, let’s at least go ahead and make sure that the folks who don’t have health insurance right now and can get it through an expanded Medicaid. Let’s make sure we do that. (Applause.) It’s the right thing to do.
And one of the reasons to do it is—I’ve said this before; sometimes, people don’t fully appreciate it—we already pay for the health care of people who don’t have health insurance, we just pay for the most expensive version, which is when they go to the emergency room. Because what happens is, the hospitals have to take sick folk. They’re not just going to leave them on the streets. But people who are sick, they wait till the very last minute. It’s much more expensive to treat them. Hospitals have to figure out how to get their money back, which means, they jack up costs for everybody who does have health insurance by about a thousand dollars per family.
[376] Paper: “Multiple Inference and Gender Differences in the Effects of Early Intervention: A Reevaluation of the Abecedarian, Perry Preschool, and Early Training Projects.” By Michael L. Anderson. Journal of the American Statistical Association, December 2008. Pages 1481–1495. <are.berkeley.edu>
Page 1483: “The random assignment process makes estimation of causal effects straightforward.”
Page 1484: “Note that no assumptions regarding the distributions or independence of potential outcomes are needed. This is because the randomized design itself is the basis for inference (Fisher 1935), and preexisting clusters cannot be positively correlated with the treatment assignments in any systematic way.”
NOTE: For comprehensive documentation about the ability of random assignment studies to measure causes and effects, see the introductory section of Just Facts’ research on education.
[377] Article: “Medicaid Increases Emergency-Department Use: Evidence from Oregon’s Health Insurance Experiment.” By Amy N. Finkelstein, Sarah L. Taubman, and others. Science, January 2, 2014. Pages 263–268. <www.science.org>
Page 263:
In 2008, Oregon initiated a limited expansion of a Medicaid program for uninsured, low-income adults, drawing names from a waiting list by lottery. This lottery created a rare opportunity to study the effects of Medicaid coverage using a randomized controlled design. Using the randomization provided by the lottery and emergency-department records from Portland-area hospitals, we study the emergency-department use of about 25,000 lottery participants over approximately 18 months after the lottery. We find that Medicaid coverage significantly increases overall emergency use by 0.41 visits per person, or 40 percent relative to an average of 1.02 visits per person in the control group. We find increases in emergency-department visits across a broad range of types of visits, conditions, and subgroups, including increases in visits for conditions that may be most readily treatable in primary care settings. …
In 2008, Oregon initiated a limited expansion of its Medicaid program for low-income adults, drawing about 30,000 names by lottery from a waiting list of almost 90,000 individuals. Those selected were enrolled in Medicaid if they completed the application and met eligibility requirements. … The lottery allowed us to isolate the causal effect of insurance on emergency-department visits and care; random assignment through the lottery can be used to study the impact of insurance without the problem of confounding factors that might otherwise differ between insured and uninsured populations.
[378] “2008 Oregon Population Report.” By Risa S. Proehl, George C. Hough, Jr., and Kathryn McGovern. Portland State University, Population Research Center, March 2009. <pdxscholar.library.pdx.edu>
Page 6: “Table 2. Population Estimates of Oregon by Area Type and Specific Metropolitan Areas: 2000 to 2008 … Metropolitan Areas … July 1, 2008 … Portland-Vancouver-Beaverton [=] 2,191,785 … [the next highest is] Eugene-Springfield [=] 345,880.”
[379] Paper: “Effect of Medicaid Coverage on ED Use—Further Evidence from Oregon’s Experiment.” By Sarah L. Taubman and others. New England Journal of Medicine, October 20, 2016. Pages 1505–1507. <www.nejm.org>
Page 1506:
Extending our ED [emergency department] administrative data by a year to span the 2007–2010 period, we analyzed the pattern of the effect of Medicaid coverage on ED use over a 2-year period after the 2008 lottery. … Thus, using another year of ED data, we found no evidence that the increase in ED use due to Medicaid coverage is driven by pent-up demand that dissipates over time; the effect on ED use appears to persist over the first 2 years of coverage.
Page 1507:
For policymakers deliberating about Medicaid expansions, our results, which draw on the strength of a randomized, controlled design, suggest that newly insured people will most likely use more health care across settings—including the ED and the hospital—for at least 2 years and that expanded coverage is unlikely to drive substantial substitution of office visits for ED use.
[380] Report: “The State Children’s Health Insurance Program.” Congressional Budget Office, May 2007. <www.cbo.gov>
Page 1: “The State Children’s Health Insurance Program (SCHIP) was created by the Balanced Budget Act of 1997 (Public Law 105-33), under title XXI of the Social Security Act. The program provides federal funding that states can use to expand health insurance coverage to uninsured children living in families with income that is low but too high to be eligible for Medicaid.”
[381] Public Law 105-33: “Balanced Budget Act of 1997.” 105th Congress. Signed into law by Bill Clinton on August 5, 1997. <www.govinfo.gov>
Title XXI, Section 2101a:
State Children’s Health Insurance Program
(a) Purpose.—The purpose of this title is to provide funds to States to enable them to initiate and expand the provision of child health assistance to uninsured, low-income children in an effective and efficient manner that is coordinated with other sources of health benefits coverage for children.
[382] Report: “Medicaid and the State Children’s Health Insurance Program (CHIP) Provisions in PPACA [Patient Protection and Affordable Care Act]: Summary and Timeline.” By Julie Stone and others. Congressional Research Service, August 19, 2010. <www.everycrsreport.com>
Page 48: “CHIP provides health care coverage to low-income, uninsured children in families with income above Medicaid income standards. States may also extend CHIP coverage to pregnant women when certain conditions are met. In designing their CHIP programs, states may choose to expand Medicaid, create a stand-alone program, or use a combined approach.”
[383] Calculated with data from:
a) Vote 345: “Balanced Budget Act of 1997.” U.S. House of Representatives, July 30, 1997. <clerk.house.gov>
b) Vote 209: “Balanced Budget Act of 1997.” U.S. Senate, July 31, 1997. <www.senate.gov>
|
Party |
Voted “Yes” |
Voted “No” |
Voted “Present” or Did Not Vote † |
|||
|
Number |
Portion |
Number |
Portion |
Number |
Portion |
|
|
Republican |
235 |
84% |
44 |
16% |
3 |
1% |
|
Democrat |
196 |
78% |
55 |
22% |
1 |
0% |
|
Independent |
0 |
0% |
1 |
100% |
0 |
0% |
|
NOTE: † Voting “Present” is effectively the same as not voting. |
||||||
[384] Dataset: “Unduplicated Number of Children Ever Enrolled in CHIP and Medicaid.” U.S. Department of Health & Human Services, Centers for Medicare and Medicaid Services, June 23, 2021. <www.medicaid.gov>
Pages 3–4 (of PDF): “Unduplicated Number of Children Ever-Enrolled in CHIP [Children’s Health Insurance Program] and Medicaid … CHIP FFY [federal fiscal year] 2020 … Totals [=] 9,062,750”
[385] House Resolution 2015 (final text as passed by House and Senate): “Balanced Budget Act of 1997.” Signed into law by Bill Clinton on August 5, 1997 (became Public Law No: 105-33). <www.gpo.gov>
Page 302 (of PDF): “Subtitle J—State Children’s Health Insurance Program … Section 201 (a) Purpose.—The purpose of this title is to provide funds to States to enable them to initiate and expand the provision of child health assistance to uninsured, low-income children in an effective and efficient manner that is coordinated with other sources of health benefits coverage for children.”
Pages 319–320 (of PDF): “Section 2110 (c) Additional Definitions.—For purposes of this title: (1) Child.—The term ‘child’ means an individual under 19 years of age. … (4) Low-Income.—The term ‘low-income child’ means a child whose family income is at or below 200 percent of the poverty line for a family of the size involved.”
[386] Calculated with data from the webpage: “Poverty Guidelines.” U.S. Department of Health & Human Services, Assistant Secretary for Planning and Evaluation, January 12, 2022. <aspe.hhs.gov>
“Persons in family/household [=] 4 … 2022 Poverty Guidelines for the 48 Contiguous States and the District Of Columbia … [=] $27,750 … 2022 Poverty Guidelines for Alaska [=] $34,690 … 2022 Poverty Guidelines for Hawaii [=] $31,920”
CALCULATION: $27,750 × 200% = $55,500
[387] Webpage: “Medicaid, Children’s Health Insurance Program, & Basic Health Program Eligibility Levels.” U.S. Department of Health and Human Services, Centers for Medicare and Medicaid Services. Accessed November 14, 2022 at <www.medicaid.gov>
The following table provides eligibility levels in each state for key coverage groups that use Modified Adjusted Gross Income (MAGI), as of July 1, 2022. The data represent the principal, but not all, MAGI coverage groups in Medicaid, the Children’s Health Insurance Program (CHIP), and the Basic Health Program (BHP). All income standards are expressed as a percentage of the federal poverty level (FPL). The MAGI-based rules generally include adjusting an individual’s income by an amount equivalent to a 5% FPL disregard. Other eligibility criteria also apply, such as citizenship, immigration status, and state residency.
State Medicaid, CHIP and BHP Income Eligibility Standards (For Selected MAGI Groups, based on state decisions as of July 1, 2022) …
Children Separate CHIP2 … Idaho [=] 185% … New York [=] 400% … 2 CHIP covers birth up to age 19 unless otherwise noted in parentheses.
[388] Calculated with data from the webpage: “Poverty Guidelines.” U.S. Department of Health & Human Services, Assistant Secretary for Planning and Evaluation, January 12, 2022. <aspe.hhs.gov>
“Persons in family/household [=] 4 … 2022 Poverty Guidelines for the 48 Contiguous States and the District Of Columbia … [=] $27,750 … 2022 Poverty Guidelines for Alaska [=] $34,690 … 2022 Poverty Guidelines for Hawaii [=] $31,920”
CALCULATIONS:
[389] Report: “Medicaid and CHIP [Children’s Health Insurance Program] Eligibility, Enrollment, and Cost-Sharing Policies as of January 2022: Findings From a 50-State Survey.” By Tricia Brooks and others. Georgetown University Center for Children and Families and Kaiser Family Foundation, March 16, 2022. <files.kff.org>
Pages 33–34:
Table 1. Income Eligibility Limits for Children’s Health Coverage as a Percent of the Federal Poverty Level, January 20221 … State [=] Median4 … Separate CHIP for Uninsured Children Ages 0–183 [=] 255%
1 January 2022 income limits are reported as a percentage of the federal poverty level (FPL). The 2022 FPL for a family of three is $23,030. The reported levels reflect Modified Adjusted Gross Income (MAGI)-converted income standards and include a disregard equal to five percentage points of the FPL applied at the highest income level for Medicaid and separate CHIP coverage. In states without a separate CHIP program, the disregard is added to the highest Medicaid or the CHIP-funded Medicaid expansion limit. In states with a separate CHIP program, the disregard is applied to the highest Medicaid or CHIP-funded Medicaid expansion limit (M-CHIP) as well as to the upper eligibility limit of the separate CHIP program. Because CHIP funding is limited to uninsured children, in states that have a higher eligibility limit for their CHIP-funded Medicaid expansion than regular Medicaid, there may be a small number of children who have another source of coverage that would be eligible for Medicaid when the 5-percentage point disregard is applied, which is not reflected in the table.
3 The states noted use federal CHIP funds to operate separate child health insurance programs for children not eligible for Medicaid. Such programs may either provide benefits similar to Medicaid or a somewhat more limited benefit package. They also may impose premiums or other cost sharing obligations on some or all families with eligible children. Unlike Medicaid, which gives states the option to cover 19 and 20 years as children, CHIP coverage is limited to uninsured children under the age of 19.
4 Medians for children are based on the upper income limit for Medicaid and CHIP combined.
[390] Calculated with data from the webpage: “Poverty Guidelines.” U.S. Department of Health & Human Services, Assistant Secretary for Planning and Evaluation, January 12, 2022. <aspe.hhs.gov>
“Persons in family/household [=] 4 … 2022 Poverty Guidelines for the 48 Contiguous States and the District Of Columbia … [=] $27,750 … 2022 Poverty Guidelines for Alaska [=] $34,690 … 2022 Poverty Guidelines for Hawaii [=] $31,920”
CALCULATION: $27,750 × 255% = $70,763
[391] Webpage: “FAQ: Eligibility & Benefits.” Pennsylvania State Department of Human Services. Accessed November 14, 2022 at <www.dhs.pa.gov>
I live with my boyfriend or girlfriend – Do I have to include their income?
The CHIP [Children’s Health Insurance Program] application requires that you provide information including income for everyone who lives with you and everyone who is expected to be included on your tax return, even if they do not live with you. CHIP has rules that determine who is included and those that are not included when determining eligibility.
My child and I live with my parents – Do I have to include my parent’s income?
Yes, the CHIP application requires that you provide information, including income, for everyone who lives with you as well as everyone who is expected to be included on your tax return even if they do not live with you. CHIP has rules that determine who is included and who is not included when determining eligibility. For example, your parent’s income may be counted when determining eligibility for you and your child if you are claimed as a tax dependent on their tax return.
[392] Pamphlet: “Application for Medical Assistance for Families with Children.” State of Kansas. Revised November 2018. <www.kancare.ks.gov>
Page 2:
About Your Family
Your income and family size help us decide what programs you qualify for. With this information, we can make sure everyone gets the most coverage possible.
Here’s who you need to include on this application:
• Yourself
• Your spouse
• Your children under 21 who live with you
• Your partner who lives with you (but only if you have children together who need medical assistance)
• Anyone you include on your tax return, even if they don’t live with you
• Anyone else under 21 who you take care of and lives with you
[393] “Children’s Health Insurance Program (CHIP): Eligibility and Benefits Handbook.” Pennsylvania State Department of Human Services, April 5, 2017. <www.dhs.pa.gov>
Page 37:
7.3 MAGI [modified adjusted gross income] Non-Tax Filer Household
MAGI non-tax filer household composition includes: the applicant child under age 19, their parents (biological, adoptive or step), their siblings under 19 (biological, adoptive or step), their spouse, if married, and their dependent children under 19 (biological, adoptive or step).
7.3.1 Use Non-Filer Rules for:
• Individuals not expected to file taxes that are not tax dependents
• Tax dependents that do not have an immediate relationship with the tax filer
• Children under the age of 19 living with both parents in the household and the parents are not expected to file taxes together
• Children under the age of 19 who are expected to be claimed as tax dependents by non-custodial parents
Note: Due to the recent allowance of same-sex marriages, contractors must ensure the eligibility determination includes the appropriate parents and their income.
Example 1: John Smith lives with his adopted son, Lucas Smith, and his partner Matthew Williams. Matthew has not adopted Lucas. Only John’s income will count towards the eligibility determination.
[394] “MaineCare Eligibility Guide.” Consumers for Affordable Health Care and Maine Equal Justice, September 9, 2022. <www.mainecahc.org>
Page 38:
What income does not count: (partial list)
• Income from someone living in the same space as the applicant(s) who does not have financial responsibility for the applicant. Those not legally responsible are not financially responsible and their income does not count. These other household members also do not count in figuring family size. These individuals may be eligible for MaineCare in a different category and as a separate household.
[395] Report: “Modern Era Medicaid: Findings of a 50-State Survey of Eligibility, Enrollment, Renewal, and Cost Sharing Practices in Medicaid and CHIP as of January 2015.” By Tricia Brooks and others. Kaiser Commission on Medicaid and the Uninsured, January 20, 2015. <files.kff.org>
Page 3:
The ACA [Affordable Care Act] also changed the method for determining financial eligibility for Medicaid for children, pregnant women, parents, and adults and CHIP [Children’s Health Insurance Program] to a standard based on modified adjusted gross income (MAGI).7 This new approach is intended to prevent gaps in coverage between programs by largely adopting the rules for determining eligibility for subsidies to purchase Marketplace coverage. While these changes went into effect on January 1, 2014, some states continued to refine the conversion of their pre-ACA eligibility levels to MAGI-based standards.
7 The ACA established new standards for determining eligibility based on tax law in order to align coverage across the insurance affordability programs, including Medicaid, CHIP and subsidies in the health insurance marketplaces. MAGI rules establish specific guidelines for counting income and household size, although there are some exceptions in determining Medicaid eligibility only. States can no longer use asset tests in determining eligibility and were required to convert their pre-ACA eligibility levels accounting for the use of income disregards and deductions to the new MAGI standards, which were implemented on January 1, 2014. A standard five-percentage point disregard applies to the upper eligibility limits in determining MAGI-based eligibility.
[396] Final rule: “Medicaid Program; Eligibility Changes Under the Affordable Care Act of 2010.” Federal Register, March 23, 2012. <www.gpo.gov>
Page 17156:
Agency: U.S. Department of Health and Human Services, Centers for Medicare and Medicaid Services …
7. No Resource Test or Income Disregards (§ 435.603(g))
Comment: Many commenters supported the proposal to prohibit consideration of assets in determining financial eligibility for Medicaid and CHIP [Children’s Health Insurance Program]. A few commenters recommended retaining the asset test because eliminating the test entirely could incentivize people with significant assets to stop working and could result in others with significant assets, but minimal income, being enrolled in Medicaid at the taxpayer’s expense.
Response: Section 1902(e)(14)(C) of the Act, as added by section 2002 of the Affordable Care Act, expressly prohibits consideration of assets in determining eligibility for individuals whose financial eligibility is based on MAGI [modified adjusted gross income] methods. We do not have the flexibility to issue regulations to the contrary and are finalizing the regulation at § 435.603(g) as proposed.
[397] Calculated with data from:
a) Dataset: “National Health Expenditures by Type of Service and Source of Funds: Calendar Years 1960 to 2020.” U.S. Department of Health & Human Services, Centers for Medicare and Medicaid Services, December 16, 2021. <www.cms.gov>
b) Dataset: “Table 3. Poverty Status of People, by Age, Race, and Hispanic Origin: 1959 to 2021.” U.S. Census Bureau, August 29, 2022 at <www2.census.gov>
c) Dataset: “CPI—All Urban Consumers (Current Series).” U.S. Department of Labor, Bureau of Labor Statistics. Accessed February 5, 2022 at <www.bls.gov>
“Series Id: CUUR0000SA0; Series Title: All Items in U.S. City Average, All Urban Consumers, Not Seasonally Adjusted; Area: U.S. City Average; Item: All Items; Base Period: 1982–84=100”
NOTE: An Excel file containing the data and calculations is available upon request.
[398] Calculated with data from:
a) Dataset: “National Health Expenditures by Type of Service and Source of Funds: Calendar Years 1960 to 2020.” U.S. Department of Health & Human Services, Centers for Medicare and Medicaid Services, December 16, 2021. <www.cms.gov>
b) Dataset: “CPI—All Urban Consumers (Current Series).” U.S. Department of Labor, Bureau of Labor Statistics. Accessed February 5, 2022 at <www.bls.gov>
“Series Id: CUUR0000SA0; Series Title: All Items in U.S. City Average, All Urban Consumers, Not Seasonally Adjusted; Area: U.S. City Average; Item: All Items; Base Period: 1982–84=100”
c) Report: “CHIPRA [Children’s Health Insurance Program Reauthorization Act of 2009] Mandated Evaluation of the Children’s Health Insurance Program: Final Findings.” Mathematica Policy Research & The Urban Institute, August 1, 2014. <aspe.hhs.gov>
Page 122: “Table B.2. Number of Children Enrolled in CHIP from FFY 1998 Through FFY 2012, by State (Alphabetically Listed)”
d) “Number of Children Ever Enrolled Report, 2012–2020.” U.S. Department of Health & Human Services, Centers for Medicare and Medicaid Services. Accessed September 28, 2021 at <www.medicaid.gov>
e) Webpage: “Reports & Evaluations.” Centers for Medicare & Medicaid Services. Accessed September 28, 2021 at <www.medicaid.gov>
“For the purposes of SEDS [Statistical Enrollment Data System], states report children ‘ever enrolled’ in Medicaid or CHIP. ‘Ever enrolled’ is defined as the enrollment totals for the program in which children were last enrolled in the FY [fiscal year], either separate CHIP, Title XXI-funded Medicaid, or Medicaid. For example, children who began the year in a separate CHIP but transitioned to Medicaid would be reported in the Medicaid enrollment totals.”
NOTE: An Excel file containing the data and calculations is available upon request.
[399] Report: “The State Children’s Health Insurance Program.” Congressional Budget Office, May 2007. <www.cbo.gov>
Page 1: “Under broad federal guidelines, the program grants states flexibility in how they design their programs, including eligibility, benefits, and cost-sharing provisions. (See Box 1 for a comparison with Medicaid.)”
[400] Webpage: “CHIP Financing.” Medicaid and CHIP Payment and Access Commission. Accessed November 14, 2022 at <www.macpac.gov>
Regardless of program design, states’ CHIP [Children’s Health Insurance Program] spending is reimbursed by the federal government at a matching rate higher than Medicaid’s. CHIP’s enhanced federal medical assistance percentage (E-FMAP) varies by state, historically ranging from 65 percent to 81 percent, compared to 50 percent to 73 percent for children in Medicaid. In fiscal years (FYs) 2016 through 2019, the CHIP matching rate is increased by 23 percentage points, ranging from 88 percent to 100 percent. In FY 2020, the matching rate will be increased by 11.5 percent, and in FY 2021 and subsequent years, the matching rate will return to the regular CHIP E-FMAP.
[401] Report: “Medicaid and the State Children’s Health Insurance Program (CHIP) Provisions in PPACA: Summary and Timeline.” By Julie Stone and others. Congressional Research Service, August 19, 2010. <www.everycrsreport.com>
Page 49:
Under P.L. 111-148 [the Patient Protection and Affordable Care Act of 2010, a.k.a. Obamacare], states will receive a 23 percentage point increase in the CHIP match rate (EFMAP) [enhanced federal medical assistance percentage], subject to a cap of 100%, for FY [fiscal year] 2016 through FY2019 (although no CHIP appropriations are provided for those years). The 23 percentage point increase will not apply to certain expenditures.
[402] Webpage: “CHIP Financing.” Medicaid and CHIP Payment and Access Commission. Accessed November 14, 2022 at <www.macpac.gov>
Regardless of program design, states’ CHIP [Children’s Health Insurance Program] spending is reimbursed by the federal government at a matching rate higher than Medicaid’s. CHIP’s enhanced federal medical assistance percentage (E-FMAP) varies by state, historically ranging from 65 percent to 81 percent, compared to 50 percent to 73 percent for children in Medicaid. In fiscal years (FYs) 2016 through 2019, the CHIP matching rate is increased by 23 percentage points, ranging from 88 percent to 100 percent. In FY 2020, the matching rate will be increased by 11.5 percent, and in FY 2021 and subsequent years, the matching rate will return to the regular CHIP E-FMAP.
[403] Report: “Federal Financing for the State Children’s Health Insurance Program (CHIP).” By Alison Mitchell. Congressional Research Service, May 23, 2018. <fas.org>
Page 2 (of PDF):
The federal government’s share of CHIP expenditures (including both services and administration) is determined by the enhanced federal medical assistance percentage (E-FMAP) rate. The E-FMAP varies by state; statutorily, the E-FMAP can range from 65% to 85%. The E-FMAP rate is increased by 23 percentage points for FY2016 through FY2019 and by 11.5 percentage points for FY2020. In FY2021, the E-FMAP is to return to the regular E-FMAP rates.
Page 2:
The ACA [Affordable Care Act] included a provision to increase the E-FMAP rate by 23 percentage points (not to exceed 100%) for most CHIP expenditures from FY [fiscal year] 2016 through FY2019. The continuing resolution enacted on January 22, 2018 (P.L. 115-120) extended the increase to the E-FMAP rate by one year (i.e., through FY2020), but the increase for FY2020 is to be 11.5 percentage points rather than 23 percentage points.
The increase to the E-FMAP does not apply to certain expenditures, such as translation services, CHIP children above 300% of FPL [federal poverty level] (with an exception for certain states), expenditures for administration of citizenship documentation requirements, expenditures for administration of payment error rate measurement, and Medicaid coverage of certain breast or cervical cancer patients.
The 23 percentage point increase changed the statutory range of the E-FMAP rate to between 88% and 100%. In FY2018, 13 states have E-FMAP rates of 100%.
[404] Public Law 116-127: “Families First Coronavirus Response Act.” 116th U.S. Congress. Signed into Law by Donald Trump on March 18, 2020. <www.congress.gov>
Sec. 6008. Temporary Increase of Medicaid FMAP [federal medical assistance percentage].
(a) In General.—Subject to subsection (b), for each calendar quarter occurring during the period beginning on the first day of the emergency period defined in paragraph (1)(B) of section 1135(g) of the Social Security Act (42 U.S.C. 1320b–5(g)) and ending on the last day of the calendar quarter in which the last day of such emergency period occurs, the Federal medical assistance percentage determined for each State, including the District of Columbia, American Samoa, Guam, the Commonwealth of the Northern Mariana Islands, Puerto Rico, and the United States Virgin Islands, under section 1905(b) of the Social Security Act (42 U.S.C. 1396d(b)) shall be increased by 6.2 percentage points.
(b) Requirement for All States.—A State described in subsection (a) may not receive the increase described in such subsection in the Federal medical assistance percentage for such State, with respect to a quarter, if—
(1) eligibility standards, methodologies, or procedures under the State plan of such State under title XIX of the Social Security Act (42 U.S.C. 1396 et seq.) (including any waiver under such title or section 1115 of such Act (42 U.S.C. 1315)) are more restrictive during such quarter than the eligibility standards, methodologies, or procedures, respectively, under such plan (or waiver) as in effect on January 1, 2020;
(2) the amount of any premium imposed by the State pursuant to section 1916 or 1916A of such Act (42 U.S.C. 1396o, 1396o–1) during such quarter, with respect to an individual enrolled under such plan (or waiver), exceeds the amount of such premium as of January 1, 2020;
(3) the State fails to provide that an individual who is enrolled for benefits under such plan (or waiver) as of the date of enactment of this section or enrolls for benefits under such plan (or waiver) during the period beginning on such date of enactment and ending the last day of the month in which the emergency period described in subsection (a) ends shall be treated as eligible for such benefits through the end of the month in which such emergency period ends unless the individual requests a voluntary termination of eligibility or the individual ceases to be a resident of the State; or
(4) the State does not provide coverage under such plan (or waiver), without the imposition of cost sharing, during such quarter for any testing services and treatments for COVID–19, including vaccines, specialized equipment, and therapies.
(c) Requirement for Certain States.—Section 1905(cc) of the Social Security Act (42 U.S.C. 1396d(cc)) is amended by striking the period at the end of the subsection and inserting “and section 6008 of the Families First Coronavirus Response Act, except that in applying such treatments to the increases in the Federal medical assistance percentage under section 6008 of the Families First Coronavirus Response Act, the reference to ‘December 31, 2009’ shall be deemed to be a reference to ‘March 11, 2020’.”.
[405] Dataset: “Exhibit 6. Federal Medical Assistance Percentages and Enhanced FMAPs by State, FYs 2020–2023.” Medicaid and CHIP Payment and Access Commission, August 2022. <www.macpac.gov>
Page 19:
FMAP is federal medical assistance percentage. E-FMAP is enhanced FMAP. FY is fiscal year. … The E-FMAP determines the federal share of both service and administrative costs for CHIP, subject to the availability of funds from a state’s federal allotments for CHIP. …
3 Because the public health emergency period was in effect for all of FY 2021, this exhibit only displays the FY 2021 FMAPs and E-FMAPs with the 6.2 percentage point increase under the FFCRA.
4 At the time of publication, the public health emergency period has not ended. The FY 2023 FMAPs and E-FMAPs will also receive the temporary increase for any quarters during which the public health emergency is still in effect after September 30, 2022. …
6 Because the E-FMAP in Section 2105(b) of the Act is calculated based on the FMAP, the E-FMAP is also higher for states, though not in the same amount, for the duration of the public health emergency period.
NOTE: The E-FMAPs for “FY 2022 (Emergency)” range from 69.34% in Alaska, California, Colorado, Connecticut, Maryland, Massachusetts, Minnesota, New Hampshire, New Jersey, New York, Virginia, Washington, and Wyoming to 89.16% in Mississippi. The U.S. territories’ E-FMAPs for “FY 2022 (Emergency)” are 87.54% in Puerto Rico and 92.44% in the other territories.
[406] Article: “Obama Signs Children’s Health Insurance Bill.” By Robert Pear. New York Times, February 4, 2009. <www.nytimes.com>
In a major change, the bill allows states to cover certain legal immigrants—namely, children under 21 and pregnant women—as well as citizens.
Until now, legal immigrants have generally been barred from Medicaid and the State Children’s Health Insurance Program for five years after they enter the United States. States will now be able to cover those immigrants without the five-year delay.
[407] Calculated with data from:
a) Vote 50: “Children’s Health Insurance Program Reauthorization Act of 2009.” U.S. House of Representatives, February 4, 2009. <clerk.house.gov>
b) Vote 31: “Children’s Health Insurance Program Reauthorization Act of 2009.” U.S. Senate, January 29, 2009. <www.senate.gov>
|
Party |
Voted “Yes” |
Voted “No” |
Voted “Present” or Did Not Vote † |
|||
|
Number |
Portion |
Number |
Portion |
Number |
Portion |
|
|
Republican |
49 |
22% |
165 |
75% |
5 |
2% |
|
Democrat |
306 |
98% |
2 |
1% |
4 |
1% |
|
Independent |
1 |
100% |
0 |
0% |
0 |
0% |
|
NOTE: † Voting “Present” is effectively the same as not voting. |
||||||
[408] Article: “Healthcare Reform Legislation Signed Into Law.” By Jerry Klepner and Briana Nord. Dialysis & Transplantation, June 18, 2010. <onlinelibrary.wiley.com>
[N]egotiations on a final bill were stalled when, on January 19 [2010], Republican Scott Brown was elected to the Massachusetts Senate seat vacated by the death of Senator Edward Kennedy. Brown’s election effectively took away the Senate Democratic leadership’s 60th vote in support of healthcare reform legislation. Without the filibuster-proof 60 votes in the Senate, Democrats would not have been able to overcome the procedural hurdles to passing a final House–Senate compromise bill without Republican votes. …
The White House and House and Senate Democratic leadership agreed on a two-step process in which the House would pass the Senate-approved healthcare reform bill and then vote on a package of changes to the bill negotiated by Democrats in both chambers. Under budget reconciliation, the Senate would be able pass the package of changes with a simple majority vote [i.e., 50 votes instead of 60].
[409] Report: “The Budget Reconciliation Process: The Senate’s ‘Byrd Rule.’ ” By Bill Heniff Jr. Congressional Research Service, September 13, 2010. Updated 9/28/22. <sgp.fas.org>
Pages 18–20:
At the beginning of the 111th Congress, in 2009, President Barack Obama proposed a legislative agenda focusing on health care reform, as well as broad initiatives in education and other policy areas. An immediate point of contention was whether the proposals regarding health care reform should be pursued through the regular legislative process or the expedited procedures available under the reconciliation process. The Democratic leadership in the Senate was concerned, in particular, that passage of the proposals in the Senate could be stymied by a filibuster conducted by Republican opponents. Use of the reconciliation process, with its debate limitations and other expedited features, would ensure that a filibuster could not be employed against the legislation. On the other hand, in such a comprehensive reform proposal, many important provisions might be vulnerable to challenge under the Byrd rule and other enforcement procedures; the resulting legislation might become like “Swiss cheese” if many parliamentary challenges were successful.
Congressional leaders decided to consider health care reform (and education reform) proposals under the regular legislative process, but to include reconciliation directives in the FY [fiscal year] 2010 budget resolution so that reconciliation procedures could be used as a fallback if regular legislative procedures failed. One of the factors influencing the decision was that, at the time, the Democrats held a 60-seat majority in the Senate, exactly the minimum number of votes needed to invoke cloture (i.e., to terminate a filibuster). Title II of the FY2010 budget resolution, S.Con.Res. 13, included reconciliation directives for FY2009–FY2014 to three House and two Senate committees that would accommodate health care and education reform initiatives.39
The House and Senate passed separate versions of health care reform legislation in late 2009 but did not resolve their differences before the session ended. The House passed H.R. 3962 on November 7 by a vote of 220–215. The Senate chose another House-passed bill dealing with unrelated subject matter, H.R. 3590, and transformed it into a health care reform measure; the Senate passed the bill on December 24 by a vote of 60–39. (In addition, the House passed an education reform measure in 2009, H.R. 3221, but the Senate did not.)
In early 2010, the Democratic leadership in the Senate found an altered political situation; a special election held in Massachusetts in January to fill a vacant seat (due to the death of Senator Ted Kennedy) resulted in a changeover to Republican control of the seat, thereby reducing the Democratic majority in the Senate to 59 seats. In assessing how to resolve the House–Senate differences in the health care reform legislation, the Democratic leadership faced a dilemma: the Democrats no longer held the 60-seat majority necessary to thwart a filibuster (and Republican opposition to the measure was unified), and the House could not pass the Senate version without change, thereby sending it to the President, because that version was not acceptable to a majority of House Members.
The solution to the dilemma settled on by the Democratic leadership was for the House to pass the Senate version of health care reform legislation, H.R. 3590, while simultaneously passing a reconciliation measure (referred to colloquially as a “sidecar”) that would amend H.R. 3590 in a manner acceptable to majorities in both chambers. In this manner, comprehensive health care reform legislation could be enacted without concern about challenges under the Byrd rule that could strip away many of its provisions, while the revisions to the measure necessary to accommodate the political agreement could be achieved through an expedited reconciliation process that relied upon a simple majority vote in the Senate rather than a 60-vote supermajority. Education reform provisions would also be included in the reconciliation measure. Compared with the comprehensive health care reform measure, the reconciliation bill was much more narrow in scope and focused on budgetary matters.40
To execute this strategy, the House on March 21, 2010, adopted a special rule reported by the House Rules Committee, H.Res. 1203, by a vote of 224–206. Under the terms of the special rule, the House then concurred in the Senate amendments to H.R. 3590 (thus clearing the bill for the President) by a vote of 219–212. Finally, the House passed H.R. 4872, the reconciliation measure, by a vote of 220–211.
Following the House’s actions on March 21, the Senate considered H.R. 4872 on March 23, 24, and 25, passing the measure on March 25 by a vote of 56–43. Republican opponents of the measure offered a series of amendments and motions to recommit to the bill, all of which were defeated by motions to table or points of order. Nine of the amendments fell when points of order raised under the Byrd rule were sustained (in each instance, after a waiver motion had been rejected). All but one of the points of order were raised on the ground that the amendment included provisions outside the jurisdiction of the instructed committees.41
Toward the end of Senate consideration of the reconciliation measure on March 25, Senator Judd Gregg successfully raised two points of order under the Byrd rule, striking two brief provisions in the education reform portion of the measure dealing with the Pell grant program.42 The provisions were judged to be in violation of the Byrd rule on the ground that they produced no changes in outlays or revenues.
As required under the Byrd rule, the Senate then returned the reconciliation measure (with the two provisions pertaining to the Pell grant program removed) to the House for further action. On March 25, the House agreed to a special rule, H.Res. 1225, providing for the consideration of a motion for the House to concur in the Senate amendment to H.R. 4872. The House agreed to the motion by a vote of 220–207, thus clearing the measure for the President.
President Obama signed H.R. 3590, the Patient Protection and Affordable Care Act, into law on March 23 as P.L. 111-148, and H.R. 4872, the Health Care and Education Reconciliation Act of 2010, into law on March 30 as P.L. 111-152.
[410] Calculated with data from:
a) Vote 165: “Patient Protection and Affordable Care Act.” U.S. House of Representatives, March 21, 2010. <clerk.house.gov>
b) Vote 396: “Patient Protection and Affordable Care Act.” U.S. Senate, December 24, 2009. <www.senate.gov>
|
Party |
Voted “Yes” |
Voted “No” |
Voted “Present” or Did Not Vote † |
|||
|
Number |
Portion |
Number |
Portion |
Number |
Portion |
|
|
Republican |
0 |
0% |
178 |
100% |
1 |
0% |
|
Democrat |
277 |
79% |
73 |
21% |
0 |
0% |
|
Independent |
2 |
100% |
0 |
0% |
0 |
0% |
|
NOTE: † Voting “Present” is effectively the same as not voting. |
||||||
[411] Calculated with data from:
a) Vote 194: “Health Care and Education Reconciliation Act of 2010.” U.S. House of Representatives, March 25, 2010. <clerk.house.gov>
b) Vote 105: “Health Care and Education Reconciliation Act of 2010.” U.S. Senate, March 25, 2010. <www.senate.gov>
|
Party |
Voted “Yes” |
Voted “No” |
Voted “Present” or Did Not Vote † |
|||
|
Number |
Portion |
Number |
Portion |
Number |
Portion |
|
|
Republican |
0 |
0% |
215 |
99% |
3 |
1% |
|
Democrat |
274 |
89% |
35 |
11% |
1 |
0% |
|
Independent |
2 |
100% |
0 |
0% |
0 |
0% |
|
NOTE: † Voting “Present” is effectively the same as not voting. |
||||||
[412] House Resolution 3590: “Patient Protection and Affordable Care Act.” Signed into law by Barack Obama on March 23, 2010 (became Public Law No: 111-148). <www.gpo.gov>
NOTE: This bill contains 906 pages.
[413] House Resolution 4872: “Health Care and Education Reconciliation Act.” Signed into law by Barack Obama on March 30, 2010 (became Public Law No: 111-152). <www.gpo.gov>
NOTE: This bill contains 55 pages.
[414] House Resolution 3590: “Patient Protection and Affordable Care Act.” Signed into law by Barack Obama on March 23, 2010 (became Public Law No: 111-148). <www.gpo.gov>
Page 37 (of PDF):
Title I—Quality, Affordable Health Care for All Americans …
Subtitle C—Quality Health Insurance Coverage for All Americans …
Part I—Health Insurance Market Reforms …
Subpart I—General Reform …
Sec. 2701. Fair health insurance premiums.
(a) Prohibiting Discriminatory Premium Rates.—
(1) In General.—With respect to the premium rate charged by a health insurance issuer for health insurance coverage offered in the individual or small group market—
(A) such rate shall vary with respect to the particular plan or coverage involved only by—
(i) whether such plan or coverage covers an individual or family;
(ii) rating area, as established in accordance with paragraph (2);
(iii) age, except that such rate shall not vary by more than 3 to 1 for adults (consistent with section 2707(c)); and
(iv) tobacco use, except that such rate shall not vary by more than 1.5 to 1; and
(B) such rate shall not vary with respect to the particular plan or coverage involved by any other factor not described in subparagraph (A).
(2) Rating Area.—
(A) In General.—Each State shall establish 1 or more rating areas within that State for purposes of applying the requirements of this title.
(B) Secretarial Review.—The Secretary shall review the rating areas established by each State under subparagraph (A) to ensure the adequacy of such areas for purposes of carrying out the requirements of this title. If the Secretary determines a State’s rating areas are not adequate, or that a State does not establish such areas, the Secretary may establish rating areas for that State.
Pages 13–14 (of PDF):
Title I—Quality, Affordable Health Care for All Americans …
Subtitle A—Immediate Improvements in Health Care Coverage for All Americans …
Part a—Individual and Group Market Reforms …
Subpart Ii—Improving Coverage …
Sec. 2713. Coverage of Preventive Health Services.
(a) In General.—A group health plan and a health insurance issuer offering group or individual health insurance coverage shall, at a minimum provide coverage for and shall not impose any cost sharing requirements for—
(1) evidence-based items or services that have in effect a rating of ‘A’ or ‘B’ in the current recommendations of the United States Preventive Services Task Force;
(2) immunizations that have in effect a recommendation from the Advisory Committee on Immunization Practices of the Centers for Disease Control and Prevention with respect to the individual involved; and
(3) with respect to infants, children, and adolescents, evidence-informed preventive care and screenings provided for in the comprehensive guidelines supported by the Health Resources and Services Administration.
(4) with respect to women, such additional preventive care and screenings not described in paragraph (1) as provided for in comprehensive guidelines supported by the Health Resources and Services Administration for purposes of this paragraph.
(5) for the purposes of this Act, and for the purposes of any other provision of law, the current recommendations of the United States Preventive Service Task Force regarding breast cancer screening, mammography, and prevention shall be considered the most current other than those issued in or around November 2009.
[415] Report: “Private Health Insurance Provisions in PPACA [Patient Protection and Affordable Care Act] (P.L. 111-148).” By Hinda Chaikind and others. Congressional Research Service, April 15, 2010. <www.everycrsreport.com>
Page 35:
Effective for plan years beginning on or after six months after enactment, a group health plan, a grandfathered plan, and a health insurance issuer offering coverage in the group or individual markets that provided dependent coverage must extend that coverage to adult children until the individual is 26 years of age.113 This will not apply to a child of the child receiving dependent coverage. For group plans that are grandfathered, the coverage is limited to those adult children that do not have an offer of coverage from an employer.114
[416] Report: “Prescription for Change ‘Filled’: Tax Provisions in the Patient Protection and Affordable Care Act, Updated to Reflect Changes Approved in the Reconciliation Act of 2010.” By Clint Stretch and others. Deloitte, March 30, 2010. <www2.deloitte.com>
Page 24:
The Act imposes several other requirements affecting employer plans. Some are effective for plan years beginning six months after enactment (January 1, 2011, for calendar year plans), while others are not effective until 2014. The provisions with the earlier effective date include a prohibition against lifetime or unreasonable annual limits, a requirement to cover preventive services and immunizations without any cost sharing, and a requirement that all plans offering dependent coverage allow unmarried children to remain covered under a parent’s plan through age 26. Beginning in 2014 … all annual limits will be prohibited….
[417] House Resolution 3590: “Patient Protection and Affordable Care Act.” Signed into law by Barack Obama on March 23, 2010 (became Public Law No: 111-148). <www.gpo.gov>
Pages 36, 43 (of PDF):
Title I—Quality, Affordable Health Care for All Americans …
Subtitle C—Quality Health Insurance Coverage for All Americans …
Part I—Health Insurance Market Reforms …
Subpart I—General Reform …
Sec. 2704. Prohibition of preexisting condition exclusions or other discrimination based on health status.
(a) In General.—A group health plan and a health insurance issuer offering group or individual health insurance coverage may not impose any preexisting condition exclusion with respect to such plan or coverage. …
Sec. 2708. Prohibition on Excessive Waiting Periods. A group health plan and a health insurance issuer offering group or individual health insurance coverage shall not apply any waiting period (as defined in section 2704(b)(4)) that exceeds 90 days.
[418] Report: “Private Health Insurance Provisions in PPACA [Patient Protection and Affordable Care Act] (P.L. 111-148).” By Hinda Chaikind and others. Congressional Research Service, April 15, 2010. <www.everycrsreport.com>
Page 3: “Immediate Individual and Group Market Reforms … providing coverage for preexisting health conditions for enrollees under age 19….”
Pages 11–12:
The law will apply new federal health insurance standards to group health plans as well as health insurance coverage offered in the individual, small group, and large group markets (depending on the standard), effective for plan years beginning on or after January 1, 2014. Among the insurance reforms are provisions that will subject new plans to the following requirements: …
• Prohibit group health plans (new and grandfathered) and issuers in the individual and group markets from excluding coverage for preexisting health conditions.34 (A “preexisting health condition” is a medical condition that was present before the date of enrollment for health coverage, whether or not any medical advice, diagnosis, care, or treatment was recommended or received before such date. Excluding coverage for preexisting conditions refers to the case in which an applicant for coverage is offered a health insurance policy but that policy does not provide benefits for certain medical conditions.)
• Prohibit group health plans and issuers in the individual and group markets from basing eligibility for coverage on health status-related factors.35 (Such factors include health status, medical condition (including both physical and mental illness), claims experience, receipt of health care, medical history, genetic information, evidence of insurability (including conditions arising out of acts of domestic violence), disability, and any other health status-related factor determined appropriate by the Secretary). …
• Prohibit group health plans and issuers in the group market (new and grandfathered) from imposing a waiting period greater than 90 days.37 (A “waiting period” refers to the time period that must pass before an individual is eligible to use health benefits.)
• Require individual and group health insurance issuers to offer coverage on a guaranteed issue and guaranteed renewal basis.38 (“Guaranteed issue” in health insurance is the requirement that an issuer accept every applicant for health coverage. “Guaranteed renewal” in health insurance is the requirement on an issuer to renew group coverage at the option of the plan sponsor [for example, employer] or individual coverage at the option of the enrollee. Guaranteed issue and renewal alone would not guarantee that the insurance offered is affordable.)
• Require issuers in the individual and small group markets to determine premiums for such coverage using adjusted community rating rules.39 (“Adjusted, or modified, community rating” prohibits issuers from pricing health insurance policies based on health factors, but allows it for other key characteristics such as age or gender.) Under the law, premiums will vary based only on the following risk factors: self-only or family enrollment; rating area,40 as specified by the state; age (by no more than a 3:1 ratio across age rating bands established by the Secretary, in consultation with the National Association of Insurance Commissioners (NAIC)), and tobacco use (by no more than 1.5:1 ratio).
[419] Book: Economics for Dummies (2nd edition). By Sean Flynn (PhD., Assistant Professor of Economics, Scripps College). Wiley, 2011.
Page 223:
People who already have medical problems have preexisting conditions. Health insurance has difficulty coping with preexisting conditions due to adverse selection, which occurs when insurance is disproportionately purchased by those who are more likely to need costly reimbursements in the future. Adverse selection can drive up insurance rates and even kill off an insurance market altogether. (For details on adverse selection in auto insurance markets, see Chapter 11.)
To see how adverse selection wreaks havoc on health insurance markets, suppose an insurance company offers health insurance to a large group of people—say, the population of Massachusetts. For those with preexisting conditions, purchasing insurance is a no-brainer, because they’re certain that their future healthcare bills will be larger than their insurance premiums. But the money to pay for their future medical bills has to come from somewhere. With all the sick people purchasing insurance, the insurance company knows that future treatment costs will be high. The only way to cover those costs is to charge high premiums, getting enough money out of those without preexisting conditions to pay the expected costs.
Those without preexisting conditions will react the same way people react to higher prices when considering any good or service: Some will stop buying the product. Their dropping out of the insurance market makes things even worse for the insurance company, because it’ll be forced to raise premiums even higher. But by raising insurance premiums, even more healthy people will choose not to purchase health insurance, and premiums will go up again.
[420] Book: Accounting Fundamentals for Health Care Management (3rd edition). By Steven A. Finkler, Thad Calabrese, and David M. Ward. Jones & Bartlett Learning, 2019.
Page 26:
Why does the law [2010 Affordable Care Act] have penalties for those who do not purchase health insurance? Part of the law eliminates the ability of insurance companies to not cover services for preexisting medical conditions. Preexisting conditions would have to be covered by insurers, and the health insurance premium would be required by law to be the same for someone with such a condition as for someone without that condition. This is a great benefit to people who have long-term illnesses and attempt to get insurance coverage. However, unless there is a requirement or strong incentive for everyone to have health insurance, many people are likely to only buy health insurance when and if they become ill, and the illness would be covered. If many people went that route, then insurance would become prohibitively expensive. In other words, healthier populations (referred to as “young invincibles” in policy debates) are needed in the insured pool; these individuals pay for health insurance but are less likely to utilize services than those with long-term health concerns. Because insurance premiums do not differentiate between these two types of insured individuals, the healthier population pays higher premiums that effectively subsidize the sicker population that pays lower premiums. Imagine if no one purchased fire insurance until his or her house caught on fire. Insurance works by spreading risk across a large population, some of whom incur a loss, and most of whom don’t. Fire insurance works because many people pay small premiums (i.e., small compared to the cost of rebuilding their house if it burns down) and only a few houses actually burn down. All homeowners share the risk of a loss due to fire. If the only people who bought fire insurance were the ones who had fires, then the annual premium would cost as much or more than the cost of the house. No one could afford insurance under such conditions.
This means that if individuals are covered for preexisting conditions but don’t have to buy insurance until they get sick, premiums for everyone could rise so high as to make it nearly impossible for anyone to afford health insurance.
[421] Working paper: “The Effect of State Community Rating Regulations on Premiums and Coverage in the Individual Health Insurance Market.” By Bradley Herring and Mark V. Pauley. U.S. Department of Health and Human Services, August 2006. <aspe.hhs.gov>
Page 9:
The log of condition-related expense is also statistically significant in both data sets, implying that families with the presence of high-risk chronic conditions do appear to pay, on average, higher premiums in the individual market. However, the economic magnitude of this effect is modest, implying that there is a high level of pooling. Families with health conditions that are twice as expensive to treat pay premiums that are only 11.5–15.5 percent higher than average. If insurers knew or could have known about the chronic condition and its effect on expected expense, this result implies that, somehow, those with chronic conditions that make them twice as expensive as average spread 85 percent or more of that risk to premiums paid by others.
[422] Article: “New York Offers Costly Lessons on Insurance.” By Anemona Hartocollis. New York Times, April 17, 2010. <www.nytimes.com>
In 1993, motivated by stories of suffering AIDS patients, the state became one of the first to require insurers to extend individual or small group coverage to anyone with pre-existing illnesses. …
Healthy people, in effect, began to subsidize people who needed more health care. The healthier customers soon discovered that the high premiums were not worth it and dropped out of the plans. The pool of insured people shrank to the point where many of them had high health care needs. Without healthier people to spread the risk, their premiums skyrocketed, a phenomenon known in the trade as the “adverse selection death spiral.” …
At the same time, New York has the highest average annual premiums for individual policies: $6,630 for single people and $13,296 for families in mid-2009, more than double the nationwide average, according to America’s Health Insurance Plans, an industry group.
[423] Report: “Newly Enrolled Members in the Individual Health Insurance Market After Health Care Reform: The Experience From 2014 and 2015.” Blue Cross and Blue Shield Association, March 20, 2016. <www.bcbs.com>
Page 2:
Comparing the health status and use of medical services among those who enrolled in individual coverage before and after the ACA [Affordable Care Act] took effect, as well as those with employer-based health insurance, the study finds that:
• Members who newly enrolled in BCBS [Blue Cross Blue Shield] individual health plans in 2014 and 2015 have higher rates of certain diseases such as hypertension, diabetes, depression, coronary artery disease, human immunodeficiency virus (HIV) and Hepatitis C than individuals who already had BCBS individual coverage.
• Consumers who newly enrolled in BCBS individual health plans in 2014 and 2015 received significantly more medical services in their first year of coverage, on average, than those with BCBS individual plans prior to 2014 who maintained BCBS individual health coverage into 2015, as well as those with BCBS employer-based group health coverage.
• The new enrollees used more medical services across all sites of care—including inpatient hospital admissions, outpatient visits, medical professional services, prescriptions filled and emergency room visits.
Page 3:
Percentage Difference in 2015 Prevalence of Select Conditions Between Individuals Who Enrolled Prior to 2014 Versus Newly Enrolled in 2014 and 2015 (Based on the first nine months of 2015 medical claims data)
Hypertension 24%
Diabetes 94%
Depression 52%
Coronary Artery Disease 32%
Hepatitis C 140%
HIV 242%
[424] Public Law 115-97: “Tax Cuts and Jobs Act.” 115th U.S. Congress. Signed into law by Donald Trump on December 22, 2017. Accessed January 20, 2018 at <www.congress.gov>
Page 40 (of PDF):
Part VIII—Individual Mandate
Sec. 11081. Elimination of Shared Responsibility Payment for Individuals Failing to Maintain Minimum Essential Coverage.
(a) In General.—Section 5000A(c) is amended—
(1) in paragraph (2)(B)(iii), by striking “2.5 percent” and inserting “Zero percent”, and
(2) in paragraph (3)—
(A) by striking “$695” in subparagraph (A) and inserting “$0”, and
(B) by striking subparagraph (D).
(b) Effective Date.—The amendments made by this section shall apply to months beginning after December 31, 2018.
[425] Calculated with data from the report: “The Individual Mandate for Health Insurance Coverage: In Brief.” By Ryan J. Rosso. Congressional Research Service. Updated August 25, 2020. <sgp.fas.org>
Pages 2–3:
The penalty for noncompliance is calculated as the greater of either
• a percentage of applicable income, defined as the amount by which an individual’s household income5 exceeds the applicable tax filing threshold for the tax year;6 or
• a yearly flat dollar amount assessed on each taxpayer and any dependents.7 The total dollar amount assessed on a taxpayer (for themselves and any dependents) is capped at 300% of the annual flat dollar amount. For example, in 2018, the annual dollar amount penalty for a taxpayer and three dependents (all of whom were without coverage for the entire year) was limited to three times $695, or $2,085. …
An individual’s annual penalty payment is equal to one-twelfth of either the percentage of income or the flat dollar amount, multiplied by the number of months not in compliance. Each total monthly penalty is also capped. The monthly penalty for a taxpayer and his or her dependents cannot be more than the cost of the national average premium for bronze-level health plans offered through health insurance exchanges (for the relevant family size).8 For 2018, the average premium was $283 per individual per month.9 If a taxpayer was liable to pay a penalty for more than one individual, the monthly individual amount ($283) was multiplied by the number of individuals subject to a penalty, up to a maximum of five individuals. So, for 2018, the maximum cap was $283 per month for a single taxpayer, $849 per month for a taxpayer who was liable for penalties for three individuals, and $1,415 per month for a taxpayer who was liable for penalties for five or more individuals.
CALCULATIONS:
[426] Webpage: “Individual Shared Responsibility Provision—Reporting and Calculating the Payment.” Internal Revenue Service. Last updated September 12, 2022. <www.irs.gov>
For Tax Year 2019 and 2020 Returns
Under the Tax Cuts and Jobs Act, the amount of the individual shared responsibility payment is reduced to zero for months beginning after December 31, 2018 …
For Tax Year 2018 and Prior Returns
Under the Tax Cuts and Jobs Act, taxpayers must continue to report coverage, qualify for an exemption, or make an individual shared responsibility payment for tax years 2017 and 2018. …
The annual payment amount is either a percentage of your household income in excess of the return filing threshold or a flat dollar amount, whichever is greater. …
Years 2016–2018 … Percentage amount [=] 2.5% of income above filing threshold … Flat dollar amount [=] $695 per adult … $347.50 per child … Family maximum: $2,085
[427] Report: “Private Health Insurance Provisions in PPACA [Patient Protection and Affordable Care Act] (P.L. 111-148).” By Hinda Chaikind and others. Congressional Research Service, April 15, 2010. <www.everycrsreport.com>
Page 6: “Beginning in 2014, PPACA [the Patient Protection and Affordable Care Act] includes a mandate for most individuals to have health insurance,9 or potentially pay a penalty for noncompliance.10 Individuals will be required to maintain minimum essential coverage for themselves and their dependents. Those who do not meet the mandate will be required to pay a penalty for each month of noncompliance.”
[428] Report: “Estimated Financial Effects of the ‘Patient Protection and Affordable Care Act,’ as Amended.” By Richard S. Foster. U.S. Department of Health & Human Services, Centers for Medicare and Medicaid Services, Office of the Actuary, April 22, 2010. <www.cms.gov>
Page 6: “The penalty amounts for noncovered individuals will be indexed over time by the CPI [Consumer Price Index] (or, in certain instances, by growth in income) and would normally increase more slowly than health care costs.”
Page 8:
For the estimated 23 million people who would remain uninsured in 2019, roughly 5 million are undocumented aliens who would be ineligible for Medicaid or the Exchange coverage subsidies under the health reform legislation. The balance of 18 million would choose not to be insured and to pay the penalty (if applicable) associated with the individual mandate. For the most part, these would be individuals with relatively low health care expenses for whom the individual or family insurance premium would be significantly in excess of any penalty and their anticipated health benefit value. In other instances, as happens currently, some people would not enroll in their employer plans or take advantage of the Exchange opportunities even though it would be in their best financial interest to do so.
[429] Report: “The Cost of the Individual Mandate Penalty for the Remaining Uninsured.” By Matthew Rae and others. Kaiser Family Foundation, December 9, 2015. <files.kff.org>
Pages 1–2:
Some individuals are exempt from the penalty, including undocumented immigrants, those whose incomes are so low that they are not required to file taxes, people with incomes below 138% of poverty in the “Medicaid gap” in states that have not expanded eligibility for Medicaid under the ACA [Affordable Care Act], people who have to pay more than 8.13% of household income for insurance (taking into account any employer contributions or subsidies) and certain individuals who have membership in certain groups or face a particular hardship.
For those who are uninsured and do not meet one of the exemptions, the penalty for 2016 is calculated as the greater of two amounts:
1. A flat dollar amount equal to $695 per adult plus $347.50 per child, up to a maximum of $2,085 for the family.
2. 2.5% of family income in excess of the 2015 income tax filing thresholds ($10,300 for a single person and $20,600 for a family).
The penalty can be no more than the national average premium for a bronze plan (the minimum coverage available in the individual insurance market under the ACA), which was $2,484 in 2015 for single coverage and $12,420 for a family of three or more children.
Page 3:
Among individuals who were uninsured in early 2015 and eligible to enroll in the marketplace, the average household penalty in 2016 is $969. This is up 47% from the average estimated penalty this year of $661. Those who are eligible for premium subsidies will face an average household penalty of $738 in 2016, while the average household penalty totals $1,450 for uninsured individuals not eligible for any financial assistance.
[430] Public Law 111-148: “Patient Protection and Affordable Care Act.” 111th U.S. Congress. Signed into law by Barack Obama on March 23, 2010. <www.congress.gov>
Title I, Subtitle F, Part I, Chapter 48, Section 5000A:
(d) Applicable individual.—For purposes of this section—
(1) In general.—The term “applicable individual” means, with respect to any month, an individual other than an individual described in paragraph (2), (3), or (4).
(2) Religious exemptions.—
(A) Religious conscience exemption.—Such term shall not include any individual for any month if such individual has in effect an exemption under section 1311(d)(4)(H) of the Patient Protection and Affordable Care Act which certifies that such individual is a member of a recognized religious sect or division thereof described in section 1402(g)(1) and an adherent of established tenets or teachings of such sect or division as described in such section.
(B) Health care sharing ministry—
(i) In general.—Such term shall not include any individual for any month if such individual is a member of a health care sharing ministry for the month.
(ii) Health care sharing ministry.—The term “health care sharing ministry” means an organization—
(I) which is described in section 501(c)(3) and is exempt from taxation under section 501(a),
(II) members of which share a common set of ethical or religious beliefs and share medical expenses among members in accordance with those beliefs and without regard to the State in which a member resides or is employed,
(III) members of which retain membership even after they develop a medical condition,
(IV) which (or a predecessor of which) has been in existence at all times since December 31, 1999, and medical expenses of its members have been shared continuously and without interruption since at least December 31, 1999, and
(V) which conducts an annual audit which is performed by an independent certified public accounting firm in accordance with generally accepted accounting principles and which is made available to the public upon request.
(3) Individuals not lawfully present.—Such term shall not include an individual for any month if for the month the individual is not a citizen or national of the United States or an alien lawfully present in the United States.
(4) Incarcerated individuals.—Such term shall not include an individual for any month if for the month the individual is incarcerated, other than incarceration pending the disposition of charges.
(e) Exemptions.—No penalty shall be imposed under subsection (a) with respect to—
(1) Individuals who cannot afford coverage.—
(A) In general—Any applicable individual for any month if the applicable individual’s required contribution (determined on an annual basis) for coverage for the month exceeds 8 percent of such individual’s household income for the taxable year described in section 1412(b)(1)(B) of the Patient Protection and Affordable Care Act. For purposes of applying this subparagraph, the taxpayer’s household income shall be increased by any exclusion from gross income for any portion of the required contribution made through a salary reduction arrangement.
(B) Required Contribution—For purposes of this paragraph, the term “required contribution” means—
(i) in the case of an individual eligible to purchase minimum essential coverage consisting of coverage through an eligible-employer-sponsored plan, the portion of the annual premium which would be paid by the individual (without regard to whether paid through salary reduction or otherwise) for self-only coverage, or
(ii) in the case of an individual eligible only to purchase minimum essential coverage described in subsection (f)(1)(C), the annual premium for the lowest cost bronze plan available in the individual market through the Exchange in the State in the rating area in which the individual resides (without regard to whether the individual purchased a qualified health plan through the Exchange), reduced by the amount of the credit allowable under section 36B for the taxable year (determined as if the individual was covered by a qualified health plan offered through the Exchange for the entire taxable year).
(C) Special rules for individuals related to employees.—For purposes of subparagraph (B)(i), if an applicable individual is eligible for minimum essential coverage through an employer by reason of a relationship to an employee, the determination shall be made by reference to the affordability of the coverage to the employee.
(D) Indexing.—In the case of plan years beginning in any calendar year after 2014, subparagraph (A) shall be applied by substituting for “8 percent” the percentage the Secretary of Health and Human Services determines reflects the excess of the rate of premium growth between the preceding calendar year and 2013 over the rate of income growth for such period.
(2) Taxpayers with income Under 100 Percent of Poverty Line.—Any applicable individual for any month during a calendar year if the individual’s household income for the taxable year described in section 1412(b)(1)(B) of the Patient Protection and Affordable Care Act is less than 100 percent of the poverty line for the size of the family involved (determined in the same manner as under subsection (b)(4)).
(3) Members of Indian tribes.—Any applicable individual for any month during which the individual is a member of an Indian tribe (as defined in section 45A(c)(6)).
[431] Some examples of healthcare sharing ministries include:
[432] Report: “Projected Medicare Expenditures Under an Illustrative Scenario with Alternative Payment Updates to Medicare Providers.” By John D. Shatto and M. Kent Clemens. United States Department of Health and Human Services, Centers for Medicare and Medicaid Services, Office of the Actuary, June 2, 2022. <www.cms.gov>
Page 5:
For inpatient hospital services, Medicare payment rates in 2011 were about 68 percent, and Medicaid payment rates were about 71 percent, of private health insurance payment rates (including Medicaid disproportionate share hospital, or DSH, payments).10 As shown in figure 1, Medicare and Medicaid payment rates fell to roughly 60 percent and 62 percent, respectively, of private health insurance rates in 2019, in part due to the productivity adjustments that started in 2012. Payment rates for the two programs decline in tandem over the next 75 years (because of the UPLs [upper payment limits]), and, by the end of the long-range projection period [2097], Medicare and Medicaid payment rates for inpatient hospital services would each represent roughly 40 percent of the average level for private health insurance.
[433] “2011 Annual Report of the Board of Trustees of the Federal Hospital Insurance and Federal Supplementary Medical Insurance Trust Funds.” United States Department of Health and Human Services, Centers for Medicare and Medicaid Services, May 13, 2011. <www.cms.gov>
Pages 265–266:
Statement of Actuarial Opinion …
While the Part B projections in this report are reasonable in their portrayal of future costs under current law, they are not reasonable as an indication of actual future costs. …
Further, while the Affordable Care Act makes important changes to the Medicare program and substantially improves its financial outlook, there is a strong likelihood that certain of these changes will not be viable in the long range. Specifically, the annual price updates for most categories of non-physician health services will be adjusted downward each year by the growth in economy-wide productivity. The best available evidence indicates that most health care providers cannot improve their productivity to this degree—or even approach such a level—as a result of the labor-intensive nature of these services.
Without major changes in health care delivery systems, the prices paid by Medicare for health services are very likely to fall increasingly short of the costs of providing these services. By the end of the long-range projection period, Medicare prices for hospital, skilled nursing facility, home health, hospice, ambulatory surgical center, diagnostic laboratory, and many other services would be less than half of their level under the prior law. Medicare prices would be considerably below the current relative level of Medicaid prices, which have already led to access problems for Medicaid enrollees, and far below the levels paid by private health insurance. Well before that point, Congress would have to intervene to prevent the withdrawal of providers from the Medicare market and the severe problems with beneficiary access to care that would result. Overriding the productivity adjustments, as Congress has done repeatedly in the case of physician payment rates, would lead to far higher costs for Medicare in the long range than those projected under current law.
[434] Calculated with data from the webpage: “Poverty Guidelines.” U.S. Department of Health & Human Services, Assistant Secretary for Planning and Evaluation, January 12, 2022. <aspe.hhs.gov>
“Persons in family/household [=] 4 … 2022 Poverty Guidelines for the 48 Contiguous States and the District Of Columbia … [=] $27,750 … 2022 Poverty Guidelines for Alaska [=] $34,690 … 2022 Poverty Guidelines for Hawaii [=] $31,920”
CALCULATION: $27,750 × 138% = $38,295
[435] “2010 Actuarial Report on the Financial Outlook for Medicaid.” By Christopher J. Truffer and others. U.S. Department of Health & Human Services, Centers for Medicare and Medicaid Services, Office of the Actuary, December 21, 2010. <www.cms.gov>
Page 2:
Beginning in 2014, the Affordable Care Act expands Medicaid eligibility to all individuals under age 65 in families with income below 138 percent of the Federal Poverty Level (FPL).2 …
2 … The Affordable Care Act technically specifies an upper income threshold of 133 percent of the FPL but also allows a 5-percent income disregard, making the effective threshold 138 percent.
Page 28:
The effective participation rate of persons who would have been uninsured for a full year, but are newly eligible for Medicaid as a result of the Affordable Care Act, is assumed to be 97 percent. This assumed participation rate is significantly higher than actual Medicaid participation rates to date and is based on the anticipated impacts of sections of the Affordable Care Act intended to make the process of enrolling easier. In particular, the legislation establishes State or federally operated health insurance exchanges that, among other responsibilities, will facilitate the determination of individuals’ and families’ eligibility for Federal financial assistance for health insurance, either through Medicaid or through the Federal premium and cost-sharing subsidies for private health insurance plans. The exchanges are assumed to perform this role effectively and, for those found to qualify for Medicaid, to assist the application and enrollment process. In this role, the exchanges would also serve as a valuable new resource for health providers who seek assistance in enrolling eligible persons in Medicaid. In addition, we anticipate that the more widespread availability of financial assistance under the Affordable Care Act (for individuals and families with incomes up to 400 percent of FPL) will reduce any stigma associated with receipt of such assistance through Medicaid.
Page iv:
The most significant change to Medicaid is the expansion of Medicaid eligibility beginning in 2014. This expansion, together with greater participation by individuals eligible under current rules, is projected to add 11.6 million people to enrollment in FY [fiscal year] 2014 and almost 20 million people by FY 2019, 21 percent and 34 percent, respectively, compared to pre-Affordable Care Act estimates. These increases reflect both the greater proportion of the population that will be eligible for Medicaid and an assumption that the new State health insurance exchanges will be very effective in assisting enrollment in Medicaid. Of the new enrollees … about 78 percent are projected to be eligible only under the new rules beginning in 2014.
[436] Public Law 111-148: “Patient Protection and Affordable Care Act.” 111th U.S. Congress. Signed into law by Barack Obama on March 23, 2010. <www.congress.gov>
Title II, Subtitle A, Section 2002:
Subtitle A—Improved Access to Medicaid …
Sec. 2002. Income Eligibility for Nonelderly Determined Using Modified Gross Income. …
(C) No Assets Test.—A State shall not apply any assets or resources test for purposes of determining eligibility for medical assistance under the State plan or under a waiver of the plan.
[437] Ruling: National Federation of Independent Business v. Sebelius. U.S. Supreme Court, June 28, 2012. <www.law.cornell.edu>
Partly decided 7–2: Majority: Alito, Breyer, Kagan, Kennedy, Roberts, Scalia, Thomas. Dissenting: Ginsburg, Sotomayor.
Partly decided 5–4: Majority: Breyer, Ginsburg, Kagan, Roberts, Sotomayor. Dissenting: Alito, Kennedy, Scalia, Thomas.
Pages 4–6:
5. Chief Justice Roberts, joined by Justice Breyer and Justice Kagan, concluded in Part IV that the Medicaid expansion violates the Constitution by threatening States with the loss of their existing Medicaid funding if they decline to comply with the expansion. …
(a) The Spending Clause grants Congress the power “to pay the Debts and provide for the … general Welfare of the United States.” … Congress may use this power to establish cooperative state-federal Spending Clause programs. The legitimacy of Spending Clause legislation, however, depends on whether a State voluntarily and knowingly accepts the terms of such programs. … “[T]he Constitution simply does not give Congress the authority to require the States to regulate.” … When Congress threatens to terminate other grants as a means of pressuring the States to accept a Spending Clause program, the legislation runs counter to this Nation’s system of federalism. …
(b) Section 1396c gives the Secretary of Health and Human Services the authority to penalize States that choose not to participate in the Medicaid expansion by taking away their existing Medicaid funding. … The threatened loss of over 10 percent of a State’s overall budget is economic dragooning that leaves the States with no real option but to acquiesce in the Medicaid expansion. The Government claims that the expansion is properly viewed as only a modification of the existing program, and that this modification is permissible because Congress reserved the “right to alter, amend, or repeal any provision” of Medicaid. … But the expansion accomplishes a shift in kind, not merely degree. The original program was designed to cover medical services for particular categories of vulnerable individuals. Under the Affordable Care Act, Medicaid is transformed into a program to meet the health care needs of the entire nonelderly population with income below 133 percent of the poverty level. A State could hardly anticipate that Congress’s reservation of the right to “alter” or “amend” the Medicaid program included the power to transform it so dramatically. The Medicaid expansion thus violates the Constitution by threatening States with the loss of their existing Medicaid funding if they decline to comply with the expansion. …
(c) The constitutional violation is fully remedied by precluding the Secretary from applying §1396c to withdraw existing Medicaid funds for failure to comply with the requirements set out in the expansion. … The other provisions of the Affordable Care Act are not affected. Congress would have wanted the rest of the Act to stand, had it known that States would have a genuine choice whether to participate in the Medicaid expansion. …
6. Justice Ginsburg, joined by Justice Sotomayor, is of the view that the Spending Clause does not preclude the Secretary from withholding Medicaid funds based on a State’s refusal to comply with the expanded Medicaid program. But given the majority view, she agrees with The Chief Justice’s conclusion in Part IV–B that the Medicaid Act’s severability clause … determines the appropriate remedy. Because The Chief Justice finds the withholding—not the granting—of federal funds incompatible with the Spending Clause, Congress’ extension of Medicaid remains available to any State that affirms its willingness to participate. Even absent §1303’s command, the Court would have no warrant to invalidate the funding offered by the Medicaid expansion, and surely no basis to tear down the ACA [Affordable Care Act] in its entirety. When a court confronts an unconstitutional statute, its endeavor must be to conserve, not destroy, the legislation. …
Roberts, C. J., announced the judgment of the Court and delivered the opinion of the Court with respect to Parts I, II, and III–C, in which Ginsburg, Breyer, Sotomayor, and Kagan, JJ., joined; an opinion with respect to Part IV, in which Breyer and Kagan, JJ., joined; and an opinion with respect to Parts III–A, III–B, and III–D. Ginsburg, J., filed an opinion concurring in part, concurring in the judgment in part, and dissenting in part, in which Sotomayor, J., joined, and in which Breyer and Kagan, JJ., joined as to Parts I, II, III, and IV. Scalia, Kennedy, Thomas, and Alito, JJ., filed a dissenting opinion. Thomas, J., filed a dissenting opinion.
[438] Report: “Medicaid and CHIP [Children’s Health Insurance Program] Eligibility, Enrollment, and Cost-Sharing Policies as of January 2022: Findings From a 50-State Survey.” By Tricia Brooks and others. Georgetown University Center for Children and Families and Kaiser Family Foundation, March 16, 2022. <files.kff.org>
Pages 22–24:
As of January 2022, Medicaid and CHIP eligibility were stable as the public health emergency protections remained in effect for the entirety of 2021. To provide economic relief to the states and promote stability of coverage during the COVID-19 pandemic, the FFCRA provides a 6.2 percentage point increase in the federal share (FMAP) of certain Medicaid spending if states meet MOE requirements. The MOE provisions prohibit states from reducing eligibility levels, implementing stricter enrollment procedures, or increasing premiums beyond policies in place as of January 1, 2020. States are also required to provide continuous enrollment through the end of the month in which the PHE ends and must cover COVID-19 testing and treatment for Medicaid enrollees. The COVID-related MOE does not apply to separate CHIP programs, but other MOE requirements remain in place for CHIP.
In 2021, Oklahoma and Missouri implemented the ACA Medicaid adult expansion, leaving only 12 states that have not filled the coverage gap for low-income adults (Figure 13). As of January 2022, 39 states cover parents and adults without dependent children with incomes at least up to 138% FPL (the FPL is $13,590 for an individual; $23,030 for a family of three in 2022). Just half of the states (25) and DC immediately expanded coverage to adults in January 2014. Since then, an additional 13 states have adopted the Medicaid expansion; six via state ballot initiatives, including Missouri and Oklahoma. In 2022, South Dakota will be the seventh state where voters will have a say in the state’s decision to expand Medicaid.
In the 12 states that have not implemented the Medicaid expansion, eligibility for parents remains extremely low, and only Wisconsin covers adults without dependent children (Figures 14 and 15). The median eligibility level for parents and caretakers in the 12 non-expansion states now stands at 38.5% FPL ($8,866 annually for a family of three), ranging from a low of 16% FPL in Texas to 100% FPL in Wisconsin. Nine non-expansion states base eligibility on a fixed dollar threshold that is converted to the equivalent federal poverty level for comparison purposes. Over time, the equivalent eligibility level will decrease when annual updates adjust federal poverty levels upward to account for inflation. In a year when the jump in the federal poverty levels is more significant, as it was in 2022, this erosion is more evident. For example, Tennessee’s parent eligibility declined from 93% FPL to 88% FPL between 2021 and 2022. Wisconsin is the only non-expansion that has aligned eligibility for adults without dependent children with that for parents at 100% FPL, through a waiver.
Page 25: “Table 4: Medicaid Income Eligibility Limits for Adults as a Percent of the Federal Poverty Level, January 20221 … Parents (in a family of three) Upper Limit … Connecticut [=] 160% … District of Columbia [=] 221%”
[439] Webpage: “Status of State Medicaid Expansion Decisions: Interactive Map.” Kaiser Family Foundation, November 9, 2022. <www.kff.org>
To date, 40 states (including DC) have adopted the Medicaid expansion and 11 states have not adopted the expansion. …
Coverage under the Medicaid expansion became effective January 1, 2014 in all states that have adopted the Medicaid expansion except for the following: Michigan (4/1/2014), New Hampshire (8/15/2014), Pennsylvania (1/1/2015), Indiana (2/1/2015), Alaska (9/1/2015), Montana (1/1/2016), Louisiana (7/1/2016), Virginia (1/1/2019), Maine (1/10/2019 with coverage retroactive to 7/2/2018), Idaho (1/1/2020), Utah (1/1/2020), Nebraska (10/1/2020), Oklahoma (7/1/2021), Missouri (Processing applications beginning 10/1/2021 with coverage retroactive to 7/1/2021), and South Dakota (Planned for 7/1/2023).
[440] Webpage: “Medicaid Expansion Enrollment.” Kaiser Family Foundation. Accessed November 14, 2022 at <www.kff.org>
“Timeframe: Sept 2021 … Location [=] United States … Expansion Group Enrollment [=] 20,415,800 … Expansion Group Enrollment: Total number of adults who have enrolled in Medicaid as a result of the ACA [Affordable Care Act] expansion of the program.”
[441] Report: “The Independent Payment Advisory Board: A New Approach to Controlling Medicare Spending.” By Jack Ebler, Tricia Neuman, and Juliette Cubanski. Henry J. Kaiser Family Foundation, April 13, 2011. <www.kff.org>
Page 3: “Prior to 2020, the growth target is based on a measure of inflation, and in subsequent years, it is based on the per capita growth in the economy (gross domestic product (GDP) plus one percentage point).”
Page 6:
For 2015 through 2019, the target for Medicare spending per capita is the average of general and medical inflation: specifically, the average of the projected percentage increase in the consumer price index for all Urban Consumers (CPI-U) and the medical care expenditure category of the CPI-U. For 2020 and later years, the target for Medicare spending per capita is the increase in the gross domestic product (GDP) plus one percentage point, which historically has increased at a higher rate than the CPI-based measures.
[442] Report: “Projected Medicare Expenditures Under an Illustrative Scenario with Alternative Payment Updates to Medicare Providers.” By John D. Shatto and M. Kent Clemens. United States Department of Health and Human Services, Centers for Medicare and Medicaid Services, Office of the Actuary, July 13, 2017. <www.cms.gov>
Pages 7–8:
Figure 2 shows the resulting comparison of future Medicare and Medicaid payment rates for physician services relative to private health insurance payment rates. Medicare payment levels in 2014 were about 78 percent of private health insurance payment rates, and Medicaid payment rates in 2008 were about 58 percent.13 In this illustration, Medicaid payment rates increase to 73 percent of private health insurance levels in 2013 and to 77 percent in 2014 before returning to 58 percent. Medicare physician payment rates would decline steadily through the projection period relative to private health insurance payment rates.
[443] Calculated with data from the webpage: “Poverty Guidelines.” U.S. Department of Health & Human Services, Assistant Secretary for Planning and Evaluation, January 12, 2022. <aspe.hhs.gov>
“2022 Poverty Guidelines … Persons in family/household [=] 3 … 48 Contiguous States and the District Of Columbia [=] $23,030 … Alaska [=] $28,790 … Hawaii [=] $26,490”
CALCULATION: $23,030 × 400% = $92,120
“2022 Poverty Guidelines … Persons in family/household [=] 4 … 48 Contiguous States and the District Of Columbia [=] $27,750 … Alaska [=] $34,690 … Hawaii [=] $31,920”
CALCULATION: $27,750 × 400% = $111,000
“2022 Poverty Guidelines … Persons in family/household [=] 5 … 48 Contiguous States and the District Of Columbia [=] $32,470 … Alaska [=] $40,590 … Hawaii [=] $37,350”
CALCULATION: $32,470 × 400% = $129,880
[444] Report: “Private Health Insurance Provisions in PPACA (P.L. 111-148).” By Hinda Chaikind and others. Congressional Research Service, April 15, 2010. <www.everycrsreport.com>
Page 2 (of PDF):
… PPACA [Patient Protection and Affordable Care Act] will enable and support states’ creation by 2014 of “American Health Benefit Exchanges.” An exchange cannot be an insurer, but will provide eligible individuals and small businesses with access to insurers’ plans in a comparable way. The exchange will consist of a selection of private plans as well as “multi-state qualified health plans,” administered by the Office of Personnel Management. Individuals will only be eligible to enroll in an exchange plan if they are not enrolled in Medicare, Medicaid, or acceptable employer coverage as a full-time employee. Based on income, certain individuals may qualify for a tax credit toward their premium costs and a subsidy for their cost-sharing; the credits and subsidies will be available only through an exchange.
[445] Report: “Estimated Financial Effects of the ‘Patient Protection and Affordable Care Act,’ as Amended.” By Richard S. Foster. U.S. Department of Health & Human Services, Centers for Medicare and Medicaid Services, Office of the Actuary, April 22, 2010. <www.cms.gov>
Page 5:
The refundable premium tax credits in section 1401 of the PPACA [Patient Protection and Affordable Care Act] (as amended by section 1001 of the Reconciliation Act) would limit the [health insurance] premiums paid by individuals with incomes up to 400 percent of the FPL [federal poverty level] to a range of 2.0 to 9.5 percent of their income and would cost an estimated $451 billion through 2019. An estimated 25 million Exchange enrollees (79 percent) would receive these Federal premium subsidies. The cost-sharing credits would reimburse individuals and families with incomes up to 400 percent of the FPL for a portion of the amounts they pay out-of-pocket for health services, as specified in section 1402, as amended. These credits are estimated to cost $55 billion through 2019.
The PPACA establishes the Exchange premium subsidies during 2014–2018 in such a way that the reduced premiums payable by those with incomes below 400 percent of FPL would maintain the same share of total premiums over time. As a result, the Federal premium subsidies for a qualifying individual would grow at the same pace as per capita health care costs during this period. Because the cost-sharing assistance is based on a percentage of health care costs incurred by qualifying individuals and families, average Federal expenditures for this assistance would also increase at the same rate as per capita health care costs. After 2018, if the Federal cost of the premium and cost-sharing subsidies exceeded 0.504 percent of GDP [gross domestic product], then the share of Exchange health insurance premiums paid by enrollees below 400 percent of the FPL would increase such that the Federal cost would stay at approximately 0.504 percent of GDP. We estimate that the subsidy costs in 2018 would represent about 0.518 percent of GDP, with the result that the enrollee share of the total premium would generally increase in 2019 and later.
[446] Webpage: “Marketplace Effectuated Enrollment and Financial Assistance.” Kaiser Family Foundation. Accessed November 14, 2022 at <www.kff.org>
Timeframe: 2022 … Location [=] United States … Total Effectuated Marketplace Enrollment [=] 13,807,669 … Marketplace Enrollees Receiving Advance Premium Tax Credits (APTCs) [=] 12,483,707 … Percent of Total Marketplace Enrollees Receiving APTCs [=] 90% …
Marketplace Enrollees Receiving Advance Premium Tax Credits (APTCs): Total number of individuals who had an active policy, who paid their premium (thus effectuating their coverage), and who received an APTC. Consumers with household incomes 100–400% of the federal poverty level may qualify for an APTC, which helps make their coverage more affordable throughout the year by lowering their share of monthly premium costs. Starting in 2021, the American Rescue Plan (ARP) expanded APTC eligibility for those with household incomes above 400% FPL. The Inflation Reduction Act has extended these subsidy expansions up through 2025.
[447] Article: “Many Americans Can’t Afford Obamacare: Aetna CEO.” By Matthew J. Belvedere. CNBC, July 30, 2014. <www.cnbc.com>
The Affordable Care Act—also known as Obamacare—is “not an affordable product” for many people and it does not fix the underlying problems causing high health-care costs, Aetna Chairman and CEO Mark Bertolini told CNBC on Wednesday. … But the third-largest U.S. health insurer also reported better-than-expected earnings and revenue in the second quarter…. “We have 600,000 … customers as a result of the Affordable Care Act,” Bertolini said. “We do know they are sicker. We know 87 percent are subsidized. We know they are older. So we expect they are going to use more health care.”
[448] Report: “CBO’s Record of Projecting Subsidies for Health Insurance Under the Affordable Care Act: 2014 to 2016.” Congressional Budget Office, December 2017. <www.cbo.gov>
Pages 1–2: “To examine the factors that caused CBO [Congressional Budget Office] and JCT’s [Joint Committee on Taxation’s] estimates of those identifiable subsidies to differ from actual amounts during the 2014–2016 period, this document compares projections and subsequent outcomes for the following groups of people … Those receiving subsidies through the marketplaces or the Basic Health Program….”
Page 11: “Federal costs for subsidies for coverage obtained through the marketplaces and the Basic Health Program come from data published by the Office of Management and Budget.7 Estimates of actual spending per person are the ratios of spending to subsidized enrollment through the health insurance marketplaces or the Basic Health Program in a calendar year.”
[449] Calculated with data from the webpage: “Estimated Total Premium Tax Credits Received by Marketplace Enrollees.” Henry J. Kaiser Family Foundation. Accessed November 14, 2022 at <www.kff.org>
Timeframe: 2022 … Location [=] United States … Average Monthly Advanced Premium Tax Credit [=] $5081 …
Prior to the American Rescue Plan Act (ARPA), Consumers with household incomes between 100% and 400% of the Federal Poverty Level (FPL) may qualify for Advanced Premium Tax Credits (APTCs), which help make their coverage more affordable throughout the year by lowering their share of monthly premium costs. Starting in 2021, the ARPA expanded subsidy eligibility for those with household incomes above 400% FPL. The Inflation Reduction Act has extended these subsidy expansions up through 2025. Consumers who qualify for APTCs may choose how much of the tax credit to apply to their premiums each month, up to the maximum amount for which they are eligible. The amount of APTC an enrollee may receive depends on household income and the cost of the second lowest cost silver plan available to enrollees in their local area.
Consumers who receive premium tax credits and who have income up to 250% FPL are also eligible for Cost-Sharing Reductions (CSR) if they enroll in a Silver plan in the marketplace. The CSRs lower the out-of-pocket costs consumers face. In 2021, 5.9 million marketplace enrollees received CSRs in addition to premium tax credits. The CSRs are not included in the estimates reported here. …
Average Monthly Advanced Premium Tax Credit is the total amount of APTC for the month for all individuals who received APTCs, divided by the number of individuals who received APTCs. …
1 Data reported for the United States represents the national average.
CALCULATION: $508 average monthly subsidy × 12 = $6,096 average annual subsidy
[450] Calculated with data from the report: “Federal Subsidies for Health Insurance Coverage for People Under Age 65: 2022 to 2032.” Congressional Budget Office, June 30, 2022. <www.cbo.gov>
Page 16:
Table A-1. CBO’s [Congressional Budget Office’s] May 2022 Projections for Health Insurance Coverage for People Under Age 65 … Millions of People, by Calendar Year …
Nongroup coverage purchased through marketplacesc … Subsidized … 2022 [=] 12 …
c Many people can purchase subsidized health insurance coverage through marketplaces established under the ACA, which are operated by the federal government, state governments, or partnerships between the federal and state governments.
Page 17:
Table A-2. CBO’s May 2022 Projections for Net Federal Subsidies for Health Insurance Coverage for People Under Age 65 … Billions of Dollars, by Fiscal Year …
Marketplace-Related Coverage and the Basic Health Program … Premium tax credits and 1332 waiver outlaysf … 2022 [=] 72
CALCULATION: $72,000,000,000 subsidies / 12,000,000 people = $6,000
[451] Press release: “Free Exchange Plan Options Are Available to Many Low-Income Consumers for 2020.” By Chris Sloan and Neil Rosacker. Avalere Health, October 31, 2019. <avalere.com>
New analysis from Avalere finds that over 96% of counties with exchanges operated by HealthCare.gov have free plan options for low-income consumers.
The percentage of counties with free plans increased from 95% to 96% from 2019 to 2020, maintaining the option to enroll in a $0 premium bronze plan for low-income enrollees (at 150% of the federal poverty limit (FPL) or below) in Healthcare.gov states.
Consumers in Healthcare.gov states also have access to free silver and gold plans as well. Highly subsidized enrollees have free silver plan options in 25% of counties (down from 32% in 2019), and free gold plan options in 23% of counties (down from 25% in 2019). …
Figure 1: Percentage of Healthcare.gov Counties with Free Subsidized Options by Metal Level, Individual at 150% FPL, Age 50, 2019–2020 … 2020 … Bronze [=] 96% … Silver [=] 25% … Gold [=] 23% …
To conduct the analysis, Avalere utilized the recently released 2020 Individual Market HHS [Health & Human Services] Landscape Files of exchange plan premiums in 38 Healthcare.gov states. Avalere then calculated the expected advance premium tax credits (APTCs) in each of the 2,705 counties in these states, by income, for a 50-year old non-smoker at 150% FPL, using the second lowest silver plan in each region.
[452] Press release: “Most Counties Will Have Free 2018 Exchange Plans for Low-Income Enrollees.” By Caroline F. Pearson, Chris Sloan, and Elizabeth Carpenter. Avalere Health, November 2, 2017. <avalere.com>
Page 2:
Table 1: Percentage of Healthcare.gov Counties with Free Subsidized Options by Income (As a Percentage of FPL*) and Metal Level, Individual Age 50, 2018
|
% of Counties |
150% FPL |
200% FPL |
|
Free Bronze |
98% |
81% |
|
Free Silver |
18% |
7% |
|
Free Gold |
10% |
2% |
*Uses the Alaska and Hawaii specific measures of the federal poverty level for plans in Alaska and Hawaii.
Page 4: “To conduct the analysis, Avalere utilized the recently released 2018 Individual Market HHS [Health & Human Services] Landscape Files of 2018 exchange plan premiums in Healthcare.gov states. Avalere then calculated the expected advance premium tax credits (APTCs) in each of the 2,722 counties, by income, for a 50-year old non-smoker, using the second-lowest silver plan in each region.”
[453] Report: “Prescription for Change ‘Filled’: Tax Provisions in the Patient Protection and Affordable Care Act, Updated to Reflect Changes Approved in the Reconciliation Act of 2010.” By Clint Stretch and others. Deloitte, March 30, 2010. <www2.deloitte.com>
Page 16:
Small businesses and eligible tax-exempt employers who are required to make certain non-elective contributions toward the costs of employee health benefits will be eligible for a small business credit to offset the cost of employee health insurance. …
In order to qualify, the business must have no more than 25 full-time equivalent employees, pay average annual wages of less than $50,000, and provide qualifying coverage. The full amount of the credit will be available to employers with 10 or fewer employees and average annual wages of less than $25,000, and will phase out when those thresholds are exceeded. The average wage threshold for determining the phase-out of credits will be adjusted for inflation after 2013. …
Effective date – The provision is effective for amounts paid or incurred after December 31, 2009, and to the determination of AMT [alternative minimum tax] credits after that date and their carryback.
[454] Webpage: “Small Business Health Care Tax Credit and the SHOP [Small Business Health Options Program] Marketplace.” Internal Revenue Service. Last updated May 31, 2022. <www.irs.gov>
If you are a small employer, there is a tax credit that can put money in your pocket.
The small business health care tax credit benefits employers that:
• Have fewer than 25 full-time equivalent employees
• Pay average wages of less than $50,000 a year per full-time equivalent (indexed annually for inflation beginning in 2014)
– For tax year 2014, the inflation-adjusted amount is $51,000
– For tax year 2015, the inflation-adjusted amount is $52,000
– For tax year 2016, the inflation-adjusted amount is $52,000
– For tax year 2017, the inflation-adjusted amount is $53,000
• Offer a qualified health plan to its employees through a Small Business Health Options Program Marketplace (or qualify for a limited exception to this requirement)
• Pay at least 50 percent of the cost of employee-only—not family or dependent—health care coverage for each employee …
How will the credit make a difference for you?
The maximum credit is:
• 50 percent of premiums paid for small business employers and
• 35 percent of premiums paid for small tax-exempt employers
• The credit is available to eligible employers for two consecutive taxable years
The amount of the credit you receive works on a sliding scale. The smaller the employer, the bigger the credit. So if you have more than 10 full-time equivalent employees or if the average wage is more than $25,000 (as adjusted for inflation), the amount of the credit you receive will be less. For example, if you pay $50,000 a year toward employees’ health care premiums, and if you qualify for a $10,000 credit each year, you can save $20,000 over the course of two years.
Even if your small business does not owe tax during the year, you can carry the credit back or forward to other tax years. Also, since the amount of the health insurance premium payments is more than the total credit, eligible small businesses can still claim a business expense deduction for the premiums in excess of the credit. That’s both a credit and a deduction for employee premium payments. …
The credit is refundable, so if you’re tax-exempt and have no taxable income, you may be eligible to receive the credit as a refund so long as it does not exceed your income tax withholding and Medicare tax liability. Refund payments issued to small tax-exempt employers claiming the refundable portion of the credit are subject to sequestration.
[455] Report: “Small Employer Health Tax Credit: Limited Use Continues Due to Multiple Reasons.” By James R. McTigue, Jr. U.S. Government Accountability Office, March 22, 2016. <www.gao.gov>
Page 2 (of PDF):
Claims of the small employer health tax credit have continued to be lower than thought eligible by government agency and small business group estimates, limiting the effect of the credit on expanding health insurance coverage through small employers. In 2014, about 181,000 employers claimed the credit, down somewhat from 2010 (see figure). These numbers are relatively low compared to the number of employers eligible for the credit. In 2012, GAO [U.S. Government Accountability Office] reported that selected estimates of the number of employers eligible ranged from about 1.4 million to 4 million. In 2010, claims totaled $468 million compared to initial estimates of $2 billion by the Congressional Budget Office and the Joint Committee on Taxation. Actual claims for the credit in 2013 and 2014 increased slightly to about $511 million and $541 million, respectively.
[456] Report: “Small Employer Health Tax Credit: Limited Use Continues Due to Multiple Reasons.” By James R. McTigue, Jr. U.S. Government Accountability Office, March 22, 2016. <www.gao.gov>
Page 2 (of PDF):
The small employer health tax credit has not been widely claimed for a variety of reasons, as GAO [U.S. Government Accountability Office] reported in May 2012. The maximum amount of the credit does not appear to be a large enough incentive for employers to offer or maintain insurance. Also, few small employers qualify for the maximum credit amount. For those employers who do claim the credit, the credit amount “phases out” to zero as employers employ up to 25 full time equivalent (FTE) employees at higher wages. The amount of the credit is also limited if premiums paid by an employer are more than the average premiums for the small group market in the employer’s state. Furthermore, the credit can only be claimed for two consecutive years after 2013. GAO also found that the cost and complexity involved in claiming the tax credit was significant, deterring small employers from claiming it. Many small businesses have also reported that they were unaware of the credit.
[457] Report: “Prescription for Change ‘Filled’: Tax Provisions in the Patient Protection and Affordable Care Act, Updated to Reflect Changes Approved in the Reconciliation Act of 2010.” By Clint Stretch and others. Deloitte, March 30, 2010. <www2.deloitte.com>
Page 23:
Employer Penalties and Other Requirements
The Act contains many provisions affecting employers. They generally fall into two broad categories. The first category is a set of penalties that must be paid by certain large employers that either do not offer health insurance or offer health insurance that employees opt out of in favor of acquiring coverage through an exchange. The second category is comprised of changes that employers may be required to make to their health plans. In general, however, the Act provides a broad grandfathering provision for plans in existence on the date of enactment.
[458] Report: “Private Health Insurance Provisions in PPACA (P.L. 111-148).” By Hinda Chaikind and others. Congressional Research Service, April 15, 2010. <www.everycrsreport.com>
Page 7:
PPACA [the Patient Protection and Affordable Care Act] does not mandate an employer to provide employees with coverage; however, beginning in 2014, it does impose requirements on certain employers.15 An employer with at least 50 full-time equivalents16 (FTEs) that does not provide coverage may be subject to a penalty if at least one of its full-time employees receives a premium credit. An employer with at least 50 FTEs that provides access to coverage but fails to meet certain requirements may also be subject to a penalty. The number of FTEs excludes those full-time seasonal employees who work for less than 120 days during the year. The penalty for an applicable employer who provides coverage is similar to the penalty assessed against an employer who does not provide coverage. An employer may be subject to a penalty only in relation to its full-time workers, defined as those working an average of at least 30 hours per week. An employer is not subject to a penalty in relation to its part-time workers (those working less than an average of 30 hours per week). For additional information besides that provided below, see CRS [Congressional Research Service] Report R41159, Summary of Potential Employer Penalties Under PPACA (P.L. 111-148).
Pages 7–8:
Requirements and Penalties for an Employer Offering Health Insurance
For an employer that chooses to offer health insurance, the following rules would apply:
• Current employment-based plans will be considered grandfathered plans.
• A small employer may offer full-time employees and their dependents coverage in an exchange plan.
• A large employer may offer full-time employees the opportunity to enroll in a group health plan.
• An employer will not be treated as meeting the employer requirements if at least one full-time employee receives premium credits in an exchange plan because the employee’s required contribution exceeds 9.5% of the employee’s household income or if the plan offered by the employer pays for less than 60% of covered health care expenses.17
• An employer must file a return providing the name of each individual for whom they provide the opportunity to enroll in minimum essential coverage, the length of any waiting period, the number of months that coverage was available, the monthly premium for the lowest cost option, the plan’s share of covered health care expenses paid for, the number for full-time employees, the number of months employees were covered (if any), and any other information required by the Secretary.18 The employer must provide notice to employees about the existence of the exchange, including a description of the services provided by the exchange.19
• An employer will not pay a penalty for any part-time workers (those working less than 30 hours), even if that employee receives a premium credit.
In 2014, the monthly penalty assessed to the employer for each full-time employee who receives a premium credit will be one-twelfth of $3,000 for any applicable month. However, the total penalty for an employer will be limited to the total number of the firm’s full-time employees minus 30, multiplied by one-twelfth of $2,000 for any applicable month. After 2014, the penalty amounts will be indexed by a premium adjustment percentage for the calendar year.
Finally those firms with more than 200 full-time employees that offer coverage will automatically enroll new full-time employees in a plan (and continue enrollment of current employees).20 Automatic enrollment programs will be required to include adequate notice and the opportunity for an employee to opt out.
Requirements and Penalties for an Employer Not Offering Health Insurance
A firm with at least 50 FTEs that chooses not to offer health insurance to its full-time employees (and their dependents) will be subject to a penalty if any of its full-time employees receive premium credits in an exchange plan. In 2014, the penalty assessed to the employer will be equal to the number of full-time employees minus 30 multiplied by one-twelfth of $2,000, for any applicable month. After 2014, the penalty payment amount would be indexed by a premium adjustment percentage for the calendar year.
Employers that do not offer coverage must also file a return stating that they do not offer coverage, the number of full-time employees, and other information required by the Secretary. They must provide notice to employees about the existence of the exchange, including a description of the services provided by the exchange.21
Page 9:
Free Choice Vouchers
An employer offering minimum essential coverage who pays any portion of the costs of such plan will provide free choice vouchers to each qualified employee.22 A qualified employee is defined as an employee whose required contribution to the employer plan is greater than 8% and less than 9.5% of the employee’s household income for the taxable year, whose household income is not greater than 400% of the FPL [federal poverty level] for the relevant family size, and who does not participate in the plan offered by the employer. Beginning after 2014, the 8% and 9.5% would be indexed by the rate of premium growth.
The amount of a voucher will be equal to the monthly portion of the cost of the employer plan that would have been paid by the employer if the employee were covered under the plan for which the employer pays the largest portion of plan costs, for either self or, if elected by the employee, family coverage.
An exchange will credit the amount of a voucher to the monthly premium of a qualified health plan in which the qualified employee is enrolled, and the employer will pay the exchange the credited amount. If the amount of the voucher exceeds the premium, the excess will be paid to the employee. An individual receiving a free choice voucher will not be eligible for the exchange premium credits or cost-sharing subsidies described later in this report.23
No penalty will be imposed on an employer with respect to any employee who is provided with a voucher.
[459] Webpage: “Employer Shared Responsibility Provisions.” Internal Revenue Service, August 5, 2016. Last updated 9/29/22. <www.irs.gov>
All types of employers can be ALEs [applicable large employers], including tax-exempt organizations and government entities. …
… Depending on its decisions about offering minimum essential coverage to its full-time employees and their dependents, an ALE member may be subject to one of two potential employer shared responsibility payments. …
An ALE member will owe the first type of employer shared responsibility payment if it does not offer minimum essential coverage to at least 95 percent of its full-time employees (and their dependents), and at least one full-time employee receives the premium tax credit for purchasing coverage through the Health Insurance Marketplace. …
Even if an ALE member offers minimum essential coverage to at least 95 percent of its full-time employees (and their dependents), it may owe the second type of employer shared responsibility payment for each full-time employee who receives the premium tax credit for purchasing coverage through the Marketplace. In general, a full-time employee could receive the premium tax credit if: (1) the minimum essential coverage the employer offers to the employee is not affordable; (2) the minimum essential coverage the employer offers to the employee does not provide minimum value; or (3) the employee is not one of the at least 95 percent of full-time employees offered minimum essential coverage.
[460] Webpage: “Transition Relief.” Internal Revenue Service, March 3, 2016. <www.irs.gov>
“Although the employer shared responsibility provisions originally were to apply in 2014, the Treasury Department and IRS issued guidance, Notice 2013-45, providing that the employer shared responsibility provisions and the corresponding information reporting requirements will first apply in 2015.”
[461] Webpage: “Actions on Presidential Nominee 188: Kathleen Sebelius—Department of Health and Human Services.” U.S. Senate, 111th Congress (2009–2010). Accessed December 13, 2021 at <www.congress.gov>
“4/28/2009 Confirmed by the Senate by Yea–Nay Vote. 65–31. Record Vote Number: 172.”
[462] Report: “Regulations Pursuant to the Patient Protection and Affordable Care Act (P.L. 111-148).” By Curtis W. Copeland, Congressional Research Service, April 13, 2010. <www.ncsl.org>
Page 2 (of PDF):
The report indicates that PPACA [the Patient Protection and Affordable Care Act] gives federal agencies substantial responsibility and authority to “fill in the details” of the legislation through subsequent regulations. Although some regulations are required in 2010, it seems likely that other regulations will be issued for years, or even decades to come.
Page 1:
Federal regulations generally start with an act of Congress and are the means by which statutes are implemented and specific requirements are established. In Building a Legislative-Centered Public Administration, David H. Rosenbloom succinctly described why regulations are important, why Congress delegates rulemaking authority to federal agencies, and congressional responsibilities when such delegations are made:
Rulemaking and lawmaking are functional equivalents. Legislative (substantive) rules made by agencies have the force of law. When agencies make such rules, in effect they legislate.
Page 2: “This report identifies provisions in PPACA that require, permit, or contemplate rulemaking by federal agencies to implement the legislation. … Although these searches identified more than 40 regulatory provisions in PPACA, it is unclear whether they identified all such provisions in the act.”
[463] Commentary: “America’s Most Powerful Woman.” By Merrill Matthews. Investor’s Business Daily, June 8, 2010. <www.investors.com>
And now Congress has handed Ms. Sebelius the authority to implement the Patient Protection and Affordable Care Act (a.k.a. ObamaCare).
A quick search of the legislation reveals that the word “Secretary” appears nearly 3,000 times in the 2,700-page legislation. And the vast majority of those references are to the secretary of HHS [Department of Health and Human Services].
Over and over again we see: “the Secretary shall establish”; “the Secretary shall promulgate regulations”; “the Secretary shall develop standards”; “the Secretary shall periodically review”; “as the Secretary deems are important”; “the Secretary may develop and impose appropriate penalties”; “the Secretary may adjust the rates”; “if the Secretary determines necessary”; and “the Secretary has the authority.”
[464] Report: “Regulations Pursuant to the Patient Protection and Affordable Care Act (P.L. 111-148).” By Curtis W. Copeland. Congressional Research Service, April 13, 2010. <www.ncsl.org>
Pages 4–5:
Subsection (c) of Section 1311 of PPACA [the Patient Protection and Affordable Care Act] (“Affordable Choices of Health Benefit Plans”) states that “The Secretary shall, by regulation, establish criteria for the certification of health plans as qualified health plans.” It goes on to say that the criteria must require that such plans meet eight minimum requirements (for example, not employ marketing practices that discourage enrollment; ensure a sufficient choice of providers; include health plan networks that serve predominately low-income, medically underserved individuals; and utilize a standard format to present heath [sic] benefits plan options).
[465] Public Law 111-148: “Patient Protection and Affordable Care Act.” 111th U.S. Congress. Signed into law by Barack Obama on March 23, 2010. <www.congress.gov>
Title I—Quality, Affordable Health Care for All Americans …
Subtitle D—Available Coverage Choices for All Americans …
Part II—Consumer Choices and Insurance Competition Through Health Benefit Exchanges …
Sec. 1311. Affordable Choices of Health Benefit Plans. …
(b) American Health Benefit Exchanges.—
(1) In General.—Each State shall, not later than January 1, 2014, establish an American Health Benefit Exchange (referred to in this title as an “Exchange”) for the State that—
(A) facilitates the purchase of qualified health plans …
(c) Responsibilities of the Secretary.—
(1) In General.—The Secretary shall, by regulation, establish criteria for the certification of health plans as qualified health plans. Such criteria shall require that, to be certified, a plan shall, at a minimum….
[466] Report: “Estimated Financial Effects of the ‘Patient Protection and Affordable Care Act,’ as Amended.” By Richard S. Foster. U.S. Department of Health & Human Services, Centers for Medicare and Medicaid Services, Office of the Actuary, April 22, 2010. <www.cms.gov>
Page 5:
The refundable premium tax credits in section 1401 of the PPACA [the Patient Protection and Affordable Care Act] (as amended by section 1001 of the Reconciliation Act) would limit the [health insurance] premiums paid by individuals with incomes up to 400 percent of the FPL [federal poverty level] to a range of 2.0 to 9.5 percent of their income and would cost an estimated $451 billion through 2019. …
The PPACA establishes the Exchange premium subsidies during 2014–2018 in such a way that the reduced premiums payable by those with incomes below 400 percent of FPL would maintain the same share of total premiums over time.
[467] Report: “Private Health Insurance Provisions in PPACA [Patient Protection and Affordable Care Act] (P.L. 111-148).” By Hinda Chaikind and others. Congressional Research Service, April 15, 2010. <www.everycrsreport.com>
Pages 11–12:
The law will apply new federal health insurance standards to group health plans as well as health insurance coverage offered in the individual, small group, and large group markets (depending on the standard), effective for plan years beginning on or after January 1, 2014. Among the insurance reforms are provisions that will subject new plans to the following requirements: …
• Require QHPs [qualified health plans] and issuers in the individual and small group markets to offer coverage that includes the “essential health benefits package” (see description below).41
Page 14:
Essential Health Benefits Package
The Secretary will specify the “essential health benefits” included in the “essential health benefits package” that QHPs will be required to cover (effective beginning in 2014). Essential health benefits48 will include at least the following general categories:
• ambulatory patient services;
• emergency services;
• hospitalization;
• maternity and newborn care;
• mental health and substance use disorder services, including behavioral health treatment;
• prescription drugs;
• rehabilitative and habilitative services and devices;
• laboratory services;
• preventive and wellness and chronic disease management; and
• pediatric services, including oral and vision care.
[468] Article: “Obama Reaffirms Insurers Must Cover Contraception.” By Robert Pear. New York Times, January 20, 2012. <www.nytimes.com>
The Obama administration said Friday that most health insurance plans must cover contraceptives for women free of charge, and it rejected a broad exemption sought by the Roman Catholic Church for insurance provided to employees of Catholic hospitals, colleges and charities.
Federal officials said they would give such church-affiliated organizations one additional year—until Aug. 1, 2013—to comply with the requirement. Most other employers and insurers must comply by this Aug. 1. …
The 2010 health care law says insurers must cover “preventive health services” and cannot charge for them.
The new rule interprets this mandate. It requires coverage of the full range of contraceptive methods approved by the Food and Drug Administration. Among the drugs and devices that must be covered are emergency contraceptives including pills known as ella and Plan B. The rule also requires coverage of sterilization procedures for women without co-payments or deductibles.
[469] Report: “Regulations Pursuant to the Patient Protection and Affordable Care Act (P.L. 111-148).” By Curtis W. Copeland, Congressional Research Service, April 13, 2010. <www.ncsl.org>
Page 11:
Subsection (h) of Section 1311 of the act (“Affordable Choices of Health Benefit Plans”) states that, beginning on January 1, 2015, a qualified health plan may contract with a health care provider “only if such provider implements such mechanisms to improve health care quality as the Secretary may by regulation require.” Given this wording, the Secretary appears to be allowed not to require such improvement mechanisms. If the Secretary decides to require mechanisms to improve health care quality, it is unclear whether this subsection requires the Secretary to do so through regulations or whether other, non-regulatory methods can be used.
[470] Public Law 111-148: “Patient Protection and Affordable Care Act.” 111th U.S. Congress. Signed into law by Barack Obama on March 23, 2010. <www.congress.gov>
Title I—Quality, Affordable Health Care for All Americans …
Subtitle A—Immediate Improvements in Health Care Coverage for All Americans …
Part A—Individual and Group Market Reforms …
Subpart II—Improving Coverage …
Sec. 1003. Ensuring That Consumers Get Value for Their Dollars. …
(a) Initial Premium Review Process.—
(1) In General.—The Secretary, in conjunction with States, shall establish a process for the annual review, beginning with the 2010 plan year and subject to subsection (b)(2)(A), of unreasonable increases in premiums for health insurance coverage.
(2) Justification and Disclosure.—The process established under paragraph (1) shall require health insurance issuers to submit to the Secretary and the relevant State a justification for an unreasonable premium increase prior to the implementation of the increase. Such issuers shall prominently post such information on their Internet websites. The Secretary shall ensure the public disclosure of information on such increases and justifications for all health insurance issuers.
[471] Article: “Health Insurers to Be Required to Justify Rate Increases Over 10 Percent.” By Robert Pear. New York Times, December 21, 2010. <www.nytimes.com>
The new health care law, signed in March by President Obama, calls for the annual review of “unreasonable increases in premiums for health insurance coverage.”
The law did not define unreasonable—a gap the administration is now trying to fill.
[472] Public Law 111-148: “Patient Protection and Affordable Care Act.” 111th U.S. Congress. Signed into law by Barack Obama on March 23, 2010. <www.congress.gov>
Title I—Quality, Affordable Health Care for All Americans …
Subtitle A—Immediate Improvements in Health Care Coverage for All Americans …
Part A—Individual and Group Market Reforms …
Subpart II—Improving Coverage …
Sec. 2717. Ensuring the Quality of Care. …
(2) Reporting Requirements.—
(A) In General.—A group health plan and a health insurance issuer offering group or individual health insurance coverage shall annually submit to the Secretary, and to enrollees under the plan or coverage, a report on whether the benefits under the plan or coverage satisfy the elements described in subparagraphs (A) through (D) of paragraph (1). …
(D) Penalties.—In developing the reporting requirements under paragraph (1), the Secretary may develop and impose appropriate penalties for non-compliance with such requirements.
[473] Public Law 111-148: “Patient Protection and Affordable Care Act.” 111th U.S. Congress. Signed into law by Barack Obama on March 23, 2010. <www.congress.gov>
Page 85 (of PDF):
Sec. 1332. Waiver for State Innovation.
(a) Application.—
(1) In General.—A State may apply to the Secretary for the waiver of all or any requirements described in paragraph
(2) with respect to health insurance coverage within that State for plan years beginning on or after January 1, 2017. Such application shall—
(A) be filed at such time and in such manner as the Secretary may require;
(B) contain such information as the Secretary may require, including—
(i) a comprehensive description of the State legislation and program to implement a plan meeting the requirements for a waiver under this section; and
(ii) a 10-year budget plan for such plan that is budget neutral for the Federal Government; and
(C) provide an assurance that the State has enacted the law described in subsection (b)(2).
Page 206:
(c) Waiver of Provisions.—Notwithstanding section 1115(a) of the Social Security Act (42 U.S.C. 1315(a)), the Secretary may waive such provisions of titles XIX, XVIII, and XI of that Act as may be necessary to accomplish the goals of the demonstration, ensure beneficiary access to acute and post-acute care, and maintain quality of care.
Page 247 (of PDF):
(e) Waiver Authority.—The Secretary may waive such requirements of titles XI and XVIII of the Social Security Act as may be necessary to carry out the program.
Page 351 (of PDF):
(5) Waiver of De Minimis Premiums.—The Secretary shall, under procedures established by the Secretary, permit a prescription drug plan or an MA–PD [Medicare Advantage–prescription drug] plan to waive the monthly beneficiary premium for a subsidy eligible individual if the amount of such premium is de minimis. If such premium is waived under the plan, the Secretary shall not reassign subsidy eligible individuals enrolled in the plan to other plans based on the fact that the monthly beneficiary premium under the plan was greater than the low-income benchmark premium amount.
Page 431 (of PDF):
(2) The Secretary may give consideration to whether an applicant has received a grant under subsection (a) of section 4101 of the Patient Protection and Affordable Care Act.
(e) Waiver of Requirements.—The Secretary may—
(1) under appropriate circumstances, waive the application of all or part of the requirements of this subsection with respect to an SBHC [school-based health center] for not to exceed 2 years; and
(2) upon a showing of good cause, waive the requirement that the SBHC provide all required comprehensive primary health services for a designated period of time to be determined by the Secretary.
Page 432 (of PDF):
(2) Waiver.—The Secretary may waive all or part of the matching requirement described in paragraph (1) for any fiscal year for the SBHC if the Secretary determines that applying the matching requirement to the SBHC would result in serious hardship or an inability to carry out the purposes of this section.
Page 558 (of PDF):
(B) Waiver of Requirement Half of Training Be Provided in Non-Hospital Community-Based Care Setting in Certain Areas.—The Secretary may waive the requirement under subparagraph (A)(ii) with respect to eligible hospitals located in rural or medically underserved areas.
Pages 630–631 (of PDF):
(iii) Hardship Exception; Waiver for Certain Medicaid Providers.—The Secretary may, on a case-by-case basis, exempt a provider of medical or other items or services or supplier from the imposition of an application fee under this subparagraph if the Secretary determines that the imposition of the application fee would result in a hardship. The Secretary may waive the application fee under this subparagraph for providers enrolled in a State Medicaid program for whom the State demonstrates that imposition of the fee would impede beneficiary access to care.
Page 734 (of PDF):
(C) Waiver by Secretary.—In the case of any such failure which is due to reasonable cause and not to willful neglect, the Secretary may waive part or all of the penalty imposed by paragraph (1), to the extent that the payment of such penalty would be excessive or otherwise inequitable relative to the failure involved.
Page 865 (of PDF):
(iii) Matching Funds.—As a condition for receiving an award under this subsection, an eligible entity shall contribute to the project non-Federal funds in the amount of $1 for every $3 awarded under clauses (i) and (ii), except that the Director of NIH [National Institute of Health] may waive or modify such matching requirement in any case where the Director determines that the goals and objectives of this section cannot adequately be carried out unless such requirement is waived.
[474] Report: “New Entities Created Pursuant to the Patient Protection and Affordable Care Act.” By Curtis W. Copeland. Congressional Research Service, July 8, 2010. <thf_media.s3.amazonaws.com>
Page 2 (of PDF):
The Patient Protection and Affordable Care Act (PPACA, P.L. 111-148, March 23, 2010) creates, requires others to create, or authorizes dozens of new entities to implement the legislation. Some of these new entities are offices within existing cabinet departments and agencies, and are assigned certain administrative or representational duties related to the legislation. Other entities are new boards and commissions with particular planning and reporting responsibilities. Still others are advisory bodies that were created to study particular issues, offer recommendations, or both. Although PPACA describes some of these new organizations and advisory bodies in detail, in many cases it is currently impossible to know how much influence they will ultimately have over the implementation of the legislation.
This report describes dozens of new governmental organizations or advisory bodies that are mentioned in PPACA, but does not include other types of entities that were created by the legislation (for example, various demonstration projects, grants, trust funds, programs, systems, formulas, guidelines, risk pools, websites, ratings areas, model agreements, or protocols). A table in the Appendix is organized in terms of entities (1) that were created by PPACA itself (for example, through statutory language stating that an organization is “established” or “created”); (2) that PPACA requires the President to establish (for example, “the President shall establish”); (3) that PPACA requires the Secretary of the Department of Health and Human Services (HHS) to establish (for example, “the Secretary shall establish”); (4) that PPACA requires some other organization to establish; and (5) that PPACA authorizes to be established. For each entity listed, the table identifies (to the extent provided in the legislation) the relevant section of PPACA, the name of the entity, the date that the entity is required to be created and its location, the composition of the entity and its leadership, and the purpose and duties of the entity.
NOTE: The above-mentioned appendix (pages 20–38) lists 46 new governmental offices, centers, boards, councils, commissions, committees, advisory bodies, working groups, panels, task forces, and an institute.
[475] Public Law 111-148: “Patient Protection and Affordable Care Act.” 111th U.S. Congress. Signed into law by Barack Obama on March 23, 2010. <www.congress.gov>
Title III—Improving the Quality and Efficiency of Health Care …
Subtitle E—Ensuring Medicare Sustainability …
Sec. 3403. Independent Medicare Advisory Board. …
(b) Purpose.—It is the purpose of this section to, in accordance with the following provisions of this section, reduce the per capita rate of growth in Medicare spending—
(1) by requiring the Chief Actuary of the Centers for Medicare & Medicaid Services to determine in each year to which this section applies (in this section referred to as “a determination year”) the projected per capita growth rate under Medicare for the second year following the determination year (in this section referred to as “an implementation year”);
(2) if the projection for the implementation year exceeds the target growth rate for that year, by requiring the Board to develop and submit during the first year following the determination year (in this section referred to as “a proposal year”) a proposal containing recommendations to reduce the Medicare per capita growth rate to the extent required by this section; and
(3) by requiring the Secretary to implement such proposals unless Congress enacts legislation pursuant to this section. …
(c) Board Proposals.—…
(2) Proposals.—…
(A) Requirements.—Each proposal submitted under this section in a proposal year shall meet each of the following requirements:
(i) If the Chief Actuary of the Centers for Medicare & Medicaid Services has made a determination under paragraph (7)(A) in the determination year, the proposal shall include recommendations so that the proposal as a whole (after taking into account recommendations under clause (v)) will result in a net reduction in total Medicare program spending in the implementation year that is at least equal to the applicable savings target established under paragraph (7)(B) for such implementation year. …
(g) Board Membership; Terms of Office; Chairperson; Removal.—
(1) Membership.—
(A) In General.—The Board shall be composed of—
(i) 15 members appointed by the President, by and with the advice and consent of the Senate….
[476] Report: “The Independent Payment Advisory Board: A New Approach to Controlling Medicare Spending.” By Jack Ebler, Tricia Neuman, and Juliette Cubanski. Henry J. Kaiser Family Foundation, April 2011. <www.kff.org>
Page 3: “Prior to 2020, the growth target is based on a measure of inflation, and in subsequent years, it is based on the per capita growth in the economy (gross domestic product (GDP) plus one percentage point).”
Page 6:
For 2015 through 2019, the target for Medicare spending per capita is the average of general and medical inflation: specifically, the average of the projected percentage increase in the consumer price index for all Urban Consumers (CPI-U) and the medical care expenditure category of the CPI-U. For 2020 and later years, the target for Medicare spending per capita is the increase in the gross domestic product (GDP) plus one percentage point, which historically has increased at a higher rate than the CPI-based measures.
[477] Public Law 111-148: “Patient Protection and Affordable Care Act.” 111th U.S. Congress. Signed into law by Barack Obama on March 23, 2010. <www.congress.gov>
Sec. 10320. Expansion of the Scope of, and Additional Improvements to, the Independent Medicare Advisory Board. …
(b) Name Change.—Any reference in the provisions of, or amendments made by, section 3403 to the “Independent Medicare Advisory Board” shall be deemed to be a reference to the “Independent Payment Advisory Board.”
[478] Public Law 115-123: “Bipartisan Budget Act of 2018.” 115th U.S. Congress. Signed into law by Donald Trump on February 9, 2018. <www.congress.gov>
Title XI—Protecting Seniors’ Access to Medicare Act
Sec. 52001. Repeal of the Independent Payment Advisory Board.
(a) Repeal.—Section 1899A of the Social Security Act (42 U.S.C. 1395kkk) is repealed.
(b) Conforming Amendments.—
(1) Lobbying Cooling-Off Period.—Paragraph (3) of section 207(c) of title 18, United States Code, is repealed.
(2) Gao [Government Accountability Office] Study and Report.—Section 3403(b) of the Patient Protection and Affordable Care Act (42 U.S.C. 1395kkk–1) is repealed.
(3) MedPAC [Medicare Payment Advisory Commission] Review and Comment.—Section 1805(b) of the Social Security Act (42 U.S.C. 1395b–6(b)) is amended—
(A) by striking paragraph (4);
(B) by redesignating paragraphs (5) through (8) as paragraphs (4) through (7), respectively; and
(C) by redesignating the paragraph (9) that was redesignated by section 3403(c)(1) of the Patient Protection and Affordable Care Act (Public Law 111–148) as paragraph (8).
(4) Name Change.—Section 10320(b) of the Patient Protection and Affordable Care Act (Public Law 111–148) is repealed.
(5) Rule of Construction.—Section 10320(c) of the Patient Protection and Affordable Care Act (Public Law 111–148) is repealed.
[479] Report: “The Independent Payment Advisory Board: A New Approach to Controlling Medicare Spending.” By Jack Ebler, Tricia Neuman, and Juliette Cubanski. Henry J. Kaiser Family Foundation, April 2011. <www.kff.org>
Page 3: “The recommendations made by IPAB [Independent Payment Advisory Board] move to the Congress for fast-track consideration. If Congress does not act in the required timeframe, the Secretary is required to implement the Board’s recommendations, also on a fast-track basis.”
[480] Public Law 111-148: “Patient Protection and Affordable Care Act.” 111th U.S. Congress. Signed into law by Barack Obama on March 23, 2010. <www.congress.gov>
Title III—Improving the Quality and Efficiency of Health Care …
Subtitle E—Ensuring Medicare Sustainability …
Sec. 3403. Independent Medicare Advisory Board …
(d) Congressional Consideration.—
(1) Introduction.—
(A) In General.—On the day on which a proposal is submitted by the President to the House of Representatives and the Senate under subsection (c)(4), the legislative proposal (described in subsection (c)(3)(B)(iv)) contained in the proposal shall be introduced (by request) in the Senate by the majority leader of the Senate or by Members of the Senate designated by the majority leader of the Senate and shall be introduced (by request) in the House by the majority leader of the House or by Members of the House designated by the majority leader of the House. …
(3) Limitation on Changes to the Board Recommendations.—
(A) In General.—It shall not be in order in the Senate or the House of Representatives to consider any bill, resolution, or amendment, pursuant to this subsection or conference report thereon, that fails to satisfy the requirements of subparagraphs (A)(i) and (C) of subsection (c)(2). …
(4) Expedited Procedure.—
(A) Consideration.—A motion to proceed to the consideration of the bill in the Senate is not debatable.
(B) Amendment …
(iv) Amendment Not in Order.—It shall not be in order to consider an amendment that would cause the bill to result in a net reduction in total Medicare program spending in the implementation year that is less than the applicable savings target established under subsection (c)(7)(B) for such implementation year.
(v) Waiver and Appeals.—This paragraph may be waived or suspended in the Senate only by the affirmative vote of three-fifths of the Members, duly chosen and sworn. An affirmative vote of three-fifths of the Members of the Senate, duly chosen and sworn, shall be required in the Senate to sustain an appeal of the ruling of the Chair on a point of order raised under this section.
(C) Consideration by the Other House.—
(i) In General.—The expedited procedures provided in this subsection for the consideration of a bill introduced pursuant to paragraph (1) shall not apply to such a bill that is received by one House from the other House if such a bill was not introduced in the receiving House. …
(F) Veto.—If the President vetoes the bill debate on a veto message in the Senate under this subsection shall be 1 hour equally divided between the majority and minority leaders or their designees.
(5) Rules of the Senate and House of Representatives.—This subsection and subsection (f)(2) are enacted by Congress—
(A) as an exercise of the rulemaking power of the Senate and the House of Representatives, respectively, and is deemed to be part of the rules of each House, respectively, but applicable only with respect to the procedure to be followed in that House in the case of bill under this section, and it supersedes other rules only to the extent that it is inconsistent with such rules; and
(B) with full recognition of the constitutional right of either House to change the rules (so far as they relate to the procedure of that House) at any time, in the same manner, and to the same extent as in the case of any other rule of that House. …
(e) Implementation of Proposal.—
(1) In General.—Notwithstanding any other provision of law, the Secretary shall, except as provided in paragraph (3), implement the recommendations contained in a proposal submitted by the President to Congress pursuant to this section on August 15 of the year in which the proposal is so submitted. …
(3) Exception.—The Secretary shall not be required to implement the recommendations contained in a proposal submitted in a proposal year by the President to Congress pursuant to this section if—
(A) prior to August 15 of the proposal year, Federal legislation is enacted that includes the following provision: ‘This Act supercedes the recommendations of the Board contained in the proposal submitted, in the year which includes the date of enactment of this Act, to Congress under section 1899A of the Social Security Act. …
[481] Constitution of the United States. Signed September 17, 1787. <www.justfacts.com>
Article I, Section 7, Clause 2:
Every Bill which shall have passed the House of Representatives and the Senate, shall, before it become a Law, be presented to the President of the United States; If he approve he shall sign it, but if not he shall return it, with his Objections to that House in which it shall have originated, who shall enter the Objections at large on their Journal, and proceed to reconsider it. If after such Reconsideration two thirds of that House shall agree to pass the Bill, it shall be sent, together with the Objections, to the other House, by which it shall likewise be reconsidered, and if approved by two thirds of that House, it shall become a Law.
[482] Public Law 111-148: “Patient Protection and Affordable Care Act.” 111th U.S. Congress. Signed into law by Barack Obama on March 23, 2010. <www.congress.gov>
Title III—Improving the Quality and Efficiency of Health Care …
Subtitle E—Ensuring Medicare Sustainability …
Sec. 3403. Independent Medicare Advisory Board …
(h) Vacancies; Quorum; Seal; Vice Chairperson; Voting on Reports.—
(1) Vacancies.—No vacancy on the Board shall impair the right of the remaining members to exercise all the powers of the Board.
(2) Quorum.—A majority of the appointed members of the Board shall constitute a quorum for the transaction of business, but a lesser number of members may hold hearings.
[483] Webpage: “Actions on Presidential Nominee 188: Kathleen Sebelius—Department of Health and Human Services.” U.S. Senate, 111th Congress (2009–2010). Accessed December 13, 2021 at <www.congress.gov>
“4/28/2009 Confirmed by the Senate by Yea–Nay Vote. 65–31. Record Vote Number: 172.”
[484] Public Law 111-148: “Patient Protection and Affordable Care Act.” 111th U.S. Congress. Signed into law by Barack Obama on March 23, 2010. <www.congress.gov>
Title III—Improving the Quality and Efficiency of Health Care …
Subtitle E—Ensuring Medicare Sustainability …
Sec. 3403. Independent Medicare Advisory Board …
(c) Board Proposals …
(5) Contingent Secretarial Development of Proposal.—If, with respect to a proposal year, the Board is required, to but fails, to submit a proposal to the President by the deadline applicable under paragraph (3)(A)(i), the Secretary shall develop a detailed and specific proposal that satisfies the requirements of subparagraphs (A) and (C) (and, to the extent feasible, subparagraph (B)) of paragraph (2) and contains the information required paragraph (3)(B)).
[485] Public Law 111-148: “Patient Protection and Affordable Care Act.” 111th U.S. Congress. Signed into law by Barack Obama on March 23, 2010. <www.congress.gov>
Title III—Improving the Quality and Efficiency of Health Care …
Subtitle E—Ensuring Medicare Sustainability …
Sec. 3403. Independent Medicare Advisory Board …
(e) Implementation of Proposal.—…
(3) Exception.—The Secretary shall not be required to implement the recommendations contained in a proposal submitted in a proposal year by the President to Congress pursuant to this section if—…
(B) in the case of implementation year 2020 and subsequent implementation years, a joint resolution described in subsection (f)(1) is enacted not later than August 15, 2017. …
(f) Joint Resolution Required to Discontinue the Board.—
(1) In General.—For purposes of subsection (e)(3)(B), a joint resolution described in this paragraph means only a joint resolution—
(A) that is introduced in 2017 by not later than February 1 of such year …
(2) Procedure …
(F) Majority Required for Adoption.—A joint resolution considered under this subsection shall require an affirmative vote of three-fifths of the Members, duly chosen and sworn, for adoption.
(3) Termination.—If a joint resolution described in paragraph (1) is enacted not later than August 15, 2017—
(A) the Chief Actuary of the Medicare & Medicaid Services shall not—
(i) make any determinations under subsection (c)(6) after May 1, 2017; or
(ii) provide any opinion pursuant to subsection (c)(3)(B)(iii) after January 16, 2018;
(B) the Board shall not submit any proposals or advisory reports to Congress under this section after January 16, 2018; and
(C) the Board and the consumer advisory council under subsection (k) shall terminate on August 16, 2018.
[486] Public Law 111-148: “Patient Protection and Affordable Care Act.” 111th U.S. Congress. Signed into law by Barack Obama on March 23, 2010. <www.congress.gov>
Title III—Improving the Quality and Efficiency of Health Care …
Subtitle E—Ensuring Medicare Sustainability …
Sec. 3403. Independent Medicare Advisory Board …
(g) Board Membership; Terms of Office; Chairperson; Removal …
(4) Removal.—Any appointed member may be removed by the President for neglect of duty or malfeasance in office, but for no other cause.
[487] Public Law 111-148: “Patient Protection and Affordable Care Act.” 111th U.S. Congress. Signed into law by Barack Obama on March 23, 2010. <www.congress.gov>
Title III—Improving the Quality and Efficiency of Health Care …
Subtitle E—Ensuring Medicare Sustainability …
Sec. 3403. Independent Medicare Advisory Board …
(c) Board Proposals …
(2) Proposals.—
(A) Requirements.—Each proposal submitted under this section in a proposal year shall meet each of the following requirements: …
(ii) The proposal shall not include any recommendation to ration health care, raise revenues or Medicare beneficiary premiums under section 1818, 1818A, or 1839, increase Medicare beneficiary cost-sharing (including deductibles, coinsurance, and copayments), or otherwise restrict benefits or modify eligibility criteria. …
(B) Additional Considerations.—In developing and submitting each proposal under this section in a proposal year, the Board shall, to the extent feasible—
(i) give priority to recommendations that extend Medicare solvency;
(ii) include recommendations that …
(II) protect and improve Medicare beneficiaries’ access to necessary and evidence-based items and services …
NOTE: “Evidence-based” medicine is sometimes used to ration health care. The term is defined and explicated in the next two footnotes.
[488] Entry: “evidence-based medicine.” Healthcare Management Dictionary. By Annie Phillips. Radcliffe Medical Press, 2003.
Page 58:
The systematic analysis of data in order to assess the clinical efficacy and cost-effectiveness of treatments. First described in the British Medical Journal in 1996 as “the conscientious, explicit and judicious use of current best evidence in making decisions about the care of individual patients,” it is a discipline that aims to invalidate previously accepted diagnostic tests and therapies and replace them with new ones that are more powerful, accurate, efficacious, and safe.
The practice of evidence-based medicine means integrating individual and clinical expertise with the best available external clinical evidence from systematic research.1 This process underpins, for example, the work of the [U.K.’s] National Institute for Clinical Excellence (NICE), which decides the technologies and treatments that should be made available on the NHS [National Health Service].
[489] Book: Rationing of Medical Services in Europe: An Empirical Study. Edited by J.-Matthias Graf von der Schulenburg and Michael Blanke. IOS Press, 2004.
Chapter I: “Rationing Health Care in Europe – Finland.” By Janne Martikainen and Hannu Valtonen. Pages 3–26.
Page 18:
An unstructured question was used to explore which form of rationing professionals themselves believed to be the most effective in controlling cost escalation, since 78% of them believed that cost escalation can be controlled somehow. The most preferred forms of rationing were priority setting [20.0%], preventative treatments [15.5%] and evidence based medicine [8.9%] (Table 14). In the Finnish publicity, instead of the term “rationing” the term “prioritization” has been used since the beginning of the 90s.
[490] Public Law 111-148: “Patient Protection and Affordable Care Act.” 111th U.S. Congress. Signed into law by Barack Obama on March 23, 2010. <www.congress.gov>
Title III—Improving the Quality and Efficiency of Health Care …
Subtitle E—Ensuring Medicare Sustainability …
Sec. 3403. Independent Medicare Advisory Board …
(e) Implementation of Proposal.—
(5) Limitation on Review.—There shall be no administrative or judicial review under section 1869, section 1878, or otherwise of the implementation by the Secretary under this subsection of the recommendations contained in a proposal.
[491] Article: “Obamacare’s Other Unconstitutional Provision.” By Clint Bolick. Hoover Institution, December 16, 2011. <www.hoover.org>
The law directs IPAB [Independent Payment Advisory Board]—a 15-member commission appointed by the president with Senate confirmation, and whose composition (unlike most other agencies) need not be bipartisan—to make annual “legislative proposals” starting in 2014 that will result in reducing the per capita rate of growth in Medicare. The law says that certain proposals are off-limits, including any that “ration health care, raise revenues or increase Medicare beneficiary cost sharing (including deductibles, coinsurance, and copayments), or otherwise restrict benefits or modify eligibility requirements.”
There are three whopping problems with this directive. First, if Medicare beneficiaries cannot be required to pay more and their benefits cannot be reduced, there is only one way to achieve cost-containment: to reduce payments to physicians and hospitals. Those reductions will further diminish the number of Medicare providers and/or reduce the quality of care—in essence, creating precisely the de facto rationing of health-care services the bill supposedly prohibits.
Second, crucial terms such as “rationing” are undefined, and the requirements are confusing and contradictory. Elsewhere, the law directs IPAB to “protect and improve Medicare beneficiaries’ access to necessary and evidence-based items and services.” So IPAB is not allowed to ration health care, but it must decide which services are “necessary and evidence-based”—which, of course, is rationing.
[492] Report: “Justification of Estimates for Appropriations Committees, Fiscal Year 2012.” Centers for Medicare and Medicaid Services, U.S. Department of Health & Human Services. <www.hhs.gov>
Page 154: “More recently, the Affordable Care Act extended funding for CHIP [Children’s Health Insurance Program] through FY [fiscal year] 2015, providing an additional $28.8 billion in budget authority over the baseline.”
Page 157: “[T]he Affordable Care Act extends Federal funding for CHIP through FY 2015, appropriating $19.1 billion in FY 2014 and $21.1 billion in FY 2015.”
[493] Determined with data from:
a) Report: “Estimated Revenue Effects of the Amendment in the Nature of a Substitute to H.R. 4872, the ‘Reconciliation Act of 2010,’ as Amended, in Combination with the Revenue Effects of H.R. 3590, the ‘Patient Protection and Affordable Care Act (‘PPACA’),’ as Passed by the Senate, and Scheduled for Consideration by the House Committee on Rules on March 20, 2010.” United States Congress, Joint Committee on Taxation, March 20, 2010. <www.jct.gov>
NOTES:
b) Report: “Prescription for Change ‘Filled’: Tax Provisions in the Patient Protection and Affordable Care Act, Updated to Reflect Changes Approved in the Reconciliation Act of 2010.” By Clint Stretch and others. Deloitte, March 30, 2010. <www2.deloitte.com>
NOTE: This report contains plain-language explanations of each provision, which Just Facts used to determine the tax category of each provision. (For example, is a provision considered a tax increase or the elimination of a targeted tax deduction?) There is room for subjectivity in making some of these determinations.
|
Provision |
Becomes Effective |
Revenue FY 2010–19 (billions) |
Deloitte Explanation (page #) |
|
40% excise tax on health coverage in excess of $10,200/$27,500 … |
2018 |
$32.00 |
9 |
|
Increase in additional tax on distributions from HSAs and Archer MSAs not used for qualified medical expenses to 20% |
2011 |
$1.40 |
21 |
|
Impose annual fee on manufacturers and importers of branded drugs … |
2010 |
$27.00 |
11 |
|
Impose 2.3% excise tax on manufacturers and importers of certain medical devices |
2013 |
$20.00 |
12 |
|
Impose annual fee on health insurance providers |
2014 |
$60.10 |
10 |
|
$500,000 deduction limitation on taxable year remuneration to officers, employees, directors, and service providers of covered health insurance providers |
2012 |
$0.60 |
14 |
|
Broaden Medicare Hospital Insurance Tax Base for High-Income Taxpayers… |
2013 |
$210.20 |
5–7 |
|
Impose 10% excise tax on indoor tanning services |
2010 |
$2.70 |
12 |
|
Codify economic substance doctrine and impose penalties for underpayments |
2010 |
$4.50 |
18 |
|
Impose Fee on Insured and Self-Insured Health Plans; Patient-Centered Outcomes Research Trust Fund |
2013–2019 |
$2.60 |
12 |
|
TOTAL |
$361.10 |
[494] Report: “Prescription for Change ‘Filled’: Tax Provisions in the Patient Protection and Affordable Care Act, Updated to Reflect Changes Approved in the Reconciliation Act of 2010.” By Clint Stretch and others. Deloitte, March 30, 2010. <www2.deloitte.com>
Page 7:
The Act includes a proposal offered by President Obama for an unearned income Medicare contribution levied on income from interest, dividends, capital gains, annuities, royalties, and rents, other than such income that is derived in the ordinary course of a trade or business and not treated as a passive activity. The Act taxes this income at a rate of 3.8 percent (up from 2.9 percent in the president’s plan). … These thresholds are set at $200,000 for singles and $250,000 for joint filers. …
The new unearned income Medicare contribution applies to taxable years beginning after December 31, 2012.
[495] “2011 Annual Report of the Board of Trustees of the Federal Hospital Insurance and Federal Supplementary Medical Insurance Trust Funds.” United States Department of Health and Human Services, Centers for Medicare and Medicaid Services, May 13, 2011. <www.cms.gov>
Page 20: “The ACA [Affordable Care Act] also specifies that individuals with incomes greater than $200,000 per year and couples above $250,000 will pay an additional ‘Medicare contribution’ of 3.8 percent on some or all of their non-work income (such as investment earnings). However, the revenues from this tax are not allocated to the Medicare trust funds.”
[496] Webpage: “Find Out if Net Investment Income Tax Applies to You.” Internal Revenue Service. Last updated March 29, 2022. <www.irs.gov>
If an individual has income from investments, the individual may be subject to net investment income tax. Effective Jan. 1, 2013, individual taxpayers are liable for a 3.8 percent Net Investment Income Tax on the lesser of their net investment income, or the amount by which their modified adjusted gross income exceeds the statutory threshold amount based on their filing status.
The statutory threshold amounts are:
• Married filing jointly—$250,000,
• Married filing separately—$125,000,
• Single or head of household—$200,000, or
• Qualifying widow(er) with a child—$250,000.
In general, net investment income includes, but is not limited to: interest, dividends, capital gains, rental and royalty income, and non-qualified annuities.
Net investment income generally does not include wages, unemployment compensation, Social Security Benefits, alimony, and most self-employment income.
[497] Report: “Overview of the Federal Tax System as in Effect for 2012.” U.S. Congress, Joint Committee on Taxation, February 24, 2012. <www.jct.gov>
Page 15:
Additional Hospital Insurance Tax on Certain High-Income Individuals
For remuneration received in taxable years beginning after December 31, 2012, the employee portion of the HI [Hospital Insurance] tax is increased by an additional tax of 0.9 percent on wages received in excess of a specific threshold amount.22 However, unlike the general 1.45 percent HI tax on wages, this additional tax is on the combined wages of the employee and the employee’s spouse, in the case of a joint return. The threshold amount is $250,000 in the case of a joint return or surviving spouse, $125,000 in the case of a married individual filing a separate return, and $200,000 in any other case (unmarried individual or head of household).
The same additional HI tax applies to the HI portion of SECA [Self-Employment Contributions Act] tax on self-employment income in excess of the threshold amount. Thus, an additional tax of 0.9 percent is imposed on every self-employed individual on self-employment income in excess of the threshold amount.23 22 Sec, 3101(b), as amended by the Patient Protection and Affordable Care Act (“PPACA”), Pub. L. No. 111-148. 23 Sec.
22 Sec, 3101(b), as amended by the Patient Protection and Affordable Care Act (“PPACA”), Pub. L. No. 111-148.
23 Sec. 1402(b).
[498] “2011 Annual Report of the Board of Trustees of the Federal Hospital Insurance and Federal Supplementary Medical Insurance Trust Funds.” United States Department of Health and Human Services, Centers for Medicare and Medicaid Services, May 13, 2011. <www.cms.gov>
Page 9: “Starting in 2013, high-income workers will pay an additional 0.9 percent tax on their earnings above an unindexed threshold ($200,000 for single taxpayers and $250,000 for married couples).”
[499] Report: “The Excise Tax on High-Cost Employer-Sponsored Health Coverage: Estimated
Economic and Market Effects.” By Jane G. Gravelle. Congressional Research Service, January 12, 2017. <fas.org>
Page 2 (of PDF):
The Patient Protection and Affordable Care Act (ACA; P.L. 111-148, as amended) included a provision to impose an excise tax on high-cost employer-sponsored insurance (ESI) coverage beginning in 2018 (recently delayed until 2020). This provision, popularly termed the Cadillac tax, imposes an excise tax on ESI coverage in excess of a predetermined threshold. The tax is imposed on the coverage provider, typically the health insurance provider or the entity that administers the plan benefits.
Currently, employers’ spending on ESI coverage and most employees’ contributions to ESI plans are exempt from income and payroll taxes. Although proposals to limit the amount of health insurance benefits eligible for this exclusion were considered, the ACA, as enacted, did not limit the exclusion for employer-provided health insurance coverage. The Cadillac tax discourages high-cost employer health plans through another approach.
The Cadillac tax is imposed at a rate of 40%. This tax rate is applied on a tax-exclusive basis, as is generally the case with excise tax rates. That is, like a sales tax, the rate applies to the price or cost excluding the tax. By contrast, the tax rate relevant to an income tax exclusion is on a tax-inclusive basis: it is applied to a base that includes the tax. The Cadillac tax was originally nondeductible from the insurer’s gross income (or the employer’s gross income, in cases where the employer self-insures), but deductibility was allowed in the Consolidated Appropriations Act, 2016 (P.L. 114-113).
The Cadillac tax was originally to take effect in 2018. The Consolidated Appropriations Act delayed the effective date to 2020. The tax is projected to be imposed on plans that cost more than $10,800 for single health plans and $29,100 for non-single (for example, family) plans. The exempt amount is indexed for inflation, and, because health costs tend to grow faster than inflation, the share of premiums covered by the tax and the revenue collected is expected to grow. (The threshold was indexed for health care costs for 2019, however.)
[500] Public Law 114-113: “Consolidated Appropriations Act, 2016 .” 114th Congress. Signed into law by Barack Obama on December 18, 2015. <www.congress.gov>
Title I—High Cost Employer-Sponsored Health Coverage Excise Tax Provisions
Sec. 101. Delay of Excise Tax on High Cost Employer-Sponsored Health Coverage.
(a) In General.—Sections 9001(c) and 10901(c) of the Patient Protection and Affordable Care Act, as amended by section 1401(b) of the Health Care and Education Reconciliation Act of 2010, are each amended by striking “2017” and inserting “2019.”
(b) Conforming Amendment.—Clause (v) of section 4980I(b)(3)(C) of the Internal Revenue Code of 1986 is amended—
(1) by striking “as in effect” and inserting “as determined for,” and
(2) by striking “as so in effect” and inserting “as so determined.”
[501] Public Law 116-94: “Further Consolidated Appropriations Act, 2020.” 116th U.S. Congress. Signed into law by Donald Trump on December 20, 2019. <www.congress.gov>
Sec. 503. Repeal of Excise Tax on High Cost Employer-Sponsored Health Coverage.
(a) In General.—Chapter 43 of the Internal Revenue Code of 1986 is amended by striking section 4980I.
(b) Conforming Amendments.—
(1) Section 6051 of such Code is amended—
(A) by striking “section 4980I(d)(1)” in subsection (a)(14) and inserting “subsection (g)”, and
(B) by adding at the end the following new subsection:
“(g) Applicable Employer-Sponsored Coverage.—For purposes of subsection (a)(14)—
“(1) In General.—The term ‘applicable employer-sponsored coverage’ means, with respect to any employee, coverage under any group health plan made available to the employee by an employer which is excludable from the employee’s gross income under section 106, or would be so excludable if it were employer-provided coverage (within the meaning of such section 106).
“(2) Exceptions.—The term ‘applicable employer-sponsored coverage’ shall not include—
“(A) any coverage (whether through insurance or otherwise) described in section 9832(c)(1) (other than subparagraph (G) thereof) or for long-term care,
“(B) any coverage under a separate policy, certificate, or contract of insurance which provides benefits substantially all of which are for treatment of the mouth (including any organ or structure within the mouth) or for treatment of the eye, or
“(C) any coverage described in section 9832(c)(3) the payment for which is not excludable from gross income and for which a deduction under section 162(l) is not allowable.
“(3) Coverage Includes Employee Paid Portion.—Coverage shall be treated as applicable employer-sponsored coverage without regard to whether the employer or employee pays for the coverage.
“(4) Governmental Plans Included.—Applicable employer-sponsored coverage shall include coverage under any group health plan established and maintained primarily for its civilian employees by the Government of the United States, by the government of any State or political subdivision thereof, or by any agency or instrumentality of any such government.”
(2) Section 9831(d)(1) of such Code is amended by striking “except as provided in section 4980I(f)(4)”.
(3) The table of sections for chapter 43 of such Code is amended by striking the item relating to section 4980I.
(c) Effective Date.—The amendments made by this section shall apply to taxable years beginning after December 31, 2019.
[502] Report: “Prescription for Change ‘Filled’: Tax Provisions in the Patient Protection and Affordable Care Act, Updated to Reflect Changes Approved in the Reconciliation Act of 2010.” By Clint Stretch and others. Deloitte, March 30, 2010. <www2.deloitte.com>
Page 10: “An annual fee will be imposed on covered entities providing health insurance with respect to U.S. health risks. … Effective date – The fee will first be payable in 2014 with respect to net premium written in 2013.”
[503] “Internal Revenue Manual Part 25, Chapter 21, Section 2: Insurance Provider Fee.” Internal Revenue Service. Last updated August 27, 2020. <www.irs.gov>
Background
1. The Patient Protection and Affordable Care Act of 2010 established Provision 9010, which imposes an annual fee on each covered entity engaged in the business of providing health insurance for United States health risks. The insurance provider fee was repealed for calendar years beginning after December 31, 2020.
Authority
1. Section 9010 of the Affordable Care Act of 2010 imposes an annual fee on each covered entity engaged in the business of providing health insurance for calendar years beginning after December 31, 2013. Collection of the fee is suspended for fee years 2017 and 2019 and was repealed for calendar years beginning after December 31, 2020.
2. Section 9010 (b) and (e) provide rules for determining the amount of the annual fee for each covered entity. Section 9010 (b)(1) requires the applicable fee amount for each year to be allocated, using a specified formula, among covered entities with aggregate net premiums written of over $25 million.
[504] Public Law 116-94: “Further Consolidated Appropriations Act, 2020.” 116th U.S. Congress. Signed into law by Donald Trump on December 20, 2019. <www.congress.gov>
Sec. 502. Repeal of Annual Fee on Health Insurance Providers.
(a) In General.—Subtitle A of title IX of the Patient Protection and Affordable Care Act is amended by striking section 9010.
(b) Effective Date.—The amendment made by this section shall apply to calendar years beginning after December 31, 2020.
[505] Report: “Prescription for Change ‘Filled’: Tax Provisions in the Patient Protection and Affordable Care Act, Updated to Reflect Changes Approved in the Reconciliation Act of 2010.” By Clint Stretch and others. Deloitte, March 30, 2010. <www2.deloitte.com>
Page 11: “The Act imposes an annual fee on pharmaceutical manufacturers and importers of branded prescription drugs (including certain biological products). … Effective date – The fee will first be payable in 2011 with respect to sales in 2010.”
[506] Webpage: “Annual Fee on Branded Prescription Drug Manufacturers and Importers.” Internal Revenue Service. Last updated November 2, 2022. <www.irs.gov>
Section 9008 of the Patient Protection and Affordable Care Act (ACA) … as amended by section 1404 of the Health Care and Education Reconciliation Act of 2010 (HCERA) … imposes an annual fee on each covered entity engaged in the business of manufacturing or importing branded prescription drugs, to be paid not later than September 30th of each year. On July 24, 2014, the Internal Revenue Service (IRS) issued final regulations … on the fee. The final regulations describe the rules related to the fee, including how the IRS computes it and how covered entities pay it. The fee applies to calendar years beginning after December 31, 2010. …
In general, the fee is imposed on each covered entity with aggregated branded prescription drug sales of over $5 million to specified government programs or pursuant to coverage under such programs.
[507] Report: “Prescription for Change ‘Filled’: Tax Provisions in the Patient Protection and Affordable Care Act, Updated to Reflect Changes Approved in the Reconciliation Act of 2010.” By Clint Stretch and others. Deloitte, March 30, 2010. <www2.deloitte.com>
Page 12: “The Act imposes an excise tax of 2.3 percent on the sale price of any taxable medical device sold by manufacturers and importers beginning in 2013. Covered devices – The Act generally applies to sales for use in the United States of any medical device (as defined in section 201(h) of the Federal Food, Drug, and Cosmetic Act) intended for humans.”
[508] Public Law 116-94: “Further Consolidated Appropriations Act, 2020.” 116th U.S. Congress. Signed into law by Donald Trump on December 20, 2019. <www.congress.gov>
Sec. 501. Repeal of Medical Device Excise Tax.
(a) In General.—Chapter 32 of the Internal Revenue Code of 1986 is amended by striking subchapter E.
(b) Conforming Amendments.—
(1) Subsection (a) of section 4221 of the Internal Revenue Code of 1986 is amended by striking the last sentence.
(2) Paragraph (2) of section 6416(b) of such Code is amended by striking the last sentence.
(c) Clerical Amendment.—The table of subchapters for chapter 32 of the Internal Revenue Code of 1986 is amended by striking the item relating to subchapter E.
(d) Effective Date.—The amendments made by this section shall apply to sales after December 31, 2019.
[509] Determined with data from:
a) Report: “Estimated Revenue Effects of the Amendment in the Nature of a Substitute to H.R. 4872, the ‘Reconciliation Act of 2010,’ as Amended, in Combination with the Revenue Effects of H.R. 3590, the ‘Patient Protection and Affordable Care Act (‘PPACA’),’ as Passed by the Senate, and Scheduled for Consideration by the House Committee on Rules on March 20, 2010.” United States Congress, Joint Committee on Taxation, March 20, 2010. <www.jct.gov>
NOTES:
b) Report: “Prescription for Change ‘Filled’: Tax Provisions in the Patient Protection and Affordable Care Act, Updated to Reflect Changes Approved in the Reconciliation Act of 2010.” By Clint Stretch and others. Deloitte, March 30, 2010. <www2.deloitte.com>
NOTE: This report contains plain-language explanations of each provision, which Just Facts used to determine the tax category of each provision. (For example, is a provision considered a tax increase or the elimination of a targeted tax deduction?) There is room for subjectivity in making some of these determinations.
|
Provision |
Effective |
Revenue FYs 2010–19 (billions $) |
Deloitte Explanation (page #) |
|
Conform the definition of medical expenses for health savings accounts … to the definition of the itemized deduction for medical expenses (excluding over-the-counter medicines prescribed by a physician) |
2011 |
$5.00 |
20 |
|
Limit health flexible spending arrangements in cafeteria plans to $2,500; indexed to CPI-U after 2013 |
2013 |
$13.00 |
20 |
|
Eliminate deduction for expenses allocable to Medicare Part D subsidy |
2013 |
$4.50 |
13 |
|
Raise 7.5% AGI floor on medical expenses deduction to 10% … |
2013 |
$15.20 |
21 |
|
Modification of section 833 treatment of certain health organizations |
2010 |
$0.40 |
17 |
|
Exclusion of unprocessed fuels from the cellulosic biofuel producer credit |
2010 |
$23.60 |
17 |
|
TOTAL |
$61.70 |
[510] Determined with the sources cited in the footnote above:
|
Provision |
Effective |
Revenue FYs 2010–19 (billions $) |
Deloitte Explanation (page #) |
|
Qualifying therapeutic discovery project credit |
2010 |
–$0.9 |
16 |
|
Exclusion for assistance provided to participants in State student loan repayment programs for certain health professionals |
2009 |
–$0.1 |
21 |
|
Make the adoption credit refundable; increase qualifying expenses threshold, and extend the adoption credit through 2011 |
2010 |
–$1.2 |
21 |
|
TOTAL |
–$2.2 |
[511] Report: “Summary of Republican Amendments Submitted for H.R. 4872—Health Care and Education Reconciliation Act of 2010.” Republican Study Committee, August 2010. <rsc-banks.house.gov>
Page 2: “No less than 101 amendments were submitted to the Rules Committee, and no less than 10 amendments were submitted to the Budget Committee. As part of the Democrat majority’s plan to silence the Republican minority, none of the following amendments were adopted in the Reconciliation bill.”
[512] Report: “Summary of Republican Amendments Submitted for H.R. 4872—Health Care and Education Reconciliation Act of 2010.” Republican Study Committee, August 2010. <rsc-banks.house.gov>
Page 7:
Summary: … The OPTION [Offering Patients True and Individualized Options Now] Act will extend the tax deduction on health care premiums to all individuals, making health care expenses totally deductible for individuals, and not just businesses. All expenses currently allowed to be purchased with Health Savings Accounts (HSAs) will be tax deductible also. Individuals who have employer health care plans but still incur costs on medical expenses, deductibles, premiums, pharmaceuticals (prescribed, over the counter, etc.), or any medical related expenses would qualify for this deduction. Medicare recipients will also be allowed to deduct their Medicare supplemental insurance premiums.
Action: The amendment was rejected by a vote of 9 to 4. This amendment was previously introduced as stand-alone legislation on October 21, 2009, H.R. 3889, Offering Patients True and Individualized Options Now Act.
Page 8: “Summary: This amendment would allow for 100% deductibility of individual medical expenses. Action: The amendment was rejected by a vote of 9 to 4.”
[513] Report: “Summary of Republican Amendments Submitted for H.R. 4872—Health Care and Education Reconciliation Act of 2010.” Republican Study Committee, August 2010. <rsc-banks.house.gov>
Pages 17–18:
Summary: This amendment would repeal the enactment of the Independent Medicare Advisory Board … which was renamed the Independent Payment Advisory Board (IPAB), made up of non-elected government bureaucrats that are empowered to make arbitrary cuts to Medicare providers and make recommendations to non-federal health programs that will limit access to care for seniors. Congress would be required to consider legislation implementing the proposal or alternative proposals with the same budgetary impact on a fast track basis. The recommendations of the board would go into effect automatically unless blocked by subsequent legislative action. …
Action: The amendment was rejected by a vote of 9 to 4. This amendment was introduced in March 2010 as stand-alone legislation, H.R. 4985, the Medicare Decisions Accountability Act of 2010.
[514] Report: “Summary of Republican Amendments Submitted for H.R. 4872—Health Care and Education Reconciliation Act of 2010.” Republican Study Committee, August 2010. <rsc-banks.house.gov>
Page 4:
Summary: This amendment would require that all individuals under Medicaid have to demonstrate their identity and citizenship. Currently, there are 11.1 million illegal aliens residing in the United States. This amendment would prevent the crippling burden of providing free health care to these non-citizens from falling on the shoulders of the U.S. taxpayer.
Action: The Democrat majority did not consider this amendment in committee. Rep. Deal introduced a similar amendment in the House Energy & Commerce Committee mark-up of H.R. 3200, which was rejected.
Page 16:
Summary: This amendment would require a valid photo ID when applying for Medicaid or SCHIP [State Children’s Health Insurance Program]. While the bill requires that applicants give a social security number, it contains no requirement that an individual show a valid ID in order to match the individual with the social security number provided—thus creating a vast opportunity for fraud and abuse.
Action: The amendment was rejected by a vote of 9 to 4.
Page 25:
Summary: This amendment would require any individual who wishes to access to a health Exchange or affordability tax credits to provide documentation of citizenship or nationality. The Senate bill contains the same insufficient and ineffective verification methods as the House, causing some to be concerned that it would still allow for illegal immigrants to access the Exchange and subsidies.
Action: The Democrat majority did not consider this amendment in committee.
[515] Report: “Summary of Republican Amendments Submitted for H.R. 4872—Health Care and Education Reconciliation Act of 2010.” Republican Study Committee, August 2010. <rsc-banks.house.gov>
Page 8:
Summary: This amendment would repeal the individual mandate. PPACA [Patient Protection and Affordable Care Act] imposes $17 billion tax increase for non-compliance with the individual mandate. Furthermore, the individual mandate necessitates a government definition of acceptable health care coverage. Because the benefit package found in the Democrats’ health care bills are quite large (or in some cases still to be determined by an unelected bureaucratic board of the Secretary of HHS [Health and Human Services]), it is likely that millions of Americans would be unable to keep their existing health care coverage and be forced to pay for more expensive health insurance or pay a fine. CBO [Congressional Budget Office] found that 3.9 million Americans would pay $17 billion in taxes.
Action: The Democrat majority did not consider this bill in committee.
[516] Report: “Summary of Republican Amendments Submitted for H.R. 4872—Health Care and Education Reconciliation Act of 2010.” Republican Study Committee, August 2010. <rsc-banks.house.gov>
Pages 22–23:
Summary: This amendment would add a section on interstate purchasing of health insurance, which was previously introduced as H.R. 3217, Health Care Choice Act of 2009. This Act empowers consumers by giving them the ability to purchase an affordable health insurance policy with a range of options. It will allow consumers to purchase health insurance licensed in other states—expanding choice and increasing affordability. Interstate shopping is vital to bringing prices down through free enterprise. The National Center for Policy Analysis notes that a healthy 25-year-old male could purchase a basic health insurance policy in Kentucky for $960 a year. That same policy in New Jersey, however, would cost $5,880 a year. The Health Care Choice Act would enable the market to mitigate such enormous price differentials.
Action: The amendment was rejected by a vote of 9 to 4. This amendment was previously introduced on July 14, 2009 as stand-alone legislation, H.R. 3217, Health Care Choice Act of 2009.
Pages 33–34:
Summary: This amendment would force health insurance companies to compete across state lines, which expands consumers’ choice and increases affordability. Interstate shopping is vital to bringing down prices down through free enterprise.
Action: The Democrat majority did not consider this bill in committee. Rep. John Shadegg introduced similar stand-alone legislation, H.R. 3217, the Health Care Choices Act of 2009.
[517] Report: “Summary of Republican Amendments Submitted for H.R. 4872—Health Care and Education Reconciliation Act of 2010.” Republican Study Committee, August 2010. <rsc-banks.house.gov>
Page 25:
Summary: This amendment would extend the protection of existing coverage in section 1251, “Preservation of Right to Maintain Existing Coverage,” to those who are enrolled after the date of enactment. This amendment would change the section of the bill entitled “Protecting the Choice to keep Current Coverage” to include appropriate language in keeping with this section’s title. Currently, this section contains language forcing all employer health plans to comply with new mandates from the Secretary of HHS [Health and Human Services] within five years of the bill’s enactment, thus essentially preventing Americans from keeping their current plans. This amendment would replace these provisions with the statement “Nothing in this Act shall be construed to prevent or limit individuals from keeping their current health coverage.” This language far more closely represents the section title’s intent as well as President Obama’s promise to the American people.
Action: The Democrat majority did not consider this amendment in committee. This amendment was previously introduced and rejected in House Energy & Commerce Committee mark-up of H.R. 3200.
[518] Calculated with data from:
a) Video: “36 Times Obama Said You Could Keep Your Health Care Plan.” Accessed September 28, 2015 at <www.youtube.com>
October 7, 2008: “If you’ve got health care already, then you can keep your plan if you are satisfied with it.”
June 5, 2009: “If you like the plan you have, you can keep it.”
June 11, 2009: “I intend to keep this promise. … If you like your health care plan, you’ll be able to keep your health care plan.”
June 12, 2009: “If you like your plan and your doctor, you can keep them.”
June 15, 2009: “You’ll be able to keep your health care plan.”
June 23, 2009: “If you like your plan, you keep your plan.”
July 16, 2009: “You like your doctor; you like your plan. You can keep your doctor; you can keep your plan.”
July 17, 2009: “You like your current insurance, you keep that insurance. Period. End of story.”
July 23, 2009: “If you’ve got health insurance, you can keep it.”
July 27, 2009: “If you have insurance that you like, then you will be able to keep that insurance.”
July 29, 2009: “If you like your health care plan, you keep your health care plan.”
July 29, 2009: “Nobody’s going to force you to leave your health care plan.”
July 29, 2009: “If you like your health care plan, you will keep your plan.”
August 7, 2009: “If you like your health care plan, you can keep your health care plan.”
August 11, 2009: “If you like your health care plan, you can keep your health care plan.”
August 14, 2009: “No matter what you’ve heard. If you like your doctor or health care plan, you can keep it.”
August 14, 2009: “If you like your health care plan, you can keep your health care plan.”
August 20, 2009: “If you like your private health insurance plan, you can keep it.”
August 21, 2009: “If you like your private health insurance plan, you can keep your plan. Period.”
September 9, 2009: “Nothing in this plan will require you or your employer to change the coverage or the doctor you have.”
September 11, 2009: “If you are among the hundreds of millions of Americans who already have insurance, nothing in my plan will require you or your employer to change the coverage or the doctor you have.”
January 29, 2010: “If you wanna keep the health insurance you got, you can keep it.”
March 3, 2010: “If you like your plan, you can keep your plan.”
March 5, 2010: “If you like the insurance plan you have now, you can keep it.”
March 8, 2010: “If you like your plan, you can keep your plan.”
March 15, 2010: “If you like your plan, you can keep your plan.”
March 19, 2010: “If you like your plan, keep your plan.”
March 23, 2010: “If you like your current insurance, you will keep your current insurance.”
April 1, 2010: “If you like your insurance plan, you will keep it.”
September 29, 2010: “If you’re happy with what you’ve got, nobody’s changing it.”
June 28, 2012: “If you are one of the more than 250 million Americans who already have health insurance, you will keep your health insurance.”
July 6, 2012: “If you have health insurance, the only thing that changes for you is: you’re more secure.”
July 13, 2012: “If you already have health care, the only thing this bill does is make sure that it’s even more secure.”
October 3, 2012: “If you’ve got health insurance, you keep your own insurance.”
September 26, 2013: “Today I wanna speak plainly, clearly, honestly. … If you already have health care, you don’t have to do anything.”
October 25, 2013: “Everyone who already has health insurance will keep the benefits and protections this law already has put into place.”
b) Video: “Obama Montage: If You Like Your Doctor You Can Keep Your Doctor.” Accessed September 28, 2015 at <www.youtube.com>
June 11, 2009: “If you like the doctor you have, you can keep your doctor.”
August 15, 2009: “If you like your doctor or health care plan, you can keep it.”
August 20, 2009: “If you like your doctor, you can keep your doctor.”
August 22, 2009: “If you like your doctor, you can keep your doctor.”
January 27, 2010: “Our approach would preserve the right of Americans who have insurance to keep their doctor and their plan.”
NOTE: Between October 2008 and October 2013, Barack Obama gave some variation of the following pledge on 39 separate occasions, including the pledge cited in the footnote above: “If you like your health care plan, you can keep your health care plan.” He also gave some variation of the following pledge on 11 separate occasions, including the pledge cited in the footnote above: “If you like your doctor, you can keep your doctor.”
[519] Transcript: “Remarks by the President to the Annual Conference of the American Medical Association.” White House, Office of the Press Secretary, June 15, 2009. <obamawhitehouse.archives.gov>
So let me begin by saying this to you and to the American people: I know that there are millions of Americans who are content with their health care coverage—they like their plan and, most importantly, they value their relationship with their doctor. They trust you. And that means that no matter how we reform health care, we will keep this promise to the American people: If you like your doctor, you will be able to keep your doctor, period. (Applause.) If you like your health care plan, you’ll be able to keep your health care plan, period. (Applause.) No one will take it away, no matter what. My view is that health care reform should be guided by a simple principle: Fix what’s broken and build on what works.
[520] Article: “Obamacare: More Than 2 Million People Getting Booted From Existing Health Insurance Plans.” CBS News, October 30, 2013. <www.cbsnews.com>
CBS News has learned more than two million Americans have been told they cannot renew their current insurance policies—more than triple the number of people said to be buying insurance under the new Affordable Care Act, commonly known as Obamacare.
There have been estimates about hundreds of thousands of people losing coverage, CBS News’ Jan Crawford reported on “CBS This Morning.” CBS News has reached out to insurance companies across the country to determine some of the real numbers—and this is just the tip of the iceberg, Crawford said. The people who are opening the letters are shocked to learn they can’t keep their insurance policies despite President Obama’s assurances to the contrary.
The White House is on the defensive trying to explain it, after Mr. Obama repeatedly said, “If you like your doctor or health care plan, you can keep it.” …
It’s an unexpected reality of Obamacare being told through anecdotes in local papers and on social media. But the hard numbers reveal the evidence is far more than anecdotal. CBS News has confirmed with insurance companies across the country that more than two million people are getting notices they no longer can keep their existing plans. In California, there are 279,000; in Michigan, 140,000; Florida, 300,000; and in New Jersey, 800,000. And those numbers are certain to go even higher. Some companies who tell CBS News they’ve sent letters won’t say how many.
NOTE: This article and the one below use the term “people,” but the context suggests that these figures may actually refer to people who received cancelation notices. In cases where these insurance policies covered families, the number of people who lost their health insurance would be multiplicatively higher.
[521] Article: “Policy Notifications and Current Status, by State.” Associated Press, December 26, 2013. <news.yahoo.com>
Millions of Americans who buy their own health insurance were informed this fall that their policies would no longer be offered starting in 2014 because they do not meet the higher standards of the federal Affordable Care Act. The actual number of people receiving the notices is unclear, in part because officials in nearly 20 states say they do not have the information or are not tracking it.
Some states tracked the policy notifications through their insurance departments or health care exchanges. In other states, the largest private insurers released the number of discontinuation notices they issued.
President Barack Obama then said insurance companies could allow the older policies to continue, but left that decision to the states and individual insurers. The response has been mixed.
This chart shows that at least 4.7 million Americans received the cancellation notices. It also provides details about what decision has been made in each state since Obama’s announcement (some states had previously decided to allow insurers to continue older policies for a limited time).
It reflects reporting by AP staffers in every state and the District of Columbia and does not include policy cancelations in the small-business insurance market.
[522] Article: “How Many Nongroup Policies Were Canceled? Estimates From December 2013.” By Lisa Clemans-Cope and Nathaniel Anderson. Health Affairs, March 3, 2014. <healthaffairs.org>
[I]n December 2013, the Health Reform Monitoring Survey (HRMS) asked a sample of adults (age 18–64) the following question: “Did you receive a notice in the past few months from a health insurance company saying that your policy is cancelled or will no longer be offered at the end of 2013?” These survey data are self-reports and thus likely measured with some error. …
The findings from HRMS show that nearly one in five (18.6 percent) of those with nongroup health insurance at the time of the survey report the plan they had in 2013 will no longer be offered to them because it did not meet new coverage requirements. Estimates from the NHIS [National Health Interview Survey] indicate that approximately 14 million people had non-group coverage at a point in time. Identifying the number of people enrolled in non-group insurance is challenging. Estimates in Abraham and others (2013) ranged from 9.55 million in the Medical Expenditure Panel Survey to 25.3 million in the American Community Survey. We use the NHIS estimate since it corresponds with more recent estimates based on new NAIC [National Association of Insurance Commissioners] enrollment data reported in the Supplemental Health Care Exhibit (SHCE).
Using this estimate, our findings imply that roughly 2.6 million people would have reported that their plan would no longer be offered due to noncompliance with the ACA [Affordable Care Act]. Another 6 percent reported that their plan was cancelled for other reasons, and 75.4 percent reported that they did not receive a notice of cancellation (figure 1).
NOTES:
[523] Memo: “Options Available for Consumers with Cancelled Policies.” Department of Health & Human Services, Centers for Medicare & Medicaid Services, Center for Consumer Information & Insurance Oversight, December 19, 2013. <www.cms.gov>
Page 1:
The Affordable Care Act provides many new consumer protections. In some instances, health insurance issuers in the individual and small group markets are cancelling policies that do not include the new protections for policy or plan years beginning in 2014. Because some consumers were finding other coverage options to be more expensive than their cancelled plans or policies, President Obama announced a transition period allowing for the renewal of cancelled plans and policies between January 1 and October 1, 2014, under certain circumstances. Some states have adopted the transitional policy, enabling health insurance issuers to renew their existing plans and policies. Some health insurance issuers are not renewing cancelled plans or policies. …
If your health insurance policy has been cancelled, a number of options are already available to you: …
• You may shop for coverage through the Health Insurance Marketplace (the Marketplace). Depending on your income and other factors, you may be eligible to receive a premium tax credit that will help cover the cost of purchasing coverage through the Marketplace or cost-sharing reductions for Marketplace coverage.
NOTE: Click here for more information about “the Marketplace” (a.k.a. Obamacare exchanges).
[524] Report: “Exchange Plans Include 34 Percent Fewer Providers than the Average for Commercial Plans.” By Chris Sloan and Elizabeth Carpenter. Avalere Health, July 15, 2015. <avalere.com>
New analysis from Avalere finds that the average provider networks for plans offered on the health insurance exchanges created by the Affordable Care Act (ACA) include 34 percent fewer providers than the average commercial plan offered outside the exchange. The new data quantifies anecdotal reports that exchange networks contain fewer providers than traditional commercial plans. …
Specifically, the analysis finds that exchange plan networks include 42 percent fewer oncology and cardiology specialists; 32 percent fewer mental health and primary care providers; and 24 percent fewer hospitals.
“Patients should evaluate a plan’s provider network when picking insurance on the exchange,” said Elizabeth Carpenter, vice president at Avalere. “Out-of-network care does not accrue toward out-of-pocket maximums, leaving consumers vulnerable to high costs if they seek care from a provider not included in their plan’s network.”
Avalere examined the largest rating region in the top five states by 2015 exchange effectuated enrollment: Florida, California, Texas, Georgia, and North Carolina. In each of these rating regions, Avalere compared the average number of providers included, for each of the five provider types examined, in exchange networks compared to commercial networks in the same geographic area. Commercial network data includes plans offered in the group and individual markets outside the exchange.
NOTE: Credit for bringing this to the attention of Just Facts belongs to Chris Rauber. [Article: “Just How Narrow Are Obamacare’s ‘Narrow Networks’?” By Chris Rauber. San Francisco Business Times, July 15, 2015. <www.bizjournals.com>]
[525] Memo: “Options Available for Consumers with Cancelled Policies.” Health & Human Services, Centers for Medicare & Medicaid Services, Center for Consumer Information & Insurance Oversight, December 19, 2013. <www.cms.gov>
Page 1:
The Affordable Care Act provides many new consumer protections. In some instances, health insurance issuers in the individual and small group markets are cancelling policies that do not include the new protections for policy or plan years beginning in 2014. Because some consumers were finding other coverage options to be more expensive than their cancelled plans or policies, President Obama announced a transition period allowing for the renewal of cancelled plans and policies between January 1 and October 1, 2014, under certain circumstances. Some states have adopted the transitional policy, enabling health insurance issuers to renew their existing plans and policies. Some health insurance issuers are not renewing cancelled plans or policies. …
If your health insurance policy has been cancelled, a number of options are already available to you:
… You may also be eligible for Medicaid.
[526] “2011 Annual Report of the Board of Trustees of the Federal Hospital Insurance and Federal Supplementary Medical Insurance Trust Funds.” United States Department of Health and Human Services, Centers for Medicare and Medicaid Services, May 13, 2011. <www.cms.gov>
Pages 265–266:
Statement of Actuarial Opinion …
By the end of the long-range projection period, Medicare prices for hospital, skilled nursing facility, home health, hospice, ambulatory surgical center, diagnostic laboratory, and many other services would be less than half of their level under the prior law. Medicare prices would be considerably below the current relative level of Medicaid prices, which have already led to access problems for Medicaid enrollees, and far below the levels paid by private health insurance. Well before that point, Congress would have to intervene to prevent the withdrawal of providers from the Medicare market and the severe problems with beneficiary access to care that would result.
[527] Article: “Matt Bevin, Owner Of East Hampton Bell Factory, Elected Kentucky Governor.” Associated Press, November 3, 2015. <www.courant.com>
Stanley and Deborah Harp own their own business in Georgetown. They had health insurance, but the type of plan they had vanished after the Affordable Care Act went into effect. They couldn’t afford their new health insurance premiums, but they did qualify for the expanded Medicaid program. Even though they now have free health insurance, they aren’t happy about it. They had to leave the doctor they had been using for 20 years.
“We’ve had the same doctor groups for the past 20 years who have our history, our kids had as pediatricians,” said Deborah Harp, adding that she voted for Bevin.
[528] Paper: “Auditing Access to Specialty Care for Children with Public Insurance.” By Joanna Bisgaier and Karin V. Rhodes. New England Journal of Medicine, June 16, 2011. Pages 2324–2333. <www.nejm.org>
Page 2324:
Methods
Between January and May 2010, research assistants called a stratified, random sample of clinics representing eight specialties in Cook County, Illinois, which has a high proportion of specialists. Callers posed as mothers of pediatric patients with common health conditions requiring outpatient specialty care. Two calls, separated by 1 month, were placed to each clinic by the same person with the use of a standardized clinical script that differed by insurance status.
Results
We completed 546 paired calls to 273 specialty clinics and found significant disparities in provider acceptance of Medicaid-CHIP [Children’s Health Insurance Program] versus private insurance across all tested specialties. Overall, 66% of Medicaid-CHIP callers (179 of 273) were denied an appointment as compared with 11% of privately insured callers (29 of 273) (relative risk, 6.2; 95% confidence interval [CI], 4.3 to 8.8; P<0.001). Among 89 clinics that accepted both insurance types, the average wait time for Medicaid-CHIP enrollees was 22 days longer than that for privately insured children (95% CI, 6.8 to 37.5; P=0.005).
[529] Video: “Obama Promises to Lower Health Insurance Premiums by $2,500 Per Year.” Accessed February 8, 2018 at <www.youtube.com>
January 3, 2008: “And if you already have health care, then we’re gonna reduce costs an average of $2,500 per family on premiums.”
February 19, 2008: “And if you already have health insurance, we will lower your premiums by $2,500 per family per year.”
February 23, 2008: “And we will lower premiums for the typical family by $2,500 a year.”
March 1, 2008: “We’ll work with your employer to lower your premiums by $2,500 per family per year.”
March 13, 2008 “And cut the cost of a typical family’s premiums by up to $2,500 per family per year.”
March 14, 2008: “And if you’ve got health care, we’re gonna work with your employer to lower your premiums by $2,500 per family per year.”
April 22, 2008: “We’re gonna work with your employer through a catastrophic reinsurance plan to lower premiums by about $2,500 per family per year.”
April 20, 2008 “If your employer does offer you healthcare, then we’re gonna work with your employer to lower premiums by up to $2,500 per family per year.”
May 3, 2008: “I also have a health care plan that would save the average family $2,500 on their premiums.”
May 30, 2008 “And reduces every family’s premiums by as much as $2,5000.”
June 17, 2007 “And cut the cost of healthcare by up to $2,500 per family.”
June 27, 2008: “It’s time to bring down the typical family premium by $2,500. And it’s time to bring down the costs for the entire country.”
August 6, 2008 “A system where we’re gonna work with your employers to lower your premiums by up to $2,500 per family per year.”
August 17, 2008 “And if you already have healthcare, then we’re gonna work with your employer to lower your premiums, by up to $2,500 per family per year.”
September 6, 2008 “Here’s what change is: saying to people who already have health insurance and the employers who are providing it, we’ll work to lower your premiums, by up to $2,500 per family per year.”
October 4, 2008 “We will start by reducing premiums by as much as $2,500 per family.”
October 7, 2008 “We’re gonna work with your employer to lower the costs of your premiums by up to $2,500 per year.”
October 15, 2008: “The only thing we’re gonna try to do is lower costs so that those cost savings are passed on to you. And we estimate we can cut the average family’s premium by about $2,500 per year.”
[530] Video: “Obama Promises to Lower Health Insurance Premiums by $2,500 Per Year.” Accessed February 8, 2018 at <www.youtube.com>
Time marker 0:24: “I also have a health care plan that would save the average family $2,500 on their premiums.”
[531] Video: “Obama Promises to Lower Health Insurance Premiums by $2,500 Per Year.” Accessed February 8, 2018 at <www.youtube.com>
Time marker 2:01: We’ll work with your employer to lower your premiums by $2,500 per family per year.
[532] Calculated with data from:
a) Report: “Employer Health Benefits: 2022 Annual Survey.” Kaiser Family Foundation, NORC at the University of Chicago, and Davis Research, November 8, 2022. <files.kff.org>
Page 40: “Figure 1.12 Average Annual Premiums for Single and Family Coverage, 1999–2022”
b) Dataset: “CPI—All Urban Consumers (Current Series).” U.S. Department of Labor, Bureau of Labor Statistics. Accessed February 5, 2022 at <www.bls.gov>
“Series Id: CUUR0000SA0; Series Title: All Items in U.S. City Average, All Urban Consumers, Not Seasonally Adjusted; Area: U.S. City Average; Item: All Items; Base Period: 1982–84=100”
NOTE: An Excel file containing the data and calculations is available upon request.
[533] “WHO Director-General’s Opening Remarks at the Media Briefing on Covid-19.” World Health Organization, March 11, 2020. <bit.ly>
[Dr. Tedros Adhanom Ghebreyesus:] …
WHO [World Health Organization] has been assessing this outbreak around the clock and we are deeply concerned both by the alarming levels of spread and severity, and by the alarming levels of inaction.
We have therefore made the assessment that COVID-19 can be characterized as a pandemic.
[534] Press release: “COVID-19 and Other Global Health Issues.” World Health Organization, May 5, 2023. <www.justfacts.com>
[Dr. Tedros Adhanom Ghebreyesus:] …
Yesterday, the Emergency Committee met for the 15th time and recommended to me that I declare an end to the public health emergency of international concern. I have accepted that advice. It’s therefore with great hope that I declare COVID-19 over as a global health emergency.
[535] Report: “Estimated Financial Effects of the ‘Patient Protection and Affordable Care Act,’ as Amended.” By Richard S. Foster. U.S. Department of Health & Human Services, Centers for Medicare and Medicaid Services, Office of the Actuary, April 22, 2010. <www.cms.gov>
Page 2:
The estimated costs and savings shown in the table are based on the effective dates specified in the law as enacted. Additionally, we assume that employers and individuals would take roughly 3 to 5 years to fully adapt to the new insurance coverage options and that the enrollment of additional individuals under the Medicaid coverage expansion would be completed by the third year of implementation. Because of these transition effects and the fact that most of the coverage provisions would be in effect for only 6 of the 10 years of the budget period, the cost estimates shown in this memorandum do not represent a full 10-year cost for the new legislation.
[536] Report: “Estimated Financial Effects of the ‘Patient Protection and Affordable Care Act,’ as Amended.” By Richard S. Foster. U.S. Department of Health & Human Services, Centers for Medicare and Medicaid Services, Office of the Actuary, April 22, 2010. <www.cms.gov>
Pages 4–5:
We estimate … $575 billion in net savings for the Medicare provisions, a net cost of $28 billion for the Medicaid/CHIP [Children’s Health Insurance Program] provisions (excluding the expansion of Medicaid eligibility and the additional CHIP funding), $2 billion in savings from provisions intended to help reduce the rate of growth in health spending … and $10 billion in costs for the immediate insurance reforms. …
… ($410 billion) can be attributed to expanding Medicaid coverage for all adults who live in households with incomes below 133 percent of the FPL [federal poverty level]. … [A]dditional funding for the CHIP program for 2014 and 2015, which would increase such expenditures by an estimated $29 billion. [R]efundable tax credits and reduced cost-sharing requirements for low-to-middle-income enrollees purchasing health insurance through the Exchanges ($507 billion) and credits for small employers who choose to offer insurance coverage ($31 billion).
[537] Report: “Estimated Financial Effects of the ‘Patient Protection and Affordable Care Act,’ as Amended.” By Richard S. Foster. U.S. Department of Health & Human Services, Centers for Medicare and Medicaid Services, Office of the Actuary, April 22, 2010. <www.cms.gov>
Pages 4–5:
We estimate … $38 billion in net savings from the CLASS [Community Living Assistance Services and Supports] program….
The increases in Federal expenditures would be partially offset by the penalties paid by affected individuals who choose to remain uninsured and employers who opt not to offer coverage; such penalties total $120 billion through fiscal year 2019….
[538] Calculated with data from the report: “Estimated Revenue Effects of the Amendment in the Nature of a Substitute to H.R. 4872, the ‘Reconciliation Act of 2010,’ as Amended, in Combination with the Revenue Effects of H.R. 3590, the ‘Patient Protection and Affordable Care Act (‘PPACA’),’ as Passed by the Senate, and Scheduled for Consideration by the House Committee on Rules on March 20, 2010.” United States Congress, Joint Committee on Taxation, March 20, 2010. <www.jct.gov>
“Fiscal years 2010–19 … [Billions of Dollars] … 6. Require information reporting on payments to corporations [=] 17.1 … NET TOTAL [=] 437.8”
NOTE: Revenue provision # 6 (Require information reporting on payments to corporations) has been repealed and is thus subtracted from the total. [Article: “President Signs Repeal of Expanded 1099 Requirements.” Journal of Accountancy, April 14, 2011. <www.journalofaccountancy.com>]
CALCULATION: $437.8 net total – $17.1 repeal of revenue provision # 6 = $420.7
[539] Calculated with data from the three preceding footnotes.
CALCULATION: $579 billion revenue increase – $438 billion spending increase = $141 billion
[540] This figure of $141 billion, which was calculated by Just Facts using data from the Joint Committee on Taxation and the Centers for Medicare and Medicaid Services, is $17 billion higher than the projection of the Congressional Budget Office.† In keeping with our Standards of Credibility, we are citing the higher of these numbers to give “preferentiality to figures that are contrary to our viewpoints.”
NOTE: † Testimony: “CBO’s [Congressional Budget Office’s] Analysis of the Major Health Care Legislation Enacted in March 2010.” By Douglas W. Elmendorf. Congressional Budget Office, March 30, 2011. <www.cbo.gov>
Page 2: “Table 1. Estimated Budgetary Effects of the Enactment of PPACA [Patient Protection and Affordable Care Act] and the Health Care Provisions of the Reconciliation Act … (Billions of dollars, by fiscal year) … March 2010 Estimates … Net Increase or Decrease (-) in the Deficit … 2010–2019 [=] –124”
[541] “2011 Annual Report of the Board of Trustees of the Federal Hospital Insurance and Federal Supplementary Medical Insurance Trust Funds.” United States Department of Health and Human Services, Centers for Medicare and Medicaid Services, May 13, 2011. <www.cms.gov>
Page 266: “Overriding the [Affordable Care Act] productivity adjustments, as Congress has done repeatedly in the case of physician payment rates, would lead to far higher costs for Medicare in the long range than those projected under current law.”
[542] Report: “Projected Medicare Expenditures Under an Illustrative Scenario with Alternative Payment Updates to Medicare Providers.” By John D. Shatto and M. Kent Clemens. U.S. Department of Health and Human Services, Centers for Medicare and Medicaid Services, Office of the Actuary, July 13, 2017. <www.cms.gov>
Page 2:
As described in more detail below, in our view there is a strong likelihood that the scheduled physician payment updates and the productivity adjustments will not be achievable in the long range. It is reasonable to expect that Congress would find it necessary to legislatively override or otherwise modify the reductions in the future to ensure that Medicare beneficiaries continue to have access to health care services. If these payment reductions were moderated or removed, estimated Medicare costs would exceed the thresholds that would require the Independent Payment Advisory Board (IPAB) to develop proposals to reduce the growth rate below the threshold, which would be quite challenging.
Page 6: “The increasing differential between Medicare and private payment rates is due to the productivity adjustments in 2012 and later for the Medicare payment updates (and, to a lesser degree, to the other, smaller downward adjustments in 2010–2019 specified by the ACA [Affordable Care Act] in addition to the productivity adjustments).”
Page 9:
Over time, unless providers could alter their use of inputs to reduce their cost per service correspondingly, Medicare’s payments for health services would fall increasingly below providers’ costs. Providers could not sustain continuing negative margins and would have to withdraw from serving Medicare beneficiaries or (if total facility margins remained positive) shift substantial portions of Medicare costs to their non-Medicare, non-Medicaid payers. Under such circumstances, lawmakers might feel substantial pressure to override the productivity adjustments, much as they did to prevent reductions in physician payment rates while the SGR [sustainable growth rate] was in effect.
Page 10: “The Balanced Budget Act of 1997 decreased the payment updates for inpatient hospital services for 1998 through 2002. Some of these reductions were overridden with subsequent legislation….”
[543] “2017 Annual Report of the Board of Trustees of the Federal Hospital Insurance and Federal Supplementary Medical Insurance Trust Funds.” United States Department of Health and Human Services, Centers for Medicare and Medicaid Services, July 13, 2017. <www.cms.gov>
Page 256:
The methods for updating Medicare payment rates are specified by law and may prove challenging to implement without serious consequences for program access or quality. In particular, physician payment rate updates are not expected to keep up with underlying physician costs, and the annual price updates for most categories of non-physician health services will be adjusted downward each year by the growth in economy-wide productivity. Sustaining these price reductions will be challenging for health care providers, as the best available evidence indicates that most providers cannot improve their productivity to this degree for a prolonged period given the labor-intensive nature of these services.
Absent an unprecedented change in health care delivery systems and payment mechanisms, the prices paid by Medicare for most health services will fall increasingly short of the cost of providing such services. If this issue is not addressed by subsequent legislation, it is likely that access to, and quality of, Medicare benefits would deteriorate over time for beneficiaries. Overriding the price updates specified in current law, as lawmakers repeatedly did in the case of physician payment rates under the SGR [sustainable growth rate] formula, would lead to substantially higher costs for Medicare in the long range than those projected in this report.
[544] Article: “Obama Administration Retreats On Private Medicare Rate Cuts.” By Jay Hancock. Kaiser Family Foundation, Kaiser Health News, April 8, 2014. <khn.org>
After estimating in February that the cuts required by the Affordable Care Act as well as other adjustments would reduce what it pays insurers next year by 1.9 percent per beneficiary, the Department of Health and Human Services (HHS) said Monday it would instead give Medicare Advantage plans a raise of 0.4 percent. …
HHS holds wide latitude to adjust payments beyond the reductions required by the Affordable Care Act, estimated by the nonpartisan Congressional Budget Office to be $156 billion over a decade.
A year ago the administration also softened Medicare Advantage cuts….
[545] Report: “Medicare Advantage Plan Star Ratings and Bonus Payments in 2012.” By Gretchen Jacobson and others. Kaiser Family Foundation, November 2011. <www.kff.org>
Page 1:
In 2012, Medicare Advantage plans will begin to receive bonus payments based on quality ratings. These payments were initially established in the 2010 health reform law that provides for bonus payments to plans that receive 4 or more stars and to unrated plans beginning in 2012.1 In addition to the bonus payments established by the health reform law, CMS [U.S. Centers for Medicare and Medicaid Services] will also be launching a 3-year demonstration to begin in 2012 that increases the size of bonuses for these plans, and also provides bonuses to plans rated as average (receiving 3 or 3.5 stars), using the same 1 to 5 star scale. …
1 Hereinafter, the health reform law refers to the Patient Protection and Affordable Care Act of 2010 (P.L. 111-148; PPACA) as amended by the Health Care and Education Reconciliation Act of 2010 (P.L. 111-152).
Page 2: “The additional bonuses provided under the demonstration in 2012 are expected to amount to about half of the reduction in Medicare Advantage plan payments ($6 billion) included in the health reform law for 2012.5”
[546] Determined with data from:
a) Report: “Estimated Revenue Effects of the Amendment in the Nature of a Substitute to H.R. 4872, the ‘Reconciliation Act of 2010,’ as Amended, in Combination with the Revenue Effects of H.R. 3590, the ‘Patient Protection and Affordable Care Act (‘PPACA’),’ as Passed by the Senate, and Scheduled for Consideration by the House Committee on Rules on March 20, 2010.” United States Congress, Joint Committee on Taxation, March 20, 2010. <www.jct.gov>
NOTES:
b) Report: “Prescription for Change ‘Filled’: Tax Provisions in the Patient Protection and Affordable Care Act, Updated to Reflect Changes Approved in the Reconciliation Act of 2010.” By Clint Stretch and others. Deloitte, March 30, 2010. <www2.deloitte.com>
NOTE: This report contains plain-language explanations of each provision, which Just Facts used to determine the tax category of each provision. (For example, is a provision considered a tax increase or the elimination of a targeted tax deduction?) There is room for subjectivity in making some of these determinations.
|
Provision |
Becomes Effective |
Revenue FY 2010–19 (billions) |
Deloitte Explanation (page #) |
|
40% excise tax on health coverage in excess of $10,200/$27,500 … |
2018 |
$32.00 |
9 |
|
Increase in additional tax on distributions from HSAs and Archer MSAs not used for qualified medical expenses to 20% |
2011 |
$1.40 |
21 |
|
Impose annual fee on manufacturers and importers of branded drugs … |
2010 |
$27.00 |
11 |
|
Impose 2.3% excise tax on manufacturers and importers of certain medical devices |
2013 |
$20.00 |
12 |
|
Impose annual fee on health insurance providers |
2014 |
$60.10 |
10 |
|
$500,000 deduction limitation on taxable year remuneration to officers, employees, directors, and service providers of covered health insurance providers |
2012 |
$0.60 |
14 |
|
Broaden Medicare Hospital Insurance Tax Base for High-Income Taxpayers… |
2013 |
$210.20 |
5–7 |
|
Impose 10% excise tax on indoor tanning services |
2010 |
$2.70 |
12 |
|
Codify economic substance doctrine and impose penalties for underpayments |
2010 |
$4.50 |
18 |
|
Impose Fee on Insured and Self-Insured Health Plans; Patient-Centered Outcomes Research Trust Fund |
2013–2019 |
$2.60 |
12 |
|
TOTAL |
$361.10 |
[547] Determined with data from:
a) Report: “Estimated Revenue Effects of the Amendment in the Nature of a Substitute to H.R. 4872, the ‘Reconciliation Act of 2010,’ as Amended, in Combination with the Revenue Effects of H.R. 3590, the ‘Patient Protection and Affordable Care Act (‘PPACA’),’ as Passed by the Senate, and Scheduled for Consideration by the House Committee on Rules on March 20, 2010.” United States Congress, Joint Committee on Taxation, March 20, 2010. <www.jct.gov>
NOTES:
b) Report: “Prescription for Change ‘Filled’: Tax Provisions in the Patient Protection and Affordable Care Act, Updated to Reflect Changes Approved in the Reconciliation Act of 2010.” By Clint Stretch and others. Deloitte, March 30, 2010. <www2.deloitte.com>
NOTE: This report contains plain-language explanations of each provision, which Just Facts used to determine the tax category of each provision. (For example, is a provision considered a tax increase or the elimination of a targeted tax deduction?) There is room for subjectivity in making some of these determinations.
|
Provision |
Becomes Effective |
Revenue FY 2010–19 (billions) |
Deloitte Explanation (page #) |
|
40% excise tax on health coverage in excess of $10,200/$27,500 … |
2018 |
$32.00 |
9 |
|
Increase in additional tax on distributions from HSAs and Archer MSAs not used for qualified medical expenses to 20% |
2011 |
$1.40 |
21 |
|
Impose annual fee on manufacturers and importers of branded drugs … |
2010 |
$27.00 |
11 |
|
Impose 2.3% excise tax on manufacturers and importers of certain medical devices |
2013 |
$20.00 |
12 |
|
Impose annual fee on health insurance providers |
2014 |
$60.10 |
10 |
|
$500,000 deduction limitation on taxable year remuneration to officers, employees, directors, and service providers of covered health insurance providers |
2012 |
$0.60 |
14 |
|
Broaden Medicare Hospital Insurance Tax Base for High-Income Taxpayers… |
2013 |
$210.20 |
5–7 |
|
Impose 10% excise tax on indoor tanning services |
2010 |
$2.70 |
12 |
|
Codify economic substance doctrine and impose penalties for underpayments |
2010 |
$4.50 |
18 |
|
Impose Fee on Insured and Self-Insured Health Plans; Patient-Centered Outcomes Research Trust Fund |
2013–2019 |
$2.60 |
12 |
|
TOTAL |
$361.10 |
[548] Report: “The Excise Tax on High-Cost Employer-Sponsored Health Coverage: Estimated
Economic and Market Effects.” By Jane G. Gravelle. Congressional Research Service, January 12, 2017. <fas.org>
Page 2 (of PDF):
The Patient Protection and Affordable Care Act (ACA; P.L. 111-148, as amended) included a provision to impose an excise tax on high-cost employer-sponsored insurance (ESI) coverage beginning in 2018 (recently delayed until 2020). This provision, popularly termed the Cadillac tax, imposes an excise tax on ESI coverage in excess of a predetermined threshold. The tax is imposed on the coverage provider, typically the health insurance provider or the entity that administers the plan benefits.
Currently, employers’ spending on ESI coverage and most employees’ contributions to ESI plans are exempt from income and payroll taxes. Although proposals to limit the amount of health insurance benefits eligible for this exclusion were considered, the ACA, as enacted, did not limit the exclusion for employer-provided health insurance coverage. The Cadillac tax discourages high-cost employer health plans through another approach.
The Cadillac tax is imposed at a rate of 40%. This tax rate is applied on a tax-exclusive basis, as is generally the case with excise tax rates. That is, like a sales tax, the rate applies to the price or cost excluding the tax. By contrast, the tax rate relevant to an income tax exclusion is on a tax-inclusive basis: it is applied to a base that includes the tax. The Cadillac tax was originally nondeductible from the insurer’s gross income (or the employer’s gross income, in cases where the employer self-insures), but deductibility was allowed in the Consolidated Appropriations Act, 2016 (P.L. 114-113).
The Cadillac tax was originally to take effect in 2018. The Consolidated Appropriations Act delayed the effective date to 2020. The tax is projected to be imposed on plans that cost more than $10,800 for single health plans and $29,100 for non-single (for example, family) plans. The exempt amount is indexed for inflation, and, because health costs tend to grow faster than inflation, the share of premiums covered by the tax and the revenue collected is expected to grow. (The threshold was indexed for health care costs for 2019, however.)
[549] Public Law 114-113: “Consolidated Appropriations Act, 2016 .” 114th Congress. Signed into law by Barack Obama on December 18, 2015. <www.congress.gov>
Title I—High Cost Employer-Sponsored Health Coverage Excise Tax Provisions
Sec. 101. Delay of Excise Tax on High Cost Employer-Sponsored Health Coverage.
(a) In General.—Sections 9001(c) and 10901(c) of the Patient Protection and Affordable Care Act, as amended by section 1401(b) of the Health Care and Education Reconciliation Act of 2010, are each amended by striking “2017” and inserting “2019.”
(b) Conforming Amendment.—Clause (v) of section 4980I(b)(3)(C) of the Internal Revenue Code of 1986 is amended—
(1) by striking “as in effect” and inserting “as determined for,” and
(2) by striking “as so in effect” and inserting “as so determined.”
[550] Public Law 116-94: “Further Consolidated Appropriations Act, 2020.” 116th U.S. Congress. Signed into law by Donald Trump on December 20, 2019. <www.congress.gov>
Sec. 503. Repeal of Excise Tax on High Cost Employer-Sponsored Health Coverage.
(a) In General.—Chapter 43 of the Internal Revenue Code of 1986 is amended by striking section 4980I.
(b) Conforming Amendments.—
(1) Section 6051 of such Code is amended—
(A) by striking “section 4980I(d)(1)” in subsection (a)(14) and inserting “subsection (g)”, and
(B) by adding at the end the following new subsection:
“(g) Applicable Employer-Sponsored Coverage.—For purposes of subsection (a)(14)—
“(1) In General.—The term ‘applicable employer-sponsored coverage’ means, with respect to any employee, coverage under any group health plan made available to the employee by an employer which is excludable from the employee’s gross income under section 106, or would be so excludable if it were employer-provided coverage (within the meaning of such section 106).
“(2) Exceptions.—The term ‘applicable employer-sponsored coverage’ shall not include—
“(A) any coverage (whether through insurance or otherwise) described in section 9832(c)(1) (other than subparagraph (G) thereof) or for long-term care,
“(B) any coverage under a separate policy, certificate, or contract of insurance which provides benefits substantially all of which are for treatment of the mouth (including any organ or structure within the mouth) or for treatment of the eye, or
“(C) any coverage described in section 9832(c)(3) the payment for which is not excludable from gross income and for which a deduction under section 162(l) is not allowable.
“(3) Coverage Includes Employee Paid Portion.—Coverage shall be treated as applicable employer-sponsored coverage without regard to whether the employer or employee pays for the coverage.
“(4) Governmental Plans Included.—Applicable employer-sponsored coverage shall include coverage under any group health plan established and maintained primarily for its civilian employees by the Government of the United States, by the government of any State or political subdivision thereof, or by any agency or instrumentality of any such government.”
(2) Section 9831(d)(1) of such Code is amended by striking “except as provided in section 4980I(f)(4)”.
(3) The table of sections for chapter 43 of such Code is amended by striking the item relating to section 4980I.
(c) Effective Date.—The amendments made by this section shall apply to taxable years beginning after December 31, 2019.
[551] Determined with data from:
a) Report: “Estimated Revenue Effects of the Amendment in the Nature of a Substitute to H.R. 4872, the ‘Reconciliation Act of 2010,’ as Amended, in Combination with the Revenue Effects of H.R. 3590, the ‘Patient Protection and Affordable Care Act (‘PPACA’),’ as Passed by the Senate, and Scheduled for Consideration by the House Committee on Rules on March 20, 2010.” United States Congress, Joint Committee on Taxation, March 20, 2010. <www.jct.gov>
NOTES:
b) Report: “Prescription for Change ‘Filled’: Tax Provisions in the Patient Protection and Affordable Care Act, Updated to Reflect Changes Approved in the Reconciliation Act of 2010.” By Clint Stretch and others. Deloitte, March 30, 2010. <www2.deloitte.com>
NOTE: This report contains plain-language explanations of each provision, which Just Facts used to determine the tax category of each provision. (For example, is a provision considered a tax increase or the elimination of a targeted tax deduction?) There is room for subjectivity in making some of these determinations.
|
Provision |
Becomes Effective |
Revenue FY 2010–19 (billions) |
Deloitte Explanation (page #) |
|
40% excise tax on health coverage in excess of $10,200/$27,500 … |
2018 |
$32.00 |
9 |
|
Increase in additional tax on distributions from HSAs and Archer MSAs not used for qualified medical expenses to 20% |
2011 |
$1.40 |
21 |
|
Impose annual fee on manufacturers and importers of branded drugs … |
2010 |
$27.00 |
11 |
|
Impose 2.3% excise tax on manufacturers and importers of certain medical devices |
2013 |
$20.00 |
12 |
|
Impose annual fee on health insurance providers |
2014 |
$60.10 |
10 |
|
$500,000 deduction limitation on taxable year remuneration to officers, employees, directors, and service providers of covered health insurance providers |
2012 |
$0.60 |
14 |
|
Broaden Medicare Hospital Insurance Tax Base for High-Income Taxpayers… |
2013 |
$210.20 |
5–7 |
|
Impose 10% excise tax on indoor tanning services |
2010 |
$2.70 |
12 |
|
Codify economic substance doctrine and impose penalties for underpayments |
2010 |
$4.50 |
18 |
|
Impose Fee on Insured and Self-Insured Health Plans; Patient-Centered Outcomes Research Trust Fund |
2013–2019 |
$2.60 |
12 |
|
TOTAL |
$361.10 |
[552] Report: “Prescription for Change ‘Filled’: Tax Provisions in the Patient Protection and Affordable Care Act, Updated to Reflect Changes Approved in the Reconciliation Act of 2010.” By Clint Stretch and others. Deloitte, March 30, 2010. <www2.deloitte.com>
Page 10: “An annual fee will be imposed on covered entities providing health insurance with respect to U.S. health risks. … Effective date – The fee will first be payable in 2014 with respect to net premium written in 2013.”
[553] “Internal Revenue Manual Part 25, Chapter 21, Section 2: Insurance Provider Fee.” Internal Revenue Service. Last updated August 27, 2020. <www.irs.gov>
Background
1. The Patient Protection and Affordable Care Act of 2010 established Provision 9010, which imposes an annual fee on each covered entity engaged in the business of providing health insurance for United States health risks. The insurance provider fee was repealed for calendar years beginning after December 31, 2020.
Authority
1. Section 9010 of the Affordable Care Act of 2010 imposes an annual fee on each covered entity engaged in the business of providing health insurance for calendar years beginning after December 31, 2013. Collection of the fee is suspended for fee years 2017 and 2019 and was repealed for calendar years beginning after December 31, 2020.
2. Section 9010 (b) and (e) provide rules for determining the amount of the annual fee for each covered entity. Section 9010 (b)(1) requires the applicable fee amount for each year to be allocated, using a specified formula, among covered entities with aggregate net premiums written of over $25 million.
[554] Public Law 116-94: “Further Consolidated Appropriations Act, 2020.” 116th U.S. Congress. Signed into law by Donald Trump on December 20, 2019. <www.congress.gov>
Sec. 502. Repeal of Annual Fee on Health Insurance Providers.
(a) In General.—Subtitle A of title IX of the Patient Protection and Affordable Care Act is amended by striking section 9010.
(b) Effective Date.—The amendment made by this section shall apply to calendar years beginning after December 31, 2020.
[555] Determined with data from:
a) Report: “Estimated Revenue Effects of the Amendment in the Nature of a Substitute to H.R. 4872, the ‘Reconciliation Act of 2010,’ as Amended, in Combination with the Revenue Effects of H.R. 3590, the ‘Patient Protection and Affordable Care Act (‘PPACA’),’ as Passed by the Senate, and Scheduled for Consideration by the House Committee on Rules on March 20, 2010.” United States Congress, Joint Committee on Taxation, March 20, 2010. <www.jct.gov>
NOTES:
b) Report: “Prescription for Change ‘Filled’: Tax Provisions in the Patient Protection and Affordable Care Act, Updated to Reflect Changes Approved in the Reconciliation Act of 2010.” By Clint Stretch and others. Deloitte, March 30, 2010. <www2.deloitte.com>
NOTE: This report contains plain-language explanations of each provision, which Just Facts used to determine the tax category of each provision. (For example, is a provision considered a tax increase or the elimination of a targeted tax deduction?) There is room for subjectivity in making some of these determinations.
|
Provision |
Becomes Effective |
Revenue FY 2010–19 (billions) |
Deloitte Explanation (page #) |
|
40% excise tax on health coverage in excess of $10,200/$27,500 … |
2018 |
$32.00 |
9 |
|
Increase in additional tax on distributions from HSAs and Archer MSAs not used for qualified medical expenses to 20% |
2011 |
$1.40 |
21 |
|
Impose annual fee on manufacturers and importers of branded drugs … |
2010 |
$27.00 |
11 |
|
Impose 2.3% excise tax on manufacturers and importers of certain medical devices |
2013 |
$20.00 |
12 |
|
Impose annual fee on health insurance providers |
2014 |
$60.10 |
10 |
|
$500,000 deduction limitation on taxable year remuneration to officers, employees, directors, and service providers of covered health insurance providers |
2012 |
$0.60 |
14 |
|
Broaden Medicare Hospital Insurance Tax Base for High-Income Taxpayers… |
2013 |
$210.20 |
5–7 |
|
Impose 10% excise tax on indoor tanning services |
2010 |
$2.70 |
12 |
|
Codify economic substance doctrine and impose penalties for underpayments |
2010 |
$4.50 |
18 |
|
Impose Fee on Insured and Self-Insured Health Plans; Patient-Centered Outcomes Research Trust Fund |
2013–2019 |
$2.60 |
12 |
|
TOTAL |
$361.10 |
[556] Report: “Prescription for Change ‘Filled’: Tax Provisions in the Patient Protection and Affordable Care Act, Updated to Reflect Changes Approved in the Reconciliation Act of 2010.” By Clint Stretch and others. Deloitte, March 30, 2010. <www2.deloitte.com>
Page 12: “The Act imposes an excise tax of 2.3 percent on the sale price of any taxable medical device sold by manufacturers and importers beginning in 2013. Covered devices – The Act generally applies to sales for use in the United States of any medical device (as defined in section 201(h) of the Federal Food, Drug, and Cosmetic Act) intended for humans.”
[557] Public Law 116-94: “Further Consolidated Appropriations Act, 2020.” 116th U.S. Congress. Signed into law by Donald Trump on December 20, 2019. <www.congress.gov>
Sec. 501. Repeal of Medical Device Excise Tax.
(a) In General.—Chapter 32 of the Internal Revenue Code of 1986 is amended by striking subchapter E.
(b) Conforming Amendments.—
(1) Subsection (a) of section 4221 of the Internal Revenue Code of 1986 is amended by striking the last sentence.
(2) Paragraph (2) of section 6416(b) of such Code is amended by striking the last sentence.
(c) Clerical Amendment.—The table of subchapters for chapter 32 of the Internal Revenue Code of 1986 is amended by striking the item relating to subchapter E.
(d) Effective Date.—The amendments made by this section shall apply to sales after December 31, 2019.
[558] Report: “Estimated Financial Effects of the ‘Patient Protection and Affordable Care Act,’ as Amended.” By Richard S. Foster. U.S. Department of Health & Human Services, Centers for Medicare and Medicaid Services, Office of the Actuary, April 22, 2010. <www.cms.gov>
Pages 1–2: “The table shown on page 2 presents financial impacts of the selected PPACA [Patient Protection and Affordable Care Act] provisions on the Federal budget in fiscal years 2010–2019. We have grouped the provisions of the legislation into six major categories: … (v) The Community Living Assistance Service and Supports (CLASS) program….”
Page 14: “As shown in the table on page 2, we estimate a net Federal savings for the CLASS [Community Living Assistance Services and Supports] program of $38 billion during the first 9 years of operations—the first 5 of which are prior to the commencement of benefit payments.”
[559] “Remarks by the President on 20th Anniversary of the Americans with Disabilities Act South Lawn.” By Barack Obama. The White House, July 26, 2010. <obamawhitehouse.archives.gov>
So the Affordable Care Act I signed into law four months ago will give every American more control over their health care—and it will do more to give Americans with disabilities control over their own lives than any legislation since the ADA [Americans with Disabilities Act]. …
… And because Americans with disabilities are living longer and more independently, this law will establish better long-term care choices for Americans with disabilities as a consequence of the CLASS [Community Living Assistance Services and Supports] Act, an idea Ted Kennedy championed for years. (Applause.)
[560] Report: “Estimated Financial Effects of the ‘Patient Protection and Affordable Care Act,’ as Amended.” By Richard S. Foster. U.S. Department of Health & Human Services, Centers for Medicare and Medicaid Services, Office of the Actuary, April 22, 2010. <www.cms.gov>
Page 14:
CLASS Program
Title VIII of the health reform act establishes a new, voluntary, Federal insurance program providing a cash benefit if a participant is unable to perform at least two or three activities of daily living or has substantial cognitive impairment. The program will be financed by participant premiums, with no Federal subsidy. Participants will have to meet certain modest work requirements during a 5-year vesting period before becoming eligible for benefits. Benefits are intended to be used to help purchase community living assistance services and supports (CLASS) that would help qualifying beneficiaries maintain their personal and financial independence and continue living in the community. Benefits can also be used to help cover the cost of institutional long-term care. …
[561] Report: “Estimated Financial Effects of the ‘Patient Protection and Affordable Care Act,’ as Amended.” By Richard S. Foster. U.S. Department of Health & Human Services, Centers for Medicare and Medicaid Services, Office of the Actuary, April 22, 2010. <www.cms.gov>
Page 14:
We estimate that roughly 2.8 million persons will participate in the program by the third year. This level represents about 2 percent of potential participants, compared to a participation rate of 4 percent for private long-term care insurance offered through employers. Factors affecting participation in CLASS [Community Living Assistance Services and Supports] include the program’s voluntary nature, the lack of a Federal subsidy, a minimal premium for students and individuals with incomes under 100 percent of the FPL [federal poverty level] (initially $5 per month), a relatively high premium for all other participants as a result of adverse selection and the effect of subsidizing participants paying the $5 premium, a new and unfamiliar benefit, and the availability of lower-priced private long-term care insurance for many.
[562] Interview: “Meet the Senator Who Killed the CLASS Act.” By Sarah Kliff. Washington Post, October 18, 2011. <www.washingtonpost.com>
If anyone can claim responsibility for the CLASS [Community Living Assistance Services and Supports] Act’s demise, it’s probably Sen. Judd Gregg. During the health reform debate, the former Republican senator from New Hampshire secured an amendment requiring the Department of Health and Human Services to certify that the long-term insurance program would be fiscally sound. …
Sen. Judd Gregg: I knew we weren’t going to kill the CLASS Act because it was Sen. Ted Kennedy’s proposal, and he was very sick, and most of us were very sensitive to the fact he was sick. This was his last hurrah, legislatively. I knew we were going to implement it, although I didn’t think the concept was sound. Conceptually, it makes sense to prefund long-term care insurance…. but what this bill did was just the opposite. It was totally unsound.
My thought was, let’s put in an amendment that would be hard to oppose, that in effect would either make the proposal sound or would kill it.
[563] Report: “Regulations Pursuant to the Patient Protection and Affordable Care Act (P.L. 111-148).” By Curtis W. Copeland, Congressional Research Service, April 13, 2010. <www.ncsl.org>
Page 7:
Section 8002 of the act (“Establishment of a National Voluntary Insurance Program for Purchasing Community Living Assistance Services and Support”) amended the PHSA [Public Health Service Act] by, among other things, adding a new Section 3203 (“CLASS [Community Living Assistance Services and Supports] Independence Benefit Plan”) that requires the Secretary to develop at least three “actuarially sound benefit plans as alternatives for consideration for designation by the Secretary as the CLASS Independence Benefit Plan under which eligible beneficiaries shall receive benefits under this title.” Subsection (a)(2) of this new section requires a “CLASS Independence Advisory Council” to evaluate the alternative plans and recommend the one that “best balances price and benefits to meet enrollee’s needs in an actuarially sound manner.” Using this information, Subsection (a)(3) requires the Secretary to designate a benefit plan as the CLASS Independence Benefit Plan, and to do so “along with details of the plan and the reasons for the selection by the Secretary, in a final rule that allows for a period of public comment.”
[564] Commentary: “Secretary Sebelius Cannot Fix CLASS.” By Brian Blase and John S. Hoff. Heritage Foundation, March 16, 2011. <heritage.org>
The main problem is that the program’s design will result in a badly skewed pool of participants. This is primarily because health status cannot be a factor used for calculating premiums. This means healthy individuals are less likely to participate because they do not receive credit in the form of a lower premium, like they would if they purchased LTC [long-term care] insurance in the private market. Instead, CLASS [Community Living Assistance Services and Supports] participants are likely to be disabled individuals who are able to work part-time and individuals who anticipate future LTC needs.
Moreover, the adverse selection problem is exacerbated because individuals earning below the poverty line are subjected to only a $5 monthly premium, and less healthy people are much more likely to be below the poverty line. The artificially low premium for them means that premiums will have to be much higher for others, which will diminish overall enrollment in the program and worsen its long-run solvency. The poor design of CLASS almost guarantees that the program will collapse or need a bailout.
[565] Report: “Estimated Financial Effects of the ‘Patient Protection and Affordable Care Act,’ as Amended.” By Richard S. Foster. U.S. Department of Health & Human Services, Centers for Medicare and Medicaid Services, Office of the Actuary, April 22, 2010. <www.cms.gov>
Pages 14–15:
CLASS Program
… Participants will have to meet certain modest work requirements during a 5-year vesting period before becoming eligible for benefits. Benefits are intended to be used to help purchase community living assistance services and supports (CLASS) that would help qualifying beneficiaries maintain their personal and financial independence and continue living in the community. Benefits can also be used to help cover the cost of institutional long-term care.
As shown in the table on page 2, we estimate a net Federal savings for the CLASS program of $38 billion during the first 9 years of operations—the first 5 of which are prior to the commencement of benefit payments. After 2015, as benefits are paid, the net savings from this program will decline; in 2025 and later, projected benefits exceed premium revenues, resulting in a net Federal cost in the longer term.12
12 The CLASS program is intended to be financed on a long-range, 75-year basis through participant premiums that would fully fund benefits and administrative expenses. If this goal can be achieved, despite anticipated serious adverse selection problems (described subsequently), then annual expenditures would be met through a combination of premium income and interest earnings on the assets of the CLASS trust fund. The Federal Budget impact would be the net difference between premium receipts and program outlays. Thus, the trust fund would be adequately financed in this scenario, but the Federal Budget would have a net savings each year prior to 2025 and a net cost each year thereafter.
[566] Article: “Health Law to Be Revised by Ending a Program.” By Robert Pear. New York Times, October 14, 2011. <www.nytimes.com>
The Obama administration announced Friday that it was scrapping a long-term care insurance program created by the new health care law because it was too costly and would not work. …
“We have not identified a way to make Class work at this time,” Ms. Sebelius said. She said the program, which had been championed by Senator Edward M. Kennedy, Democrat of Massachusetts, was financially unsustainable.
[567] Interview: “Meet the Senator Who Killed the CLASS Act.” By Sarah Kliff. Washington Post, October 18, 2011. <www.washingtonpost.com>
If anyone can claim responsibility for the CLASS Act’s demise, it’s probably Sen. Judd Gregg. During the health reform debate, the former Republican senator from New Hampshire secured an amendment requiring the Department of Health and Human Services to certify that the long-term insurance program would be fiscally sound. …
Sen. Judd Gregg: I knew we weren’t going to kill the CLASS Act because it was Sen. Ted Kennedy’s proposal, and he was very sick, and most of us were very sensitive to the fact he was sick. This was his last hurrah, legislatively. I knew we were going to implement it, although I didn’t think the concept was sound. Conceptually, it makes sense to prefund long-term care insurance…. but what this bill did was just the opposite. It was totally unsound.
My thought was, let’s put in an amendment that would be hard to oppose, that in effect would either make the proposal sound or would kill it.
[568] Article: “Obama Opposes Repeal of Healthcare Program Suspended Last Week.” By Julian Pecquet. The Hill, October 17, 2011. <thehill.com>
“President Obama is against repealing the health law’s long-term care CLASS Act and might veto Republican efforts to do so, an administration official tells The Hill, despite the government’s announcement Friday that the program was dead in the water.”
[569] On December 8, 2021, Just Facts e-mailed each of the three agencies. As of November 2022, the U.S. Centers for Medicare & Medicaid Services has not responded, and the agency’s webpage (<www.cms.gov>) does not contain any studies conducted after 2010 on the ACA’s budgetary impacts.
[570] E-mail from the Joint Committee on Taxation to Just Facts, December 14, 2021.
Unfortunately, the Joint Committee on Taxation does not have the staff or resources to conduct a retrospective study of the PPACA’s [Patient Protection and Affordable Care Act’s] impact on Federal revenues. In addition, even we had the resources, such a study would be challenging to conduct because of the many modifications to that law subsequent to its enactment. For these reasons, no study has been conducted, and we have no plans to do so.
[571] Webpage: “Frequently Asked Questions (FAQs).” U.S. Congressional Budget Office. Accessed February 6, 2023 at <www.cbo.gov>
What is CBO and JCT’s current estimate of the budgetary effects of the Affordable Care Act (ACA)?
Although baseline projections by CBO [Congressional Budget Office] and the staff of the Joint Committee on Taxation (JCT) incorporate the budgetary effects of the Affordable Care Act’s (ACA’s) insurance coverage provisions over the coming decade, the agencies cannot readily provide updated estimates that separately identify all of those effects. The reasons are explained in a June 2014 blog post, which highlights the following points:
• The incremental budgetary effects of many provisions of the ACA are embedded in baseline projections for preexisting programs and in tax revenues, and they cannot be separately identified using the agencies’ normal estimating procedures—which are generally based on data that reflect all of the provisions of current law, including the ACA.
• A retrospective analysis of the effects of a current law is very different from a cost estimate for proposed legislation, particularly because it requires formulation of a counterfactual benchmark representing what would have happened if the law had not been enacted—a challenging undertaking that is beyond the scope of the agencies’ usual analyses.
• Therefore, CBO and JCT cannot readily provide a retrospective analysis of the ACA that is analogous to the cost estimate the agencies did when the legislation was considered in 2010. That problem is not unique to the ACA but is common to most legislation that affects preexisting federal programs.
[572] Report: “Health Insurance Coverage and the Affordable Care Act, 2010–2016.” By Namrata Uberoi, Kenneth Finegold, and Emily Gee. Department of Health & Human Services, March 3, 2016. <aspe.hhs.gov>
Page 7–8:
We estimate that the provisions of the ACA [Affordable Care Act] have resulted in gains in health insurance coverage for 20.0 million nonelderly adults (ages 18 to 64). This estimate comprises 17.7 million nonelderly adults who gained coverage due to the coverage expansions that began in the fourth quarter of 2013 and 2.3 million young adults (ages 19 to 25) who gained coverage between 2010 and 2013 due to the ACA’s provision allowing young adults to stay on a parents’ plan until the age of 26. In total, 6.1 million previously uninsured young adults have gained coverage due to the ACA. This is especially important because this population were particularly likely to be uninsured prior to the enactment of the ACA. …
The estimated health insurance coverage gains represent estimates of coverage gains associated with provisions of the Affordable Care Act (ACA). That is, the coverage gains estimate reductions in the number of people who are uninsured after controlling for general economic conditions (via employment status), secular trends, geographic location and demographic changes. The sum of the enrollment gains in Medicaid and the Children’s Health Insurance Program (CHIP) for individuals receiving comprehensive benefits (over 14 million) and the Health Insurance Marketplace (12.7 million) is greater than the net change in health insurance coverage (20 million) because people may move in and out of different sources of health insurance coverage, so the net change in coverage needs to measure more than these two sources of coverage.
NOTE: These estimates do not account for people who lost their insurance due to certain Obamacare provisions.
[573] Opinion: “The Affordable Care Act and the Opportunity to Improve Prevention in Women: How to Make the Most of the Law.” By Paula A. Johnson and Therese Fitzgerald. Clinical Chemistry, 2014. Pages 138–140. <clinchem.aaccjnls.org>
Page 140: “The U.S., the world’s wealthiest country, spends more per capita on healthcare than any other nation, yet has one of the lowest life expectancy rates in the developed world15. Fortunately, we have the ability to leverage the preventive services now available with the passage of the ACA [Affordable Care Act] that are so crucial to improving healthcare outcomes while reducing healthcare expenditures in the US.”
[574] Report: “Dying for Coverage: The Deadly Consequences of Being Uninsured.” By Kim Bailey. Families USA, June 2012. <familiesusa.org>
Page 1:
The uninsured frequently face medical debt or go without necessary care, and too many of them die prematurely. …
The fate of the health care law, however, is now in question. … Without the law, the number of uninsured will continue to rise, and more Americans will face the adverse health and financial consequences associated with going uninsured. … And, worse still, many will die prematurely.
To estimate the number of Americans who are dying for lack of health coverage, Families USA applied the methodology developed by the Institute of Medicine to state-level population and mortality data. This is one measure of the great need for the Affordable Care Act. As our analysis shows, far too many Americans are, quite literally, dying for coverage.
Page 3: “Table 2. Deaths Due to a Lack of Health Coverage, 25- to 64-Year-Olds, by State, 2005–2010 … U.S. Total [=] 134,120”
[575] Webpage: “Paul Krugman.” New York Times. Accessed September 3, 2019 at <www.nytimes.com>
“In 2008, Mr. Krugman was the sole recipient of the Nobel Memorial Prize in Economic Sciences for his work on international trade theory.”
[576] Opinion: “Death by Ideology.” By Paul Krugman. New York Times, October 14, 2012. <www.nytimes.com>
The overwhelming evidence, however, is that insurance is indeed a lifesaver, and lack of insurance a killer. …
And surely the fact that the United States is the only major advanced nation without some form of universal health care is at least part of the reason life expectancy is much lower in America than in Canada or Western Europe.
So there’s no real question that lack of insurance is responsible for thousands, and probably tens of thousands, of excess deaths of Americans each year. But that’s not a fact Mr. Romney wants to admit, because he and his running mate want to repeal Obamacare and slash funding for Medicaid—actions that would take insurance away from some 45 million nonelderly Americans, causing thousands of people to suffer premature death.
[577] “WHO Director-General’s Opening Remarks at the Media Briefing on Covid-19.” World Health Organization, March 11, 2020. <bit.ly>
[Dr. Tedros Adhanom Ghebreyesus:] …
WHO [World Health Organization] has been assessing this outbreak around the clock and we are deeply concerned both by the alarming levels of spread and severity, and by the alarming levels of inaction.
We have therefore made the assessment that COVID-19 can be characterized as a pandemic.
[578] Calculated with data from:
a) Report: “United States Life Tables, 2012.” By Elizabeth Arias, Melonie Heron, and Jiaquan Xu. U.S. Department of Health and Human Services, Centers for Disease Control and Prevention, National Center for Health Statistics, November 28, 2016. <www.cdc.gov>
Pages 46–48: “Table 19. Estimated Life Expectancy at Birth, in Years, by Race, Hispanic Origin, and Sex: Death-Registration States, 1900–1928, and United States, 1929–2012.”
b) Report: “Mortality in the United States, 2014.” By Sherry L. Murphy and others. U.S. Centers for Disease Control and Prevention, National Center for Health Statistics, December 2015. <www.cdc.gov>
c) Report: “Mortality in the United States, 2015.” By Jiaquan Xu and others. U.S. Centers for Disease Control and Prevention, National Center for Health Statistics, December 2016. <www.cdc.gov>
d) Report: “Mortality in the United States, 2016.” By Kenneth D. Kochanek and others. U.S. Centers for Disease Control and Prevention, National Center for Health Statistics, December 2017. <www.cdc.gov>
e) Report: “Mortality in the United States, 2017.” By Sherry L. Murphy and others. U.S. Centers for Disease Control and Prevention, National Center for Health Statistics, November 29, 2018. <www.cdc.gov>
f) Report: “Mortality in the United States, 2018.” By Jiaquan Xu and others. U.S. Centers for Disease Control and Prevention, January 2020. <www.cdc.gov>
g) Report: “Provisional Life Expectancy Estimates for 2020.” By Elizabeth Arias and others. U.S. Centers for Disease Control and Prevention, National Center for Health Statistics, July 2021. <www.cdc.gov>
NOTE: An Excel file containing the data and calculations is available upon request.
[579] When graphing variables with significant short-term fluctuations, researchers often use rolling totals or averages to reveal longer-term trends.†
† NOTE: Webpage: “What Are Moving Average or Smoothing Techniques?” National Institute of Standards and Technology, NIST/SEMATECH e-Handbook of Statistical Methods. Accessed April 25, 2017 at <www.itl.nist.gov>
Smoothing data removes random variation and shows trends and cyclic components.
Inherent in the collection of data taken over time is some form of random variation. There exist methods for reducing or canceling the effect due to random variation. An often-used technique in industry is “smoothing”. This technique, when properly applied, reveals more clearly the underlying trend, seasonal and cyclic components.
There are two distinct groups of smoothing methods.
• Averaging Methods
• Exponential Smoothing Methods
[580] Report: “Private Health Insurance Provisions in PPACA [Patient Protection and Affordable Care Act] (P.L. 111-148).” By Hinda Chaikind and others. Congressional Research Service, April 15, 2010. <www.everycrsreport.com>
Pages 11–12:
The law will apply new federal health insurance standards to group health plans as well as health insurance coverage offered in the individual, small group, and large group markets (depending on the standard), effective for plan years beginning on or after January 1, 2014. Among the insurance reforms are provisions that will subject new plans to the following requirements: …
• Require QHPs [qualified health plans] and issuers in the individual and small group markets to offer coverage that includes the “essential health benefits package” (see description below).41
Page 14:
The Secretary will specify the “essential health benefits” included in the “essential health benefits package” that QHPs will be required to cover (effective beginning in 2014). Essential health benefits48 will include at least the following general categories: …
[581] Webpage: “Health Benefits & Coverage: Mental Health & Substance Abuse Coverage.” U.S. Centers for Medicare & Medicaid Services. Accessed September 27, 2019 at <www.healthcare.gov>
All Marketplace plans cover mental health and substance abuse services as essential health benefits. …
All plans must cover:
• Behavioral health treatment, such as psychotherapy and counseling
• Mental and behavioral health inpatient services
• Substance use disorder (commonly known as substance abuse) treatment …
Pre-existing mental and behavioral health conditions are covered, and spending limits aren’t allowed.
• Marketplace plans can’t deny you coverage or charge you more just because you have any pre-existing condition, including mental health and substance use disorder conditions.
• Coverage for treatment of all pre-existing conditions begins the day your coverage starts.
• Marketplace plans can’t put yearly or lifetime dollar limits on coverage of any essential health benefit, including mental health and substance use disorder services. …
Marketplace plans must provide certain “parity” protections between mental health and substance abuse benefits on the one hand, and medical and surgical benefits on the other.
This generally means limits applied to mental health and substance abuse services can’t be more restrictive than limits applied to medical and surgical services. The limits covered by parity protections include:
• Financial—like deductibles, copayments, coinsurance, and out-of-pocket limits
• Treatment—like limits to the number of days or visits covered
• Care management—like being required to get authorization of treatment before getting it
[582] Webpage: “Substance Abuse and the Affordable Care Act.” White House, Office of National Drug Control Policy. Accessed December 8, 2021 at <obamawhitehouse.archives.gov>
The Affordable Care Act (ACA) put in place comprehensive health insurance reforms that will make health insurance available to many more people, lower health care costs, guarantee more health care choices, and enhance the quality of health care for all Americans.
The ACA includes substance use disorders as one of the ten elements of essential health benefits. This means that all health insurance sold on Health Insurance Exchanges or provided by Medicaid to certain newly eligible adults starting in 2014 must include services for substance use disorders.
By including these benefits in health insurance packages, more health care providers can offer and be reimbursed for these services, resulting in more individuals having access to treatment. The specific substance abuse services that will be covered are currently being determined by the Department of Health and Human Services, and will take into account evidence on what services allow individuals to get the treatment they need and help them with recovery.
[583] Webpage: “Does the Affordable Care Act Cover Individuals with Mental Health Problems?” U.S. Department of Health & Human Services. Last updated February 25, 2019. <www.hhs.gov>
Does the Affordable Care Act cover individuals with mental health problems?
Yes. The Affordable Care Act provides one of the largest expansions of mental health and substance use disorder coverage. The law requires that most individual and small employer health insurance plans, including all plans offered through the Health Insurance Marketplace cover mental health and substance use disorder services. Also required are rehabilitative and habilitative services that can help support people with behavioral health challenges.
[584] Article: “How Obamacare Improved Mental Health Coverage.” By Louise Norris. IHC Specialty Benefits, Inc., November 13, 2020. <www.healthinsurance.org>
[U]nder the ACA [Affordable Care Act], all individual and small-group plans with effective dates of January 2014 or later are required to cover ten essential health benefits with no annual or lifetime dollar limits. Mental health and addiction treatment (collectively referred to as behavioral health services) are among the essential health benefits.
The ACA also extended MHPAEA [2008 Mental Health Parity and Addiction Equity Act] to include individual and small group plans, as well as Medicaid, in addition to the large group plans to which it originally applied. Since 2014, all new individual and small-group plans have covered mental health and addiction treatment, and have been required to do so with benefits that are no less favorable than benefits for medical/surgical care.
Large-group plans are not required to cover the ACA’s essential health benefits (although if they do, they must do so without annual or lifetime dollar limits), but they are governed by MHPAEA. So if they provide coverage for mental health and addiction treatment, they must do so with parity to medical/surgical benefits. Shel Gross, Director of Public Policy for Mental Health America of Wisconsin, notes that large-group plans already tended to provide relatively generous benefits for mental health and addiction treatment prior to the ACA, and that’s still largely the case today (large group plans, in general, tended to provide more generous benefits across the board; this is why the ACA’s essential health benefits requirements were written to apply to the individual and small group markets).
[585] Editorial: “The Affordable Care Act Will Revolutionize Care for Substance Use Disorders in the United States.” By Keith Humphreys and Richard G. Frank. Addiction, June 26, 2014. <onlinelibrary.wiley.com>
On 23 March 2010, U.S. President Barack Obama signed the Affordable Care Act, the largest expansion in health insurance since the creation of the Medicare and Medicaid programs in 1965. Although the law’s primary purpose was to reduce the number of Americans without health insurance, it builds upon prior landmark legislation (the 2008 Mental Health Parity and Addiction Equity Act) to produce a much-needed revolution in the care of substance use disorders.
[586] Article: “Obamacare Rolls Out, Transforming Addiction Coverage.” By Michael Dhar. The Fix, March 3, 2014. <www.thefix.com>
[T]he ACA [Affordable Care Act] represents a massive step forward in getting insurance plans to cover addiction treatment. First, starting this year, the legislation bars insurers from denying coverage due to pre-existing conditions—including substance abuse. But perhaps the most important changes come from the ACA’s expansion of parity rules. In brief, “parity” means that insurance plans must cover mental health and substance abuse treatment at the same level as regular medical care. …
[T]he ACA and its associated regulations will make a tremendous difference, particularly among those populations disproportionately affected by substance abuse.
“I think that the ACA is an absolute game changer,” Donner [executive director of the Colorado Criminal Justice Reform Coalition] said. “And I’m extremely excited about the potential of it.”
[587] Article: “Affordable Care Act to Provide Substance Abuse Treatment to Millions of New Patients.” By Celia Vimont. Partnership for Drug-Free Kids, February 26, 2013. <drugfree.org>
The Affordable Care Act (ACA) will revolutionize the field of substance abuse treatment, according to A. Thomas McLellan, PhD, CEO and co-founder of the Treatment Research Institute.
“It will have more far-reaching positive consequences for substance abuse treatment than anything in my lifetime, including the discovery of methadone,” he said….
Currently, just 2.3 million Americans receive any type of substance abuse treatment, which is less than one percent of the total population of people who are affected by … addiction, said Dr. McLellan, who is a former Deputy Director of the White House Office of National Drug Control Policy.
[588] Report: “Private Health Insurance Provisions in PPACA [Patient Protection and Affordable Care Act] (P.L. 111-148).” By Hinda Chaikind and others. Congressional Research Service, April 15, 2010. <www.everycrsreport.com>
Pages 11–12:
The law will apply new federal health insurance standards to group health plans as well as health insurance coverage offered in the individual, small group, and large group markets (depending on the standard), effective for plan years beginning on or after January 1, 2014. Among the insurance reforms are provisions that will subject new plans to the following requirements: …
• Require QHPs [qualified health plans] and issuers in the individual and small group markets to offer coverage that includes the “essential health benefits package” (see description below).41
Page 14:
The Secretary will specify the “essential health benefits” included in the “essential health benefits package” that QHPs will be required to cover (effective beginning in 2014). Essential health benefits48 will include at least the following general categories: …
[589] “WHO Director-General’s Opening Remarks at the Media Briefing on Covid-19.” World Health Organization, March 11, 2020. <bit.ly>
[Dr. Tedros Adhanom Ghebreyesus:] …
WHO [World Health Organization] has been assessing this outbreak around the clock and we are deeply concerned both by the alarming levels of spread and severity, and by the alarming levels of inaction.
We have therefore made the assessment that COVID-19 can be characterized as a pandemic.
[590] Calculated with data from:
a) Report: “Drug Overdose Deaths in the United States, 1999–2020.” By Holly Hedegaard and others. U.S. Centers for Disease Control and Prevention, National Center for Health Statistics, December 2021. <www.cdc.gov>
“Data Table for Figure 1. Age-Adjusted Drug Overdose Death Rates, by Sex: United States, 1999–2020.” <www.cdc.gov>
b) Report: “Drug Overdose Deaths in the United States, 2001–2021.” By Merianne Rose Spencer, Arialdi M. Miniño, and Margaret Warner. U.S. Centers for Disease Control and Prevention, National Center for Health Statistics, December 2022. <www.cdc.gov>
CALCULATIONS:
NOTE: An Excel file containing the data is available upon request.
[591] Report: “Private Health Insurance Provisions in PPACA [Patient Protection and Affordable Care Act] (P.L. 111-148).” By Hinda Chaikind and others. Congressional Research Service, April 15, 2010. <www.everycrsreport.com>
Pages 11–12:
The law will apply new federal health insurance standards to group health plans as well as health insurance coverage offered in the individual, small group, and large group markets (depending on the standard), effective for plan years beginning on or after January 1, 2014. Among the insurance reforms are provisions that will subject new plans to the following requirements: …
• Require QHPs [qualified health plans] and issuers in the individual and small group markets to offer coverage that includes the “essential health benefits package” (see description below).41
Page 14:
The Secretary will specify the “essential health benefits” included in the “essential health benefits package” that QHPs will be required to cover (effective beginning in 2014). Essential health benefits48 will include at least the following general categories: …
[592] “WHO Director-General’s Opening Remarks at the Media Briefing on Covid-19.” World Health Organization, March 11, 2020. <bit.ly>
[Dr. Tedros Adhanom Ghebreyesus:] …
WHO [World Health Organization] has been assessing this outbreak around the clock and we are deeply concerned both by the alarming levels of spread and severity, and by the alarming levels of inaction.
We have therefore made the assessment that COVID-19 can be characterized as a pandemic.
[593] Press release: “COVID-19 and Other Global Health Issues.” World Health Organization, May 5, 2023. <www.justfacts.com>
[Dr. Tedros Adhanom Ghebreyesus:] …
Yesterday, the Emergency Committee met for the 15th time and recommended to me that I declare an end to the public health emergency of international concern. I have accepted that advice. It’s therefore with great hope that I declare COVID-19 over as a global health emergency.
[594] Paper: “Health Insurance and Mortality in U.S. Adults.” By Andrew P. Wilper and others. American Journal of Public Health, December 2009. Pages 2289–2295. <www.pnhp.org>
Page 2289:
Objectives. … We analyzed the relationship between uninsurance and death with more recent data.
Methods. We conducted a survival analysis with data from the Third National Health and Nutrition Examination Survey [NHANES III]. We analyzed participants aged 17 to 64 years to determine whether uninsurance at the time of interview predicted death.
Results. Among all participants, 3.1% (95% confidence interval [CI] = 2.5%, 3.7%) died. The hazard ratio for mortality among the uninsured compared with the insured, with adjustment for age and gender only, was 1.80 (95% CI = 1.44, 2.26). After additional adjustment for race/ethnicity, income, education, self- and physician-rated health status, body mass index, leisure exercise, smoking, and regular alcohol use, the uninsured were more likely to die (hazard ratio = 1.40; 95% CI = 1.06, 1.84) than those with insurance. …
The National Center for Health Statistics (NCHS) conducted NHANES III between 1988 and 1994. The survey combined an interview, physical examination, and laboratory testing. …
The NHANES III Linked Mortality File matched NHANES III records to the National Death Index (NDI). The NCHS’s linkage, which uses a probabilistic matching strategy through December 31, 2000, is described elsewhere.16 The NCHS perturbed the file to prevent reidentification of survey participants. Vital status was not altered in this process. The publicly released data yield survival analysis results virtually identical to the restricted-use NHANES III Linked Mortality File.17
… Of the 33994 individuals participating, 14798 were aged between 17 and 64 years at the time of the interview. … Of the 12775 participants not covered by government insurance, we excluded 663 … who lacked information on health insurance. We excluded 974 … because of failure to complete the interview and physical examination. [W]e included only the 9005 with complete baseline data from both the interview and physical examination in our final analysis (Figure 1).
Page 2292:
By the end of follow-up in 2000, 351 individuals, or 3.1% (95% CI [confidence interval] = 2.5%, 3.7%) of the sample, had died (Table 1). …
… In … models adjusted for gender, age, race/ethnicity, poverty income ratio, education, unemployment, smoking, regular alcohol use, self-rated health, physician-rated health, and BMI [body mass index], lack of health insurance significantly increased the risk of mortality (HR [hazard ratio] = 1.40; 95% CI=1.06, 1.84; Table 2). …
Replicating the methods of the IOM [Institute of Medicine] panel with updated census data24,25 and this hazard ratio, we calculated 27424 deaths among Americans aged 25 to 64 years in 2000 associated with lack of health insurance. Applying this hazard ratio to census data from 200526 and including all persons aged 18 to 64 years yields an estimated 35327 deaths annually among the nonelderly associated with lack of health insurance. When we repeated this approach without age stratification, (thought by investigators at the Urban Institute to be an overly conservative approach)23 we calculated approximately 44789 deaths among Americans aged 18 to 64 years in 2005 associated with lack of health insurance.
Page 2294:
Lack of health insurance is associated with as many as 44789 deaths per year in the United States, more than those caused by kidney disease (n=42868).41 The increased risk of death attributable to uninsurance suggests that alternative measures of access to medical care for the uninsured, such as community health centers, do not provide the protection of private health insurance. Despite widespread acknowledgment that enacting universal coverage would be life saving, doing so remains politically thorny. Now that health reform is again on the political agenda, health professionals have the opportunity to advocate universal coverage.
[595] Paper: “Health Insurance and Mortality in U.S. Adults.” By Andrew P. Wilper and others. American Journal of Public Health, December 2009. Pages 2289–2295. <www.pnhp.org>
Page 2292:
In … models adjusted for gender, age, race/ethnicity, poverty income ratio, education, unemployment, smoking, regular alcohol use, self-rated health, physician-rated health, and BMI [body mass index], lack of health insurance significantly increased the risk of mortality (HR [hazard ratio]=1.40; 95% CI [confidence interval]=1.06, 1.84; Table 2). …
… Applying this hazard ratio to census data from 200526 and including all persons aged 18 to 64 years yields an estimated 35327 deaths annually among the nonelderly associated with lack of health insurance. When we repeated this approach without age stratification (though by investigators at the Urban Institute to be an overly conservative approach)23 we calculated approximately 44789 deaths among Americans aged 18 to 64 years in 2005 associated with lack of health insurance.
[596] Paper: “Health Insurance and Mortality in U.S. Adults.” By Andrew P. Wilper and others. American Journal of Public Health, December 2009. Pages 2289–2295. <www.pnhp.org>
Page 2289:
First, we excluded those aged older than 64 years, as virtually all are eligible for Medicare. … [W]e also excluded nonelderly Medicare recipients and persons covered by Medicaid and the Department of Veterans Affairs/Civilian Health and Medical Program of the Uniformed Services military insurance (n=2023), as a substantial proportion of those individuals had poor health status as a prerequisite for coverage.
Page 2294:
Lack of health insurance is associated with as many as 44789 deaths per year in the United States, more than those caused by kidney disease (n=42868).41 The increased risk of death attributable to uninsurance suggests that alternative measures of access to medical care for the uninsured, such as community health centers, do not provide the protection of private health insurance. Despite widespread acknowledgment that enacting universal coverage would be life saving, doing so remains politically thorny. Now that health reform is again on the political agenda, health professionals have the opportunity to advocate universal coverage.
[597] Webpage: “About PNHP.” Physicians for a National Health Program. Accessed September 20, 2019 at <pnhp.org>
“Physicians for a National Health Program is a single issue organization advocating a universal, comprehensive single-payer national health program.”
[598] Article: “New Study Finds 45,000 Deaths Annually Linked to Lack of Health Coverage.” By David Cecere. Harvard Gazette, September 17, 2009. <news.harvard.edu>
Steffie Woolhandler, study co-author, professor of medicine at Harvard Medical School, and a primary care physician at Cambridge Health Alliance, noted: “Historically, every other developed nation has achieved universal health care through some form of nonprofit national health insurance. Our failure to do so means that all Americans pay higher health care costs, and 45,000 pay with their lives.”
[599] Article: “Harvard Medical Study Links Lack of Insurance to 45,000 U.S. Deaths a Year.” By Reed Abelson. New York Times, September 17, 2009. <prescriptions.blogs.nytimes.com>
Dr. Woolhandler said the study should prompt policymakers in Washington to consider the impact of scaling back any effort to provide truly universal coverage. She expressed concern about some lawmakers’ willingness to adopt a plan that could expand coverage to only a portion of the nearly 50 million people who are without health insurance. As a proponent for a single-payer system—something like Medicare for all—she said she was also disappointed in the current proposals before Congress.
[600] Paper: “Health Insurance and Mortality in U.S. Adults.” By Andrew P. Wilper and others. American Journal of Public Health, December 2009. Pages 2289–2295. <www.pnhp.org>
Page 2289:
We analyzed data for individuals who reported no public source of health insurance at the time of the NHANES III [Third National Health and Nutrition Examination Survey conducted by the National Center for Health Statistics] interview. First, we excluded those aged older than 64 years, as virtually all are eligible for Medicare. … [W]e also excluded nonelderly Medicare recipients and persons covered by Medicaid and the Department of Veterans Affairs/Civilian Health and Medical Program of the Uniformed Services military insurance (n=2023), as a substantial proportion of those individuals had poor health status as a prerequisite for coverage.
[601] Paper: “The Relationship of Health Insurance and Mortality: Is Lack of Insurance Deadly?” By Steffie Woolhandler and David U. Himmelstein (co-authors of “Health Insurance and Mortality in U.S. Adults.”). Annals of Internal Medicine, September 19, 2017. Pages 424–431. <annals.org>
Page 424:
We excluded most observational studies that compared uninsured persons with those insured by Medicaid, Medicare, or the Department of Veterans Affairs because preexisting disability or illness can make an individual eligible for these programs. Hence, relative to those who are uninsured, publicly insured Americans have, on average, worse baseline health, thereby confounding comparisons. Conversely, comparing uninsured persons with those with private insurance (which is often obtained through employment) may be confounded by a “healthy worker” effect: that is, that persons may lose coverage because they are ill and cannot maintain employment. Nonetheless, most analysts of the relationship between uninsurance and mortality have viewed privately insured persons as the best available comparator, with statistical controls for employment, income, health status, and other potential confounders.
[602] Article: “Medicaid: 35 Years of Service.” By Christie Provost and Paul Hughes. Health Care Financing Review, Fall 2000. Pages 141–174. <www.ncbi.nlm.nih.gov>
Pages 142–143:
Medicaid eligibility is based on a combination of financial and categorical requirements. Medicaid is a means-tested program. Beneficiaries must be low-income and meet certain asset and resource standards. Each State determines income thresholds and resource standards for their Medicaid program, following Federal guidelines. These thresholds and standards can vary by State, and may differ for each Medicaid-eligible population group within a State (i.e., children, adults, elderly, individuals with disabilities.)
Medicaid does not provide medical assistance to all low-income individuals. Traditionally, Medicaid has been available only to persons in certain categories: members of families with children and pregnant women, and to persons with disabilities or who are aged or blind. Low-income individuals who did not fit into one of these categories, such as childless couples or adults without disabilities, typically did not qualify for Medicaid—regardless of how low their income. Program waivers and additional mandatory eligibility groups have provided States with opportunities to extend Medicaid services to populations beyond the traditional welfare-defined groups.
The Medicaid statute identifies certain populations that States are required to cover and other populations that States may choose to cover. All States must provide Medicaid coverage to the following eligibility groups:
• Certain low-income families—States are required to provide Medicaid to individuals who meet the requirements of the AFDC [Aid to Families with Dependent Children] program that were in effect in their State as of July 16, 1996.
• Poverty-related groups—States are required to provide Medicaid to certain pregnant women and children under age 6 with incomes up to 133 percent of the Federal poverty level (FPL). States must also cover all children born after September 30, 1983, with incomes up to 100 percent of FPL. This requirement will result in the mandatory coverage of all children below 100 percent of FPL under age 19 by 2003.
• Current and some former recipients of SSI [Social Security]—States are generally required to provide Medicaid to recipients of SSI. States, however, may use more restrictive eligibility standards for Medicaid than those used for SSI if they were using those standards prior to the enactment of SSI in 1972.
• Foster care and adoption assistance— States must provide Medicaid to all recipients of foster care and adoption assistance under Title IV-E of the Social Security Act.
• Certain Medicare beneficiaries—State Medicaid programs must provide supplementary assistance to low-income Medicare beneficiaries. All Medicare beneficiaries with incomes below the FPL [federal poverty level] receive Medicaid assistance for payment of Medicare premiums, deductibles, and cost sharing. These individuals are qualified Medicare beneficiaries (QMBs). In addition, individuals at the lowest income levels are entitled to full Medicaid benefits, which provide coverage for services not covered by Medicare such as outpatient prescription drugs. Medicare beneficiaries with income levels slightly higher than the FPL receive Medicaid assistance for payment of Medicare premiums. These individuals are specified low-income Medicare beneficiaries (SLMBs).
[603] Calculated with data from:
a) Paper: “Health Insurance and Mortality in U.S. Adults.” By Andrew P. Wilper and others. American Journal of Public Health, December 2009. Pages 2289–2295. <www.pnhp.org>
Page 2289: “We analyzed participants aged 17 to 64 years to determine whether uninsurance at the time of interview predicted death.”
b) Dataset: “Table 1. Medicaid Enrollee by Group, FFY 2000.” Kaiser Family Foundation, February 29, 2004. <www.kff.org>
“(Rounded to Nearest 100) … United States … Total [=] 44,279,100 … Aged [=] 4,978,000 … Disabled [=] 6,826,200 … Adult [=] 10,626,600 … Children [=] 21,848,300 … ‘Aged’ includes all people age 65 and older. ‘Disabled’ includes younger persons (age 64 and under) who are reported as eligible due to a disability. ‘Adults’ are generally people aged 18 to 64 and ‘children’ are general people age 17 and younger.”
CALCULATIONS:
[604] Paper: “Health Insurance and Mortality in U.S. Adults.” By Andrew P. Wilper and others. American Journal of Public Health, December 2009. Pages 2289–2295. <www.pnhp.org>
Page 2289:
After additional adjustment for race/ethnicity, income, education, self- and physician-rated health status, body mass index, leisure exercise, smoking, and regular alcohol use, the uninsured were more likely to die (hazard ratio = 1.40; 95% CI = 1.06, 1.84) than those with insurance. …
The National Center for Health Statistics (NCHS) conducted NHANES III [National Health and Nutrition Examination Survey] between 1988 and 1994. The survey combined an interview, physical examination, and laboratory testing.
Page 2290:
NHANES III measured participants’ self-perceived health in 5 categories: excellent, very good, good, fair, and poor. We combined the last 2 groups because of small numbers. NHANES physicians performed physical examinations on all participants and provided an impression of overall health status rated as excellent, very good, good, fair, and poor.21 We combined the final 2 groups because of small numbers. …
We analyzed the relation between insurance, demographics, baseline health status variables, and mortality by using x2 tests. … In this Cox proportional hazards analysis, we controlled for gender, age, race/ethnicity (4 categories), income (poverty income ratio), education, current unemployment, smoking status (3 categories), regular alcohol use, self-rated health (4 categories), physician-rated health (4 categories), and MBI [body mass index] (4 categories].
[605] Report: “How Accessible Is Individual Health Insurance for Consumers in Less-Than-Perfect Health?” Kaiser Family Foundation, June 2001. <www.kff.org>
Page i:
The Kaiser Family Foundation commissioned researchers at Georgetown University’s Institute for Health Care Research and Policy to design a study testing access to coverage in the individual health insurance market by constructing seven hypothetical applicants and asking insurers to consider them as though they were real consumers. For each consumer, we asked 19 insurance companies and HMOs [health maintenance organization] in eight markets around the country (Arlington Heights, Illinois; Austin, Texas; Corning, Iowa; Fresno, California; Miami, Florida; Richmond, Virginia; Tucson, Arizona; and Winamac, Indiana) how they would respond to an application for coverage. Communities were chosen based on geographic diversity and to test how the individual market functions in states with few restrictions on insurer practices. This resulted in a total of 60 applications per person and a total of 420 applications for the group. Each insurer was asked to “underwrite” the applicants (that is, to determine whether or not they would be offered coverage and on what terms) using a policy that included a $500 deductible and a $20 co-payment per physician office visit. …
Insurers responded to these hypothetical applications by either accepting the applicant for standard coverage at a standard rate for a healthy person (i.e., a “clean offer”), rejecting the applicant, offering coverage with special restrictions on covered benefits (for example, to exclude benefits through a “rider”), or offering coverage at a higher-than-standard premium (i.e., a “rate-up” or surcharge). Some responses combined special benefit restrictions with a rate-up.
Pages ii–iii:
Taken as a group, the 7 hypothetical insurance consumers made 420 applications for coverage. Most of the time (90%), the consumers were unable to obtain the coverage for which they applied at a standard rate—only 43 clean offers of coverage were made (10%). They were rejected 154 times (including 9 cases where Colin was rejected but the remainder of his family was accepted), or 37% of the time. Greg accounted for 60 of the rejections. Among the 63% of applications that were accepted, the vast majority (53%) imposed benefit restrictions (118, representing 28% of all applications), premium surcharges (56, or 13%), or both (49, or 12%).
The average premium quoted for the five single applicants who received any offers of coverage was $333 per month, or $3,996 per year. Had these applicants been in perfect health (and therefore not denied coverage or rated-up), the average standard rate that would have been available to them would have been $249 per month, or $2,988 per year. The average premium rate-up, when applied on a single-only policy, was 38%. …
Implications for Consumers: Consumers who are in less-than-perfect health clearly face barriers to obtaining health insurance coverage in the individual insurance market. Insurance carriers often decline to cover people who have pre-existing medical conditions, and even when they offer coverage, frequently impose severe limitations on the coverage for any expenses related to the pre-existing condition or charge more to cover these expenses. This can price insurance out of the reach of many consumers in poor health or create significant gaps in coverage that could result in being underinsured.
[606] Report: “Coverage Denials for Pre-Existing Conditions in the Individual Health Insurance Market.” By Henry A. Waxman and Bart Stupak. U.S. House of Representatives, Committee on Energy and Commerce, October 12, 2010. <oversight.house.gov>
Pages 3–4:
From 2007 to 2009, the four largest for-profit health insurance companies, Aetna, Humana, UnitedHealth Group, and WellPoint, refused to provide health insurance coverage to more than 651,000 people based on their prior medical history.6 …
… By 2009, Aetna, Humana, UnitedHealth Group, and WellPoint denied health insurance coverage to 15.3% of their applicants in the individual market due to pre-existing conditions. On average, the four companies denied coverage to one out of every seven applicants based on a pre-existing condition.
The actual number of coverage denials is likely to be significantly higher than reported by the companies. The companies do not report as denials individuals who are discouraged from applying for coverage by insurance agents because of their pre-existing conditions. A document from one company states that one-third of its applicants do not obtain coverage because of preexisting conditions.8 This estimate may reflect the actual denial rate when individuals who are discouraged from submitting formal applications are taken into account.
6 Letter from Counsel, Aetna, to Henry A. Waxman, Chairman, Committee on Energy and Commerce, and Bart Stupak, Chairman, Subcommittee on Oversight and Investigations, Committee on Energy and Commerce (Mar. 26, 2010); Letter from Counsel, Humana, Inc., to Henry A. Waxman, Chairman, Committee on Energy and Commerce, and Bart Stupak, Chairman, Subcommittee on Oversight and Investigations, Committee on Energy and Commerce (Mar. 12, 2010); Letter from Counsel, UnitedHealth Group, to Henry A. Waxman, Chairman, Committee on Energy and Commerce, and Bart Stupak, Chairman, Subcommittee on Oversight and Investigations, Committee on Energy and Commerce (Mar. 19, 2010); and Letter from Counsel, WellPoint, Inc., to Henry A. Waxman, Chairman, Committee on Energy and Commerce, and Bart Stupak, Chairman, Subcommittee on Oversight and Investigations, Committee on Energy and Commerce (Mar. 12, 2010).
[607] Paper: “Health Insurance Coverage and Mortality Revisited.” By Richard Kronick. Health Services Research, August 2009. Pages 1211–1231. <onlinelibrary.wiley.com>
Pages 1215–1216:
An even more vexing problem is the difficulty of drawing firm inferences from observational analyses given the likelihood of omitted variables and the problems created by reverse causality—not only might insurance affect health, but health status affects the desire for insurance and the ability to become insured. If we find that survival probabilities are lower for uninsured respondents than for similarly situated respondents with insurance, we cannot be sure whether those differences are a causal result of not having insurance, or whether there are unmeasured factors that are associated with lack of insurance and causally related to mortality.
Plausible hypotheses can be constructed regarding a variety of omitted variables. For example, characteristics such as willingness to take risks, amount of value placed on health, amount of value placed on health care, ability to pass an underwriting screen in the non-group market, and the levels of job-related, family-related, and environmental stress are plausibly causally connected to survival probabilities. These characteristics are not well measured in any of the surveys used in the analyses reviewed here, and are likely related to lack of insurance.
[608] Paper: “Health Insurance and Mortality in U.S. Adults.” By Andrew P. Wilper and others. American Journal of Public Health, December 2009. Pages 2289–2295. <www.pnhp.org>
Page 2293:
NHANES III [Third National Health and Nutrition Examination Survey conducted by the National Center for Health Statistics] assessed health insurance at a single point in time and did not validate self-reported insurance status. We were unable to measure the effect of gaining or losing coverage after the interview. Point-in-time uninsurance is associated with subsequent uninsurance.6 … Earlier population-based surveys that did validate insurance status found that between 7% and 11% of those initially recorded as being uninsured were misclassified.13 …
We have no information about duration of insurance coverage from this survey.
6 McWilliams JM, Zaslavsky AM, Meara E, Ayanian JZ. Health Insurance Coverage and Mortality Among the Near-Elderly. Health Aff (Millwood). 2004;23:223–233.
[609] Paper: “Health Insurance Coverage and Mortality Among the Near-Elderly.” By J. Michael McWilliams and others. Health Affairs, July/August 2004. Pages 223–233. <www.healthaffairs.org>
Page 227: “Among adults who were uninsured in 1992, the proportion of respondents who reported being publicly or privately insured rose progressively in the ensuing four surveys (46.6 percent, 58.4 percent, 66.1 percent, and 74.5 percent), as nearly half reached age sixty-five and became eligible for Medicare by 2000.”
[610] Paper: “Health Insurance and Mortality in U.S. Adults.” By Andrew P. Wilper and others. American Journal of Public Health, December 2009. Pages 2289–2295. <www.pnhp.org>
Page 2289: “Conclusions. Uninsurance is associated with mortality.”
[611] Oxford American Handbook of Clinical Medicine (2nd edition). Edited by John A. Flynn, Michael J. Choi, and L. Dwight Wooster. Oxford University Press, 2013.
Chapter 2: “Epidemiology.” By Gregory P. Prokopowicz. Pages 26–35.
Page 28:
Association Epidemiological research is concerned with comparing rates of disease in populations with different exposures (for example, rates of lung cancer in a population of men who smoke, compared with med who do not). A difference in rates suggests an association between the disease and the exposure (in this case, smoking). The search for meaningful associations may be complicated by the presence of confounders, or factors that are related to both the exposure and the disease. For example, an apparent association between alcohol use and lung cancer may simply reflect the fact that both are related to tobacco use. Associations may also be due simply to chance. …
Observational studies Associations are often discovered using observational studies. Such studies are distinguished from experimental studies or clinical trials in that the investigator does not control the exposure; she or he merely observes the subjects who are exposed and those who are not and records the outcomes occurring in each group.
[612] Book: Health Policy and the Uninsured. Edited by Catherine G. McLaughlin. Urban Institute Press, 2004.
Chapter 4: “Does Health Insurance Really Affect Health?” By Helen Levy and David Meltzer. Pages 179–204.
Page 179:
Causation is difficult to establish because we almost never observe truly random variation in health insurance status. … Moreover, the causal relationship between health insurance and health is likely to run in both directions; health status may affect insurance coverage and insurance may affect health. This makes it difficult to determine whether a correlation between health insurance and health status reflects the effect of health insurance on health, the effect of health on health insurance, or the effect of some other attribute, such as socioeconomic status, on both health insurance and health status.
Page 183:
Observational studies do little or nothing to acknowledge endogeneity. Most simply compare health outcomes for the insured to outcomes for the uninsured. Some use regression analyses to control for covariates such as income, age, gender, race, behavior (for example, smoking), and other medical conditions. Such analyses … are confounded by both observable and unobservable difference between people who do and do not have health insurance. As a result, such studies are not likely to provide much insight into the causal effect of health insurance on health.
NOTE: Credit for bringing this work to our attention belongs to Richard Kronick [Paper: “Health Insurance Coverage and Mortality Revisited.” Health Services Research, August 2009. Pages 1211–1231. <onlinelibrary.wiley.com>] and Chris Conover [Article: “How Risky Is It To Be Uninsured? Part I: Mortality Risk.” Forbes, March 28, 2014. <www.forbes.com>]
[613] Book: Introductory Econometrics: Using Monte Carlo Simulation with Microsoft Excel. By Humberto Barreto and Frank M. Howland. Cambridge University Press, 2006.
Page 491:
Omitted variable bias is a crucial topic because almost every study in econometrics is an observational study as opposed to a controlled experiment. Very often, economists would like to be able to interpret the comparisons they make as if they were the outcomes of controlled experiments. In a properly conducted controlled experiment, the only systematic difference between groups results from the treatment under investigation; all other variation stems from chance. In an observational study, because the participants self-select into groups, it is always possible that varying average outcomes between groups result from systematic difference between groups other than the treatment. We can attempt to control for these systematic differences by explicitly incorporating variables in a regression. Unfortunately, if not all of those differences have been controlled for in the analysis, we are vulnerable to the devastating effects of omitted variable bias.
[614] Book: Multiple Regression: A Primer. By Paul D. Allison. Pine Forge Press, 1998. Chapter 1: “What Is Multiple Regression?” Pages 1–23. <us.sagepub.com>
Page 1: “Multiple regression is a statistical method for studying the relationship between a single dependent variable and one or more independent variables. It is unquestionably the most widely used statistical technique in the social sciences. It is also widely used in the biological and physical sciences.”
Page 20:
Multiple regression shares an additional problem with all methods of statistical control, a problem that is the major focus of those who claim that multiple regression will never be a good substitute for the randomized experiment. To statistically control for a variable, you have to be able to measure that variable so that you can explicitly build it into the data analysis, either by putting it in the regression equation or by using it to form homogeneous subgroups. Unfortunately, there’s no way that we can measure all the variables that might conceivably affect the dependent variable. No matter how many variables we include in a regression equation, someone can always come along and say, “Yes, but you neglected to control for variable X and I feel certain that your results would have been different if you had done so.”
That’s not the case with randomization in an experimental setting. Randomization controls for all characteristics of the experimental subjects, regardless of whether those characteristics can be measured. Thus, with randomization there’s no need to worry about whether those in the treatment group are smarter, more popular, more achievement oriented, or more alienated than those in the control group (assuming, of course, that there are enough subjects in the experiment to allow randomization to do its job effectively).
[615] Book: Regression With Social Data: Modeling Continuous and Limited Response Variables. By Alfred DeMaris. John Wiley & Sons, 2004.
Page 9:
Regression modeling of nonexperimental data for the purpose of making causal inferences is ubiquitous in the social sciences. Sample regression coefficients are typically thought of as estimates of the causal impacts of explanatory variables on the outcome. Even though researchers may not acknowledge this explicitly, their use of such language as impact or effect to describe a coefficient value often suggest a causal interpretation. This practice is fraught with controversy….
Page 12:
Friedman … is especially critical of drawing causal inferences from observational data, since all that can be “discovered,” regardless of the statistical candlepower used, is association. Causation has to be assumed into the structure from the beginning. Or, as Friedman … says: “If you want to pull a causal rabbit out of the hat, you have to put the rabbit into the hat.” In my view, this point is well taken; but it does not preclude using regression for causal inference. What it means, instead, is that prior knowledge of the causal status of one’s regressors is a prerequisite for endowing regression coefficients with a causal interpretation, as acknowledged by Pearl 1998.
Page 13: “In sum, causal modeling via regression, using nonexperimental data, can be a useful enterprise provided we bear in mind that several strong assumptions are required to sustain it. First, regardless of the sophistication of our methods, statistical techniques only allow us to examine associations among variables.”
[616] Paper: “Econometric Methods for Causal Evaluation of Education Policies and Practices: A Non-Technical Guide.” By Martin Schlotter, Guido Schwerdt, and Ludger Woessmann. Education Economics, January 2011. <www.tandfonline.com>
Page 110:
Using standard statistical methods, it is reasonably straightforward to establish whether there is an association between two things—for example, between the introduction of a certain education reform (the treatment) and the learning outcome of students (the outcome). However, whether such a statistical correlation can be interpreted as the causal effect of the reform on outcomes is another matter. The problem is that there may well be other reasons why this association comes about.
Page 111:
Whenever other reasons exist that give rise to some correlation between the two things of interest—the treatment and the outcome—the overall correlation cannot be interpreted as the causal effect of the treatment on the outcome. Broadly speaking, this is what economists call the “endogeneity problem”. The term stems from the idea that treatment cannot be viewed as exogenous to the model of interest, as it should be, but that it is rather endogenously determined within the model—depending on the outcome or being jointly determined with the outcome by a third factor. Because of the problem of endogeneity, estimates of the association between treatment and outcome based on correlations will be biased estimates of the causal effect of treatment on outcome.2
Standard approaches try to deal with this problem by observing the other sources of possible correlation and take out the difference in outcomes that can be attributed to these other observed differences. This is the approach of multivariate models that estimate the effects of multiple variables on the outcome at the same time, such as the classical ordinary least-squares (OLS) or multilevel modeling (or hierarchical linear models, HLM) techniques. They allow estimating the association between treatment and outcome conditional on the effects of the other observed factors.
2 Other possible sources of endogeneity include self-selection (objects with different characteristics can choose whether to be treated or not) and simultaneity (treatment and outcome are choice variables that are jointly determined). In econometric terms, measurement error in the treatment variable can also be interpreted as an endogeneity problem, because it gives rise to a particular form of association between treatment and outcome (one that generally biases the estimates toward finding no effect, even if there was one).
[617] Paper: “Health Insurance Coverage and Mortality Revisited.” By Richard Kronick. Health Services Research, August 2009. Pages 1211–1231. <onlinelibrary.wiley.com>
Page 1211:
Objective. To improve understanding of the relationship between lack of insurance and risk of subsequent mortality. …
Conclusions. … It is not possible to draw firm causal inferences from the results of observational analyses, but there is little evidence to suggest that extending insurance coverage to all adults would have a large effect on the number of deaths in the United States.
Page 1214:
Table 1: Comparison of Population-Based Studies of Lack of Insurance and Mortality … This Study … Control variables … Age … Gender … Race … Income … Employment status … Education … Self-rated health … Smoking … BMI [body mass index] … Ethnicity … Marital status … Immigration status … Owns telephone … Mobile home … Veteran status … Functional limitations … Survey year
Pages 1217–1218:
The analysis uses data from the National Health Interview Survey (NHIS) and the NHIS Linked Mortality Files. The NHIS is a multistage probability sample of the U.S. civilian noninstitutionalized population conducted by the National Center for Health Statistics (NCHS). NCHS statisticians have matched adult respondents in the 1986 through 2000 NHIS samples with the 2002 National Death Index (NDI; NCHS 2005). …
Of the 672,526 adult respondents who were either privately insured or uninsured, the analysis excludes 29,525 … because they did not provide social security numbers or other information required for a match. … The remaining 643,001 respondents were followed for between 2 years (for 2000 interviewees) and 16 years (for 1986 interviewees).
… The analysis tests whether respondents who were uninsured when surveyed had different survival probabilities than otherwise similar privately insured respondents. Covariates include factors known to be related to survival (Table 1).
Page 1221: “[A]fter adjustment for the characteristics shown in Table 1, lacking health insurance at baseline is not independently associated with an increased risk of mortality (hazard ratio 1.03, 95 percent CI [confidence interval], 0.95–1.12) (Table 3).”
Page 1227: “The results presented here are counterintuitive. … Although not all medical care contributes directly to better health outcomes, some of the care that is not received by the uninsured (but that would be received by similar insured persons) should contribute to health and chances of survival. It is not clear why this common sense notion is at best only weakly supported by the analysis.”
Page 1228: “The results of this work strongly suggest that arguments in favor of universal coverage should not focus on the beneficial effects of that policy on the life expectancy of the currently uninsured.”
[618] Article: “Universal Health Insurance Might Not Save Lives.” ScienceDaily, April 27, 2009. <www.sciencedaily.com>
“It’s quite counterintuitive and it’s not a message that most people, including myself, want to hear,” said Kronick, a professor of family and preventive medicine at the University of California at San Diego. However, “the evidence we have concerning the relationship between lack of insurance and mortality is not very good, and a reasonable reading of that evidence is that the number of deaths in the United States probably wouldn’t change a lot if everybody gets health insurance.”
[619] Paper: “Health Insurance Coverage and Mortality Revisited.” By Richard Kronick. Health Services Research, August 2009. Pages 1211–1231. <onlinelibrary.wiley.com>
Page 1223:
I reestimate the basic model, but limit the causes of death to causes thought to be amenable to better health care (Nolte and McKee 2003). These “amenable” causes, including pneumonia, influenza, hypertension, diabetes, and cancers of the breast, cervix, and colon, account for approximately 15 percent of the deaths in the sample. There is no indication that lack of insurance has any effect on this subset of deaths (Table S3). Nolte and McKee suggest that ischemic heart disease, which accounts for approximately 8 percent of the deaths in the sample, might potentially be included in the list of “amenable” causes. Replicating the analysis after classifying ischemic heart disease as “amenable” produces virtually identical results (data not shown).
[620] Paper: “Health Insurance Coverage and Mortality Revisited.” By Richard Kronick. Health Services Research, August 2009. Pages 1211–1231. <onlinelibrary.wiley.com>
Page 1224:
I also investigate the relationship between lack of insurance and mortality after previously uninsured respondents turn 65. We might expect that the difference in mortality rates between the uninsured and insured in Figure 1 would narrow after people reach age 65, when Medicare coverage is virtually complete. However, the relationship between lack of insurance at baseline and mortality does not change after respondents turn 65 (Figure S1), although relatively small numbers of under-65 NHIS [National Health Interview Survey] respondents who are 65 and over during the follow-up period limit the power to observe a significant effect of Medicare on mortality. To test whether including deaths after age 65 affects the estimated relationship between lack of insurance and mortality, I censor the follow-up period when respondents reach age 65 and reestimate the model in Table 3. The results are no different from the uncensored model (Table S5).
[621] Paper: “Health Insurance Coverage and Mortality Revisited.” By Richard Kronick. Health Services Research, August 2009. Pages 1211–1231. <onlinelibrary.wiley.com>
Pages 1221, 1223:
The null effect observed in Table 3 may result, in part, from changes in insurance status during the follow-up period—some of those who are uninsured gain coverage, while some of the insured lose coverage. Two analyses explore whether changes in insurance status might account for the lack of effect. First, the follow-up period is shortened to increase the likelihood of comparing people who were continuously insured and uninsured. There is no indication that the relationship between lack of insurance and mortality is greater when the follow-up period is shorter (Table S1). Second, in 1993 and subsequent surveys, the NHIS [National Health Interview Survey] asked uninsured respondents how long they had been uninsured. Respondents who were uninsured for longer periods of time before the interview are more likely than others to remain uninsured subsequent to the interview. If changes in insurance status after the interview attenuate the estimated effect of lack of coverage, the estimated effect should be larger among respondents reporting longer periods of uninsurance. However, there is no indication of a dose–response relationship between time uninsured and probability of survival (Table S2).
[622] Paper: “Health Insurance Coverage and Mortality Revisited.” By Richard Kronick. Health Services Research, August 2009. Pages 1211–1231. <onlinelibrary.wiley.com>
Page 1211: “Conclusions. … It is not possible to draw firm causal inferences from the results of observational analyses, but there is little evidence to suggest that extending insurance coverage to all adults would have a large effect on the number of deaths in the United States.”
Page 1215: “An even more vexing problem is the difficulty of drawing firm inferences from observational analyses given the likelihood of omitted variables and the problems created by reverse causality—not only might insurance affect health, but health status affects the desire for insurance and the ability to become insured.”
Page 1216: “The best evidence to assess the effects of insurance on mortality would come from a randomized experiment, in which the only difference between the insured and the uninsured is that some people were randomly assigned to insurance, and others to being uninsured.”
[623] Book: Health Policy and the Uninsured. Edited by Catherine G. McLaughlin. Urban Institute Press, 2004.
Chapter 4: “Does Health Insurance Really Affect Health?” By Helen Levy and David Meltzer. Pages 179–204.
Page 179:
Causation is difficult to establish because we almost never observe truly random variation in health insurance status. … Moreover, the causal relationship between health insurance and health is likely to run in both directions; health status may affect insurance coverage and insurance may affect health. This makes it difficult to determine whether a correlation between health insurance and health status reflects the effect of health insurance on health, the effect of health on health insurance, or the effect of some other attribute, such as socioeconomic status, on both health insurance and health status.
Page 183:
Observational studies do little or nothing to acknowledge endogeneity. Most simply compare health outcomes for the insured to outcomes for the uninsured. Some use regression analyses to control for covariates such as income, age, gender, race, behavior (for example, smoking), and other medical conditions. Such analyses … are confounded by both observable and unobservable difference between people who do and do not have health insurance. As a result, such studies are not likely to provide much insight into the causal effect of health insurance on health.
NOTE: Credit for bringing this work to our attention belongs to Richard Kronick [Paper: “Health Insurance Coverage and Mortality Revisited.” Health Services Research, August 2009. Pages 1211–1231. <onlinelibrary.wiley.com>] and Chris Conover [Article: “How Risky Is It To Be Uninsured? Part I: Mortality Risk.” Forbes, March 28, 2014. <www.forbes.com>]
[624] Book: Multiple Regression: A Primer. By Paul D. Allison. Pine Forge Press, 1998. Chapter 1: “What Is Multiple Regression?” Pages 1–23. <us.sagepub.com>
Page 20:
Multiple regression shares an additional problem with all methods of statistical control, a problem that is the major focus of those who claim that multiple regression will never be a good substitute for the randomized experiment. To statistically control for a variable, you have to be able to measure that variable so that you can explicitly build it into the data analysis, either by putting it in the regression equation or by using it to form homogeneous subgroups. Unfortunately, there’s no way that we can measure all the variables that might conceivably affect the dependent variable. No matter how many variables we include in a regression equation, someone can always come along and say, “Yes, but you neglected to control for variable X and I feel certain that your results would have been different if you had done so.”
That’s not the case with randomization in an experimental setting. Randomization controls for all characteristics of the experimental subjects, regardless of whether those characteristics can be measured. Thus, with randomization there’s no need to worry about whether those in the treatment group are smarter, more popular, more achievement oriented, or more alienated than those in the control group (assuming, of course, that there are enough subjects in the experiment to allow randomization to do its job effectively).
[625] The 2008 Oregon Health Insurance Experiment was a randomized experiment in which participants were selected by lottery to apply for Medicaid. The Quarterly Journal of Economics published a follow-up to the experiment in 2012 that examined data through September 2009. Among the 0.8% of people who died, the authors did “not detect any statistically significant improvement in survival probability” among those with Medicaid.†
NOTES:
[626] Article: “Contributions of Health Care to Longevity: A Review of 4 Estimation Methods.” By Robert M. Kaplan and Arnold Milstein. Annals of Family Medicine, May/June 2019. Pages 267–272. <www.annfammed.org>
Page 267:
Health care expenditures and biomedical research funding are often justified by the belief that modern health care powerfully improves life expectancy in wealthy countries. We examined 4 different methods of estimating the effect of health care on health outcomes. …
It is estimated that a lack of access to medical care accounts for only about 10% of premature deaths.6 The methodology underlying these estimates, however, remains obscure. In this article we review 4 different estimates of the contributions of health care to premature mortality and other health outcomes.
Page 270: “Each of the 4 methods considered the percentage of premature deaths or poor health outcomes to be attributable to various factors. The methods reported here differ from regression models, which estimate the amount of variance attributable to various factors, although regression model estimates sometimes suggest similar conclusions.”
[627] Article: “Contributions of Health Care to Longevity: A Review of 4 Estimation Methods.” By Robert M. Kaplan and Arnold Milstein. Annals of Family Medicine, May/June 2019. Pages 267–272. <www.annfammed.org>
Page 270:
We estimated the effect of health care on premature death using 4 methods. The estimates converge around Schroeder’s conclusion6 that health care accounts for between 5% and 15% of the variation in premature death. The various methods were consistent in showing that social and behavioral factors account for a much higher percentage of the variation in premature mortality than health care does. … In sum, these methods indicate that social and behavioral factors account for substantially more of the variability in premature mortality than health care does.
Page 271:
An important article by Kreiger cautioned that causes of health should not be expected to sum to 100%.13 Different determinants of health might combine independently or synergistically to more than 100%. In part, this is because the determinants of health are often highly correlated. When the population-attributable fraction is determined independently for each risk factor, it is likely that the sum will exceed 100% because the overlap between pairs of determinants is double counted. …
Several lines of evidence suggest that income and poor health habits are associated with poor access to medical care.22,23 As a result, the population-attributable fraction for medical care should be inflated. In other words, the estimate that 10% of premature mortality is attributable to medical care is more likely to be an overestimate rather than an underestimate.
Page 272: “Efforts to model the value of health care spending often assume that 100% of the variation in health outcomes is attributable to health care services. … Our analyses reaffirm the belief that health care is 1 component of a larger set of influences on health outcomes.”
[628] Article: “Health Equity and the Fallacy of Treating Causes of Population Health as if They Sum to 100%.” By Nancy Krieger. American Journal of Public Health, April 2017. <www.ncbi.nlm.nih.gov>
Can the causes of population health be parsed into components that add up to 100%? For example, can they be divvied up into X% social and (100–X%) biological (or, more specifically, genetic)? …
The quick answer is “no”—causes of health cannot be forced to sum to 100%. For at least 80 years, since the mid-1930s, the scientific and mathematical argument has been clear: to the extent that multiple factors contribute, independently and synergistically, to the causal pathways leading to any particular health outcome, the sum of their contributions must exceed 100%.1–8 Moreover, the percentage of variation in outcomes that is “explained” by particular factors is not equivalent to the proportion of risk causally attributable to these factors.1–4,8 …
… Consider the classic case of smoking, asbestos, and lung cancer. As concisely explained by Greenland and Robins in 1988, “if some persons develop lung cancer solely because of their exposure to asbestos and smoking, such persons will contribute to the excess and etiologic fractions for both asbestos and smoking,” and in such a scenario, the attributable risks among the jointly exposed “can (and in fact do) sum to more than one.”5(p1193) …
In summary, in matters of life, health, and death, we humans, like other biological species, are not and never have been purely biological organisms or purely social beings; we are both, simultaneously.
[629] Article: “Contributions of Health Care to Longevity: A Review of 4 Estimation Methods.” By Robert M. Kaplan and Arnold Milstein. Annals of Family Medicine, May/June 2019. Pages 267–272. <www.annfammed.org>
Page 270: “The estimates converge around Schroeder’s conclusion6 that health care accounts for between 5% and 15% of the variation in premature death. The various methods were consistent in showing that social and behavioral factors account for a much higher percentage of the variation in premature mortality than health care does.”
Page 271:
We must emphasize that the 4 methods we reviewed are very different from one another. They use different outcome measures, analytic techniques, and data sets. One important concern in our comparison is that the 4 approaches differ in what was measured (Table 1). Some of the methods use attributable risk models and describe how much of current life expectancy, or a proxy for it, can be attributed to each determinant. A problem with attributable risks, as reported by McGinnis and Foege,8 is that they cannot simply be summed. To address this problem, the McGinnis and Foege method8 used death, rather than premature mortality, as the numerator, but the denominator remained undefined. Other models estimate the contribution of each factor for increasing life expectancy. While we observed that each approach converges on somewhat the same result, we are unable to explain why this should be the case.
[630] Article: “Contributions of Health Care to Longevity: A Review of 4 Estimation Methods.” By Robert M. Kaplan and Arnold Milstein. Annals of Family Medicine, May/June 2019. Pages 267–272. <www.annfammed.org>
Page 270:
Newhouse and the Insurance Experiment Group
An additional approach is represented by the RAND Health Insurance Experiment.10 The experiment, conducted in the 1970s, randomly assigned families to health insurance plans that varied in required copayments.19 …
Variations in cost sharing had a substantial impact on the use of health care services. … These results suggest that manipulation of out-of-pocket expenditures has substantial effects on the utilization of health care. For our purposes, the manipulation of health insurance benefits created an experimental comparison of the effects of having more or less health care.
The effect of variability in health services received on health outcomes was less clear. Overall, assignment to different levels of cost sharing did not have substantial effects on health outcomes. An early article suggested that variation in health care had no effect on health status.11 A later analysis showed that less health care resulted in damaged health for some vulnerable populations. For example, hypertension was less well controlled among those in the high-cost sharing plan, resulting in an approximate 10% increase in the probability of death.21
On the basis of the RAND Health Insurance Experiment and subsequent analyses, we use a range of 0% to 10% assessment for the effects of health care on longevity. …
Table 2. Summary of Estimates from 4 Methods … Newhouse10 … Social Circumstances [=] NE [not estimated] … Behavior Patterns [=] NE … Medical Care [=] 0–10
[631] See here for more information on the RAND Health Insurance Experiment and its outcomes.
[632] Article: “Contributions of Health Care to Longevity: A Review of 4 Estimation Methods.” By Robert M. Kaplan and Arnold Milstein. Annals of Family Medicine, May/June 2019. Pages 267–272. <www.annfammed.org>
Page 268:
In an article cited over 800 times, Schroeder6 argued that 40% of premature deaths can be attributed to behavior patterns, 15% to social circumstances, 10% to medical care, and 5% to environmental exposure. … Schroeder’s estimates6 were based on a 1993 article by McGinnis and Foege8 and 2002 article by McGinnis, Williams-Russo, and Knickman.14 They explored information about the presence or absence of factors associated with premature mortality for the leading causes of death. … Factors considered in their analysis ranged from health habits to preventable infectious diseases, and any toxic exposures. For each leading cause of death, McGinnis and Foege8 calculated a population-attributable fraction associated with risk for the fatal disease. …
Table 1. Summary of the Data Sources and Analysis Methods … McGinnis,8 Schroeder6 … Population [=] US population … Data Source [=] US Vital Statistics … Analysis Method [=] Examined PAF [population attributable fraction] for a range of risk factors associated with defined causes of death.
[633] Article: “Contributions of Health Care to Longevity: A Review of 4 Estimation Methods.” By Robert M. Kaplan and Arnold Milstein. Annals of Family Medicine, May/June 2019. Pages 267–272. <www.annfammed.org>
Page 269:
Park and Colleagues
… The 2010–2013 County Health Rankings and Roadmaps database provided information from 2,966 of the 3,141 counties in the United States, which was used with latent growth curve modeling (LGCM) to estimate the contributions of factors to the variability of selected health outcomes. The outcomes included premature mortality and morbidity assessed through self-reported poor physical health days, self-reported poor mental health days, and low birthweight. The index gave equal weight to mortality and morbidity. The predictor variables included health behaviors (tobacco use, diet and exercise, alcohol use, sexual activity), clinical care (access to care, quality of care), social and economic factors (education, employment income, family and social support, community safety), and physical environment (air quality and building environment). The County Health Ranking and Roadmaps database included detailed information on each of these characteristics. …
The adjusted multilevel LGCM model was used to estimate the relative contributions of each factor to the aggregate health outcomes. …
[634] Article: “Contributions of Health Care to Longevity: A Review of 4 Estimation Methods.” By Robert M. Kaplan and Arnold Milstein. Annals of Family Medicine, May/June 2019. Pages 267–272. <www.annfammed.org>
Page 269:
Wennberg and Colleagues
… The investigators used Medicare claims data to estimate which factors account for the variations in cost and in mortality, using (1) a medical diagnoses index based on the Centers for Medicare and Medicaid Services Hierarchical Condition Clusters Index; (2) a poverty index based on the proportion of the population aged 65 years and older that had total household incomes below the federal poverty line; and (3) a behavioral health index based on the number of people with hip fractures, obesity, self-reported health problems, smoking, and strokes. …
The index of medical diagnoses … explained only about 5% of the variation in mortality adjusted for age, sex, and race. Conversely, the behavioral index was a much better predictor, explaining 65% of the variation in mortality. In other words, knowing the diagnoses of people in a geographic region does not tell us a lot about death rates. Further, some communities spend much more on medical care than others. With or without adjustment for the disease burden, communities that receive more medical care do not have longer life expectancies.
[635] Article: “We Can Do Better—Improving the Health of the American People.” By Steven A. Schroeder. New England Journal of Medicine, September 20, 2007. <www.nejm.org>
Health is influenced by factors in five domains—genetics, social circumstances, environmental exposures, behavioral patterns, and health care (Figure 1).10,11 When it comes to reducing early deaths, medical care has a relatively minor role. Even if the entire U.S. population had access to excellent medical care—which it does not—only a small fraction of these deaths could be prevented. The single greatest opportunity to improve health and reduce premature deaths lies in personal behavior. In fact, behavioral causes account for nearly 40% of all deaths in the United States.12 Although there has been disagreement over the actual number of deaths that can be attributed to obesity and physical inactivity combined, it is clear that this pair of factors and smoking are the top two behavioral causes of premature death (Figure 2).12 …
Environmental factors, such as lead paint, polluted air and water, dangerous neighborhoods, and the lack of outlets for physical activity, also contribute to premature death. People with lower socioeconomic status have greater exposure to these health-compromising conditions. As with social determinants of health and health insurance coverage, remedies for environmental risk factors lie predominantly in the political arena.44
[636] Article: “The Case for More Active Policy Attention to Health Promotion.” By J. Michael McGinnis, Pamela Williams-Russo, and James R. Knickman. Health Affairs, March/April 2002. Pages 78–93. <www.healthaffairs.org>
Pages 79–81:
Drawing on the power of the extensive studies of the past generation, we can now speak about our health prospects as being shaped by our experiences in five domains: genetic and gestational endowments, social circumstances, environmental conditions, behavioral choices, and medical care.8
Genetics. Our predispositions to health or disease begin to take form at the moment of conception, embedded in our genetic blueprint for construction of the proteins that give form … even to the biologic limit of our life expectancies. …
Although only about 2 percent of deaths in the United States may be attributed to purely genetic diseases, perhaps 60 percent of late-onset disorders—such as diabetes, cardiovascular disease, and cancer—have some genetic component.10 …
Social circumstances. … Health is powerfully influenced by education, employment, income disparities, poverty, housing, crime, and social cohesion. …
For the population as a whole, the most consistent predictor of the likelihood of death in any given year is level of education; persons aged 45–64 in the highest levels of education have death rates 2.5 times lower than those of persons in the lowest level.16 Poverty, another strong influence, has been estimated to account for 6 percent of U.S. mortality.17
Page 83: “Over the course of the twentieth century, about five of the thirty years of increased life expectancy could be attributable to better medical care.31”
[637] “Global Status Report on Noncommunicable Diseases: 2010.” World Health Organization, 2011. <www.who.int>
Page 16: “[C]ommon, preventable risk factors underlie most NCDs [non-communicable diseases]. Most NCDs are strongly associated and causally linked with four particular behaviours: tobacco use, physical inactivity, unhealthy diet and the harmful use of alcohol.”
[638] Report: “Leading Causes of Morbidity and Mortality and Associated Behavioral Risk and Protective Factors—United States, 2005–2013.” By Nicole Blair Johnson and others. Centers for Disease Control and Prevention, October 31, 2014. <www.cdc.gov>
Page 16:
Many of these preventable deaths might be averted through behaviors and strategies that can decrease risk and increase protection from developing these conditions. For example, the national reductions in tobacco use alone since 1964 have been attributed with increasing life expectancy by 30% 25. Continued improvements could be made in extending life expectancy, decreased YPLL [years of potential life lost] as a result of the leading causes of death, and improved quality of life with greater decreases in risky behaviors such as tobacco use and binge drinking; increases in protective factors such as physical activity and improved nutrition; increased control of chronic conditions such as high blood pressure, high cholesterol, and diabetes; and decreases in the preventable transmission of infectious diseases.
Improvements in the health issues included in this report are indications of the benefits of public health efforts but also highlight areas for further work. The areas that have seen the greatest shifts (e.g., deaths caused by heart disease, stroke, and motor-vehicle injuries) are those areas for which there are prevention strategies with a strong evidence base (e.g., tobacco prevention and cessation, use of child restraints, and avoiding impaired driving). At the same time, obesity-related health issues that impact chronic disease rates and deaths continue to be a challenge, as obesity rates for adults and youth have stayed level in recent years. Poisonings from drug overdose are equally concerning as death rates continue to rise, and they have become the leading cause of injury death.
[639] Webpage: “About American Medical News.” American Medical News. Accessed June 19, 2019 at <amednews.com>
“American Medical News is the print and online news source for physicians published by the American Medical Association.”
[640] Article: “Uninsured Rate Remains Stable Even as Incomes Drop.” By Doug Trapp. American Medical News, September 26, 2011. <amednews.com>
“The number of uninsured Americans grew by nearly 1 million between 2009 and 2010 to reach 49.9 million. But the percentage of uninsured people increased by only 0.2 percentage points to reach 16.3%—not a statistically significant hike, according to the report, released Sept. 13 by the U.S. Census Bureau.”
[641] Press release: “New U.S. Census Data Show Rise in Number of Uninsured Americans, Underscoring Importance of Affordable Care Act.” Statement from Alan Baker (interim executive director). American Public Health Association, September 13, 2011. <www.apha.org>
According to data released today by the U.S. Census Bureau on income, poverty and health insurance coverage, 49.9 million Americans are uninsured, which increased slightly from 49 million in 2009. …
Since the Affordable Care Act was enacted, we’ve made tremendous progress in improving the delivery and financing of health services in the United States. … Yet, with 49.9 million lacking access to quality, affordable care, we still find ourselves in a dire situation.
On behalf of the entire public health community, APHA [American Public Health Association] calls on Congress to fully implement and fund the main public health and coverage provisions included in the Affordable Care Act that take effect in 2014.
[642] Article: “Key Points of U.S. Census Report: Health Insurance and Poverty.” Star Ledger, September 14, 2011. <www.nj.com>
“The number of uninsured Americans increased steadily and significantly the past 10 years. In 2010, as people lost jobs and their employer-sponsored health insurance, the number of uninsured grew from 49.0 million in 2009 to 49.9 million—exceeding the combined population of 25 states. More than one out of every six people in the United States were uninsured.”
[643] Editorial: “Bleak News on Health Insurance.” By the Editorial Board. New York Times, September 14, 2011. <www.nytimes.com>
Nearly one million more Americans went without health insurance in 2010 than in 2009. This distressing news is further evidence of the need for government safety net programs and the national health care reforms that will take effect mostly in 2014.
The Census Bureau reported this week that the number of uninsured people rose to 49.9 million last year, up from 49 million the previous year. This is particularly troubling during an economic downturn in which more people have been pushed into poverty and median family income has plummeted, leaving the uninsured with even fewer resources to pay for health care.
[644] Calculated with data from the report: “Income, Poverty, and Health Insurance Coverage in the United States: 2010.” By Carmen DeNavas-Walt, Bernadette D. Proctor, and Jessica C. Smith. U.S. Department of Commerce, Census Bureau, September 2011. <www2.census.gov>
Page 1: “This report presents data on income, poverty, and health insurance coverage in the United States based on information collected in the 2011 and earlier Current Population Survey Annual Social and Economic Supplements (CPS ASEC) conducted by the U.S. Census Bureau.”
Pages 26–27: “Table 8. People Without Health Insurance Coverage by Selected Characteristics: 2009 and 2010 (Numbers in thousands.… People as of March of the following year.)”
|
Uninsured |
2009 |
2010 |
||
|
Number |
Portion of |
Number |
Portion of Uninsured† |
|
|
Total |
48,985 |
100% |
49,904 |
100% |
|
Not a Citizen |
9,729 |
20% |
9,667 |
19% |
|
Income of $50,000 to $74,999 |
8,997 |
18% |
8,831 |
18% |
|
Income of $75,000 or more |
9,669 |
20% |
9,473 |
19% |
|
Income of $50,000 or more† |
18,666 |
38% |
18,304 |
37% |
NOTE: † Calculated by Just Facts.
[645] Report: “Income, Poverty, and Health Insurance Coverage in the United States: 2010.” By Carmen DeNavas-Walt, Bernadette D. Proctor, and Jessica C. Smith. U.S. Department of Commerce, Census Bureau, September 2011. <www2.census.gov>
Page 75:
Appendix C. Estimates of Health Insurance Coverage
Quality of Health Insurance Coverage Estimates
National surveys and health insurance coverage. Health insurance coverage is likely to be underreported on the Current Population Survey (CPS). While underreporting affects most, if not all, surveys, underreporting of health insurance coverage appears to be a larger problem in the Annual Social and Economic Supplement (ASEC) than in other national surveys that ask about insurance. … Compared with other national surveys, the CPS estimate of the number of people without health insurance more closely approximates the number of people who are uninsured at a specific point in time during the year than the number of people uninsured for the entire year.
Reporting of coverage through major federal health insurance programs. The CPS ASEC data underreport Medicare and Medicaid coverage compared with enrollment and participation data from the Centers for Medicare and Medicaid Services (CMS).1 Because the CPS is largely a labor force survey, interviewers receive less training on health insurance concepts than labor concepts. Additionally, many people may not be aware that a health insurance program covers them or their children if they have not used covered services recently. CMS data, on the other hand, represent the actual number of people who have enrolled or participated in these programs.
1 CMS is the federal agency primarily responsible for administering the Medicare and Medicaid programs at the national level.
NOTE: Credit for bringing attention to the facts in the footnotes above and below belongs to Jeffrey H. Anderson [Commentary: “The Real Number of Uninsured Americans.” Weekly Standard, December 29, 2010. <www.washingtonexaminer.com>]
[646] Report: “Income, Poverty, and Health Insurance Coverage in the United States: 2010.” By Carmen DeNavas-Walt, Bernadette D. Proctor, and Jessica C. Smith. U.S. Department of Commerce, Census Bureau, September 2011. <www2.census.gov>
Pages 75–76:
The State Health Access Data Assistance Center (SHADAC) of the University of Minnesota has worked with the U.S. Census Bureau, CMS [the Centers for Medicare and Medicaid Services], and the Office of the Assistant Secretary for Planning and Evaluation (ASPE) on a research project to evaluate why CPS ASEC [the Current Population Survey Annual Social and Economic Supplement (i.e., this report)] estimates of the number of people with Medicaid are lower than counts of the number of people enrolled in the program from CMS. Reports from all four phases of the research project are available from the Census Bureau’s Web site at <www.census.gov>.
During Phase 1, a database of Medicaid and Medicare enrollment was built using the CMS Medicaid Statistical Information System (MSIS) files merged with CMS Medicare Enrollment Database (EDB) files. The quality of the database was evaluated using two Census Bureau files: the Master Address File/Auxiliary Reference File (MAFARF) and the Person Characteristics File (PCF).
… A key finding indicating survey response error in the CPS ASEC was that 16.9 percent of people with an MSIS record indicating Medicaid coverage reported in the CPS ASEC that they were uninsured. …
Phase 4 consisted of repeating the Phase 2 process using the National Health Interview Survey (NHIS) data instead of CPS ASEC data. The purpose of this was twofold: to provide explanations for the differences found between NHIS data and MSIS files and to examine how differing survey designs and methodologies affect the survey data and estimates. The report found that the NHIS Medicaid undercount was 27.3 percent in 2001 and 21.7 percent in 2002, but noted that the NHIS added questions in 2004 and these results may not apply to more recent data.
NOTE: See the next footnote, which shows that the uninsured undercount in 2005 was even greater than 16.9%.
[647] Calculated with data from:
a) Report: “Income, Poverty, and Health Insurance Coverage in the United States: 2010.” By Carmen DeNavas-Walt, Bernadette D. Proctor, and Jessica C. Smith. U.S. Department of Commerce, Census Bureau, September 2011. <www2.census.gov>
Page 77: “Table C-1: Health Insurance Coverage: 1987 to 2010 (Numbers in thousands. People as of March of the following year.…) … 2005 … Not covered [=] 43,035”
b) Report: “Research Project to Understand the Medicaid Undercount: Phase V Research Results: Extending the Phase II Analysis of Discrepancies between the National Medicaid Statistical Information System (MSIS) and the Current Population Survey (CPS) Annual Social and Economic Supplement (ASEC) from Calendar Years 2000–2001 to Calendar Years 2002–2005.” By Michael Davern and others. State Health Access Data Assistance Center, January 4, 2010. <www.shadac.org>
Page 2:
This paper describes the results of the fifth phase of a multi-phase research project coordinated by the University of Minnesota’s State Health Access Data Assistance Center (SHADAC), Centers for Medicare and Medicaid Services (CMS), Assistant Secretary for Planning and Evaluation (ASPE), National Center for Health Statistics (NCHS), Administration for Healthcare Research and Quality (AHRQ), and U.S. Census Bureau. The research is designed to explain why discrepancies exist between survey estimates of enrollment in Medicaid and the number of enrollees reported in state and national administrative data. …
When measured using raw counts (i.e., counts with no or minimal adjustments), the size of the undercount is about 35 percent (i.e., the CPS ASEC [the Current Population Survey Annual Social and Economic Supplement (i.e., the report cited in (a) above)] shows 35 percent fewer people enrolled in Medicaid than MSIS [Medicaid Statistical Information System] administrative records). Some of this raw undercount can be accounted for by the fact that the two data sources have different concepts of Medicaid coverage as well as different universes. When the counts are fully adjusted to account for these differences, the undercount is reduced by about 3 percentage points to 32 percent. …
Page 3: “The linked file suggests that a predominant part of the adjusted undercount can be accounted for by false negative respondent error (i.e., persons on the CPS ASEC being incorrectly classified as lacking Medicaid coverage). Most of this error comes from cases where enrollment status was explicitly reported (as opposed to cases where the enrollment status was imputed or edited).”
Page 7:
Table 3 shows that for all of the years studied, similar conclusions can be drawn regarding the importance of false negative error as a contributor to the undercount.
Table 3: False Negative Survey Errors on the CPS … CY [Calendar Year] 2005 … “Other Insurance” status of false negative population … Uninsured [=] 7,800,000
Table 3 also shows the “other insurance” status of the population with false negative errors (i.e. whether or not the person is categorized on the CPS ASEC as having any other insurance coverage, either public or private). This information is useful when considering the impact that the false negative population has on the estimate of the size of the uninsured population. Surveyed persons mistakenly classified as not enrolled in Medicaid will only affect the estimate of the uninsured population if they are not also classified as having any other insurance coverage. Table 3 shows that in all years only about 40% of the false negative population is classified as having no other insurance—i.e. less than half of the population with false negative errors has any impact on the estimate of the uninsured population.
CALCULATION: 7,800,000 uninsured false negatives in 2005 / 43,035,000 uninsured in the Census Bureau’s 2005 Current Population Survey = 18.1%
[648] Calculated with: “National Health Expenditure Data.” U.S. Department of Health & Human Services, Centers for Medicare and Medicaid Services. Last modified December 15, 2021. <www.cms.gov>
“Table 20: Private Health Insurance, Benefits and Net Cost; Levels, Annual Percent Change and Percent Distribution, Selected Calendar Years 1960–2020.” Centers for Medicare and Medicaid Services, Office of the Actuary, National Health Statistics Group, December 13, 2021. <www.cms.gov>
NOTE: An Excel file containing the data and calculations is available upon request.
[649] Book: Medical Care Output and Productivity. Edited by David M. Cutler and Ernst R. Berndt. University of Chicago Press, 2001.
Chapter 7: “National Health Accounts/National Income and Product Accounts Reconciliation: Hospital Care and Physician Services.” By Arthur Sensenig and Ernest Wilcox. Pages 271–302.
Page 276: “Since 1964, the U.S. Department of Health and Humans Services has published an annual series of statistics presenting total national health expenditures during each year. … [The] net cost of private health insurance [is] … the difference between premiums earned by insurers and the claims or losses for which insurers become liable….”
[650] Dataset: “National Health Expenditure Web Tables (Calendar Years 1960–2010).” U.S. Department of Health & Human Services, Centers for Medicare and Medicaid Services. Accessed January 16, 2012 at <www.cms.gov>
Net cost of health insurance is calculated as the difference between CY [calendar year] incurred premiums earned and benefits paid for private health insurance. This includes administrative costs, and in some cases, additions to reserves, rate credits and dividends, premium taxes, and plan profits or losses. Also included in this category is the difference between premiums earned and benefits paid for the private health insurance companies that insure the enrollees of the following programs: Medicare, Medicaid, Children’s Health Insurance Program, and workers’ compensation (health portion only).
[651] “Quick Definitions for National Health Expenditure Accounts (NHEA) Categories.” U.S. Department of Health & Human Services, Centers for Medicare and Medicaid Services. Accessed January 16, 2012 at <www.cms.gov>
Private Health Insurance
Includes premiums paid to traditional managed care, self-insured health plans and indemnity plans. This category also includes the net cost of private health insurance which is the difference between health premiums earned and benefits incurred. The net cost consists of insurers’ costs of paying bills, advertising, sales commissions, and other administrative costs; net additions to reserves; rate credits and dividends; premium taxes; and profits or losses.
[652] Book: Cost Accounting. By V. Rajasekaran and R. Lalitha. Dorling Kindersley, 2011.
Page 189:
Administration overhead … Examples: Salary of administrative-office personnel, rent, taxes of general office, remuneration and sitting fees of directors, lighting, heating and other expenses of general office; all stationary and communication of expenses of office, audit fees, legal fees, insurance premium of office buildings, furniture and fixtures and their respective depreciation and bank changes. …
Selling overhead … Examples: Salary and all incentives offered for sales personnel, travelling expenses of sales personnel, rebates and discounts in the costs of price list, brochures, samples, collections costs for debts, repair and maintenance, insurance premium paid and deprecation with respect to sales office building, sales office equipment, furniture and fixtures.
[653] Calculated with data from:
a) “Industries, Health Care: Insurance and Managed Care.” Fortune, May 5, 2008. <fortune.com>
b) “Industries, Health Care: Insurance and Managed Care.” Fortune, May 4, 2009. <fortune.com>
c) “Industries, Health Care: Insurance and Managed Care.” Fortune, May 3, 2010. <fortune.com>
d) “Industries, Health Care: Insurance and Managed Care.” Fortune, May 23, 2011. <fortune.com>
NOTE: An Excel file containing the data and calculations is available upon request.
[654] Book: Essentials of Managed Health Care (5th edition). By Peter R. Kongstvedt. Jones & Bartlett Learning, 2007.
Page 20:
A decade ago or longer, the various types of MCOs [managed care organizations] were reasonably distinct. Since then the differences between traditional forms of health insurance and managed care organizations have narrowed to the point where it is very difficult to tell whether an entity is an insurance company or an MCO. In contrast to the situation 20 years ago, when managed care organizations were often referred to as “alternative delivery systems,” managed care in various forms is now the dominant form of health insurance coverage in the United States, and relatively few people receive their health insurance through the once traditional form of indemnity health insurance coverage.
[655] Book: The Essentials of Finance and Budgeting. Harvard Business School Publishing, 2005.
Page 33:
Revenues – Expenses = Net Income (or Net Loss)
An income statement starts by showing the company’s revenues: the amount of money that resulted from selling products or services to customers. A company may have other revenues as well. In many cases, these additional revenues derive from investments or interest income from the firm’s cash holdings.
Various costs and expenses—from the costs of making and storing a company’s goods, to depreciation of plant and equipment, to interest expense and taxes—are then deducted from revenues. The bottom line—what’s left over—is the net income, or net profit or net earnings, for the period covered by the income statement.
Pages 47–48: “Profit Margin The profit margin—sometimes called return on sales, or ROS—indicates a rate of return on sales. It tells us what percentage of every dollar of sales makes it to the bottom line. Calculate the profit margin as follows: Profit Margin = Net Income / Net Sales”
[656] Article: “Top Dems Blame Insurance Industry as Health Care Roadblock.” By Deirdre Walsh. CNN, July 30, 2009. <politicalticker.blogs.cnn.com>
As Congress prepares to head into a monthlong August recess, Democratic leaders on Capitol Hill ripped into the insurance industry, framing the health care debate as a battle against insurers. …
Senate Majority Leader Harry Reid also called out insurers at a news conference Thursday.
“I don’t think we should be crying great big tears for the insurance industry,” he said. “There is no business in America that makes more money than the insurance industry. Over the past 10 years their profits have been increased by over 450 percent.”
[657] Dataset: “Top Industries: Most Profitable.” Fortune, May 4, 2009. <money.cnn.com>
“Network and Other Communications Equipment … Industry Rank [=] 1 … 2008 Profits as % of Revenues [=] 20.4 … Health Care: Insurance and Managed Care … Industry Rank [=] 35 … 2008 Profits as % of Revenues [=] 2.2 … Airlines … Industry Rank [=] 53 … 2008 Profits as % of Revenues [=] –13.5”
[658] Entry: “managed care.” American Heritage Medical Dictionary. Houghton Mifflin, 2007. <medical-dictionary.thefreedictionary.com>
“Any arrangement for health care in which an organization, such as an HMO [health maintenance organization], another type of doctor–hospital network, or an insurance company, acts [as] an intermediary between the person seeking care and the physician.”
[659] Article: “What Is EBITDA?” By Katherine Arline. Business News Daily, May 9, 2013. Updated February 25, 2015. <www.businessnewsdaily.com>
Having a reliable measure of your company’s financial health is invaluable both to you and to potential business partners. The accounting technique EBITDA—earnings before interest, taxes, depreciation and amortization—is an important standard measure of profitability. …
To calculate EBITDA, a business must know its income, expenses, interest, taxes, depreciation (the loss in value of operational assets, such as equipment) and amortization, which is expenses for intangible assets, such as patents, that are spread out over a number of years. With those numbers in hand, the formula is:
EBITDA = Revenue – Expenses (excluding tax, interest, depreciation and amortization)
One way to get a more realistic profit picture is to calculate EBITDA margin. To determine EBITDA margin, a business must first calculate its EBITDA and then divide that number by total revenue.
EBITDA Margin = EBITDA ÷ Total Revenue
This result helps show how much operating expenses are eating into a company’s profits. In the end, the higher the EBITDA margin, the less risky a company is considered financially.
[660] Article: “What is EBITDA?” By Simone Johnson. Business News Daily. Updated October 20, 2021. <www.businessnewsdaily.com>
EBITDA … allows analysts to generate useful comparisons between companies, project a company’s long-term profitability and gauge its ability to pay off future financing. …
EBITDA is also largely used to compare companies against one another. It can also be used to standardize business performance against industry averages. Advocates of the EBITDA formula say that it provides a fairer view of how well a business is performing, but critics argue it could be used to obscure warning signs, such as high levels of debt, escalating expenses or lack of profitability. …
An EBITDA over 10 is considered good. Over the last several years, the EBITA has ranged between 11 and 14 for the S&P 500.
[661] Email from Yardeni Research (<www.yardeni.com>) to Just Facts, March 29, 2016.
“EBITDA [earnings before interest, taxes, depreciation, and amortization] margins are the cleanest way to do comparisons across different types of industries.”
[662] Dataset: “EBITDA Margins for the S&P 500.” Sent to Just Facts by Yardeni Research (<www.yardeni.com>) on December 5, 2017.
NOTE: This dataset uses the financial industry’s standard term “Managed Health Care” for what Just Facts and others (like Fortune magazine) call “Health Insurance/Managed Care.” The next footnote explains why these terms are effectively equivalent.
[663] Book: Essentials of Managed Health Care (5th edition). By Peter R. Kongstvedt. Jones & Bartlett Learning, 2007.
Page 20:
A decade ago or longer, the various types of MCOs [managed care organizations] were reasonably distinct. Since then the differences between traditional forms of health insurance and managed care organizations have narrowed to the point where it is very difficult to tell whether an entity is an insurance company or an MCO. In contrast to the situation 20 years ago, when managed care organizations were often referred to as “alternative delivery systems,” managed care in various forms is now the dominant form of health insurance coverage in the United States, and relatively few people receive their health insurance through the once traditional form of indemnity health insurance coverage.
[664] Dataset: “EBITDA Margins for the S&P 500.” Sent to Just Facts by Yardeni Research (<www.yardeni.com>) on July 11, 2019.
NOTES:
[665] Book: Essentials of Managed Health Care (5th edition). By Peter R. Kongstvedt. Jones & Bartlett Learning, 2007.
Page 20:
A decade ago or longer, the various types of MCOs [managed care organizations] were reasonably distinct. Since then the differences between traditional forms of health insurance and managed care organizations have narrowed to the point where it is very difficult to tell whether an entity is an insurance company or an MCO. In contrast to the situation 20 years ago, when managed care organizations were often referred to as “alternative delivery systems,” managed care in various forms is now the dominant form of health insurance coverage in the United States, and relatively few people receive their health insurance through the once traditional form of indemnity health insurance coverage.
[666] Article: “Networks Aid Obama’s War on Insurers’ Profits.” By Julia A. Seymour. Business & Media Institute, October 28, 2009. <www.newsbusters.org>
Chris Matthews showed his distain [sic] for the companies’ profits on NBC Sept. 6 saying: “I’d regulate the insurance companies like public utilities, and squeeze them down to a reasonable profit level.” He asked his guests that day, “Why don’t they do that? That’s the solution.”
Katty Kay, BBC’s Washington correspondent, replied, “Well, you’d stop the insurance companies making outrageous profits.”
[667] Dataset: “Industry Summary.” Yahoo! Finance. Current as of January 13, 2012. <finance.yahoo.com>
Variable: “Net Profit Margin % (most recent quarter)”
[668] Email from Yardeni Research (<www.yardeni.com>) to Just Facts, March 26, 2016.
[669] Transcript: “Obama Unveils Compromise Health Care Deal.” By Julie Rovner. NPR, February 22, 2010. <www.npr.org>
Ms. IGNAGNI: This would be like capping the price automakers can charge consumers but letting the steel, rubber and technology manufacturers charge the automakers whatever they want.
ROVNER: Critics, of course, point out that unlike automakers, many health insurance companies are earning huge profits these days, even while raising premiums.
[670] Dataset: “EBITDA Margins for the S&P 500.” Sent to Just Facts by Yardeni Research (<www.yardeni.com>) on July 11, 2019.
NOTE: This dataset uses the financial industry’s standard term “Managed Health Care” for what Just Facts and others (like Fortune magazine) call “Health Insurance/Managed Care.” The next footnote explains why these terms are effectively equivalent.
[671] Book: Essentials of Managed Health Care (5th edition). By Peter R. Kongstvedt. Jones & Bartlett Learning, 2007.
Page 20:
A decade ago or longer, the various types of MCOs [managed care organizations] were reasonably distinct. Since then the differences between traditional forms of health insurance and managed care organizations have narrowed to the point where it is very difficult to tell whether an entity is an insurance company or an MCO. In contrast to the situation 20 years ago, when managed care organizations were often referred to as “alternative delivery systems,” managed care in various forms is now the dominant form of health insurance coverage in the United States, and relatively few people receive their health insurance through the once traditional form of indemnity health insurance coverage.
[672] Article: “Health Insurers Making Record Profits as Many Postpone Care.” By Reed Abelson. New York Times, May 13, 2011. <www.nytimes.com>
The nation’s major health insurers are barreling into a third year of record profits, enriched in recent months by a lingering recessionary mind-set among Americans who are postponing or forgoing medical care.
The UnitedHealth Group, one of the largest commercial insurers, told analysts that so far this year, insured hospital stays actually decreased in some instances. In reporting its earnings last week, Cigna, another insurer, talked about the “low level” of medical use.
Yet the companies continue to press for higher premiums, even though their reserve coffers are flush with profits and shareholders have been rewarded with new dividends. Many defend proposed double-digit increases in the rates they charge, citing a need for protection against any sudden uptick in demand once people have more money to spend on their health, as well as the rising price of care.
[673] Dataset: “Sectors > Services > Publishing – Newspapers.” Yahoo! Finance. Current as of January 13, 2012. <finance.yahoo.com>
“Net Profit Margin % (most recent quarter) … The New York Times Company (NYT) [=] 2.92%”
[674] Dataset: “Industry Summary.” Yahoo! Finance. Current as of January 13, 2012. <finance.yahoo.com>
Variable: “Net Profit Margin % (most recent quarter)”
[675] Dataset: “EBITDA [earnings before interest, taxes, depreciation, and amortization] Margins for the S&P 500.” Sent to Just Facts by Yardeni Research (<www.yardeni.com>) on July 11, 2019.
NOTE: This dataset uses the financial industry’s standard term “Managed Health Care” for what Just Facts and others (like Fortune magazine) call “Health Insurance/Managed Care.” The next footnote explains why these terms are effectively equivalent.
[676] Book: Essentials of Managed Health Care (5th edition). By Peter R. Kongstvedt. Jones & Bartlett Learning, 2007.
Page 20:
A decade ago or longer, the various types of MCOs [managed care organizations] were reasonably distinct. Since then the differences between traditional forms of health insurance and managed care organizations have narrowed to the point where it is very difficult to tell whether an entity is an insurance company or an MCO. In contrast to the situation 20 years ago, when managed care organizations were often referred to as “alternative delivery systems,” managed care in various forms is now the dominant form of health insurance coverage in the United States, and relatively few people receive their health insurance through the once traditional form of indemnity health insurance coverage.
[677] Webpage: “Where: Global Reach.” Organization for Economic Cooperation and Development. Accessed November 15, 2022 at <www.oecd.org>
Today, our 38 Member countries span the globe.… Australia, Austria, Belgium, Canada, Chile, Columbia, Costa Rica, Czech Republic, Denmark, Estonia, Finland, France, Germany, Greece, Hungary, Iceland, Ireland, Israel, Italy, Japan, [South] Korea, Latvia, Lithuania, Luxembourg, Mexico, Netherlands, New Zealand, Norway, Poland, Portugal, Slovak Republic, Slovenia, Spain, Sweden, Switzerland, Turkey, United Kingdom, United States …
The most recent countries to join the OECD were Colombia, in April 2020, and Costa Rica, in May 2021. On 25 January 2022, the Council decided to take the first step in accession discussions with six candidate countries to OECD Membership – Argentina, Brazil, Bulgaria, Croatia, Peru and Romania. Accession Roadmaps for Brazil, Bulgaria, Croatia, Peru and Romania were adopted at the Council meeting at Ministerial level on 10 June 2022. Conversations regarding the next steps with Argentina are on-going.
[678] Report: “Beyond Economic Growth: An Introduction to Sustainable Development (2nd edition).” By Tatyana P. Soubbotina. World Bank, 2004. <openknowledge.worldbank.org>
Pages 132–133:
Developed countries (industrial countries, industrially advanced countries). High-income countries, in which most people have a high standard of living. Sometimes also defined as countries with a large stock of physical capital, in which most people undertake highly specialized activities. … Depending on who defines them, developed countries may also include middle-income countries with transition economies, because these countries are highly industrialized. Developed countries contain about 15 percent of the world’s population. They are also sometimes referred to as “the North.”
Page 141:
Organisation for Economic Cooperation and Development (OECD). An organization that coordinates policy among developed countries. OECD member countries exchange economic data and create unified policies to maximize their countries’ economic growth and help nonmember countries develop more rapidly. The OECD arose from the Organisation for European Economic Cooperation (OEEC), which was created in 1948 to administer the Marshall Plan in Europe. In 1960, when the Marshall Plan was completed, Canada, Spain, and the United States joined OEEC members to form the OECD.
[679] Textbook: Handbook of Health Economics (Volume 1A). Edited by Anthony J. Cuyler and Joseph P. Newhouse. Elsevier, 2000.
Chapter 1: “International Comparisons of Health Expenditure.” By Ulf-G. Gerdtham and Bengt Jönsson. Pages 11–53.
Pages 19–20:
[R]igorous assessment of the quality (accuracy and reliability) of the cross-national data is difficult. … There is ample scope for imperfect reliability with respect to international comparisons due to differential classification, especially on the borderline of health services such as care for the aged. For example, the care of the mentally retarded is not included in the expenditure for Denmark nor for Sweden after 1985, but it is included in the expenditure for Finland, Iceland and Norway. Another difference is that local nursing homes are not included in the Danish statistics, whereas they were included in Finland, Iceland, Norway and Sweden before 1992…. Thus heterogeneous definitions are present even if one selects apparently similar countries such as the Nordic countries…. Taken together, these problems indicate that results obtained with international comparisons should be treated with considerable caution.
[680] Article: “International Comparison of Health Care Systems Using Resource Profiles.” By Anders Anell and Michael Willis. World Health Organization Bulletin, 2000. Pages 770–778. <www.ncbi.nlm.nih.gov>
Pages 770–771:
On a practical level, the link between health care resources and population health is not even well understood. In fact, existing measures of population health, for example life expectancy and infant mortality, are often crude and depend on numerous other factors. Moreover, the link will vary from country to country depending on national income, disease burden, and the preferences of patients, physicians and health care decision-makers. Even if the relationship were well known, comparisons would still be limited by the lack of a universal definition of what should be classified as health care spending; and the definitions used by individual countries tend to change over time.2,8
Page 772: “It should be noted, however, that the OECD [Organization for Economic Cooperation and Development] data have a number of well-known limitations. For example, data definitions tend to vary across countries, as does the thoroughness and accuracy of data collection.”
[681] Article: “Overview of International Comparisons of Health Care Expenditures.” By George J. Schieber and Jean-Pierre Poullier. Health Care Financing Review, December 1989. <www.ncbi.nlm.nih.gov>
Page 1:
International comparisons are difficult for a variety of reasons, including the following:
• Data are generally not comparable.
• Systems’ performance cannot be easily evaluated because of our inability to measure health outcomes.
• It is difficult to measure and control for social, medical, cultural, demographic, and economic differences across countries.
• Transferability of policies across countries is problematic.
International comparisons are only as good as the basic underlying data upon which they are based. Countries produce data for administrative reporting purposes. Their data systems are based on the specific structural features of their health care financing and delivery systems. Thus, for example, if salaried hospital-based physicians are treated as part of hospital sector budgets, as is the case in the Federal Republic of Germany (hereafter called Germany), the Scandinavian countries, and the United Kingdom, then reported hospital expenditures will include these inhospital physician services. On the other hand, in countries, such as the United States and Canada, where most inhospital physician services are paid for on a fee-for-service basis, such expenditures will be reported separately as physician expenditures. Compounding this problem is the lack of internationally accepted definitions of components of health care expenditures, such as hospitals, nursing homes, and home health care.
[682] Textbook: Health Economics and Policy (6th edition). By James W. Henderson. Cengage Learning, 2012.
Page 165:
Estimates of the income elasticity of demand for medical care vary considerably, depending on whether the relationship being studied is the impact of individual income on person medical expenditures or national income on aggregate medical expenses. Research by Newhouse (1977) represents the conventional wisdom on income elasticities using national income and expenditure data. Using data from 13 developed countries, Newhouse found income elasticities to be greater than 1. If this is true, medical care is, at least on the margin, a luxury or superior good.13 When income increases, demand increases, and the percentage of income spent on luxury goods also increases.14 The policy implications are far reaching. If medical care is a luxury good, countries with higher per capita incomes will spend a greater percentage of income on medical care. …
Income elasticity of demand: The sensitivity of demand to changes in consumer income, determined by the percentage change in quantity demanded relative to the percentage change in consumer income.
Luxury or superior good: Goods are considered superior if an increase in consumer income causes the percentage of the consumer’s income spent on the good to increase and vice versa.
[683] Textbook: Health Economics and Policy (6th edition). By James W. Henderson. Cengage Learning, 2012.
Page 165:
Estimates of the income elasticity of demand for medical care vary considerably, depending on whether the relationship being studied is the impact of individual income on person medical expenditures or national income on aggregate medical expenses. Research by Newhouse (1977) represents the conventional wisdom on income elasticities using national income and expenditure data. Using data from 13 developed countries, Newhouse found income elasticities to be greater than 1. If this is true, medical care is, at least on the margin, a luxury or superior good.13 When income increases, demand increases, and the percentage of income spent on luxury goods also increases.14 The policy implications are far reaching. If medical care is a luxury good, countries with higher per capita incomes will spend a greater percentage of income on medical care. …
Income elasticity of demand: The sensitivity of demand to changes in consumer income, determined by the percentage change in quantity demanded relative to the percentage change in consumer income.
Luxury or superior good: Goods are considered superior if an increase in consumer income causes the percentage of the consumer’s income spent on the good to increase and vice versa.
[684] Textbook: Handbook of Health Economics (Volume 1A). Edited by Anthony J. Cuyler and Joseph P. Newhouse. Elsevier, 2000.
Chapter 1: “International Comparisons of Health Expenditure.” By Ulf-G. Gerdtham and Bengt Jönsson. Pages 11–53.
Pages 19–20:
[R]igorous assessment of the quality (accuracy and reliability) of the cross-national data is difficult. … There is ample scope for imperfect reliability with respect to international comparisons due to differential classification, especially on the borderline of health services such as care for the aged. For example, the care of the mentally retarded is not included in the expenditure for Denmark nor for Sweden after 1985, but it is included in the expenditure for Finland, Iceland and Norway. Another difference is that local nursing homes are not included in the Danish statistics, whereas they were included in Finland, Iceland, Norway and Sweden before 1992…. Thus heterogeneous definitions are present even if one selects apparently similar countries such as the Nordic countries…. Taken together, these problems indicate that results obtained with international comparisons should be treated with considerable caution.
Page 45:
A common and extremely robust result of international comparisons is that the effect of per capita GDP [gross domestic product] (income) on expenditures is clearly positive and significant and, further, that the estimated income elasticity† is clearly higher than zero and close to unity or even higher than unity. This result appears to be robust to the choice of variables included in the estimated models, data, the choice of conversion factors and methods of estimation.
NOTE: † Income elasticity is a “measure of the responsiveness of demand to changes in income. … If the percent change in the quantity demanded is greater than the percent change in consumer income, the demand is said to be income elastic, or responsive to changes in consumer income.” [Webpage: “Glossary: Demand Elasticities.” U.S. Department of Agriculture, Economic Research Service. Last updated September 9, 2022. <www.ers.usda.gov>]
[685] Textbook: Health Economics: Theories, Insights, and Industry Studies (5th edition). By Rexford E. Santerre and Stephen P. Neun. South-Western, Cengage Learning, 2010.
Page 131:
The empirical estimates for the income elasticity of demand vary widely and merit discussion. Studies using household, or individual, data generally find healthcare to be a normal good with income elasticity below 1.0. These results are in direct contrast to studies that utilize country-level data to look at the relation between income and health care expenditures either over time or across countries. The goal of these studies is to ascertain how economic growth impacts national health care expenditures. Generally, these studies find the aggregate income elasticity to be slightly above 1. …
This difference between the micro and macro estimates is interesting and deserves explanation. According to Newhouse, the difference exists, because, for example, within the United States at any point in time the average consumer pays only a small portion of the price of medical care (approximately 14 percent in 2003), while over time the country as a whole must pay the full price of health care. As the out-of-pocket price of health care falls to zero, then the average individual is going to consume health care regardless of income. The income elasticity in the extreme equals zero. The country, as a whole, however, must face the entire burden of the cost of health care and, as a result, is going to be much more sensitive to price and income.
[686] Textbook: World Scientific Handbook of Global Health Economics and Public Policy (Volume 1). Edited by Richard M. Scheffler. World Scientific Publishing, 2016.
Chapter 1: “Health Care Spending and Economic Growth.” By Edit V. Velenyi. Pages 1–154.
Page 55: “At the global level, the income elasticity of total health expenditures is above 1, whereby a 1% increase in income is associated with a 1.06% increase in total health spending, and income explains 95% of the variation in total health spending. However, based on these univariate statistics, it is only the high-income group where escalating health spending is a concern, with an income elasticity of total health expenditures at 1.21.”
[687] Paper: “Measuring the Economy: A Primer on GDP and the National Income and Product Accounts.” U.S. Department of Commerce, Bureau of Economic Analysis, December 2015. <www.bea.gov>
Page 1:
How fast is the economy growing? Is it speeding up or slowing down? How does the trade deficit affect economic growth? What’s happening to the pattern of spending on goods and services in the economy?
To answer these types of questions about the economy, economists and policymakers turn to the national income and product accounts (NIPAs) produced by the Bureau of Economic Analysis (BEA). … Featured in the NIPAs is gross domestic product (GDP), which measures the value of the goods and services produced by the U.S. economy in a given time period.
GDP is one of the most comprehensive and closely watched economic statistics: It is used by the White House and Congress to prepare the Federal budget, by the Federal Reserve to formulate monetary policy, by Wall Street as an indicator of economic activity, and by the business community to prepare forecasts of economic performance that provide the basis for production, investment, and employment planning.
Page 8: “… GDP—is defined as the market value of goods, services, and structures produced by the Nation’s economy during a given period less the value of the goods and services used up in production.”
[688] Report: “International Comparisons of GDP Per Capita and Per Hour, 1960–2011.” U.S. Department of Labor, Bureau of Labor Statistics, November 7, 2012. <www.bls.gov>
Page 1: “GDP per capita, when converted to U.S. dollars using purchasing power parities, is the most widely used income measure for international comparisons of living standards.”
Page 2:
Gross Domestic Product (GDP) is defined as the value of all market and some nonmarket goods and services produced within a country’s geographic borders. As such, it is the most comprehensive measure of a country’s economic output that is estimated by statistical agencies. GDP per capita may therefore be viewed as a rough indicator of a nation’s economic well-being, while GDP per hour worked can provide a general picture of a country’s productivity.
[689] Book: Economics: Principles and Policy (12th edition). By William Baumol and Alan Blinder. South-Western Cengage Learning, 2011.
Page 491:
To sharpen the point, observe that real GDP [gross domestic product] is, by definition, the product of the total hours of work in the economy times the amount of output produced per hour—what we have just called labor productivity:
GDP = Hours of work × Output per hour = Hours worked × Labor productivity
For example, in the United States today, in round numbers, GDP is about $15 trillion and total hours of work per year are about 230 billion. Thus labor productivity is roughly $15 trillion/230 billion hours, or about $65 per hour.
[690] Webpage: “Household Disposable Income.” Organization for Economic Cooperation and Development. Accessed November 7, 2022 at <data.oecd.org>
Disposable income is closest to the concept of income as generally understood in economics. Household disposable income is income available to households such as wages and salaries, income from self-employment and unincorporated enterprises, income from pensions and other social benefits, and income from financial investments (less any payments of tax, social insurance contributions and interest on financial liabilities). “Gross” means that depreciation costs are not subtracted. For gross household disposable income per capita, growth rates (percentage change from previous period) are presented; these are “real” growth rates adjusted to remove the effects of price changes. Information is also presented for gross household disposable income including social transfers in kind, such as health or education provided for free or at reduced prices by governments and not-for-profit organisations. This indicator is in US dollars per capita at current prices and PPPs [purchasing power parities]. In the System of National Accounts, household disposable income including social transfers in kind is referred to as “adjusted household disposable income.” All OECD [Organization for Economic Cooperation and Development] countries compile their data according to the 2008 System of National Accounts (SNA 2008).
[691] News release: “Personal Income and Outlays, October 2021.” U.S. Department of Commerce, Bureau of Economic Analysis, November 24, 2021. <www.bea.gov>
Page 4:
Personal income is the income received by, or on behalf of, all persons from all sources: from participation as laborers in production, from owning a home or business, from the ownership of financial assets, and from government and business in the form of transfers. It includes income from domestic sources as well as the rest of world. It does not include realized or unrealized capital gains or losses.
Disposable personal income is the income available to persons for spending or saving. It is equal to personal income less personal current taxes.
[692] Calculated with the dataset: “Health Expenditure and Financing: Current Expenditure on Health (All Functions), Share of Gross Domestic Product.” Organization for Economic Cooperation and Development. Accessed November 7, 2022 at <stats.oecd.org>
NOTE: An Excel file containing the data and calculations is available upon request.
[693] Chart constructed with data from:
a) Dataset: “Health Expenditure and Financing: Current Expenditure on Health (All Functions), Share of Gross Domestic Product.” Organization for Economic Cooperation and Development. Accessed November 7, 2022 at <stats.oecd.org>
b) Dataset: “Household Disposable Income, Gross Adjusted, US Dollars Purchasing Power Parity Per Capita, 2020.” Organization for Economic Cooperation and Development, July 11, 2022. <stats.oecd.org>
NOTE: An Excel file containing the data is available upon request.
[694] Webpage: “Current Health Expenditure (% of GDP).” World Health Organization. Accessed November 7, 2022 at <data.worldbank.org>
“Level of current health expenditure expressed as a percentage of GDP [gross domestic product]. Estimates of current health expenditures include healthcare goods and services consumed during each year. This indicator does not include capital health expenditures such as buildings, machinery, IT [information technology] and stocks of vaccines for emergency or outbreaks.”
[695] Webpage: “Household Disposable Income.” Organization for Economic Cooperation and Development. Accessed November 7, 2022 at <data.oecd.org>
Disposable income is closest to the concept of income as generally understood in economics. Household disposable income is income available to households such as wages and salaries, income from self-employment and unincorporated enterprises, income from pensions and other social benefits, and income from financial investments (less any payments of tax, social insurance contributions and interest on financial liabilities). “Gross” means that depreciation costs are not subtracted. For gross household disposable income per capita, growth rates (percentage change from previous period) are presented; these are “real” growth rates adjusted to remove the effects of price changes. Information is also presented for gross household disposable income including social transfers in kind, such as health or education provided for free or at reduced prices by governments and not-for-profit organisations. This indicator is in US dollars per capita at current prices and PPPs [purchasing power parities]. In the System of National Accounts, household disposable income including social transfers in kind is referred to as “adjusted household disposable income.” All OECD [Organization for Economic Cooperation and Development] countries compile their data according to the 2008 System of National Accounts (SNA 2008).
[696] Webpage: “Glossary of Statistical Terms: Purchasing Power Parities (PPPs).” Organization for Economic Cooperation and Development, September 25, 2001. Last updated 6/11/13. <stats.oecd.org>
“Purchasing power parities (PPPs) are the rates of currency conversion that equalise the purchasing power of different currencies by eliminating the differences in price levels between countries. In their simplest form, PPPs are simply price relatives which show the ratio of the prices in national currencies of the same good or service in different countries.”
[697] Article: “Health Care Spending in the United States and Other High-Income Countries.” By Irene Papanicolas, Liana Woskie, and Ashish K. Jha. Journal of the American Medical Association, March 13, 2018. Pages 1024–1039. <jamanetwork.com>
Page 1025: “This approach resulted in the presentation of a total of 98 indicators across 7 domains: (1) general spending; (2) population health; (3) structural capacity; (4) utilization; (5) pharmaceuticals; (6) access and quality; and (7) equity. … We were unable to find comparable pricing data for most areas, such as for diagnostic procedures and treatments, except for workforce remuneration and pharmaceuticals.”
Page 1030: “The United States had high levels of administrative burden; this was notable in particular for administrative spending, for which the United States was an outlier (8% of GDP [gross domestic product] spent on administration and governance compared with a mean of 3% of GDP) (eTable 1 in Supplement 1).”
Page 1031: “Among the 11 countries, the United States had the highest pharmaceutical spending per capita at $1443, with Switzerland following at $939 and a mean of $749 for all 11 countries. … For 4 pharmaceuticals (Crestor, Lantus, Advair, and Humira) used for common conditions, the United States had higher prices than all other countries; for 3 of these, the U.S. price was more than double the next highest price.”
Pages 1034–1035:
The data … suggest that some of the more common explanations about higher health care spending in the United States, such as underinvestment in social programs, the low primary care/specialist mix, the fee-for-service system encouraging high volumes of care, or defensive medicine leading to overutilization, did not appear to be major drivers of the substantially higher U.S. health care spending compared with other high-income countries. …
[T]he data suggest that the main driving factors were likely related to prices, including prices of physician and hospital services, pharmaceuticals, and diagnostic tests, which likely also affected access to care. In addition, administrative costs appeared much higher in the United States. …
Although the ratio of primary care physicians to specialists was similar between the United States and other high-income countries, the salaries paid to both generalist and specialist physicians were markedly higher in the United States…. However, it can be difficult to compare salaries of workers from various countries. In general, salaries for professionals are higher in the United States than in other countries, and in addition, workers in the United States bear higher costs in some areas, such as for health care insurance, higher education, or planning for retirement, than workers in other countries. Some of these issues are accounted for in the ratio of national average wage, but U.S. physicians and nurses still had the highest ratio.
Some of the differential observed in cost between physicians and nurses in the United States and in the other countries may reflect differences in productivity or the extent to which training costs are borne by the individual, although in either case it is unlikely to account for the magnitude of the difference. In 2011, Laugesen and Glied19 estimated that the investment repayment cost for private education in the United States would amount to about $21,300 per year for a primary care physician and about $24,400 for an orthopedic surgeon over a 35-year period.
Taking this investment into account, however, does not explain the more than $200,000 difference in compensation observed for physicians between countries. …
Prices of services were not examined directly, but U.S. health care spending was found to be higher than in other countries despite similar utilization patterns, suggesting that higher prices were the primary cause of high health care spending in the United States relative to other nations.
Page 1038:
[W]e found that the United States spent significantly more on health care despite having similar levels of utilization. However, from 2010 onward it appeared that the United States had similar levels of public social spending compared with other high-income countries. While public social spending has increased since 2010 … utilization rates have remained relatively unchanged.20,23 This finding suggests that differences in social spending are less likely to be the main driver of differences in health care spending than previous works have suggested.34 …
This study has several limitations. First, there was limited availability of comparable data across health systems, which restricted the areas of health system performance we were able to compare. In particular, data on prices across systems were lacking, as was the number of indicators on quality and coverage. … [W]e did not consider the actual prices of devices, which, given the increasing number of hip and knee replacements and use of other devices, are emerging as an important consideration in the cost of care in the United States.
[698] Chart constructed with data from:
a) Dataset: “Health Expenditure and Financing: Current Expenditure on Health (All Functions), Share of Gross Domestic Product.” Organization for Economic Cooperation and Development. Accessed November 7, 2022 at <stats.oecd.org>
b) Dataset: “Total Population (Both Sexes Combined) by Region, Subregion and Country, Annually for 1950–2100 (Thousands).” United Nations, Population Division, Department of Economic and Social Affairs, August 2019. <population.un.org>
c) Webpage: “Where: Global Reach.” Organization for Economic Cooperation and Development. Accessed November 7, 2022 at <www.oecd.org>
NOTE: An Excel file containing the data is available upon request.
[699] Calculated with data from:
a) Dataset: “Health Expenditure and Financing: Current Expenditure on Health (All Functions), Share of Gross Domestic Product.” Organization for Economic Cooperation and Development. Accessed November 7, 2022 at <stats.oecd.org>
b) Dataset: “Total Population (Both Sexes Combined) by Region, Subregion and Country, Annually for 1950–2100 (Thousands).” United Nations, Population Division, Department of Economic and Social Affairs, August 2019. <population.un.org>
c) Webpage: “Where: Global Reach.” Organization for Economic Cooperation and Development. Accessed November 7, 2022 at <www.oecd.org>
NOTE: An Excel file containing the data is available upon request.
[700] Webpage: “Health Systems Governance and Financing: Benefit Design and Health Financing.” World Health Organization. Accessed November 19, 2022 at <www.who.int>
Benefit design refers to decisions about those health services and goods to be funded, either fully or partially, from public revenues. Benefit design also involves decisions about the conditions which must be met to access publicly funded benefits. …
Decisions about what to fund inevitably face trade-offs, which can be addressed through a structured process to consider evidence and involves stakeholders. Conditions of access can use price, time, the level of the health system and various other criteria. When aligned with other health system functions, benefit design is a powerful instrument through which policy makers can steer the health system towards UHC [universal health coverage].
Decisions about which services to include in a benefit package are also decisions about which services to exclude. It clearly defines which services are funded publicly, either fully or partially, and those services that are not funded. All countries, whether higher or lower income, set limits on entitlements; this is called rationing, and decisions about how access to benefits are rationed or prioritized, influences a country’s progress towards UHC.
All public and private healthcare systems ration patient access to health care. The private sector rations access by using market prices, with demand driven by a person’s ability and willingness to pay as a result. Public systems ration care primarily on the basis of patient needs, for example by ensuring funding for priority cost-effective treatments, and through the use of waiting lists. Patients may also be asked to make a co-payment.
[701] Book: Access to Health Care. Edited by Martin Guilliford and Myfanwy Morgan. Routledge, 2003.
Chapter 1: “Introduction: Meaning of ‘Access’ in Health Care.” By Martin Guilliford, Jose Figueroa-Munoz, and Myfanwy Morgan. Pages 1–12.
Page 7:
The term “rationing” has been used to describe the methods used to allocate resources when they are not distributed according to price (Parker 1975). Rationing may occur at the level of resource allocation, where priority-setting decisions are made, or at the level of service delivery, where service providers decide who should receive a service (Klein and others 1996). Both types of decision have the effect of restricting access to health care.
[702] Report: “Health at a Glance 2021: OECD Indicators.” Organization for Economic Cooperation and Development, November 5, 2021. <www.oecd-ilibrary.org>
Page 148: “Long waiting times for elective (non-emergency) surgery have been a longstanding issue in a number of OECD [Organization for Economic Cooperation and Development] countries, postponing the expected benefits of treatment, meaning that patients continue living with pain and disability. The COVID-19 pandemic has further heightened the issue, as non-urgent interventions have often been postponed during peak periods of the pandemic.”
[703] Book: Access to Health Care. Edited by Martin Guilliford and Myfanwy Morgan. Routledge, 2003.
Chapter 1: “Introduction: Meaning of ‘Access’ in Health Care.” By Martin Guilliford, Jose Figueroa-Munoz, and Myfanwy Morgan. Pages 1–12.
Page 7: “Long waiting lists and waiting times at different levels of the health care system may sometimes be indicative of organizational barriers to access which may result from a lack of capacity, an inefficient use of existing capacity, or a failure to design services around the needs of patients.”
[704] Report: “Health at a Glance 2021: OECD Indicators.” Organization for Economic Cooperation and Development, November 5, 2021. <www.oecd-ilibrary.org>
Page 126: “The share of a population covered for a core set of health services offers an initial assessment of access to care and financial protection. However, it is only a partial measure of access and coverage. Universal health coverage also depends on the range of services covered and the degree of cost-sharing for these.”
Page 130: “In addition to the share of the population entitled to core health services, the extent of health care coverage is defined by the range of services included in a publicly defined benefit package and the proportion of costs covered.”
[705] Report: “Health at a Glance 2021: OECD Indicators.” Organization for Economic Cooperation and Development, November 5, 2021. <www.oecd-ilibrary.org>
Page 26:
In terms of the share of the population eligible for coverage, most OECD [Organization for Economic Cooperation and Development] countries have achieved universal (or near-universal) coverage for a core set of services. …
The degree of cost sharing applied to those services also affects access to care. Across the OECD, around three-quarters of all health care costs were covered by government or compulsory health insurance schemes in 2019. However, in Mexico, less than half of all health spending was covered by publicly mandated schemes; and in Latvia, Portugal, Greece and Korea only around 60% of all costs were covered. Mexico, though, has significantly expanded population coverage and financial protection over the last decade.
Page 126: “The share of a population covered for a core set of health services offers an initial assessment of access to care and financial protection. However, it is only a partial measure of access and coverage. Universal health coverage also depends on the range of services covered and the degree of cost-sharing for these.”
Page 132:
Where health systems fail to provide adequate financial protection, people may suffer financial hardship from paying for health care, or simply not have enough money to pay for health care. As a result, lack of financial protection can reduce access to health care, undermine health status, deepen poverty and exacerbate health and socio-economic inequalities. On average across OECD countries, just over one-fifth of all spending on health care comes directly from patients through out-of-pocket (OOP) payments…. People experience financial hardship when the burden of such OOP payments is large in relation to their ability to pay. Poorer households and those who have to pay for long-term treatment—such as medicines for chronic illness—are particularly vulnerable.
[706] Entry: “rationing.” Concise Medical Dictionary (9th edition). By Elizabeth A. Martin. Oxford University Press, 2015.
Page 645: “rationing the process of allocating healthcare resources among a population when demand outstrips supply. Where ‘first come first served’ is not considered an appropriate policy, access to treatment may be rationed on a basis of need, effectiveness, or quality of life.”
[707] Entry: “rationing.” Dictionary of Health Economics. By Alan Earl-Slater. Radcliffe Medical Press, 1999.
Page 127:
Rationing
A method of allocating resources. It is neither new nor unique to healthcare systems. The word “rationing” brings out many emotions and generates much debate. With respect to patients, it is a method of deciding who gets what treatment where, when and how. …
Various ways of rationing in healthcare include: the use of waiting lists; according to the potential for health improvements; according to the greatest clinical need; according to the cheapest operations being performed first; according to government targets; according to ability to pay; according to willingness to pay; by priorities established by asking the population; according to clinician’s priorities; according to age; according to gender; according to the type of adverse medical condition; by insurance risk or insurance coverage.
[708] Book: Rationing of Medical Services in Europe: An Empirical Study. Edited by J. Matthias Graf von der Schulenburg and Michael Blanke. IOS Press, 2004.
Chapter I: “Rationing Health Care in Europe – Finland.” By Janne Martikainen and Hannu Valtonen. Pages 3–26.
Page 18:
An unstructured question was used to explore which form of rationing professionals themselves believed to be the most effective in controlling cost escalation, since 78% of them believed that cost escalation can be controlled somehow. The most preferred forms of rationing were priority setting [20.0%], preventative treatments [15.5%] and evidence based medicine [8.9%] (Table 14). In the Finnish publicity, instead of the term “rationing” the term “prioritization” has been used since the beginning of the 90s.
[709] Textbook: Neuropsychopharmacology: The Fifth Generation of Progress. Edited by Kenneth L. Davis and others. American College of Neuropsychopharmacology, 2002.
Chapter 67: “The Economic Burden of Anxiety and Stress Disorders.” By Ronald C. Kessler and Paul E. Greenberg. Pages 981–992. <acnp.org>
Page 981:
No society can afford to guarantee universal health insurance coverage for treatment of all illnesses for all of its citizens. The number of illnesses is simply too large and the costs of treatment too great for such a guarantee even in the most economically advantaged societies. Resource allocation rules are consequently needed.1 The most widely accepted of these rules emphasizes cost-effectiveness. According to this rule, medical interventions are appropriate only if their expected benefits clearly exceed the sum of their direct costs and their expected risks.2 …
The most ambitious effort to date to evaluate the costs of illness in terms of role impairments and disabilities is the World Health Organization (WHO) Global Burden of Disease (GBD) Study, an initiative designed to generate a rank ordering of the diseases that create the greatest societal burdens in terms of impairment and disability.5 The overarching goal of GBD is to help health policy planners prioritize disorder-specific resource allocation decisions. GBD focuses on economic costs of illness using a metric known as the disability-adjusted life year (DALY),6 a weighted composite that combines expected years of lost life with expected years of decreased functioning due to a particular disease (or constellation of comorbid diseases).
[710] Entry: “rationing.” Dictionary of Health Economics. By Alan Earl-Slater. Radcliffe Medical Press, 1999.
Page 127:
The underlying need for rationing is that the healthcare system cannot do everything for everyone in need and therefore choices have to be made. Yet it is not just a question of funding, because even if there was enough funding for all healthcare needs to be met, this may not be an efficient use of the economy’s resources as there is an opportunity cost involved in every decision. For example, the economy may be better off if some of the funds went into education, social care or transport improvements, rather than healthcare.
[711] Report: “Value for Money in Health Spending.” Organization for Economic Cooperation and Development, October 7, 2010. <www.oecd-ilibrary.org>
Page 24:
If reallocating resources from low-performing sectors of the health system is hard, then to meet new demands for health care will require new resources. But how should policy makers decide whether such spending is justified? Judging how much public resources should be spent on health care at a given point in time can depend on two different measures of “sustainability” (Thomson and others, 2009):
• On the one hand, so long as the value produced by health care exceeds its opportunity cost, that is the value that would have been gained by spending on other areas, then growth in health spending can be said to be economically sustainable. Once this cost becomes too high, and better gains would be achieved by spending elsewhere (either in the private sector or for other components of public spending), then health spending becomes economically unsustainable.
• Financial sustainability, on the other hand, becomes a problem when governments are unable to finance the existing level of resources because of an inability or unwillingness to generate sufficient revenues to pay for them, and when they cannot—or will not—allow any further “crowding out” of other forms of government spending.
It follows that it is possible for health spending growth to be economically sustainable, and yet not financially sustainable. However, it is necessary to acknowledge that in some countries, achieving “value for money” is not enough to ensure the sustainability of the system. When fiscal constraints are binding, health systems either have to find new sources of finance—most of which have their own drawbacks—or else health spending which produces benefits great than their costs will have to be deferred. Some of the problems currently facing countries are not because the health system is not spending money wisely, but rather that they simply cannot raise enough money because of economic conditions.
[712] Report: “Value for Money in Health Spending.” Organization for Economic Cooperation and Development, October 7, 2010. <www.oecd-ilibrary.org>
Page 54:
A key problem in adjusting medical manpower is the long lags between the perceived increase in needs and the change in supply of trained medical staff, particularly for doctors where education can be as long as ten or more years (particularly in the case of specialists). Quotas for medical students seem to remain the most widespread regulatory tool for controlling the overall supply of medical personnel. While the number of new entrants into medical schools has recently been increased in many countries, this has not yet fed through into any marked increase in supply. …
Thus, better human resource planning policies that focus on maintaining adequate supplies of health professionals over the long haul are necessary if problems of supply of health professionals are to be avoided (OECD, 2008a). Such problems have been a significant barrier to policy change. For example, Canada and the United Kingdom increased health care budgets in the 1990s following long periods of restraint but, like Denmark, they had difficulty in increasing the supply of health care because of the limited number of doctors and nurses.
[713] Textbook: Handbook of Health Economics (Volume 1B). Edited by Anthony J. Cuyler and Joseph P. Newhouse. Elsevier, 2000.
Chapter 27: “Antitrust and Competition in Health Care Markets.” By Martin Gaynor and William B. Vogt. Pages 1405–1478.
Pages 1413–1414:
One of the most important imperfections in health care markets is the moral hazard effect on consumption due to health insurance [Arrow (1963), Pauly (1968), Zeckhauser (1970)]. The vast bulk of health care bought and sold is covered by insurance. This means that the consumer of the service himself pays only a small fraction of the cost, while the majority is reimbursed by third-party payers. Insuring individuals against risk reduces the price they face for medical care, thereby inducing excessive consumption. …
Another form of moral hazard is the decreased incentive for consumers to search for the lowest price [Newhouse (1978)]. In general, however, insurance may lead consumers to search less, or more, in equilibrium [Dionne (1984)].23 The presence of insurance will tend to lead to greater dispersion in prices. It is possible that consumers may search more because the increased dispersion in the price distribution means that there is a bigger potential payoff to search, since the expected gap between the current price and the lowest price is larger. On the other hand, since consumers pay only a small fraction of the expense, the payoff to search may still not exceed the costs. The emergence of highly price responsive buyers of health care in the form of managed care plans can be thought of as an institutional innovation in response to this problem.
[714] Book: Encyclopedia of Health Economics (Volume 2). Edited by Anthony J. Culyer. Elsevier, 2014. Article: “Interactions Between Public and Private Providers.” By C. Goulao and J. Perelman. Pages 72–83.
Page 78:
Moral hazard occurs when an individual facing risk changes one’s behavior depending on whether or not one is insured. For example, dental care insurance may lead individuals to be less cautious about their mouth hygiene, which may be reflected in a higher probability of caries (ex ante moral hazard). Or, in case a tooth is removed individuals may decide toward a dental implant only in case they are insured (ex post moral hazard).
To induce individuals to exert some effort in the limitation of damages (ex ante moral hazard) or to restrain medical care use (ex post moral hazard), insurance contracts typically impose the individual part of the incurred cost by making use of deductibles and/or coinsurance rates. This means that the consequence of moral hazard is partial insurance (incomplete coverage), just as in the case of adverse selection.
Because moral hazard consists of a reaction to insurance, it is present under an NHS [national health system] just as in the private market, for the same level of insurance coverage. Still, the two sectors deal with moral hazard in very different ways. The NHS deals with it by rationing health care, for example, through waiting lists, gatekeeping, and limiting individuals’ choices. Actually delayed access to health care is a sort of limited insurance coverage and can thus give incentives to prevention and consequent limitation of damages (ex ante moral hazard) or restrain individual use of medical care (ex post moral hazard). Similarly, in the private market, individuals are typically not fully insured (due to deductibles and coinsurance rates) and the same mechanism applies. The extent to which each sector is affected by moral hazard depends on the importance of incomplete coverage of each sector. …
To conclude concerning the presence of moral hazard: it is essential to test whether insurance contracts offering more coverage are associated with greater use of health care. Note that even though very different in their causes adverse selection and moral hazard lead exactly to the same observed market effect: Insurance contracts with less coverage are associated to individuals using less health care.
[715] Report: “Value for Money in Health Spending.” Organization for Economic Cooperation and Development, October 7, 2010. <www.oecd-ilibrary.org>
Page 45: “As long as the bulk of health care services received by patients is largely subsidized (if not free at point of use), governments have to find the right incentives to avoid excessive demand and over-supply of health care services.”
[716] Textbook: Neuropsychopharmacology: The Fifth Generation of Progress. Edited by Kenneth L. Davis and others. American College of Neuropsychopharmacology, 2002.
Chapter 67: “The Economic Burden of Anxiety and Stress Disorders.” By Ronald C. Kessler and Paul E. Greenberg. Pages 981–992. <acnp.org>
Page 981:
No society can afford to guarantee universal health insurance coverage for treatment of all illnesses for all of its citizens. The number of illnesses is simply too large and the costs of treatment too great for such a guarantee even in the most economically advantaged societies. Resource allocation rules are consequently needed.1 The most widely accepted of these rules emphasizes cost-effectiveness. According to this rule, medical interventions are appropriate only if their expected benefits clearly exceed the sum of their direct costs and their expected risks.2
[717] Report: “Thinking About Rationing.” By Rudolf Klein and Jo Maybin. The King’s Fund, 2012. <www.kingsfund.org.uk>
Page 4: “Rationing by denial. This is the most headline-catching form of rationing. Specific forms of intervention are excluded from the NHS [U.K.’s National Health Service] services on offer, on the grounds of lack of effectiveness, high cost or a combination of the two.”
Pages 21–22:
The starkest and most visible form of rationing is the “exclusion list.” The Secretary of State is required by law to promote a “comprehensive” health service, but at no point has that phrase been defined in terms of a list of treatments that should be provided by the NHS. NICE [National Institute for Health and Care Excellence] guidance and national policies impose certain requirements on commissioners, but for the most part they must decide what treatments to make available in the context of local need and their finite budget. None publishes a full list of what it does fund for local NHS patients, but many
now list the treatments they will not fund. …
Such exclusions tend to be justified on the grounds that the treatments represent poor clinical value (they don’t offer enough bang for their buck, or simply not much bang at all), or that they are not clinically necessary because they are principally cosmetic, for example.
[718] Article: “Migraine Drug Not Cost Effective NICE [National Institute for Health and Care Excellence] Says in Final Draft Guidance.” National Institute for Health and Care Excellence, September 26, 2019. <www.nice.org.uk>
Following consultation on NICE’s earlier draft guidance, the independent committee considered new cost-effectiveness analyses from the company on the use of erenumab in people with chronic migraine. …
The evidence shows that erenumab is a clinically effective treatment compared with best supportive care. However, the committee remained concerned that the clinical trials didn’t include people who had already unsuccessfully tried other preventive treatments—a group the committee felt were most in need of treatment. …
For chronic migraine there was no direct evidence comparing erenumab with NICE-approved botulinum toxin type A which is considered current practice in the NHS [U.K.’s National Health System] in England. …
The company did not submit any updated cost-effectiveness analysis for episodic migraine.
Because of these factors, and after considering the proposed new commercial arrangement, the cost-effectiveness estimates for erenumab remain higher than what NICE usually considers to be acceptable. …
Registered consultees, including the company and patient and professional groups, now have the opportunity to appeal against the draft guidance. If no appeals are received NICE expects to publish its final guidance on erenumab next month.
[719] Webpage: “Our Charter.” National Institute for Health and Care Excellence. Accessed November 19, 2022 at <www.nice.org.uk>
1. The National Institute for Health and Care Excellence’s (NICE) role is to improve health and wellbeing by putting science and evidence at the heart of health and care decision making. We do this by:
• Providing independent assessment of a wide range of complex evidence to help commissioners, front-line practitioners, patients, carers, and citizens to take better informed decisions. These decisions may be about the care people receive, the safety of new procedures or the use of finite health and care resources.
• Working with those at the forefront of scientific advances and using our analytical skills, knowledge and expertise to identify, assess and develop timely recommendations for innovations that have a real and important impact on patients’ lives, on the delivery of health and care, and that represent good value for the system.
• Working with partners across the health and social care system to drive the uptake of effective and cost-effective new treatments and interventions to benefit the population as a whole and to improve and ensure equity of access to all members of society. …
3. Within the life sciences ecosystem NICE evaluates the clinical and cost effectiveness of technologies to determine funding decisions and assessing new interventional procedures for safety and effectiveness. The health economic lever is a critical one in the innovation pathway that impacts on the commissioning, funding, and adoption of new technologies.
4. Our work in the guidelines ecosystem entails developing best practice recommendations, advice, and quality standards primarily for front line practitioners but also for patients to support shared decision making and, increasingly, the shift to more self-care. Our guideline recommendations extend across the whole care pathway and the health, public health and social care sectors.
[720] Webpage: “Who We Are.” National Institute for Health and Care Excellence. Accessed November 19, 2022 at <leadersatnice.com>
In April 2013 we were established in primary legislation, becoming a Non Departmental Public Body (NDPB) and placing us on a solid statutory footing as set out in the Health and Social Care Act 2012. At this time we took on responsibility for developing guidance and quality standards in social care….
The way NICE [National Institute for Health and Care Excellence] was established in legislation means that our guidance is officially England-only. However, we have agreements to provide certain NICE products and services to Wales, Scotland and Northern Ireland.
[721] Webpage: “The Australian Health Care System.” By Lucinda Glover. The Commonwealth Fund. Accessed November 7, 2019 at <www.commonwealthfund.org>
“Pharmaceutical subsidies are provided through the Pharmaceutical Benefits Scheme (PBS). To be listed, pharmaceuticals need to be approved for cost-effectiveness by the independent Pharmaceutical Benefits Advisory Committee (PBAC).”
[722] Webpage: “Pharmaceutical Benefits Advisory Committee (PBAC) Membership.” Commonwealth of Australia, Department of Health. Last updated November 9, 2022. <www.pbs.gov.au>
The PBAC is an independent expert body appointed by the Australian Government. Members include doctors, health professionals, health economists and consumer representatives.
Its primary role is to recommend new medicines for listing on the PBS [Pharmaceutical Benefits Scheme]. No new medicine can be listed unless the committee makes a positive recommendation. The PBAC meets three times a year, usually in March, July and November.
When recommending a medicine for listing, the PBAC takes into account the medical conditions for which the medicine was registered for use in Australia, its clinical effectiveness, safety and cost-effectiveness (“value for money”) compared with other treatments.
[723] Book: Bioethics: Medical, Ethical and Legal Perspectives. Edited by Peter A. Clark. IntechOpen. December 29, 2016. <www.intechopen.com>
Chapter 7: “Ethical Issues in Organ Procurement and Transplantation.” By Richard J. Howard and Daniell L. Cornell. Pages 123–144. <www.intechopen.com>
Page 137:
Transplant programs frequently refuse to list patients who exhibit some behavioral characteristics such as smoking, addiction, drug abuse, history of noncompliance with a medical regimen, or mental disability. Caplan57 has written that such exclusion of categories of patients such as these increases doubt about the equitable allocation of organs. But transplant centers that do use these categories to exclude patients from listing justify their actions on the basis of being good stewards of precious organs. It would be a tragedy to transplant an organ and have it rejected because the patient did not take her antirejection medications because of behavior characteristics that were known before listing. Every transplant center has had experience with patients losing organs for these reasons. If this type of loss occurs, it means the recipient had an operation for no benefit (and likely would need a second operation to remove the organ or a second transplant) and another patient on the waiting list was denied access to that organ. Furthermore, the donor family who often are in contact with the recipient of their loved one’s organs may experience a second loss if the transplanted organ is lost. This exclusion is especially true if a behavior contributed to organ failure such as alcohol consumption and liver failure or smoking and lung failure. These transplant centers require patients to quit using alcohol and smoking, although they may disagree how long abstinence is required before listing. And some centers permanently remove such patients from the waiting list should they relapse. Caplan57 might think that is too harsh and would lead to doubt about the allocation of organs (since allocation begins with who is put on the waiting list). But most transplant centers believe such exclusions are good medical practice and the correct ethical decision.
[724] Report: “Organ Transplantation.” By Arthur Caplan and Brendan Parent. The Hastings Center, September 23, 2015. <www.thehastingscenter.org>
Rationing is unavoidable in organ transplantation, so the system for allocating organs must be just and fair. Justice requires some rule or policy that ensures that the supply of donated organs is used wisely and consistently with what donors and their families would wish, such as giving priority to saving children’s lives, or to American citizens. Fairness demands that like cases be treated alike and that the allocation system be transparent, so that all who wait know why some are selected and some are not.
There are valid questions about the justice and fairness of the current system. Transplant centers are the gatekeepers who decide whom they will and will not admit as transplant candidates. Their policies vary. Many nonmedical values shape their decisions, and it can be argued that some centers invoke these values in ways that are not truly just. Here are some examples:
• Many transplant centers will not accept people without insurance.
• Transplant teams rarely consider anyone over 75 years of age.
• Some centers exclude patients with moderate mental retardation, mental health challenges, HIV, a history of addiction, or a long criminal record.
• Though American transplant centers can list foreigners, they can make up no more than 5% of any center’s list. Most non-U.S. citizens listed have substantial financial resources and pay in cash.
• Some transplant programs will admit undocumented immigrants, but most of those are children. Some transplant centers have caused controversy by refusing to retransplant organs in undocumented immigrants whose initial organs, received at the same hospital during childhood, have failed.
• Some hospitals do not accept persons who use marijuana, including medical marijuana.
[725] Report: “Thinking About Rationing.” By Rudolf Klein and Jo Maybin. The King’s Fund, 2012. <www.kingsfund.org.uk>
Pages 17–18:
GPs [general practitioners] vary widely in their clinical decisions and many of the factors that determine whether a patient is referred to hospital fall outside of narrowly conceived clinical concerns. … The result is the renewed emphasis by commissioners on attempting to control GP referrals by introducing referral guidelines and thresholds.
Such controls range from PCTs [primary care trusts] prescribing the criteria that GPs ought to consider when making a decision to imposing compulsory, quantified scores to test eligibility for referral. For example, the pre-operative Oxford Hip and Knee Scores are used as a tool for “grading” the degree of severity of someone’s joint problem, incorporating the results of diagnostic imaging with information on stability and mobility of the joint, and the nature and extent of the pain they are suffering; the resulting score determines whether a patient is eligible for a referral. A fifth of the 692 orthopaedic surgeons responding to a BBC [British Broadcasting Corporation] survey in spring 2011 reported that referral thresholds had been raised by their local PCT (Jeffries 2011).
Page 19:
Commissioners used a number of different criteria for limiting access to tonsillectomy. Common among them is a requirement about the number of episodes of the illness the patient must have suffered in recent years in order to be eligible…. Some commissioners require a period of six months “watchful waiting” before the referral; others do not. For some, severe halitosis that has been demonstrated to be tonsil-related is grounds for a referral; others make no mention of this. One commissioner’s policy required that the patient must have previously suffered from quinsy in order to be eligible for tonsillectomy.
[726] Article: “Making Hard Choices: Rationing Health Care Services.” By Lanis L. Hicks. Journal of Legal Medicine, February 2011. Pages 27–50. <www.researchgate.net>
Page 45:
For example, to reduce the demand for health care services, many insurance programs (public and/or private) require enrollees to make a specific payment (a co-payment) at the time of service, to pay a specified amount prior to coverage (a deductible), or to pay a co-insurance amount (a percent of the total price) associated with the use of the service. Any of these three mechanisms increase the out-of-pocket price of the service to the consumer.78 This, typically, results in a reduction in the demand for services, so consumers use fewer services than they would have used without the higher out-of-pocket price to the consumer. The higher the co-payment, deductible, and/or the co-insurance amounts, the more health care services are rationed, as fewer consumers have the willingness and ability to pay for the medical services.
[727] Book: Voluntary Health Insurance In Europe: Country Experience. Edited by A. Sagan and S. Thomson. World Health Organization, European Observatory on Health Systems and Policies, 2016.
Chapter 11: “France.” By Karine Chevreul, Karen Berg Brigham, and Marc Perronnin. <www.ncbi.nlm.nih.gov>
New user charges were introduced in 2005 and extended in 2008. These flat-rate user charges (see Chevreul and others, 2010:63) are referred to as deductibles and are generally applied to all outpatient care: €1 for physician services and laboratory procedures (limited to €50 per year); €0.50 per prescription drug package or ancillary service; and €2 per medical transport (limited to €50 per year). Patients also pay €18 for treatments for which the statutory scheme tariff is over a certain amount (€120). These deductibles are intended to lower use.
[728] Webpage: “International Health Care System Profiles: Switzerland.” By Roosa Tikkanen and others. The Commonwealth Fund, June 5, 2020. <www.commonwealthfund.org>
In addition to deductibles, insured persons pay 10 percent coinsurance for all services (except for maternity care and some preventive services), with a cap of CHF 700 (USD 579) per year for adults and CHF 350 (USD 289) for children through age 18. For brand-name drugs that have a generic alternative, 20 percent coinsurance is charged instead of 10 percent. For hospital stays, there is an additional CHF 15 (USD 12) copayment per inpatient day.
[729] Report: “Health at a Glance 2021: OECD Indicators.” Organization for Economic Cooperation and Development, November 5, 2021. <www.oecd-ilibrary.org>
Page 126:
In some countries, citizens can purchase additional health coverage through voluntary private health insurance. This can cover any cost-sharing left after basic coverage (complementary insurance), add further services (supplementary insurance) or provide faster access or a wider choice of providers (duplicate insurance). Among 22 OECD [Organization for Economic Cooperation and Development] countries with recent comparable data, seven had additional private insurance coverage for over half of the population in 2019…. Israel and the Netherlands had the largest supplementary health insurance market (over 80% of the population), whereby private insurance pays for dental care, physiotherapy, certain prescription drugs and other services that are not publicly reimbursed. …
Over the last decade, the population covered by additional private health insurance has increased in 20 of 25 OECD countries with comparable data, although these increases have often been small. … Several factors determine how additional private health insurance evolves—notably the extent of gaps in access to publicly financed services and government interventions directed at private health insurance markets.
[730] Book: Voluntary Health Insurance In Europe: Country Experience. Edited by A. Sagan and S. Thomson. World Health Organization, European Observatory on Health Systems and Policies, 2016.
Chapter 22: “Netherlands.” By Hans Maarse. <www.ncbi.nlm.nih.gov>
The 2006 health insurance law implied a significant reduction in demand for private health insurance. VHI [voluntary health insurance] lost its traditional substitutive role (Van de Ven & Schut, 2008) and now only plays a complementary role, covering services not covered by the HIA scheme. …
Complementary VHI plans vary widely and may cover dental care for adults, physiotherapy, glasses, orthodontic care, alternative medicine, contraceptives, preventive programmes including physical exercise programmes, dietary services, hearing aids, skin treatments, sterilization and user charges for hospice care. Plans may be standard (basic), silver or gold (most comprehensive). Insurers also offer special plans for dental care and plans covering other services. More recently, insurers have started to target plans at specific population groups, offering plans for young people (vaccinations for travelling abroad, dental care and condoms), families (orthodontic care and some forms of maternity care) and people aged 50 and older (hearing aids, for example). …
Dutch people tend to be risk averse and the share of the population purchasing complementary plans is very high: 84% of people covered by the HIA [Health Insurance Authority] scheme in 2015 (about 74% of people with an individual HIA plan and about 90% of people with a group HIA plan in 2015).
[731] Report: “Canadian Life & Health Insurance Facts: 2022 Edition.” Canadian Life & Health Insurance Association, September 2022. <www.clhia.ca>
Page 16: “Supplementary health reimburses a variety of expenses, such as prescription drugs, dental, hospital and medical expenses, that are not covered by provincial government plans. … In 2021, Canada’s life and health insurers paid $30.4 billion in supplementary health care benefits.”
[732] Webpage: “International Health Care System Profiles: Denmark.” By Roosa Tikkanen and others. The Commonwealth Fund, June 5, 2020. <www.commonwealthfund.org>
“Complementary voluntary health insurance, purchased on an individual basis, covers statutory copayments—mainly for pharmaceuticals and dental care—and services not fully covered by the state, such as physiotherapy. Some 2.45 million Danes (42%) have such coverage, which is provided almost exclusively by the nonprofit organization Danmark.4”
[733] Report: “Canadian Life and Health Insurance Facts: 2019 Edition.” Canadian Life and Health Insurance Association, 2019. <clhia.uberflip.com>
Page 16: “Canadians access health insurance in two ways, through group plans provided by employers, unions or professional associations, and individual plans that are purchased by individual consumers. … Individual: 10% … Group: 90% … 80% of working Canadians and their families are protected by private health insurance plans, up from 73 per cent a decade ago.”
[734] Webpage: “International Health Care System Profiles: Canada.” By Roosa Tikkanen and others. The Commonwealth Fund, June 5, 2020. <www.commonwealthfund.org>
“In 2015, approximately 90 percent of premiums for private health plans were paid through employers, unions, or other organizations under a group contract or uninsured contract (by which a plan sponsor provides benefits to a group outside of an insurance contract).”
[735] Book: Voluntary Health Insurance In Europe: Country Experience. Edited by A. Sagan and S. Thomson. World Health Organization, European Observatory on Health Systems and Policies, 2016.
Chapter 11: “France.” By Karine Chevreul, Karen Berg Brigham, and Marc Perronnin. <www.ncbi.nlm.nih.gov>
All VHI [voluntary health insurance] plans offer complementary cover of user charges; many cover supplementary amenities (hospital accommodation in a single room) and a few cover services not covered by the statutory scheme. Policies differ in the extent of user charges and extra billing they cover. Most cover coinsurance (based on statutory tariffs) for most services fully, but the VHI coverage of the costs of convenience medicines, medical devices and extra-billing varies. In 2010, the largest share of VHI expenditure (41%) was on fees paid to health professionals (Figure 11.2). …
People mainly buy VHI for protection against widespread user charges for publicly financed health services. Since the early 1990s, over 90% of hospital expenditure has been financed publicly. However, public financing of outpatient care fell from 77% in 1980 to 63% in 2010 (Fenina, Le Garrec & Koubi, 2011). Between 1980 and 2008, the annual OOP [out-of-pocket] payment per person grew from €217 to €547 in constant prices (Perronnin, Pierre & Rochereau, 2011). With the shifting of outpatient costs from the statutory scheme to households, VHI’s role in financing and ensuring access to care has grown.
[736] Report: “Health at a Glance 2021: OECD Indicators.” Organization for Economic Cooperation and Development, November 5, 2021. <www.oecd-ilibrary.org>
Page 126:
[Organization for Economic Cooperation and Development] countries with recent comparable data, seven had additional private insurance coverage for over half of the population in 2019…. Complementary insurance to cover cost-sharing is widely used in Slovenia and Korea (around 70% of the population). … In the United States, just under 10% of the population had complementary private health insurance. This is in addition to the 52.5% of the American population who had primary private health insurance.
Over the last decade, the population covered by additional private health insurance has increased in 20 of 25 OECD countries with comparable data, although these increases have often been small. … Several factors determine how additional private health insurance evolves—notably the extent of gaps in access to publicly financed services and government interventions directed at private health insurance markets.
[737] Book: Voluntary Health Insurance In Europe: Country Experience. Edited by A. Sagan and S. Thomson. World Health Organization, European Observatory on Health Systems and Policies, 2016.
Chapter 29: “Slovenia.” By Anja Milenkovic Kramer. <www.ncbi.nlm.nih.gov>
VHI [voluntary health insurance] was introduced in 1993 to diversify sources of health financing and to keep public spending on health low. VHI has always played an explicitly complementary role, covering user charges for publicly financed health benefits. The comprehensive and near-universal cover provided by mandatory health insurance and VHI leaves little room for the development of other VHI products (Milenkovic Kramer, 2009). …
Complementary VHI plans cover user charges. Insurers are required to cover user charges for all publicly financed health services. Complementary VHI premiums are set at a flat rate and are the same for everyone covered by the same insurer. Adult dependents require their own policies (Stanovnik & Turk, 2009). Children are exempt from user charges and so do not require complementary VHI. There is a system of penalties in place for adults who do not purchase complementary VHI as soon as they become liable for user charges. For each complete year (12 months) of not having VHI, the penalty is equal to 3% of the premium. The maximum penalty is 80% of the premium (see Table 29.2). …
Complementary VHI plans covering user charges are purchased by almost everyone who is obliged to pay user charges. Some argue that such a high level of take-up indicates people’s willingness to pay privately for health care (Josar & Toth, 2001; Toth, 2003). Others argue it is because of the high level of user charges required for most publicly financed health services (Keber, 2003; Ministry of Health, 2003). The introduction of penalties for late take-up of complementary cover in 2005 (see Table 29.2) is likely to have sustained the high take-up rate.
[738] Book: Voluntary Health Insurance In Europe: Country Experience. Edited by A. Sagan and S. Thomson. World Health Organization, European Observatory on Health Systems and Policies, 2016.
Chapter 11: “France.” By Karine Chevreul, Karen Berg Brigham, and Marc Perronnin. <www.ncbi.nlm.nih.gov>
“VHI [voluntary health insurance] may be purchased by individuals or by businesses for their employees. A survey showed that, in 2009, 44% of privately insured individuals were covered by group contracts (Garnero, 2012). While most individual VHI contracts are voluntary (56%), group contracts are usually mandatory for all employees and offer broader coverage.”
[739] Book: Voluntary Health Insurance In Europe: Country Experience. Edited by A. Sagan and S. Thomson. World Health Organization, European Observatory on Health Systems and Policies, 2016.
Chapter 19: “Latvia.” By Girts Brigis. <www.ncbi.nlm.nih.gov>
Over time, direct OOP [out-of-pocket] payments started to rise, user charges were introduced and waiting times for NHS [National Health Service] services increased. In this context, in spite of insurers’ complaints about the low profitability of the VHI [voluntary health insurance] business,1 the VHI market has grown, playing both supplementary and complementary roles (covering user charges and services excluded from NHS cover). …
According to the European Health Interview Study, 23% of the female and 24.2% of the male adult population in Latvia reported having some kind of VHI policy in 2008 (Central Statistical Bureau, 2010). Most of those with VHI cover were economically active people of working age with higher education and were covered by their employers. Only 19.2% of those with VHI cover paid for it out of their own pocket (that is, they were covered by a collective plan but this cover was not paid for by the employer).
[740] Book: Voluntary Health Insurance In Europe: Country Experience. Edited by A. Sagan and S. Thomson. World Health Organization, European Observatory on Health Systems and Policies, 2016.
Chapter 18: “Italy.” By Francesca Ferré. <www.ncbi.nlm.nih.gov>
The role of VHI [voluntary health insurance] is mainly supplementary, covering faster access and enhancing consumer choice of provider. This is particularly the case for people wishing to use the services of specialists who engage in part-time private practice (inpatient and outpatient) within public hospitals (intramoenia services) (Cavazza & De Pietro, 2011). …
Survey data suggest that people buy individual supplementary cover to jump waiting lists for treatment (Thomson & Mossialos, 2009) and, in some cases, to obtain better quality of care through access to centres of excellence listed in the coverage plan (or to any other provider in return for a user charge of 5–25% of the cost known as scoperto fuori rete). The availability of, and waiting times for, public and accredited health services vary across regions and areas of care. For example, the average waiting time for some diagnostic tests (such as osseous computerized mineralography, mammography, and MRI, PET and CT scans) and specialist consultations (for example, urology, ophthalmology and cardiology consultations) is over 7.5 months (Fattore, Mariotti & Rebba, 2013).
[741] Report: “Health at a Glance 2021: OECD Indicators.” Organization for Economic Cooperation and Development, November 5, 2021. <www.oecd-ilibrary.org>
Page 126:
In some countries, citizens can purchase additional health coverage through voluntary private health insurance. This can cover any cost-sharing left after basic coverage (complementary insurance), add further services (supplementary insurance) or provide faster access or a wider choice of providers (duplicate insurance). Among 22 OECD [Organization for Economic Cooperation and Development] countries with recent comparable data, seven had additional private insurance coverage for over half of the population in 2019…. Duplicate private health insurance was most widely used in Ireland and Australia. …
Over the last decade, the population covered by additional private health insurance has increased in 20 of 25 OECD countries with comparable data, although these increases have often been small. … Several factors determine how additional private health insurance evolves—notably the extent of gaps in access to publicly financed services and government interventions directed at private health insurance markets.
[742] Book: Voluntary Health Insurance In Europe: Country Experience. Edited by A. Sagan and S. Thomson. World Health Organization, European Observatory on Health Systems and Policies, 2016.
Chapter 34: “United Kingdom.” By Thomas Foubister and Erica Richardson. <www.ncbi.nlm.nih.gov>
VHI [voluntary health insurance] plays a largely supplementary role, providing access to a range of benefits available through the NHS [National Health Service] but with faster access, a choice of private provider (whether a private hospital or the private wing of an NHS hospital) and of specialist acting in a private capacity, and in a more comfortable care environment. …
The introduction of the NHS made VHI redundant as a means of assuring access to doctors or hospitals. The VHI market quickly adapted to this new environment to provide access to care for those who did not want to receive care through the NHS and cover for non-clinical quality perceived to be lacking in NHS care. Market development since then has continued in the same vein: adaptation to provide access to care without the perceived shortcomings of NHS care (whether comfort, timeliness or coverage of specific medicines), while seeking and developing new consumers willing to pay for this—in particular the group market, for whom what VHI offers is perceived to contribute to broader occupational health objectives. …
Individuals buy VHI to avoid potential waiting lists to see a specialist should they need to, have some choice over the specialist they see and to ensure more comfortable surroundings in the event of an inpatient stay. Companies purchase VHI cover for their employees as a fringe benefit or an extension of occupational health services.
[743] Book: Voluntary Health Insurance In Europe: Country Experience. Edited by A. Sagan and S. Thomson. World Health Organization, European Observatory on Health Systems and Policies, 2016.
Chapter 32: “Switzerland.” By Viktor von Wyl and Konstantin Beck. <www.ncbi.nlm.nih.gov>
The first law governing health insurance, introduced in 1911, left health insurance in the hands of private insurers. Although health insurance was voluntary, close to 100% of the population was covered by at least a basic health plan (in 1995). In 1996, health insurance was divided into mandatory and voluntary parts. Mandatory insurance covers expenses for essential treatments related to sickness, accidents and pregnancy. Since there are few major gaps in mandatory coverage, the role of VHI [voluntary health insurance] is primarily supplementary: people buy VHI to gain access to greater choice of hospital and a higher standard of amenities during hospital stays.
[744] Book: Voluntary Health Insurance In Europe: Country Experience. Edited by A. Sagan and S. Thomson. World Health Organization, European Observatory on Health Systems and Policies, 2016.
Chapter 30: “Spain.” By Joan Costa-i-Font. <www.ncbi.nlm.nih.gov>
“Just over half of all VHI [voluntary health insurance] policies are purchased through employer group plans (22% through the public administration and 35% through the private sector); the remaining 43% purchase individual policies (IDIS Foundation, 2013).”
[745] Webpage: “International Health Care System Profiles: Denmark.” By Roosa Tikkanen and others. The Commonwealth Fund, June 5, 2020. <www.commonwealthfund.org>
[N]early 1.69 million Danes (30%) hold supplementary insurance to gain expanded access to private providers, mostly for physiotherapy and minor elective surgeries.5 Seven for-profit insurers sell policies, which are provided mainly through private employers as a fringe benefit, although some public-sector employees are also covered. Students, pensioners, the unemployed, and others outside the job market are generally not covered by supplementary insurance.
[746] Webpage: “International Health Care System Profiles: Australia.” By Roosa Tikkanen. The Commonwealth Fund, June 5, 2020. <www.commonwealthfund.org>
Approximately half of Australians buy private supplementary insurance to pay for private hospital care, dental services, and other services. The federal government pays a rebate toward this premium and also charges a tax penalty on higher-income households that do not purchase private insurance. …
Private health insurance is readily available and offers coverage for out-of-pocket fees and private providers, greater choice of providers (particularly in hospitals), faster access to nonemergency services, and rebates for selected services. Private health insurance may include coverage for hospital care, general treatment, or ambulance services. General treatment coverage provides insurance for dental, physiotherapy, chiropractic, podiatry, home nursing, and optometry services. Coverage may be capped by dollar amount or by number of services. For hospital services, patients can opt to be treated as a public patient (with full fee coverage) or as a private patient (with 75% fee coverage).
Government policies encourage enrollment in private health insurance through a tax rebate (8.5%–33.9%, depending on age and income) and an income-based penalty payment (1%–1.5%) for not having private insurance. This penalty, known as the Medicare Levy surcharge, applies only to singles with incomes above $90,000 and families with incomes above $180,000.7
The Lifetime Health Coverage program provides a lower health insurance premium for life. However, there is a 2 percent increase in the base premium for each year after age 30. Consequently, sign-up is highest among those 30 and under, with a trend to opt out starting at age 50.
Nearly half of the Australian population (46%) had private hospital coverage and nearly 55 percent had private general treatment coverage in 2016.8
[747] Book: Voluntary Health Insurance In Europe: Country Experience. Edited by A. Sagan and S. Thomson. World Health Organization, European Observatory on Health Systems and Policies, 2016.
Chapter 18: “Italy.” By Francesca Ferré. <www.ncbi.nlm.nih.gov>
VHI [voluntary health insurance] was introduced and promoted to manage the growth of private spending on health, without undermining the solidarity and universality of the SSN [Servizio Sanitario Natzionale, Italy’s national health service]. VHI is subsidized through tax incentives; 19% of medical expenses can be deducted from an individual’s taxable income, even if part or all of these expenses were covered by VHI (there is a deductible of €129).
[748] Book: Voluntary Health Insurance In Europe: Country Experience. Edited by A. Sagan and S. Thomson. World Health Organization, European Observatory on Health Systems and Policies, 2016.
Chapter 8: “Denmark.” By Karsten Vrangbæk. <www.ncbi.nlm.nih.gov>
Supplementary plans cover the following (Olejaz and others, 2012):
• Treatment plans cover treatment costs in private hospitals (excluding cosmetic surgery, preventive interventions, dental care or treatments related to pregnancy or sexuality). In 2009, this kind of plan accounted for 88% of supplementary plans.
• Preventive plans (10.5% of the supplementary market) cover the costs of preventive services by physiotherapists and chiropractors and aims to reduce the risk of premature retirement.
• Health and prevention plans (1.7% of the supplementary market) cover costs associated with general health check-ups (but not any subsequent treatment). …
… Supplementary VHI [voluntary health insurance] is mostly provided as a fringe benefit in the workplace because of tax exemption. …
Private health care was explicitly promoted during the 2000s through tax exemptions (2002–2011) and favourable payments to private providers for services delivered to the public sector. In 2012, the Social Democratic government removed the tax exemption, except for policies covering preventive services and employment-related health needs. This is likely to reduce demand for VHI.
[749] Book: Voluntary Health Insurance In Europe: Country Experience. Edited by A. Sagan and S. Thomson. World Health Organization, European Observatory on Health Systems and Policies, 2016.
Chapter 30: “Spain.” By Joan Costa-i-Font. <www.ncbi.nlm.nih.gov>
“VHI [voluntary health insurance] benefits from tax subsidies. Until 1999, this was done via income tax relief. Since then VHI premiums can be deducted from corporate income tax only.”
[750] Webpage: “International Health Care System Profiles: Canada.” By Roosa Tikkanen and others. The Commonwealth Fund, June 5, 2020. <www.commonwealthfund.org>
“Private insurance, held by about two-thirds of Canadians, covers services excluded under universal health coverage, such as vision and dental care, outpatient prescription drugs, rehabilitation services, and private hospital rooms.”
[751] Article: “The Illegality of Private Health Care in Canada.” By Colleen M. Flood and Tom Archibald. Canadian Medical Association Journal, March 20, 2001. Pages 825–830. <www.ncbi.nlm.nih.gov>
Page 828:
The final aspect of public health insurance that we reviewed was limitations on the availability of private insurance to cover the kinds of services covered by provincial insurance plans. Prohibition of private insurance for hospital and physician services that are covered by a public plan (but for which there may be long waits or concerns about quality) dampens the demand for opted-out physicians and physicians who extra-bill by limiting patients’ ability to finance those services. If neither public nor private insurance covers services provided by opted-out physicians and those who extra-bill, the market for those physicians’ services is restricted to patients who can afford to pay out of pocket.
Six of the 10 provinces (Alberta, British Columbia, Manitoba, Ontario, Prince Edward Island and Quebec†) prohibit contracts of private insurance to cover the kinds of services that are publicly funded.54,55,56,57,58,59 All of the provinces that prohibit private insurance do so by prohibiting any person from entering into a contract that covers publicly insured health services. Four of these provinces (British Columbia, Manitoba, Ontario and Prince Edward Island) also explicitly void any part of an insurance contract that covers the kinds of services covered by the public plan.
NOTE: † In 2005, the Supreme Court of Canada struck down Quebec’s ban on private health insurance. The ruling did not apply to other provinces. [Article: “Supreme Court Strikes Ban on Private Health Insurance.” By Laura Eggertson. Canadian Medical Association Journal, July 19, 2005. <www.ncbi.nlm.nih.gov>: “[T]he Supreme Court has ruled 4–3 in favour of a Quebec patient and doctor who challenged the province’s ban on private health insurance for medically necessary services. … The court split over whether the law violated Canadian Charter rights, but 4 justices decided June 9 that it did violate Quebec’s Charter.]
[752] Article: “Chaoulli Decision Resonates One Year Later.” By Wayne Kondro. Canadian Medical Association Journal, July 4, 2006. <www.ncbi.nlm.nih.gov>
Currently, the provinces use various measures to discourage or prohibit private insurance on the grounds it’s necessary to preserve universality within the system so that access is based on need, not ability to pay. Six provinces (British Columbia, Alberta, Manitoba, Ontario, Nova Scotia and Quebec) outlaw private insurance for medicare services. …
On the surface, the decision itself had little impact, other than the government of Quebec’s proposed response to establish wait time guarantees for cataract, knee and hip surgeries, and allow elective surgeries for those 3 to be covered by private insurance and performed by a limited number of affiliated private clinics….
[753] Dataset: “Social Protection: Total Voluntary Health Insurance (PHI) Coverage, % of Total Population.” Organization for Economic Cooperation and Development. Last updated July 4, 2022. Accessed November 25, 2022 at <stats.oecd.org>
NOTE: An Excel file containing the data is available upon request.
[754] Report: “OECD Health Statistics 2022: Definitions, Sources and Methods.” Organization for Economic Cooperation and Development, November 2022. <www.oecd.org>
“Voluntary Health Insurance.” <stats.oecd.org>
Page 1 (of PDF):
Voluntary Health Insurance
Voluntary health insurance (VHI) comprises insurance schemes (financed fully or partly) through private health premiums, i.e., payments that a policyholder makes to ensure coverage under a given insurance policy, generally consisting of a contract that is issued by an insurer to a covered person. Premiums are non-income-related, although the purchase of VHI by a specific population group or by the population at large can be subsidised by the government. The pool of financing is not channelled nor administered through the government, even when the insurer is government-owned. …
Note: Private health insurance may also be compulsory, for example, if stipulated by law and in this case should be considered as part of Government/compulsory health insurance.
Voluntary health insurance includes:
- Employer self-insured health benefits, whereby an employer self-insures health coverage instead of purchasing cover from an insurance company. The employer acts as an insurer in that it assumes insurance risk and is thereby often subject to the same regulatory requirements as other health insurers.
- Special schemes for government employees, where the government, in its role as employers, pays part or the whole premiums of private health insurance cover subscribed for its employees.
For the purpose of this data collection, voluntary health insurance excludes the following schemes:
- Travel insurance covering the risk of illness or accidents incurred abroad;
- Employers or corporation health programmes for their employees that do not imply insurance (for example, direct supply of health services or reimbursement of certain health-related costs);
- Medical savings accounts, health savings accounts or similar schemes which offer pre-payment but do not imply risk sharing or pooling across individuals;
- Insurance products which pay out a lump sum, regular benefits or income replacement, as a result of temporary or permanent disability or critical illness.
Data Reporting
Total VHI coverage: Total coverage is a head count of all individuals covered by at least one VHI policy (including both individuals covered in their own name and dependents). To avoid duplications, it should not refer to the number of VHI policies sold in the country, as individuals may be covered by more than one VHI product. Similarly, total population coverage is not necessarily the sum of VHI coverage by different types, as an individual may hold more than one VHI policy.
[755] Dataset: “Domestic Private Health Expenditure (% of Current Health Expenditure)” World Bank, October 28, 2019. Accessed November 13, 2019 at <data.worldbank.org>
The share of domestic private expenditures on health of the total current health expenditures indicates how much is funded domestically by the private sector. Private sector funds stem from households, corporations and non-profit organizations. Such expenditures can be either prepaid to voluntary health insurance or paid directly to healthcare providers. This indicator describes the role of the private sector in funding healthcare relative to public or external sources.
NOTE: An Excel file containing the data is available upon request.
[756] Report: “Health at a Glance 2021: OECD Indicators.” Organization for Economic Cooperation and Development, November 5, 2021. <www.oecd-ilibrary.org>
Page 14: “Waiting times for elective surgeries, already a policy issue in many countries pre-pandemic, increased. The median number of days on a waiting list increased on average by 58 days for hip replacement, and 88 days for knee replacement in 2020, as compared to 2019.”
Page 148:
Long waiting times for elective (non-emergency) surgery have been a longstanding issue in a number of OECD [Organization for Economic Cooperation and Development] countries, postponing the expected benefits of treatment, meaning that patients continue living with pain and disability. The COVID-19 pandemic has further heightened the issue, as non-urgent interventions have often been postponed during peak periods of the pandemic.
Waiting times are the result of a complex interaction between the demand and supply of health services.
[757] “Waiting Your Turn: Wait Times for Health Care in Canada, 2018 Report.” By Bacchus Barua and David Jacques. Fraser Institute, 2018. <www.fraserinstitute.org>
Page iv:
Wait times can, and do, have serious consequences such as increased pain, suffering, and mental anguish. In certain instances, they can also result in poorer medical outcomes—transforming potentially reversible illnesses or injuries into chronic, irreversible conditions, or even permanent disabilities. In many instances, patients may also have to forgo their wages while they wait for treatment, resulting in an economic cost to the individuals themselves and the economy in general.
[758] This dataset, previously available at <stats.oecd.org>, was discontinued and replaced with other measurements (see <stats.oecd.org>). As of November 2022, the United States and 22 other OECD member countries do not provide data for the new variables.
[759] Dataset: “Health Care Quality Indicators: Waiting Time of More Than Four Weeks for Getting an Appointment with a Specialist, Age-Sex Standardized Rate Per 100 Patients, 16 Years and Over.” Organization for Economic Cooperation and Development. Last updated November 12, 2019. Accessed January 18, 2020 at <stats.oecd.org>
NOTE: An Excel file containing the data is available upon request.
[760] Webpage: “Definitions for Health Care Quality Indicators.” Organization for Economic Cooperation and Development, 2016. <www.oecd.org>
Page 47:
Waiting Time of More Than 4 Weeks for Getting an Appointment with a Specialist …
Coverage: Survey respondents aged 16 and over (4 age groups (16–24, 25–44, 45–65 and 65+) and 16+) who answered the specific question.
Crude rate (weighted) is calculated based on the following definitions:
• Numerator: Number of survey respondents among denominator cases who reported having waited for four weeks or more for getting an appointment with a specialist.
• Denominator: Number of survey respondents who reported having had an appointment with a specialist in the reference year and provided a duration of the waiting time.
[761] Paper: “The Effect of Waiting Times on Demand and Supply for Elective Surgery: Evidence From Italy.” By Andrea Riganti, Luigi Siciliani, and Carlo V. Fiorio. Health Economics, May 30, 2017. Pages 92–105. <onlinelibrary.wiley.com>
Page 92:
In many publicly funded systems, the combination of capacity constraints and limited or no user charges generates an excess demand. Patients are added to a waiting list and are asked to wait. Economists have argued that in the absence of price rationing, waiting times act as a form of nonprice rationing that brings together the demand for and the supply of health care (see seminal papers by Lindsay & Feigenbaum, 1984, and Martin & Smith, 1999). On the demand side, a longer wait will induce some patients to go private at a fee (or a reduced fee if they hold private health insurance) or to seek a less intensive drug treatment, therefore reducing the demand for public surgery. On the supply side, waiting times may induce hospitals to work harder and provide more treatments if doctors are altruistic (i.e., they feel bad about the patients waiting excessively) or if penalties are in place for hospitals exceeding maximum waiting time guarantees (see Martin & Smith, 1999, for a theoretical model, and Propper, Burgess, & Gossage, 2008, on penalties).
Page 101:
Although our study suggests a weak effect of waiting times on demand, the results have important policy implications in relation to the effectiveness of policy initiatives that encourage an expansion in supply to reduce waiting times (through more funding, an extension of working hours, revision of contracts, contracting out to existing private providers, etc.). Some policymakers have argued that such supply‐side policy initiatives can be ineffective because an increase in supply can be offset by large increases in demand (Siciliani & Hurst, 2005). Whether there are merits to this argument depends critically on the demand elasticity to waiting times. Our results show that within the Italian institutional context, the demand is inelastic. Therefore, policies aimed at increasing supply would be effective in reducing waiting times.
[762] Report: “Swedish Waiting Times for Health Care in an International Perspective.” Swedish Association of Local Authorities and Regions, 2011. <webbutik.skl.se>
Pages 46–51 (of PDF):
Appendix 2. National Care Guarantees …
Norway … Certain patients are given priority in order to assure that those with the greatest need are treated first. Among the criteria for selecting priority patients are severity of the condition and the potential for improvement. Those who need specialist care but are not regarded as priority patients must be offered treatment as well, though they will have to wait somewhat longer. …
Italy … Cancer and cardiovascular disorders are given priority. … Four different clusters of priorities:
• U (Urgente), 72 hours
• B (Breve), 10 days
• D (Differibile), Non-acute: 30 days for appointment, 60 days for diagnosis
• P (Programmata) …
Portugal … Initial consultation with a hospital specialist after referral from a health centre: as of the date that the referral from the primary care unit is entered, taking clinical priority into consideration: 30 days if the consultation is assigned top priority, 60 days if the consultation is assigned high priority, 150 days if the consultation is assigned normal priority
[763] Report: “Waiting Times for Health Services.” Organization for Economic Cooperation and Development, May 28, 2020. <www.oecd-ilibrary.org>
In all countries, patients requiring more urgent treatments generally wait less than those whose health status is less likely to deteriorate while waiting. Prioritisation arises not only for people requiring the same treatment, but also across treatments (Gravelle and Siciliani, 20086), as reflected for example by the fact that cancer patients wait significantly less than patients requiring a hip replacement. For instance, median waiting times for coronary bypass, hysterectomy and prostatectomy are generally shorter than for hip and knee replacement….
… Clinical prioritisation tools that distinguish between patients with different health benefits and severity can improve the referral process and the composition of the patients on the list. Prioritisation policies can also help to re-allocate waiting times by letting patients with more severe conditions wait less than those with less severe conditions (as in Norway). Strengthening the primary care referral systems from primary to second care, and improving the coordination between primary and secondary care, is a key policy to ensure the resources are used efficiently and to reduce waiting times.
[764] Report: “Thinking About Rationing.” By Rudolf Klein and Jo Maybin. The King’s Fund, 2012. <www.kingsfund.org.uk>
Page 4: “Rationing by delay The traditional form of rationing in the NHS [U.K.’s National Health System], designed to control access to the system and match demand to supply by making patients wait.”
Page 15:
In the past, waiting times reflected lack of capacity (as well as poor management and a low value being placed on patients’ time); now waiting times often reflect a lack of ability on the part of commissioners to pay providers for treatments. Commissioners are stopping providers from treating patients by introducing minimum waiting times. This approach can effectively defer payments to a new financial year, and potentially reduce expenditure overall since, as one PCT [primary care trust] put it in response to a survey, “experience suggests that if patients wait longer then some will remove themselves from the list or will no longer require treatment when it is finally offered” (Co-operation and Competition Panel 2011). So this approach is one of deterrence as well as delay.
[765] Paper: “NHS [National Health Service] Maximum Waiting Times Standards and Patient Choice Policies.” By Elizabeth Parkin and Alex Bellis. United Kingdom House of Commons Library, October 16, 2018. <researchbriefings.parliament.uk>
Page 5:
Primary Care Trusts, the precursors to CCGs [Clinical Commissioning Groups], were banned from instigating a minimum wait policy under the Coalition Government but this ban was lifted when CCGs came into being in 2013.8
In September 2017, the GP [general practice] news website Pulse revealed that the NHS [National Health Service] Cambridgeshire and Peterborough CCG was bringing in minimum waiting times of approximately 12–18 weeks for “all adults requiring non-urgent treatment.” The CCG was subject to a Capped Expenditure Process due to their large budget deficit.9 The policy was abandoned by the CCG after the move was “widely condemned.”10
In November that year, NHS Trafford CCG and four CCGs in Lincolnshire were also reportedly considering introducing minimum wait times in order to reduce their costs.11 By February 2018, NHS South West Lincolnshire CCG had gone ahead with at least some elements of the plans, which may mean an increase in wait times for non-urgent treatment by a month.12
9 “CCG Instates Minimum 12-Week Referral Waiting Times,” Pulse, 26 September, 2017.
[766] Article: “CCG [Clinical Commissioning Group] Instates Minimum 12-Week Referral Waiting Times.” By Julia Gregory. Pulse, September 26, 2017. <www.pulsetoday.co.uk>
GPs [general practitioners] in one area will have to tell patients they need to wait at least 12 weeks for non-urgent treatment in secondary care going forward.
NHS [National Health System] Cambridgeshire and Peterborough CCG is currently bringing in minimum referral waiting times to help plug deficits.
The area is one of 14 struggling health economies singled out for the Capped Expenditure Process (CEP)—a regulatory intervention brought in by NHS England and NHS Improvement to cut spending in places with the largest budget deficits.
The minimum waiting time will apply for all adults requiring non-urgent treatment, whilst children will be exempt from the rationing procedure.
[767] Paper: “Medical Tourism and National Health Care Systems: An Institutionalist Research Agenda.” By Daniel Beland and Amy Zarzeczny. Globalization and Health, July 16, 2018. <www.ncbi.nlm.nih.gov>
Page 3:
Yet, although the CHA [1984 Canada Health Act] mandates comprehensive coverage for “all insured health services provided by hospitals, medical practitioners or dentists,” many services do not fall under this umbrella and the Canadian health care system has long waiting lists for many non-emergency surgeries like hip replacement.40,42 Wait times vary from province to province but they are a source of frustration for many Canadians, some of whom elect to go abroad to get their non-emergency procedure done faster, even if they have to pay for it themselves, instead of relying on the slower public system back home.7
[768] Paper: “The Effect of Waiting Times on Demand and Supply for Elective Surgery: Evidence From Italy.” By Andrea Riganti, Luigi Siciliani, and Carlo V. Fiorio. Health Economics, May 30, 2017. Pages 92–105. <onlinelibrary.wiley.com>
Page 92: “On the demand side, a longer wait will induce some patients to go private at a fee (or a reduced fee if they hold private health insurance) or to seek a less intensive drug treatment, therefore reducing the demand for public surgery.”
[769] Report: “Waiting Times for Health Services.” Organization for Economic Cooperation and Development, May 28, 2020. <www.oecd-ilibrary.org>
One possible consequence of waiting times is that they can prevent patients from receiving the care they need, and thus contribute to unmet needs. A European-wide survey (EU-SILC) shows that only a relatively small share of people report unmet care needs due to health system reasons in most countries. … However, among people reporting unmet needs for health system reasons, waiting times is the main reason given in nearly 50% of cases on average across these European countries, followed by financial reasons. In Nordic countries, Slovenia, the United Kingdom, Estonia, Lithuania, Poland, the Slovak Republic and Ireland, most people who report unmet needs cite waiting times as the main reason (Figure 3.2).1
[770] Textbook: Handbook of Health Economics (Volume 1B). Edited by Anthony J. Cuyler and Joseph P. Newhouse. Elsevier, 2000.
Chapter 27: “Antitrust and Competition in Health Care Markets.” By Martin Gaynor and William B. Vogt. Pages 1405–1478.
Pages 1413–1414:
One of the most important imperfections in health care markets is the moral hazard effect on consumption due to health insurance [Arrow (1963), Pauly (1968), Zeckhauser (1970)]. The vast bulk of health care bought and sold is covered by insurance. This means that the consumer of the service himself pays only a small fraction of the cost, while the majority is reimbursed by third-party payers. Insuring individuals against risk reduces the price they face for medical care, thereby inducing excessive consumption. …
Another form of moral hazard is the decreased incentive for consumers to search for the lowest price [Newhouse (1978)]. In general, however, insurance may lead consumers to search less, or more, in equilibrium [Dionne (1984)].23 The presence of insurance will tend to lead to greater dispersion in prices. It is possible that consumers may search more because the increased dispersion in the price distribution means that there is a bigger potential payoff to search, since the expected gap between the current price and the lowest price is larger. On the other hand, since consumers pay only a small fraction of the expense, the payoff to search may still not exceed the costs. The emergence of highly price responsive buyers of health care in the form of managed care plans can be thought of as an institutional innovation in response to this problem.
[771] Article: “Interactions Between Public and Private Providers.” By C. Goulao and J. Perelman. Pages 72–83. Encyclopedia of Health Economics (Volume 2). Edited by Anthony J. Culyer. Elsevier, 2014.
Page 78:
Moral hazard occurs when an individual facing risk changes one’s behavior depending on whether or not one is insured. For example, dental care insurance may lead individuals to be less cautious about their mouth hygiene, which may be reflected in a higher probability of caries (ex ante moral hazard). Or, in case a tooth is removed individuals may decide toward a dental implant only in case they are insured (ex post moral hazard).
To induce individuals to exert some effort in the limitation of damages (ex ante moral hazard) or to restrain medical care use (ex post moral hazard), insurance contracts typically impose the individual part of the incurred cost by making use of deductibles and/or coinsurance rates. This means that the consequence of moral hazard is partial insurance (incomplete coverage), just as in the case of adverse selection.
Because moral hazard consists of a reaction to insurance, it is present under an NHS [national health system] just as in the private market, for the same level of insurance coverage. Still, the two sectors deal with moral hazard in very different ways. The NHS deals with it by rationing health care, for example, through waiting lists, gatekeeping, and limiting individuals’ choices. Actually delayed access to health care is a sort of limited insurance coverage and can thus give incentives to prevention and consequent limitation of damages (ex ante moral hazard) or restrain individual use of medical care (ex post moral hazard). Similarly, in the private market, individuals are typically not fully insured (due to deductibles and coinsurance rates) and the same mechanism applies. The extent to which each sector is affected by moral hazard depends on the importance of incomplete coverage of each sector. …
To conclude concerning the presence of moral hazard: it is essential to test whether insurance contracts offering more coverage are associated with greater use of health care. Note that even though very different in their causes adverse selection and moral hazard lead exactly to the same observed market effect: Insurance contracts with less coverage are associated to individuals using less health care.
[772] Paper: “The Effect of Waiting Times on Demand and Supply for Elective Surgery: Evidence From Italy.” By Andrea Riganti, Luigi Siciliani, and Carlo V. Fiorio. Health Economics, May 30, 2017. Pages 92–105. <onlinelibrary.wiley.com>
Page 92: “In many publicly funded systems, the combination of capacity constraints and limited or no user charges generates an excess demand.”
[773] Report: “Waiting Times for Health Services.” Organization for Economic Cooperation and Development, May 28, 2020. <www.oecd-ilibrary.org>
One possible consequence of waiting times is that they can prevent patients from receiving the care they need, and thus contribute to unmet needs. A European-wide survey (EU-SILC) shows that only a relatively small share of people report unmet care needs due to health system reasons in most countries. … However, among people reporting unmet needs for health system reasons, waiting times is the main reason given in nearly 50% of cases on average across these European countries, followed by financial reasons. In Nordic countries, Slovenia, the United Kingdom, Estonia, Lithuania, Poland, the Slovak Republic and Ireland, most people who report unmet needs cite waiting times as the main reason (Figure 3.2).1 …
[S] supply-side policies on their own are unlikely to deliver the expected reductions in waiting times. The main risk is that the additional supply is offset by an increase in demand, through an increase in referrals, tests and procedures, some of which may be inappropriate.
[774] “The World Health Report 2000.” World Health Organization, 2000. <www.who.int>
Page 77:
Human resources, the different kinds of clinical and non-clinical staff who make each individual and public health intervention happen, are the most important of the health system’s inputs. The performance of health care systems depends ultimately on the knowledge, skills and motivation of the people responsible for delivering services.
Furthermore, the human resources bill is usually the biggest single item in the recurrent budget for health. In many countries, two-thirds or more of the total recurrent expenditures reflect labour costs. But people would not be able to deliver services effectively without physical capital—hospitals and equipment—and consumables such as medicines, which play an important role in raising the productivity of human resources.
[775] Calculated with the dataset: “Physicians (Per 1,000 People)” World Bank, November 23, 2021. Accessed December 7, 2021 at <data.worldbank.org>
Physicians include generalist and specialist medical practitioners. …
Development Relevance: The WHO [World Health Organization] estimates that at least 2.5 medical staff (physicians, nurses and midwives) per 1,000 people are needed to provide adequate coverage with primary care interventions (WHO, World Health Report 2006).
Limitations and Exceptions: The WHO compiles data from household and labor force surveys, censuses, and administrative records. Data comparability is limited by differences in definitions and training of medical personnel varies. In addition, human resources tend to be concentrated in urban areas, so that average densities do not provide a full picture of health personnel available to the entire population.
NOTE: An Excel file containing the data and calculations is available upon request.
[776] Report: “Health at a Glance 2021: OECD Indicators.” Organization for Economic Cooperation and Development, November 5, 2021. <www.oecd-ilibrary.org>
Page 212:
The number of doctors in OECD [Organization for Economic Cooperation and Development] countries increased from about 2.8 million in 2000 to 3.4 million in 2010 and 4.1 million in 2019. In most OECD countries, the number of doctors increased more rapidly than population size, so that, on average, the number of doctors rose from 2.7 per 1 000 population in 2000 to 3.6 in 2019….
The rising number of doctors in OECD countries over the past two decades has been driven mainly by increases in the number of students admitted and graduating from domestic medical education and training programmes (see indicator “Medical graduates”). Concerns about doctor shortages and the ageing of the medical workforce prompted many
OECD countries to increase the number of students in medical education programmes (OECD, 20166). In some countries, immigration of foreign-trained doctors also contributed to the growth (see indicator “International migration of doctors and nurses”). A third factor that contributed to the rise is a growing number of doctors in several countries prolonging their working lives and working beyond the previous standard retirement age. …
The data for most countries refer to practising doctors, defined as the number of doctors providing care directly to patients. In many countries (but not all), the numbers include
interns and residents (doctors in training). Colombia, the Slovak Republic and Turkey also include doctors who are active in the health sector even though they may not provide
direct care to patients, adding another 5–10% of doctors. Chile, Costa Rica, Greece and Portugal report the number of physicians entitled to practise, resulting in an even larger overestimation of the number of practising doctors.
[777] Calculated with the dataset: “Nurses and Midwives (Per 1,000 People)” World Bank, November 23, 2021. Accessed December 7, 2021 at <data.worldbank.org>
Nurses and midwives include professional nurses, professional midwives, auxiliary nurses, auxiliary midwives, enrolled nurses, enrolled midwives and other associated personnel, such as dental nurses and primary care nurses. …
Development Relevance: The WHO [World Health Organization] estimates that at least 2.5 medical staff (physicians, nurses and midwives) per 1,000 people are needed to provide adequate coverage with primary care interventions (WHO, World Health Report 2006).
Limitations and Exceptions: The WHO compiles data from household and labor force surveys, censuses, and administrative records. Data comparability is limited by differences in definitions and training of medical personnel varies. In addition, human resources tend to be concentrated in urban areas, so that average densities do not provide a full picture of health personnel available to the entire population.
NOTE: An Excel file containing the data and calculations is available upon request.
[778] Report: “Health at a Glance 2021: OECD Indicators.” Organization for Economic Cooperation and Development, November 5, 2021. <www.oecd-ilibrary.org>
Page 220:
Nurses make up the most numerous category of health workers in nearly all OECD [Organization for Economic Cooperation and Development] countries. The key role they play in providing care in hospitals, long-term care facilities and the community was highlighted again during the COVID-19 pandemic. In 2019, there were just under nine nurses per 1 000 population on average across OECD member countries, ranging from less than three per 1 000 population in Colombia, Turkey, Mexico and Chile to about 18 in Norway and Switzerland….
Nurses outnumber physicians in most OECD countries. On average, there are slightly less than three nurses to every doctor. The ratio of nurses per doctor ranges from about one nurse per doctor in Colombia, Chile, Costa Rica, Mexico and Turkey to more than four in Japan, Finland, the United States and Switzerland….
In many countries, there was strong demand to recruit nurses in response to the COVID-19 pandemic. In the United States, online job postings during the pandemic increased by 27% for registered nurses and 22% for licensed practical/vocational nurses. In Canada, they increased by 6% for registered nurses and 39% for licensed practical nurses (OECD, 20211).
Definition and Comparability
The number of nurses includes those providing services directly to patients (“practising”) and in some cases also those working as managers, educators or researchers.
In countries where different nurses can hold different levels of qualification or role, the data include both professional nurses, who have a higher level of education and perform more complex or skilled tasks, and associate professional nurses, who have a lower level of education but are nonetheless recognised as nurses. Health care assistants (or nursing aides) who are not recognised as nurses are excluded. Midwives are excluded, except in some countries where they are included because they are considered as specialist nurses or for other reasons (Australia, Ireland and Spain).
Greece reports only nurses working in hospitals, resulting in an underestimation.
[779] Textbook: Handbook of Health Economics (Volume 1B). Edited by Anthony J. Cuyler and Joseph P. Newhouse. Elsevier, 2000.
Chapter 27: “Antitrust and Competition in Health Care Markets.” By Martin Gaynor and William B. Vogt. Pages 1405–1478.
Pages 1413–1414:
One of the most important imperfections in health care markets is the moral hazard effect on consumption due to health insurance [Arrow (1963), Pauly (1968), Zeckhauser (1970)]. The vast bulk of health care bought and sold is covered by insurance. This means that the consumer of the service himself pays only a small fraction of the cost, while the majority is reimbursed by third-party payers. Insuring individuals against risk reduces the price they face for medical care, thereby inducing excessive consumption. …
Another form of moral hazard is the decreased incentive for consumers to search for the lowest price [Newhouse (1978)]. In general, however, insurance may lead consumers to search less, or more, in equilibrium [Dionne (1984)].23 The presence of insurance will tend to lead to greater dispersion in prices. It is possible that consumers may search more because the increased dispersion in the price distribution means that there is a bigger potential payoff to search, since the expected gap between the current price and the lowest price is larger. On the other hand, since consumers pay only a small fraction of the expense, the payoff to search may still not exceed the costs. The emergence of highly price responsive buyers of health care in the form of managed care plans can be thought of as an institutional innovation in response to this problem.
[780] Article: “Interactions Between Public and Private Providers.” By C. Goulao and J. Perelman. Pages 72–83. Encyclopedia of Health Economics (Volume 2). Edited by Anthony J. Culyer. Elsevier, 2014.
Page 78:
Moral hazard occurs when an individual facing risk changes one’s behavior depending on whether or not one is insured. For example, dental care insurance may lead individuals to be less cautious about their mouth hygiene, which may be reflected in a higher probability of caries (ex ante moral hazard). Or, in case a tooth is removed individuals may decide toward a dental implant only in case they are insured (ex post moral hazard).
To induce individuals to exert some effort in the limitation of damages (ex ante moral hazard) or to restrain medical care use (ex post moral hazard), insurance contracts typically impose the individual part of the incurred cost by making use of deductibles and/or coinsurance rates. This means that the consequence of moral hazard is partial insurance (incomplete coverage), just as in the case of adverse selection.
Because moral hazard consists of a reaction to insurance, it is present under an NHS [national health system] just as in the private market, for the same level of insurance coverage. Still, the two sectors deal with moral hazard in very different ways. The NHS deals with it by rationing health care, for example, through waiting lists, gatekeeping, and limiting individuals’ choices. Actually delayed access to health care is a sort of limited insurance coverage and can thus give incentives to prevention and consequent limitation of damages (ex ante moral hazard) or restrain individual use of medical care (ex post moral hazard). Similarly, in the private market, individuals are typically not fully insured (due to deductibles and coinsurance rates) and the same mechanism applies. The extent to which each sector is affected by moral hazard depends on the importance of incomplete coverage of each sector. …
To conclude concerning the presence of moral hazard: it is essential to test whether insurance contracts offering more coverage are associated with greater use of health care. Note that even though very different in their causes adverse selection and moral hazard lead exactly to the same observed market effect: Insurance contracts with less coverage are associated to individuals using less health care.
[781] Paper: “The Effect of Waiting Times on Demand and Supply for Elective Surgery: Evidence From Italy.” By Andrea Riganti, Luigi Siciliani, and Carlo V. Fiorio. Health Economics, May 30, 2017. Pages 92–105. <onlinelibrary.wiley.com>
Page 92: “In many publicly funded systems, the combination of capacity constraints and limited or no user charges generates an excess demand.”
[782] Report: “Waiting Times for Health Services.” Organization for Economic Cooperation and Development, May 28, 2020. <www.oecd-ilibrary.org>
One possible consequence of waiting times is that they can prevent patients from receiving the care they need, and thus contribute to unmet needs. A European-wide survey (EU-SILC) shows that only a relatively small share of people report unmet care needs due to health system reasons in most countries. … However, among people reporting unmet needs for health system reasons, waiting times is the main reason given in nearly 50% of cases on average across these European countries, followed by financial reasons. In Nordic countries, Slovenia, the United Kingdom, Estonia, Lithuania, Poland, the Slovak Republic and Ireland, most people who report unmet needs cite waiting times as the main reason (Figure 3.2).1 …
[S]upply-side policies on their own are unlikely to deliver the expected reductions in waiting times. The main risk is that the additional supply is offset by an increase in demand, through an increase in referrals, tests and procedures, some of which may be inappropriate.
[783] Report: “Health at a Glance 2021: OECD Indicators.” Organization for Economic Cooperation and Development, November 5, 2021. <www.oecd-ilibrary.org>
Page 134:
Consultations with primary care doctors are, for many people, the most frequent contact with health services, and often provide an entry point for subsequent medical treatment. …
Differences in service delivery modalities explain some of the cross-country variation. In Canada, Finland, Ireland, New Zealand, Sweden, the United Kingdom and the United States, the relatively low number of doctor consultations can be explained in part by the fact that nurses and other health professionals play an important role in primary care—notably in the management of patients with chronic diseases and in dealing with patients with minor health issues. This lessens the need for doctor consultations (Maier, Aiken and Busse, 201711).
[784] Report: “Health at a Glance 2021: OECD Indicators.” Organization for Economic Cooperation and Development, November 5, 2021. <www.oecd-ilibrary.org>
Page 134:
Consultations with primary care doctors are, for many people, the most frequent contact with health services, and often provide an entry point for subsequent medical treatment. Consultations can take place in doctors’ clinics, hospital outpatient departments or, in some cases, patients’ own homes. Increasingly, consultations can also take place online and through video calls, through the development of teleconsultations (Oliveira Hashiguchi, 202010). The use of teleconsultations increased greatly during the COVID-19 pandemic as a way to protect both patients and doctors, and to avoid spreading the virus….
Page 136:
With the onset of the COVID-19 pandemic, and the resulting restrictions to mobility, work and social interactions, many more people were unable to receive medical advice in person. In 2019, before the pandemic, remote consultations via phone or video accounted for fewer than 10% of all consultations in Australia, Finland, Lithuania, Norway and Slovenia. Denmark had the highest share of remote consultations pre-pandemic, at 45%. From the start of the pandemic, the proportion of adults who reported having a medical consultation online or by phone increased dramatically: by mid-2020, almost one in three adults had used a remote consultation, a proportion that went up to almost one in two by early 2021 (Figure 5.15). Countries where use of remote consultations was highest in mid-2020 also had higher growth rates between mid-2020 and early 2021, indicating an increasing divergence.
[785] Report: “Health at a Glance 2021: OECD Indicators.” Organization for Economic Cooperation and Development, November 5, 2021. <www.oecd-ilibrary.org>
Page 134:
COVID-19 has also had a substantial impact on doctor consultations. Stay-at-home orders and suspension of non-urgent care—particularly early on in the pandemic—contributed to fewer doctor consultations, as did many people’s reluctance to visit health care facilities due to concerns about catching the virus (OECD, 20205). Based on preliminary data for 2020, consultations per capita dropped in seven out of eight OECD countries, compared to 2019. In-person consultations fell by around 30% in Chile and Spain, by 16–17% in Costa Rica, Israel and Norway, and by just under 10% in Australia and Mexico, with no change observed in Denmark. However, declines in in-person consultations were offset to some extent by increasing numbers of teleconsultations….
[786] Report: “Strengthening the Frontline: How Primary Health Care Helps Health Systems Adapt During the Covid-19 Pandemic.” Organization for Economic Cooperation and Development, February 10, 2021. <read.oecd-ilibrary.org>
Pages 6–7:
At the peak of the first wave of infections, a number of countries scaled back delivery of non-COVID-19 related health services in an effort to increase hospital and health system capacity. For example, in Australia (until the end of April 2020), all non-urgent elective surgeries were cancelled to free up space in hospitals (Australian Government Department of Health, 202017). Similar policies have been implemented in the United Sates, Portugal, and Chile (OECD, 202018). In France, ambulatory surgery has dropped by nearly 80% during the lockdown period (15 March–11 May 2020) compared to same period in 2019 (Finkel, Séguret and Meunier, 202019). …
Beyond hospital care, a number of countries also postponed care in other settings during the first half of 2020 as countries implemented policies to reduce non-essential medical care, including ambulatory care, vaccinations, laboratory testing, physical therapy, cancer screening, and other routine care. A recent systematic review of data across 20 countries showed that health care utilisation decreased by a median of 37% of services overall, 42% for visits, 31% for diagnostics, 30% for therapeutics and 28% for admissions (Moynihan and others, 202021). …
A number of countries have seen significant reductions in the use of face-to-face outpatient services during peaks of infections. A study from the United States found that the number of visits to ambulatory practices declined by nearly 60% during March 2020, and by around 50% for primary health care visits over the same period (Figure 1) (Commonwealth Fund, 202030). Belgium observed a similar reduction in primary health care consultations in April 2020 as compared to April 2019 (Figure 1). Nationwide data from Santé Publique France indicate a reduction of primary health care consultation of 25% in April 2020 as compared to April 2019. In England, data from the National Health Service (NHS) show that the overall number of primary health care appointments fell by 30% in March 2020. In Norway, primary health care consultations have been reduced by 11% between the end of March 2020 compared with early March 2020.
Primary health care visits have not been decreasing in all countries. An initial study from the Netherlands found that the overall number of consultations with primary health care providers before and during the outbreak in the first half of 2020 was similar, with an added increase of telephone/e-mail and internet consultations—rising from 30.6% in 2019 to 53.3% in March 2020 (Schers and others, 202031).
[787] Article: “How Have Health Spending and Utilization Changed During the Coronavirus Pandemic?” By Cynthia Cox, Krutika Amin, and Rabah Kamal. Peterson–Kaiser Family Foundation Health System Tracker, March 22, 2021. <www.healthsystemtracker.org>
Early in the COVID-19 pandemic, it was not clear how healthcare utilization and spending would change. Although one might expect health costs to increase during a pandemic, there were other factors driving spending and utilization down.
In spring of 2020, healthcare use and spending dropped precipitously due to cancellations of elective care to increase hospital capacity and social distancing measures to mitigate community spread of the coronavirus. Although telemedicine use increased sharply, it was not enough to compensate for the drop in in-person care. …
The drop in health spending in 2020 reflects a decrease in utilization for non-COVID medical care. Particularly early in the pandemic, it appears many people delayed or went without medical care they otherwise would have received. Although healthcare use picked up toward the end of the year, it was not enough to compensate for the missed care earlier in the year. …
According to an analysis of electronic health records by Epic Health Research Network, the average weekly screenings for breast, colon, and cervical cancers dropped 94%, 86%, and 94% during January 20–April 21, 2020 relative to the averages before January 20, 2020. An analysis by IQVIA found that oncology visits for newly diagnosed cancer patients began to increase in summer, but and had still not reached baseline in October.
[788] Calculated with the dataset: “Health Care Utilisation: Doctor Consultations (In All Settings), Number per Capita.” Organization for Economic Cooperation and Development. Last updated July 4, 2022. Accessed November 28, 2022 at <stats.oecd.org>
NOTE: An Excel file containing the data and calculations is available upon request.
[789] Report: “OECD Health Statistics 2022: Definitions, Sources and Methods.” Organization for Economic Cooperation and Development, November 2022. <www.oecd.org>
“Doctor Consultations (in All Settings).” <stats.oecd.org>
Page 1 (of PDF):
Average number of consultations/visits with a physician per person per year.
Inclusion
• consultations/visits both to generalist and specialist medical practitioners
• consultations/visits at the physician’s office
• consultations/visits in the patient’s home
• consultations/visits in outpatient departments in hospital and ambulatory health care centres
Exclusion
• telephone and email contacts
• visits for prescribed laboratory tests
• visits to perform prescribed and scheduled treatment procedures, for example injections, physiotherapy etc.
• visits to dentists
• visits to nurses
• consultations during an inpatient stay or a day care treatment
[790] Report: “Health at a Glance 2021: OECD Indicators.” Organization for Economic Cooperation and Development, November 5, 2021. <www.oecd-ilibrary.org>
Page 134:
Consultations can take place in doctors’ clinics, hospital outpatient departments or, in some cases, patients’ own homes. …
COVID-19 has also had a substantial impact on doctor consultations. Stay-at-home orders and suspension of nonurgent care—particularly early on in the pandemic—contributed to fewer doctor consultations, as did many people’s reluctance to visit health care facilities due to concerns about catching the virus (OECD, 20205). Based on preliminary data for 2020, consultations per capita dropped in seven out of eight OECD countries, compared to 2019. … However, declines in in-person consultations were offset to some extent by increasing numbers of teleconsultations….
Consultations with doctors refer to the number of face-to-face (in-person) contacts with physicians, including both generalists and specialists. There are variations across countries in the coverage of different types of consultations, notably in outpatient departments of hospitals. Data come mainly from administrative sources, although in some countries (including Ireland, Italy, the Netherlands, New Zealand, Spain and Switzerland) they come from health interview surveys. Data from administrative sources tend to be more accurate (and higher) than those from surveys because of problems with recall and non-response rates.
[791] Webpage: “Diagnostic Imaging.” World Health Organization. Accessed November 4, 2019 at <www.who.int>
Medical imaging encompasses different imaging modalities and processes to image the human body for diagnostic and treatment purposes and therefore plays an important role in initiatives to improve public health for all population groups. Furthermore, medical imaging is frequently justified in the follow-up of a disease already diagnosed and/or treated.
Medical imaging, especially X-ray based examinations and ultrasonography, is crucial in a variety of medical setting and at all major levels of health care. In public health and preventive medicine as well as in both curative and palliative care, effective decisions depend on correct diagnoses. Though medical/clinical judgment may be sufficient prior to treatment of many conditions, the use of diagnostic imaging services is paramount in confirming, correctly assessing and documenting courses of many diseases as well as in assessing responses to treatment.
With improved health care policy and increasing availability of medical equipment, the number of global imaging-based procedures is increasing considerably. Effective, safe, and high quality imaging is important for much medical decision-making and can reduce unnecessary procedures. For example, some surgical interventions can be avoided altogether if simple diagnostic imaging services such as ultrasound are available.
[792] Webpage: “Diagnostic Imaging: Magnetic Resonance Imaging.” World Health Organization. Accessed November 4, 2019 at <www.who.int>
Magnetic resonance imaging (MRI), is a medical imaging technique used in radiology to visualize detailed internal structures using magnetic radiation. MRI provides real-time, three-dimensional views of body organs with good soft tissue contrast, making visualization of brain, spine, muscles, joints and other structures excellent. It is multiplanar, which means that images can be obtained in multiple body planes without changing positions. …
Common Clinical Applications
• Brain MRI with diffusion/perfusion studies
• Spinal MRI
• Abdominal MRI to assess liver, spleen, kidneys, MR cholangiography, etc
• Neck MRI
• Magnetic resonance angiography
• Cardiac MRI
• Extremities for joints, muscles, bone disorders
• Chest/mediastinal MRI
• Image-guided interventional procedures
[793] Webpage: “Diagnostic Imaging: Computed Tomography.” World Health Organization. Accessed November 4, 2019 at <www.who.int>
Computed tomography (CT) is an imaging modality that utilizes x-ray photons for image production, with digital reconstruction. The CT scanner essentially consists of an x-ray tube and detectors. The x-ray tube produces an x-ray beam that passes through the patient. This beam is captured by the detectors and reconstructed to create a two or three dimensional image. …
Contrast media may be employed during a CT study. It helps to distinguish structures of similar density in the body. The most commonly used in CT studies are intravenous and oral contrast agents. Many abnormalities, such as bleeding, extravasation or neoplasms become more evident through contrast perfusion. Oral contrast may also be given to opacify the cavities of the gastrointestinal organs, allowing for greater differentiation of these spaces. …
Common Clinical Applications
• Brain (with or without contrast and perfusion study)/Cranial/Head/Neck CT
• CT myelography
• Chest/mediastinum/high resolution CT
• Abdominal CT
• Pelvic CT
• CT urography
• CT Colonography
• Cardiac CT
• CT angiography
• Quantitative Computed Tomography, QCT Densitometry
• Extremities
[794] Webpage: “Imaging and Radiology.” U.S. Department of Health and Human Services, National Institutes of Health, National Library of Medicine. Accessed November 30, 2022 at <medlineplus.gov>
Diagnostic radiology helps health care providers see structures inside your body. … Using the diagnostic images, the radiologist or other physicians can often:
• Diagnose the cause of your symptoms
• Monitor how well your body is responding to a treatment you are receiving for your disease or condition
• Screen for different illnesses, such as breast cancer, colon cancer, or heart disease
The most common types of diagnostic radiology exams include:
• Computed tomography (CT), also known as a computerized axial tomography (CAT) scan, including CT angiography
• Fluoroscopy, including upper GI and barium enema
• Magnetic resonance imaging (MRI) and magnetic resonance angiography (MRA)
• Mammography
• Nuclear medicine, which includes such tests as a bone scan, thyroid scan, and thallium cardiac stress test
• Plain x-rays, which includes chest x-ray
• Positron emission tomography, also called PET imaging, PET scan, or PET-CT when it is combined with CT
• Ultrasound
[795] Webpage: “Benefits of Medical Imaging.” University of California, San Francisco, Department of Radiology & Biomedical Imaging. Accessed November 30, 2022 at <radiology.ucsf.edu>
There are many benefits for patients from medical imaging. Images of the human body are created using a variety of means such as ultrasound, magnetic resonance, nuclear medicine and X-rays to allow physicians to see inside the body, to identify and/or rule out medical problems, and to diagnose diseases. …
CT [computed tomography] enables more effective medical management, and its benefits include:
• Determining when surgeries are necessary
• Reducing the need for exploratory surgeries
• Improving cancer diagnosis and treatment
• Reducing the length of hospitalizations
• Guiding treatment of common conditions such as injury, cardiac disease and stroke
• Improving patient placement into appropriate areas of care, such as an intensive care unit
[796] Report: “Health at a Glance 2021: OECD Indicators.” Organization for Economic Cooperation and Development, November 5, 2021. <www.oecd-ilibrary.org>
Page 142:
Technologies play an important role in medical diagnoses: from physical examination and results processing and sharing, to accessing patients’ health records, to the review of clinical histories. However, new technologies can also drive up costs, and are commonly acknowledged to be one of the main causes of increases in health spending (Lorenzoni and others, 201920). … CT [computed tomography] and MRI [magnetic resonance imaging] examinations (exams) both show images of internal organs and tissues, while PET [positron emission tomography] scans show other information and problems at the cellular level.
There is no general guideline or international benchmark regarding the ideal number of CT scanners, PET scanners or MRI units. Too few units may lead to access problems in terms of geographical proximity or waiting times, while too many may result in overuse of these costly diagnostic procedures, with little if any benefit for patients. Availability of CT and PET scanners and MRI units has increased rapidly in most OECD [Organization for Economic Cooperation and Development] countries over the past two decades.
[797] Dataset: “Magnetic Resonance Imaging (MRI) Units, Total Per 1,000,000 Inhabitants.” Organization for Economic Cooperation and Development. Accessed November 29, 2022 at <data.oecd.org>
NOTE: An Excel file containing the data is available upon request.
[798] Dataset: “Magnetic Resonance Imaging (MRI) Exams, Total Per 1,000 Inhabitants.” Organization for Economic Cooperation and Development. Accessed November 29, 2022 at <data.oecd.org>
NOTE: An Excel file containing the data is available upon request.
[799] Dataset: “Computed Tomography (CT) Scanners, Total Per 1,000,000 Inhabitants.” Organization for Economic Cooperation and Development. Accessed November 29, 2022 at <data.oecd.org>
NOTE: An Excel file containing the data is available upon request.
[800] Dataset: “Computed Tomography (CT) Exams, Total Per 1,000 Inhabitants.” Organization for Economic Cooperation and Development. Accessed November 29, 2022 at <data.oecd.org>
NOTE: An Excel file containing the data is available upon request.
[801] Webpage: “Cancer.” World Health Organization. Accessed October 29, 2019 at <www.who.in>
In order to improve breast cancer outcomes and survival, early detection is critical. …
Mammography: uses low-energy X-rays to identify abnormalities in the breast. It has been shown to reduce breast cancer mortality by approximately 20% in high-resource settings. WHO [World Health Organization] Position paper on mammography screening concluded that in well-resourced settings women aged 50–69 should undergo organized, population-based mammography screening if pre-specified conditions on programme implementation are met. In limited resource settings with weak health systems, mammography is not cost-effective, and early detection should focus on reducing stage at diagnosis through improved awareness. For women aged 40–49 years or 70–75 years, WHO recommends systematic mammography screening in women aged 40–49 years or 70–75 years only in the context of rigorous research and in well-resourced settings. …
Because screening requires substantial investment and carries significant potential personal and financial costs, the decision to proceed with screening should be pursued only after (1) basic breast health services including effective diagnosis and timely treatment are available to an entire target group; (2) its effectiveness has been demonstrated in the region; and (3) resources are available to sustain the programme and maintain quality.
[802] Report: “Guide to Cancer Early Diagnosis.” World Health Organization, 2017. <apps.who.int>
Page 9:
[S]creening aims to identify unrecognized cancer or its precursor lesions in an apparently health, asymptomatic population by means of tests, examinations, imaging, or other procedures that can be applied rapidly and accessed widely by the target population. …
When discussing the availability and/or use of a testing modality for early diagnosis and
screening, it is important to distinguish its use as a diagnostic test (early diagnosis)
or as a screening test. For example, for a patient who has developed a breast lump,
a mammogram functions as a diagnostic test in cancer early diagnosis. Alternatively,
mammography might be used as part of a breast cancer screening programme for a
target population who generally do not have symptoms.
Page 10:
Table 1. Key Elements of Early Diagnosis and Screening
Screening programme …
Potential reduction in incidence in target population if precursor detected and treated by screening (for example cervical and colorectal cancers)
Reduction in stage of disease at diagnosis in target population (general earlier stage than early diagnosis)
Reduction in mortality when screening delivered effectively and linked to treatment, but not for many ears (often > 10 years) …
Benefits documented in high-resource settings for limited number of cancers (for example cervical, breast)
[803] “Position Paper on Mammography Screening.” World Health Organization, February 16, 2014. <www.who.int>
Pages 11–12:
Recommendations by Age Group and Resource Setting
1. Women aged 50−69 years
1.1 Well-resourced settings
In well-resourced settings, WHO recommends1 organized, population-based mammography screening programmes for women aged 50−69 years if the conditions for implementing an organized programme specified in this guide2 are met by the health-care system, and if shared decision-making strategies are implemented so that women’s decisions are consistent with their values and preferences. (Strong recommendation based on moderate quality evidence)
WHO suggests a screening interval of two years. (Conditional recommendation based on low quality evidence)
1.2 Limited resource settings with relatively strong health systems
In limited resource settings with relatively strong health systems, WHO suggests3 considering an organized, population-based mammography screening programme for women aged 50−69 years only if the conditions for implementing an organized programme specified in this guide4 are met by the health-care system, and if shared decision-making strategies are implemented so that women’s decisions are consistent with their values and preferences. (Conditional recommendation based on moderate quality evidence)
WHO suggests a screening interval of two years. (Conditional recommendation based on low quality evidence)
1.3 Limited resource settings with weak health systems
In limited resource settings with weak health systems, where the majority of women with breast cancer are diagnosed in late stages and mammography screening is not cost-effective and feasible, early diagnosis of breast cancer through universal access of women with symptomatic lesions to prompt and effective diagnosis and treatment should be high on the public health agenda (WHO, 2013). Clinical breast examination, a low-cost screening method, seems to be a promising approach for these settings and could be implemented when the necessary evidence from ongoing studies becomes available (Sankaranarayanan and others, 2011).
[804] Calculated with the dataset: “Health Care Utilisation: Screening, Breast Cancer Screening, Survey Data, % of Females Aged 50–69 Screened.” Organization for Economic Cooperation and Development. Last updated November 9, 2021. Accessed December 16, 2021 at <stats.oecd.org>
NOTE: An Excel file containing the data and calculations is available upon request.
[805] Report: “OECD Health Statistics 2021: Definitions, Sources and Methods.” Organization for Economic Cooperation and Development, July 1, 2021. <www.oecd.org>
“Breast Cancer Screening (Mammography), Survey Data and Programme Data.” <stats.oecd.org>
Page 1 (of PDF):
Breast Cancer Screening (Mammography), Survey Data and Programme Data
Number of women aged 50–69 who have received a bilateral mammography within the past two years (or according to the specific screening frequency recommended in each country) divided by the number of women aged 50–69 answering survey questions on mammography (for survey-based data)….
[806] Textbook: Neuropsychopharmacology: The Fifth Generation of Progress. Edited by Kenneth L. Davis and others. American College of Neuropsychopharmacology, 2002.
Chapter 67: “The Economic Burden of Anxiety and Stress Disorders.” By Ronald C. Kessler and Paul E. Greenberg. Pages 981–992. <acnp.org>
Page 981:
No society can afford to guarantee universal health insurance coverage for treatment of all illnesses for all of its citizens. The number of illnesses is simply too large and the costs of treatment too great for such a guarantee even in the most economically advantaged societies. Resource allocation rules are consequently needed.1 The most widely accepted of these rules emphasizes cost-effectiveness. According to this rule, medical interventions are appropriate only if their expected benefits clearly exceed the sum of their direct costs and their expected risks.2
[807] Report: “Health at a Glance 2015: OECD Indicators.” Organization for Economic Cooperation and Development, 2015. <www.oecd-ilibrary.org>
Page 20:
The financial protection that people have against the cost of illness depends not only on whether they have a health insurance, but also on the range of goods and services covered and the extent to which these goods and services are covered. In countries like France and the United Kingdom, the amount that households have to pay directly for health services and goods as a share of their total consumption is relatively low, because most such goods and services are provided free or are fully covered by public and private insurance, with only small additional payments required. Some other countries, such as Korea and Mexico, have achieved universal (or quasi-universal) health coverage, but a relatively small share of the cost of different health services and goods are covered, leaving a significant amount to be paid by households. Direct out-of-pocket payments can create financial barriers to health care, dental care, prescribed pharmaceutical drugs or other health goods or services, particularly for low-income households. The share of household consumption spent on direct medical expenditure is highest in Korea, Switzerland, Portugal, Greece and Mexico, although some of these countries have put in place proper safeguards to protect access to care for people with lower income.
[808] Report: “Health at a Glance 2021: OECD Indicators.” Organization for Economic Cooperation and Development, November 5, 2021. <www.oecd-ilibrary.org>
Page 132:
Where health systems fail to provide adequate financial protection, people may suffer financial hardship from paying for health care, or simply not have enough money to pay for health care. As a result, lack of financial protection can reduce access to health care, undermine health status, deepen poverty and exacerbate health and socio-economic inequalities. On average across OECD [Organization for Economic Cooperation and Development] countries, just over one-fifth of all spending on health care comes directly from patients through out-of-pocket (OOP) payments…. People experience financial hardship when the burden of such OOP payments is large in relation to their ability to pay. Poorer households and those who have to pay for long-term treatment—such as medicines for chronic illness—are particularly vulnerable.
[809] Dataset: “Social Protection, Total Public and Primary Private Health Insurance (% of Total Population Covered).” Organization for Economic Cooperation and Development. Last updated July 4, 2022. Accessed November 29, 2022 at <stats.oecd.org>
NOTE: An Excel file containing the data is available upon request.
[810] Report: “OECD Health Statistics 2019: Definitions, Sources and Methods, Private Health Insurance.” Organization for Economic Cooperation and Development, June 2019. <www.oecd.org>
Page 1 (of PDF):
Private health insurance comprises insurance schemes financed through private health premiums, i.e., payments that a policyholder agrees to make for coverage under a given insurance policy, where an insurance policy generally consists of a contract that is issued by an insurer to a covered person. Take up of private health insurance is often, but not always, voluntary (it may also be compulsory for employees as part of their working conditions). Premiums are nonincome-related, although the purchase of PHI [private health insurance] by a specific population group or by the population at large can be subsidised by the government. The pool of financing is not channelled nor administered through the government, even when the insurer is government-owned.
[811] Report: “Health at a Glance 2021: OECD Indicators.” Organization for Economic Cooperation and Development, November 5, 2021. <www.oecd-ilibrary.org>
Page 126:
Most OECD [Organization for Economic Cooperation and Development] countries have achieved universal (or near-universal) coverage for a core set of health services, which usually include consultations with doctors, tests and examinations, and hospital care…. National health systems or social health insurance have typically been the financing schemes for achieving universal health coverage. A few countries (the Netherlands and Switzerland) have obtained universality through compulsory private health insurance—supported by public subsidies and laws on the scope and depth of coverage.
Population coverage for core services in 2019 remained below 95% in seven OECD countries, and below 90% in Mexico and the United States. Mexico has expanded coverage since 2004, but gaps remain (OECD, 20161). In the United States, uninsured people tend to be working-age adults with lower education or income levels—the share of uninsured people decreased sharply from about 13% in 2013 to 9% in 2015 (United States Census Bureau, 20182), but has remained relatively unchanged since then. In Ireland, although coverage is universal, less than half of the population are covered for the cost of general practitioner visits. Recent reform proposals suggest a gradual rollout of primary care coverage to the entire population (OECD/European Observatory of Health Systems and Policies, 20193). …
Population coverage for health care is defined here as the share of the population eligible for a core set of health care services—whether through public programmes or primary private health insurance. The set of services is country-specific but usually includes consultations with doctors, tests and examinations, and hospital care. Public coverage includes both national health systems and social health insurance. On national health systems, most of the financing comes from general taxation, whereas in social health insurance systems, financing typically comes from a combination of payroll contributions and taxation. In both, financing is linked to ability to pay. Primary private health insurance refers to insurance coverage for a core set of services, and can be voluntary or mandatory by law (for some or all of the population).
[812] Dataset: “Out-of-Pocket Expenditure (% of Current Health Expenditure).” World Bank, January 30, 2022. Accessed November 29, 2022 at <data.worldbank.org>
Share of out-of-pocket payments of total current health expenditures. Out of pocket payments are spending on health directly out of pocket by households in each country. …
Statistical Concept and Methodology: The health expenditure estimates have been prepared by the World Health Organization under the framework of the System of Health Accounts 2011 (SHA 2011). The Health SHA 2011 tracks all health spending in a given country over a defined period of time regardless of the entity or institution that financed and managed that spending. It generates consistent and comprehensive data on health spending in a country, which in turn can contribute to evidence-based policy-making.
[813] Article: “General Practitioners’ and Out-of-Hours Doctors’ Role as Gatekeeper in Emergency Admissions to Somatic Hospitals in Norway: Registry-Based Observational Study.” By Jesper Blinkenberg and others. BMC Health Services Research, August 14, 2019. <doi.org>
GPs [general practitioners] are gatekeepers in many healthcare systems. Gatekeeping means that patients have to see a primary care provider who decides whether specialist care is necessary. Such referral regulates the access to specialty care, hospital care, or diagnostic tests. It is supposed to give better control over the healthcare costs and more targeted and efficient hospital healthcare.14 It has been found to lower utilization of healthcare services and expenditures.15
[814] Report: “Thinking About Rationing.” By Rudolf Klein and Jo Maybin. King’s Fund, 2012. <www.kingsfund.org.uk>
Pages 17–18:
GPs [general practitioners] vary widely in their clinical decisions and many of the factors that determine whether a patient is referred to hospital fall outside of narrowly conceived clinical concerns. … The result is the renewed emphasis by commissioners on attempting to control GP referrals by introducing referral guidelines and thresholds.
Such controls range from PCTs [primary care trusts] prescribing the criteria that GPs ought to consider when making a decision to imposing compulsory, quantified scores to test eligibility for referral. For example, the pre-operative Oxford Hip and Knee Scores are used as a tool for “grading” the degree of severity of someone’s joint problem, incorporating the results of diagnostic imaging with information on stability and mobility of the joint, and the nature and extent of the pain they are suffering; the resulting score determines whether a patient is eligible for a referral. A fifth of the 692 orthopaedic surgeons responding to a BBC [British Broadcasting Corporation] survey in spring 2011 reported that referral thresholds had been raised by their local PCT (Jeffries 2011).
Page 19:
Commissioners used a number of different criteria for limiting access to tonsillectomy. Common among them is a requirement about the number of episodes of the illness the patient must have suffered in recent years in order to be eligible…. Some commissioners require a period of six months “watchful waiting” before the referral; others do not. For some, severe halitosis that has been demonstrated to be tonsil-related is grounds for a referral; others make no mention of this. One commissioner’s policy required that the patient must have previously suffered from quinsy in order to be eligible for tonsillectomy.
[815] Report: “Health at a Glance 2017: OECD Indicators.” Organization for Economic Cooperation and Development, February 2018. <www.oecd-ilibrary.org>
Page 25: “Access to care is a critical measure of health system performance. Indicators presented here include population coverage … alongside indicators reflecting financial and timely access. … Population coverage, though, is not sufficient by itself. The degree of cost-sharing applied to those services also affects access to care. Out-of-pocket expenditures and consultations skipped due to cost are two indicators measuring financial access….”
Page 90:
Unmet needs due to cost is a particularly pressing problem, especially among lower-income groups. Consequently, an increasing number of countries collect data to measure the extent to which health care is foregone due to cost (Fujisawa and Klazinga, 2017). …
The OECD [Organization for Economic Cooperation and Development] collects data on unmet care needs due to cost reported by populations from national and international sources and a number of countries reporting these measures are increasing over time. These use questions that are similar to those asked in the Commonwealth Fund International Health Policy Survey. Rates for Figures 5.4 and 5.5 refer to both primary and secondary care and they are age-sex standardised to the 2010 OECD population structure, to remove the effect of different population structures across countries. Due to the change of data source for this indicator, data cannot be compared directly with those presented in the previous editions of Health at a Glance. The 2016 Commonwealth Fund’s International Health Policy Survey asks whether people did not visit a doctor when they had a medical problem, skipped a medical test, treatment, or follow-up that was recommended by a doctor, or did not fill prescription for medicines or skipped doses because of cost in the past year and as it also collects socio-economic background including income level, it allows analysis on unmet care needs by income group. This survey was carried out in 11 countries.
[816] Article: “National Poll on Healthy Aging.” University of Michigan, Institute for Healthcare Policy & Innovation. March 2018. <deepblue.lib.umich.edu>
Pages 1–2 (of PDF):
One in 6 older adults (17%) reported that in the last year, a health care provider recommended a medication, test, or procedure that they felt they did not need. … In all, 50% of those who had received a recommendation for a test they didn’t think they needed ended up getting it anyway….
This National Poll on Healthy Aging report presents findings from a nationally representative household survey conducted exclusively by GfK Custom Research, LLC (GfK), for the University of Michigan’s Institute for Healthcare Policy and Innovation. National Poll on Healthy Aging surveys are conducted using GfK’s KnowledgePanel®, the largest national, probability-based panel in the U.S. Surveys are fielded two to three times a year with a sample of approximately 2,000 KnowledgePanel® members age 50–80.
This survey was administered online in October 2017 to a randomly selected, stratified group of older adults age 50–80 (n=2,007). Respondents were selected from GfK’s web-enabled KnowledgePanel® which closely resembles the U.S. population. The sample was subsequently weighted to reflect population figures from the U.S. Census Bureau. The completion rate was 73% among panel members contacted to participate. The margin of error is ±1 to 2 percentage points for questions asked of the entire sample and higher among subgroups.
NOTE: For facts about what constitutes a scientific survey and the factors that impact their accuracy, visit Just Facts’ research on Deconstructing Polls & Surveys.
[817] Article: “How Unnecessary Tests, Scans, Procedures and Surgeries Are Affecting Your Patients.” By Liz Szabo. Kaiser Health News, October 23, 2017. <www.healthcarefinancenews.com>
Kathi Kolb, 63, was staring at 35 radiation treatments over seven weeks in 2008 for her early breast cancer. But she was determined to educate herself and find another option. …
Kolb asked her doctor about a 2008 Canadian study, which was later published in the influential New England Journal of Medicine, showing that three weeks of radiation was safe. He agreed to try it. …
A growing number of medical and consumer groups are working to educate patients, so they can become their own advocates.
The Choosing Wisely campaign, launched in 2012 by the American Board of Internal Medicine (ABIM) Foundation, aims to raise awareness about overtreatment. The effort, which has been joined by 80 medical societies, has listed 500 practices to avoid. …
Many doctors say they feel pressured to order unnecessary tests out of fear of being sued for doing too little. Others say patients demand the services. In surveys, some doctors blame overtreatment on financial incentives that reward physicians and hospitals for doing more.
[818] Webpage: “Health Care Quality Indicators – Responsiveness and Patient Experiences.” Organization for Economic Cooperation and Development. Accessed October 14, 2019 at <www.oecd.org>
The HCQI [Health Care Quality Indicators] project has identified measurement of patient experiences as a priority for indicator development and quality improvement.
To explore the possibilities for cross-national comparison of patient experiences, the OECD [Organization for Economic Cooperation and Development] commissioned the Norwegian Knowledge Centre for the Health Services to perform a review of the use of national and international surveys to measure patient experiences. Based on this review and the outcomes of further consultation with country experts, academics in the field and key international partners, the HCQI project developed a population-based survey, and undertook the cognitive testing of the questionnaire and a pilot data collection. Patient experience indicators have been collected for international reporting.
The following quality of care indicators, developed through the HCQI project, are currently considered suitable for international comparison:
• Waiting time of more than 4 weeks for getting appointment with a specialist
• Consultation skipped due to costs
• Medical tests, treatment or follow-up skipped due to costs
• Prescribed medicines skipped due to costs
• (Regular) doctor spending enough time with patients during the consultation
• (Regular) doctor providing easy-to-understand explanations
• (Regular) doctor giving opportunity to ask questions or raise concerns
• (Regular) doctor involving patients in decisions about care or treatment
The HCQI project continues to focus on learning and sharing developments on national systems for measuring and reporting patient experiences including Patient-Reported Outcome Measures (PROMs) and experiences with integrated care and safety and to improve quality of indicators for international reporting.
This work moves forward in collaboration with key organisations and country experts, including the Commonwealth Fund and the WHO [World Health Organization].
[819] Working paper: “Measuring Patient Experiences (PREMs): Progress Made by the OECD and Its Member Countries Between 2006 and 2016.” By Rie Fujisawa and Niek Klazinga. Organization for Economic Cooperation and Development, December 15, 2017. Updated 1/26/18. <www.oecd.org>
Pages 27–28:
The OECD [Organization for Economic Cooperation and Development] developed patient experience indicators related to access to health care, autonomy in care and treatment decisions and communication with physician during ambulatory care due to their relevance and importance across health systems (see Table 3.1 for the list of indicators and Annex G for indicator definitions). These indicators were developed based on the OECD-proposed set of questions as mentioned above which drew from existing patient experience measurements across countries and the pilot data collection and psychometric analyses which confirmed the validity of these data for international reporting. The set of indicators covers important aspects of patient-centred care which are common across health systems such as patient participation/involvement, good relationship between the patient and health professionals including clear and open communication, and the appropriate context in which care is delivered including access to care (Kitson and others, 2012). The domains of these OECD indicators, particularly communication and access to care, are considered to be important dimensions of health care quality (Mohammed and others, 2014).
Table 3.1. List of Indicators for HCQI [Health Care Quality Indicators] Data Collection 2016–17 … Medical tests, treatment or follow-up skipped due to costs …
… Since 2013, data for these indicators have been collected through OECD’s HCQI’s regular data collection, which takes place every two years. A number of countries reporting data collected through international or national surveys are increasing in recent years. Eleven countries (Australia, Canada, France, Germany, the Netherlands, New Zealand, Norway, Sweden, Switzerland, the United Kingdom, and the United States) collect data through the Commonwealth Fund’s International Health Policy Surveys every three years. Two countries (the Czech Republic and Luxembourg) collected data using the OECD-proposed set of questions as a stand-alone survey in 2010 and 2011, respectively. A number of other OECD countries also report data collected through national surveys and as of 2017, 22 countries report PREMs [patient-reported experience measures] collected either through national or international surveys to the OECD.
[820] Report: “Measuring What Matters: The Patient-Reported Indicator Surveys.” Organization for Economic Cooperation and Development and the European Union, August 2019. <www.oecd.org>
Pages 52–53:
Patient-Reported Experience Measures (PREMs)
Understanding a patient’s experience when he or she receives health care is integral to improving people-centred care. There has been an increased recognition of the importance of the patient’s perspective in providing quality health care. Capturing and reporting patient experience is an important part of the overall health system performance measurement efforts. Across countries, health service providers, administrators and policy-makers have indicated a desire and need for comparable patient-reported indicators to better understand and improve quality of health care service delivery and outcomes. Over the last decade, increased attention has been placed on measuring and improving the health care experience of patients. The number of countries measuring patient experience has been increasing over time. Almost all OECD countries have at least one national survey measuring PREMs. In almost all of the OECD countries with national data collection, PREMs have been collected through national population-based surveys, and/or surveys covering patients who have had a recent experience either in an outpatient or inpatient care setting.
Table 4.6. Patient-Reported Experience Measures (PREMs) Indicator Name
• Consultation skipped due to costs
• Medical tests, treatment or follow-up skipped due to costs
• Prescribed medicines skipped due to costs
• Waiting time of more than four weeks for getting an appointment with a specialist
• Patients reporting having spent enough time with any doctor during the consultation
• Patients reporting having spent enough time with their regular doctor during the consultation.
• Patients reporting having received easy-to-understand explanations by their regular doctor
• Patients reporting having had the opportunity to ask questions or raise concerns to any doctor
• Patients reporting having had the opportunity to ask questions or raise concerns to their regular doctor
• Patients reporting having been involved in decisions about care or treatment by any doctor
The OECD has been measuring patient experience indicators related to access to health care, autonomy in care and treatment decisions and communication with physician during ambulatory care due to their relevance and importance across health systems (see Figure 4.6 for the list of indicators). These indicators were based on the work of the Commonwealth Fund and other national and international PREMs surveys. The set of indicators covers important aspects of people-centred care which are common across health systems such as patient participation/involvement, good relationship between the patient and health professionals including clear and open communication, and the appropriate context in which care is delivered including access to care (Kitson and others, 201384). The domains of these OECD indicators, particularly communication and access to care, are considered to be important dimensions of health care quality (Mohammed and others, 201685).
[821] Dataset: “Health Care Quality Indicators: Medical Tests, Treatment, or Follow-Up Skipped Due to Costs, Age-Sex Standardized Rate Per 100 Patients, 16 Years and Over.” Organization for Economic Cooperation and Development. Last updated June 2021. Accessed October 12, 2021 at <stats.oecd.org>
NOTE: An Excel file containing the data is available upon request.
[822] Webpage: “Definitions for Health Care Quality Indicators.” Organization for Economic Cooperation and Development, 2016. <www.oecd.org>
Page 46:
Medical Tests, Treatment or Follow-Up Skipped Due to Costs …
Coverage: Survey respondents aged 16 and over (4 age groups (16–24, 25–44, 45–65 and 65+) and 16+) who answered the specific question.
Crude rate (weighted) is calculated based on the following definitions:
• Numerator: Number of survey respondents among denominator cases who answered having skipped a medical test, treatment (excluding medicines), or other follow-up that was recommended by a health professional (for example, doctor, nurse or allied health professional) because of costs (i.e., actual out-of-pocket payments for services).
• Denominator: Number of survey respondents who answered “Yes” or “No” to a survey question on whether recommended medical tests, treatment or follow-up was skipped due to costs in the reference year.
[823] Textbook: Handbook of Health Economics (Volume 1B). Edited by Anthony J. Cuyler and Joseph P. Newhouse. Elsevier, 2000.
Chapter 27: “Antitrust and Competition in Health Care Markets.” By Martin Gaynor and William B. Vogt. Pages 1405–1478.
Pages 1413–1414:
One of the most important imperfections in health care markets is the moral hazard effect on consumption due to health insurance [Arrow (1963), Pauly (1968), Zeckhauser (1970)]. The vast bulk of health care bought and sold is covered by insurance. This means that the consumer of the service himself pays only a small fraction of the cost, while the majority is reimbursed by third-party payers. Insuring individuals against risk reduces the price they face for medical care, thereby inducing excessive consumption. …
Another form of moral hazard is the decreased incentive for consumers to search for the lowest price [Newhouse (1978)]. In general, however, insurance may lead consumers to search less, or more, in equilibrium [Dionne (1984)].23 The presence of insurance will tend to lead to greater dispersion in prices. It is possible that consumers may search more because the increased dispersion in the price distribution means that there is a bigger potential payoff to search, since the expected gap between the current price and the lowest price is larger. On the other hand, since consumers pay only a small fraction of the expense, the payoff to search may still not exceed the costs. The emergence of highly price responsive buyers of health care in the form of managed care plans can be thought of as an institutional innovation in response to this problem.
[824] Article: “Interactions Between Public and Private Providers.” By C. Goulao and J. Perelman. Encyclopedia of Health Economics (Volume 2). Edited by Anthony J. Culyer. Elsevier, 2014. Pages 72–83.
Page 78:
Moral hazard occurs when an individual facing risk changes one’s behavior depending on whether or not one is insured. For example, dental care insurance may lead individuals to be less cautious about their mouth hygiene, which may be reflected in a higher probability of caries (ex ante moral hazard). Or, in case a tooth is removed individuals may decide toward a dental implant only in case they are insured (ex post moral hazard).
To induce individuals to exert some effort in the limitation of damages (ex ante moral hazard) or to restrain medical care use (ex post moral hazard), insurance contracts typically impose the individual part of the incurred cost by making use of deductibles and/or coinsurance rates. This means that the consequence of moral hazard is partial insurance (incomplete coverage), just as in the case of adverse selection.
Because moral hazard consists of a reaction to insurance, it is present under an NHS [national health system] just as in the private market, for the same level of insurance coverage. Still, the two sectors deal with moral hazard in very different ways. The NHS deals with it by rationing health care, for example, through waiting lists, gatekeeping, and limiting individuals’ choices. Actually delayed access to health care is a sort of limited insurance coverage and can thus give incentives to prevention and consequent limitation of damages (ex ante moral hazard) or restrain individual use of medical care (ex post moral hazard). Similarly, in the private market, individuals are typically not fully insured (due to deductibles and coinsurance rates) and the same mechanism applies. The extent to which each sector is affected by moral hazard depends on the importance of incomplete coverage of each sector. …
To conclude concerning the presence of moral hazard: it is essential to test whether insurance contracts offering more coverage are associated with greater use of health care. Note that even though very different in their causes adverse selection and moral hazard lead exactly to the same observed market effect: Insurance contracts with less coverage are associated to individuals using less health care.
[825] Paper: “Some Interim Results From a Controlled Trial of Cost Sharing.” By Joseph P. Newhouse and others. Rand, January 1982. <www.rand.org>
Page iii: “[T]he first regular sample [of study participants] was enrolled in late 1974. Most participants have now completed their period of participation, and all will complete it by January 1982.”
Page v:
A total of 7706 participants in six cities have taken part in a controlled experiment related to cost sharing in health insurance policies. …
The families were assigned in an unbiased manner to insurance plans that covered a broad range of medical services but varied the coinsurance rate, i.e., the fraction of its medical bills that the family must pay. This out-of-pocket expenditure was subject to an upper limit of $1000 per year or 5, 10, or 15% of income, whichever was less. …
Expenditure per person responds to variation in cost sharing. It is about 50 percent greater in the plan with no cost sharing [100% coverage] than in the one with 95-percent coinsurance [5% coverage] up to a maximum of $1000 in any one year. …
As cost sharing declines, the percentage of individuals seeking care rises, as does the number of ambulatory [outpatient] visits per user. The number of adults hospitalized increases, but the number of children hospitalized shows no systematic relationship to plan. Cost per person hospitalized does not appear to be related to plan.
Pages v–vi: “The implications of these findings are that: 1) Cost sharing unambiguously reduces expenditure; it is not ‘penny-wise and pound-foolish’ (with respect to expenditure) as some have argued.”
Page 4:
A total of 2756 families, consisting of 7706 persons, have been enrolled in one of several different health insurance plans, 70 percent of them for 3 years and the rest for 5 years. … Families were excluded in which heads were eligible for Medicare at the beginning of the study (or who would become so by virtue of age before the end of the study). Hence, our results do not necessarily apply to the aged population.
Pages 12, 15:
Per capita total expenditure (inpatient plus ambulatory [outpatient], excluding dental and outpatient mental health services) rises steadily as coinsurance falls (Table 3). Expenditure per person in the plan with no coinsurance (the most generous plan) is about 60-percent greater than in the plan with 95-percent coinsurance [5% coverage]….
Although the simple arithmetic mean provides acceptable precision for analyzing ambulatory expenditure, it does not do so for plan-related differences in total expenditure…. This lack of precision occurs because a few large medical expenditures account for a substantial portion of all expenditures on a given plan and can therefore affect the average quite dramatically….
Application of techniques better suited to such data yields a somewhat different, but probably more reliable, estimate of what per person expenditure would be if a larger number of families had been enrolled. … Averaged across all sites, predicted expenditure per person in the 95-percent coinsurance plan is 69 percent of that in the free care plan; in other words, free care causes expenditures to increase by nearly 50 percent (Table 5). … In some site-years, the predicted expenditure for the 50-percent coinsurance plan was smaller than that of the 95-percent coinsurance plan, but the difference is statistically insignificant. This misordering appears to be attributable to the sampling error, given the relatively few participants enrolled in the 50-percent coinsurance plan.
Page 13: “Table 3—Actual Annual Total and Ambulatory Expenditure Per Person, By Plan: Nine Site-Years”
|
Plan |
Total Expenditure† |
Free Plan $ Increase |
|
Free Care |
$401 (±52) |
0% |
|
75% Coverage |
$346 (±58) |
16% |
|
50% Coverage |
$328 (±149) |
22% |
|
5% Coverage |
$254 (±37) |
58% |
|
† 95-percent confidence intervals are shown in parentheses. NOTE: Just Facts has extracted, simplified, and systematized data from this table to make it more understandable. |
||
Page 16: “Table 5—Predicted Total Expenditure Per Person, By Plan, Site, and Year”
|
Plan |
Total Expenditure |
Free Plan $ Increase |
|
Free Care |
$430 |
0% |
|
75% Coverage |
$348 |
24% |
|
50% Coverage |
$288 |
49% |
|
5% Coverage |
$297 |
45% |
|
NOTE: Just Facts has extracted, simplified, and systematized data from this table to make it more understandable. |
||
Page 23:
Our results clearly show that the use of medical services responds to cost sharing; demand in an insurance plan with full coverage appears to be about 50 percent above that in an income-related catastrophe insurance plan [i.e., 5% coverage]. The fragmentary evidence now in the literature is roughly consistent with this value; for example, the 25-percent decline in visits observed in a natural experiment among Stanford University employees when their coinsurance rate was changed from zero to 25 percent … is similar to the 20-percent decline in ambulatory expenditures between the zero and 25-percent coinsurance plans (Table 3).
[826] Book: Free for All? Lessons from the Rand Health Insurance Experiment. By Joseph P. Newhouse and the Insurance Experiment Group. Harvard University Press, 1993.
Pages 339–340:
The reduced service use under the cost-sharing plans had little or no net adverse effect on health for the average person (Chapters 6 and 7). Indeed, restricted activity days fell with more cost sharing.
Health among the sick poor—approximately the most disadvantaged 6 percent of population—was adversely affected, however. In particular, the poor who began the Experiment with elevated blood pressure had their blood pressure lowered more on the free plan than on the cost-sharing plans. The effect on predicted mortality rates—a fall of about 10 percent—was substantial for this group. In addition, free care marginally improved both near and far corrected vision, primarily among the poor, and increased the likelihood that a decayed tooth would be filled—an effect found disproportionately among the less well educated. Health of gums was marginally better for those with free care. And serious symptoms were less prevalent on the free plan, especially for those who began the experiment poor and with serious symptoms. Finally, there appeared to be a beneficial effect on anemia for poor children. Although sample sizes made it impossible to detect any beneficial effects that free care might have had on relatively rare conditions, it is highly improbable that there were beneficial effects (one standard error of the mean changes) that we failed to detect in the physiologic measures of health taken as a group. Moreover, the confidence intervals are tight enough to rule out any beneficial effect of free care on the General Health Index, our best summary measure of health.
[827] Article: “Medicaid Increases Emergency-Department Use: Evidence from Oregon’s Health Insurance Experiment.” By Amy N. Finkelstein, Sarah L. Taubman, and others. Science, January 2, 2014. Pages 263–268. <www.science.org>
Page 263:
In 2008, Oregon initiated a limited expansion of a Medicaid program for uninsured, low-income adults, drawing names from a waiting list by lottery. This lottery created a rare opportunity to study the effects of Medicaid coverage using a randomized controlled design. Using the randomization provided by the lottery and emergency-department records from Portland-area hospitals, we study the emergency-department use of about 25,000 lottery participants over approximately 18 months after the lottery. We find that Medicaid coverage significantly increases overall emergency use by 0.41 visits per person, or 40 percent relative to an average of 1.02 visits per person in the control group. We find increases in emergency-department visits across a broad range of types of visits, conditions, and subgroups, including increases in visits for conditions that may be most readily treatable in primary care settings. …
In 2008, Oregon initiated a limited expansion of its Medicaid program for low-income adults, drawing about 30,000 names by lottery from a waiting list of almost 90,000 individuals. Those selected were enrolled in Medicaid if they completed the application and met eligibility requirements. … The lottery allowed us to isolate the causal effect of insurance on emergency-department visits and care; random assignment through the lottery can be used to study the impact of insurance without the problem of confounding factors that might otherwise differ between insured and uninsured populations.
[828] “2008 Oregon Population Report.” By Risa S. Proehl. Portland State University, Population Research Center, March 2009. <www.pdx.edu>
Page 6: “Table 2. Population Estimates of Oregon by Area Type and Specific Metropolitan Areas: 2000 to 2008 … Metropolitan Areas … July 1, 2008 … Portland-Vancouver-Beaverton [=] 2,191,785 … [the next highest is] Eugene-Springfield [=] 345,880.”
[829] Article: “Interactions Between Public and Private Providers.” By C. Goulao and J. Perelman. Encyclopedia of Health Economics (Volume 2). Edited by Anthony J. Culyer. Elsevier, 2014. Pages 72–83.
Page 78:
Because moral hazard consists of a reaction to insurance, it is present under an NHS [national health system] just as in the private market, for the same level of insurance coverage. Still, the two sectors deal with moral hazard in very different ways. The NHS deals with it by rationing health care, for example, through waiting lists, gatekeeping, and limiting individuals’ choices. Actually delayed access to health care is a sort of limited insurance coverage and can thus give incentives to prevention and consequent limitation of damages (ex ante moral hazard) or restrain individual use of medical care (ex post moral hazard). Similarly, in the private market, individuals are typically not fully insured (due to deductibles and coinsurance rates) and the same mechanism applies. The extent to which each sector is affected by moral hazard depends on the importance of incomplete coverage of each sector.
Page 79: “Confirming the seminal results of the Rand experiment, some U.K. studies have consistently confirmed a decrease in drug consumption which follows an increase in the copayment, supporting the evidence of ex post moral hazard.”
[830] Webpage: “Types of Health Care Quality Measures.” Department of Health & Human Services, Agency for Healthcare Research and Quality, February 2015. <www.ahrq.gov>
Measures used to assess and compare the quality of health care organizations are classified as either a structure, process, or outcome measure. …
Outcome Measures
Outcome measures reflect the impact of the health care service or intervention on the health status of patients. For example:
• The percentage of patients who died as a result of surgery (surgical mortality rates).
• The rate of surgical complications or hospital-acquired infections.
Outcome measures may seem to represent the “gold standard” in measuring quality, but an outcome is the result of numerous factors, many beyond providers’ control. Risk-adjustment methods—mathematical models that correct for differing characteristics within a population, such as patient health status—can help account for these factors. However, the science of risk adjustment is still evolving. Experts acknowledge that better risk-adjustment methods are needed to minimize the reporting of misleading or even inaccurate information about health care quality.
[831] Report: “Beyond Health Care: The Role of Social Determinants in Promoting Health and Health Equity.” By Samantha Artiga and Elizabeth Hinton. Kaiser Family Foundation, May 10, 2018. <files.kff.org>
Page 1: “Though health care is essential to health, it is a relatively weak health determinant.3 Research shows that health outcomes are driven by an array of factors, including underlying genetics, health behaviors, social and environmental factors, and health care.”
[832] Report: “Health at a Glance 2015: OECD Indicators.” Organization for Economic Cooperation and Development, 2015. <www.oecd-ilibrary.org>
Page 150: “Cancer survival is one of the key measures of the effectiveness of cancer care systems, taking into account both early detection of the disease and the effectiveness of treatment.”
[833] Report: “Health at a Glance 2021: OECD Indicators.” Organization for Economic Cooperation and Development, November 5, 2021. <www.oecd-ilibrary.org>
Page 92: “Earlier diagnosis and treatment significantly increase cancer survival rates. This partly explains why, for example, Australia and New Zealand have below-average mortality rates despite having the highest rates of cancer incidence.”
[834] Calculated with data from:
a) Dataset: “Health Care Quality Indicators: Breast Cancer Five Year Net Survival, Age-Standardized Survival (%), 15 Years Old and Over, Female, 2010–2014.” Organization for Economic Cooperation and Development. Last updated November 10, 2017. Accessed October 29, 2019 at <stats.oecd.org>
b) Dataset: “Health Care Quality Indicators: Cervical Cancer Five Year Net Survival, Age-Standardized Survival (%), 15 Years Old and Over, 2010–2014.” Organization for Economic Cooperation and Development. Last updated November 10, 2017. Accessed October 29, 2019 at <stats.oecd.org>
c) Dataset: “Health Care Quality Indicators: Colon Cancer Five Year Net Survival, Age-Standardized Survival (%), 15 Years Old and Over, 2010–2014.” Organization for Economic Cooperation and Development. Last updated November 10, 2017. Accessed October 29, 2019 at <stats.oecd.org>
d) Dataset: “Health Care Quality Indicators: Rectal Cancer Five Year Net Survival, Age-Standardized Survival (%), 15 Years Old and Over, 2010–2014.” Organization for Economic Cooperation and Development. Last updated November 10, 2017. Accessed October 29, 2019 at <stats.oecd.org>
NOTE: An Excel file containing the data and calculations is available upon request.
[835] Webpage: “Definitions for Health Care Quality Indicators.” Organization for Economic Cooperation and Development, 2016. <www.oecd.org>
Five-year net survival is the cumulative probability that cancer patients survive their cancer for at least 5 years, after controlling for the risks of death from other causes. Net survival is expressed as a percentage. … For patients diagnosed during 2010–2014, the period approach is used, which allows estimation of five-year survival, though 5 years of follow-up are not available for all patients. Cancer survival estimates are age-standardised with the International Cancer Survival Standard (ICSS) weights.
[836] Report: “Health at a Glance 2015: OECD Indicators.” Organization for Economic Cooperation and Development, 2015. <www.oecd-ilibrary.org>
Page 138: “A good indicator of acute care quality is the 30-day AMI [acute myocardial infarction]† case-fatality rate. This measure reflects the processes of care, such as timely transport of patients and effective medical interventions. The indicator is influenced by not only the quality of care provided in hospitals but also differences in hospital transfers, average length of stay and AMI severity.”
NOTE: † An acute myocardial infarction is a heart attack. [Entry: “acute myocardial infarction.” Merriam-Webster Dictionary. Accessed November 3, 2019 at <www.merriam-webster.com>]
[837] Report: “Health at a Glance 2021: OECD Indicators.” Organization for Economic Cooperation and Development, November 5, 2021. <www.oecd-ilibrary.org>
Page 164: “Metrics of 30‐day mortality after AMI [heart attack] hospital admission are reflective of processes of care, such as timely transport of patients and effective medical interventions. However, the indicator is influenced not only by the quality of care provided in hospitals but also by differences in the patterns of hospital transfers, length of stay and AMI severity across countries.”
[838] Calculated with the dataset: “Health Care Quality Indicators: Thirty-Day Mortality After Admission to Hospital for AMI [Acute Myocardial Infarction] Based on Linked Data, Age-Sex Standardized Rate Per 100 Patients, 45 Years Old and Over.” Organization for Economic Cooperation and Development. Last updated June 2021. Accessed December 16, 2021 at <stats.oecd.org>
NOTE: An Excel file containing the data and calculations is available upon request.
[839] Report: “Health at a Glance 2015: OECD Indicators.” Organization for Economic Cooperation and Development, 2015. <www.oecd-ilibrary.org>
Page 19:
Health Status
The broad measures of population health status shown in Table 1.1, such as life expectancy at various ages, are not only related to health spending and the performance of health systems, but also to a wide range of non-medical determinants of health (with some of the lifestyle and behavioural factors presented in Table 1.2).
[840] Report: “Beyond Health Care: The Role of Social Determinants in Promoting Health and Health Equity.” By Samantha Artiga and Elizabeth Hinton. Kaiser Family Foundation, May 10, 2018. <files.kff.org>
Page 1: “Though health care is essential to health, it is a relatively weak health determinant.3 Research shows that health outcomes are driven by an array of factors, including underlying genetics, health behaviors, social and environmental factors, and health care.”
[841] Article: “We Can Do Better—Improving the Health of the American People.” By Steven A. Schroeder. New England Journal of Medicine, September 20, 2007. <www.nejm.org>
Health is influenced by factors in five domains—genetics, social circumstances, environmental exposures, behavioral patterns, and health care (Figure 1).10,11 When it comes to reducing early deaths, medical care has a relatively minor role. Even if the entire U.S. population had access to excellent medical care—which it does not—only a small fraction of these deaths could be prevented. The single greatest opportunity to improve health and reduce premature deaths lies in personal behavior. In fact, behavioral causes account for nearly 40% of all deaths in the United States.12 Although there has been disagreement over the actual number of deaths that can be attributed to obesity and physical inactivity combined, it is clear that this pair of factors and smoking are the top two behavioral causes of premature death (Figure 2).12 …
Environmental factors, such as lead paint, polluted air and water, dangerous neighborhoods, and the lack of outlets for physical activity, also contribute to premature death. People with lower socioeconomic status have greater exposure to these health-compromising conditions. As with social determinants of health and health insurance coverage, remedies for environmental risk factors lie predominantly in the political arena.44
[842] Article: “The Case for More Active Policy Attention to Health Promotion.” By J. Michael McGinnis, Pamela Williams-Russo, and James R. Knickman. Health Affairs, March/April 2002. Pages 78–93. <www.healthaffairs.org>
Pages 79–81:
Drawing on the power of the extensive studies of the past generation, we can now speak about our health prospects as being shaped by our experiences in five domains: genetic and gestational endowments, social circumstances, environmental conditions, behavioral choices, and medical care.8
Genetics. Our predispositions to health or disease begin to take form at the moment of conception, embedded in our genetic blueprint for construction of the proteins that give form … even to the biologic limit of our life expectancies. …
Although only about 2 percent of deaths in the United States may be attributed to purely genetic diseases, perhaps 60 percent of late-onset disorders—such as diabetes, cardiovascular disease, and cancer—have some genetic component.10 …
Social circumstances. … Health is powerfully influenced by education, employment, income disparities, poverty, housing, crime, and social cohesion. …
For the population as a whole, the most consistent predictor of the likelihood of death in any given year is level of education; persons aged 45–64 in the highest levels of education have death rates 2.5 times lower than those of persons in the lowest level.16 Poverty, another strong influence, has been estimated to account for 6 percent of U.S. mortality.17
Page 83: “Over the course of the twentieth century, about five of the thirty years of increased life expectancy could be attributable to better medical care.31”
[843] “Health at a Glance 2021: OECD Indicators.” Organization for Economic Cooperation and Development, November 5, 2021. <www.oecd-ilibrary.org>
Page 24: “Smoking, alcohol consumption and obesity are the three major individual risk factors for non-communicable diseases, contributing to a large share of worldwide deaths. Air pollution is also a critical environmental determinant of health.”
[844] Paper: “Health Care Spending in the United States and Other High-Income Countries.” By Irene Papanicolas, Liana Woskie, and Ashish K. Jha. Journal of the American Medical Association, March 13, 2018. Pages 1024–1039. <jamanetwork.com>
Pages 1037–1038:
The United States has relatively poor population health outcomes, which likely represents a combination of factors including issues with the affordability of care. However, the United States average, in comparison to averages of smaller, more homogenous countries, may lead to erroneous conclusions. For example, the life expectancy of Minnesota, a state comparable in size and demographics to Sweden or Denmark, has more similar population health outcomes to these countries than Minnesota has in comparison to Mississippi.
NOTE: See the next footnote comparing the life expectancy, population size, and demographics of Mississippi, Minnesota, and Denmark.
[845]
|
Geography |
Life Expectancy |
Population |
Majority Demographic |
|
Mississippi |
72 |
3.0 million |
White (56%) |
|
Minnesota |
79 |
5.6 million |
White (82%) |
|
Denmark |
81 |
5.8 million |
Danish (86%) |
Table constructed with data from:
a) Report: “U.S. State Life Tables, 2020.” By Elizabeth Arias and others. U.S. Centers for Disease Control and Prevention, National Center for Health Statistics, August 23, 2022. <www.cdc.gov>
Page 3: “Table A. Life expectancy at birth, rank, and standard error, by sex: Each state, the District of Columbia, and United States, 2020 … Minnesota [=] 79.1 … Mississippi [=] 71.9”
b) Dataset: “2020 American Community Survey 5-Year Estimates Data Profiles: Demographic and Housing Estimates.” U.S. Census Bureau. Accessed November 30, 2022 at <data.census.gov>
“Total population … Minnesota [=] 5,600,166 … Mississippi [=] 2,949,965 … White … Minnesota [=] 81.6% … Mississippi [=] 56.1%
c) Dataset: “Population, Total.” World Bank, September 16, 2022. Accessed November 30, 2022 at <data.worldbank.org>
“Denmark … 2020 [=] 5,831,404”
d) Dataset: “Life Expectancy at Birth, Total (Years).” World Bank, September 16, 2022. Accessed November 30, 2022 at <data.worldbank.org>
“2020 … Denmark [=] 81.4512195121951”
e) Webpage: “Denmark.” World Factbook, U.S. Central Intelligence Agency. Last updated November 15, 2022. <www.cia.gov>
“Ethnic groups: Danish (includes Greenlandic (who are predominantly Inuit) and Faroese) 85.6%, Turkish 1.1%, other 13.3% (largest groups are Polish, Syrian, Romanian, German, and Iraqi) (2022 est.)”
[846] “WHO Director-General’s Opening Remarks at the Media Briefing on Covid-19.” World Health Organization, March 11, 2020. <bit.ly>
[Dr. Tedros Adhanom Ghebreyesus:] …
WHO [World Health Organization] has been assessing this outbreak around the clock and we are deeply concerned both by the alarming levels of spread and severity, and by the alarming levels of inaction.
We have therefore made the assessment that COVID-19 can be characterized as a pandemic.
[847] Calculated with the dataset: “Life Expectancy at Birth, Total (Years).” World Bank, November 23, 2021. Accessed December 17, 2021 at <data.worldbank.org>
Life expectancy at birth indicates the number of years a newborn infant would live if prevailing patterns of mortality at the time of its birth were to stay the same throughout its life. …
Aggregation Method: Weighted average
Development Relevance: Mortality rates for different age groups (infants, children, and adults) and overall mortality indicators (life expectancy at birth or survival to a given age) are important indicators of health status in a country. Because data on the incidence and prevalence of diseases are frequently unavailable, mortality rates are often used to identify vulnerable populations. And they are among the indicators most frequently used to compare socioeconomic development across countries.
Limitations and Exceptions: Annual data series from United Nations Population Division’s World Population Prospects are interpolated data from 5-year period data. Therefore they may not reflect real events as much as observed data. …
Statistical Concept and Methodology: Life expectancy at birth used here is the average number of years a newborn is expected to live if mortality patterns at the time of its birth remain constant in the future. It reflects the overall mortality level of a population, and summarizes the mortality pattern that prevails across all age groups in a given year. It is calculated in a period life table which provides a snapshot of a population’s mortality pattern at a given time. It therefore does not reflect the mortality pattern that a person actually experiences during his/her life, which can be calculated in a cohort life table. High mortality in young age groups significantly lowers the life expectancy at birth. But if a person survives his/her childhood of high mortality, he/she may live much longer. For example, in a population with a life expectancy at birth of 50, there may be few people dying at age 50. The life expectancy at birth may be low due to the high childhood mortality so that once a person survives his/her childhood, he/she may live much longer than 50 years.
NOTE: An Excel file containing the data and calculations is available upon request.
[848] “Global Status Report on Noncommunicable Diseases: 2010.” World Health Organization, 2011. <www.who.int>
Page 16: “[C]ommon, preventable risk factors underlie most NCDs [non-communicable diseases]. Most NCDs are strongly associated and causally linked with four particular behaviours: tobacco use, physical inactivity, unhealthy diet and the harmful use of alcohol.”
[849] “Health at a Glance 2021: OECD Indicators.” Organization for Economic Cooperation and Development, November 5, 2021. <www.oecd-ilibrary.org>
Page 24: “Smoking, alcohol consumption and obesity are the three major individual risk factors for non-communicable diseases, contributing to a large share of worldwide deaths.”
[850] Calculated with the dataset: “Daily Smokers, Total, % of Population Aged 15+.” Organization for Economic Cooperation and Development. Accessed November 30, 2022 at <data.oecd.org>
Daily smokers are defined as the population aged 15 years and over who are reporting to smoke every day. Smoking is a major risk factor for at least two of the leading causes of premature mortality—circulatory disease and cancer, increasing the risk of heart attack, stroke, lung cancer, and cancers of the larynx and mouth. In addition, smoking is an important contributing factor for respiratory diseases. This indicator is presented as a total and per gender and is measured as a percentage of the population considered (total, men or women) aged 15 years and over.
NOTE: An Excel file containing the data and calculations is available upon request.
[851] Calculated with the dataset: “Prevalence of Insufficient Physical Activity Among Adults Aged 18+ Years (Age-Standardized Estimate) (%).” World Health Organization Global Health Observatory. Last updated November 5, 2018. Accessed December 13, 2021 at <www.who.int>
Definition:
Percent of defined population attaining less than 150 minutes of moderate-intensity physical activity per week, or less than 75 minutes of vigorous-intensity physical activity per week, or equivalent. …
Method of Estimation:
The estimates are based on self-reported physical activity captured using the GPAQ (Global Physical Activity Questionnaire), the IPAQ (International Physical Activity Questionnaire) or a similar questionnaire covering activity at work/in the household, for transport, and during leisure time. Where necessary, adjustments were made for the reported definition (in case it was different to the indicator definition), for known over-reporting of activity of the IPAQ, for survey coverage (in case a survey only covered urban areas), and for age coverage (in case the survey age range was narrower than 18+ years). No estimates were produced for countries with no data.
NOTE: An Excel file containing the data and calculations is available upon request.
[852] Calculated with the dataset: “Overweight or Obese Population (Measured, % of Population Aged 15+).” Organization for Economic Cooperation and Development. Accessed November 30, 2022 at <data.oecd.org>
The overweight or obese population is defined as the inhabitants with excessive weight presenting health risks because of the high proportion of body fat. The most frequently used measure is based on the body mass index (BMI), which is a single number that evaluates an individual’s weight in relation to height (weight/height², with weight in kilograms and height in metres). Based on the WHO [World Health Organization] classification, adults with a BMI from 25 to 30 are defined as overweight, and those with a BMI of 30 or over as obese. This indicator is presented … for … “measured” data (precise estimates of height and weight from health examinations) and is measured as a percentage of the population aged 15 years and older.
NOTE: An Excel file containing the data and calculations is available upon request.
[853] Calculated with the dataset: “Alcohol Consumption, Total, Litres/Capita (Aged 15 and Over).” Organization for Economic Cooperation and Development. Accessed November 30, 2022 at <data.oecd.org>
Alcohol consumption is defined as annual sales of pure alcohol in litres per person aged 15 years and older. Alcohol use is associated with numerous harmful health and social consequences, including an increased risk of a range of cancers, stroke and liver cirrhosis. Alcohol also contributes to death and disability through accidents and injuries, assault, violence, homicide and suicide. This indicator is measured in litres per capita (people aged 15 years and older).
NOTE: An Excel file containing the data and calculations is available upon request.
[854] Calculated with the dataset: “Health Status: Causes of Mortality, External Causes of Mortality (Deaths Per 100,000 Population, Standardized Rates).” Organization for Economic Cooperation and Development. Last updated July 4, 2022. Accessed November 30, 2022 at <stats.oecd.org>
NOTES:
[855] Report: “The U.S. Infant Mortality Rate: International Comparisons, Underlying Factors, and Federal Programs.” By Elayne J. Heisler. Congressional Research Service, April 4, 2012. <fas.org>
Page 6:
Some suggest that international IMR [infant mortality rate] differences, and the higher U.S. IMR, are caused by inconsistent recording of live births, because this is the only component of the IMR with international variation.20 These analysts suggest that some countries record very small infants who die or infants who do not survive the first 24 hours as stillbirths, while other countries record these events as live births and include these deaths in the IMR.21 To minimize recording differences and create comparable international infant mortality data, the United States and most developed countries have agreed to use the World Health Organization (WHO) definition of live births:
Live birth is the complete expulsion or extraction from its mother of a product of conception, irrespective of the duration of the pregnancy, which, after such separation, breathes or shows any other evidence of life—for example, a beating of the heart, pulsation of the umbilical cord or definite movement of voluntary muscles—whether or not the umbilical cord has been cut or the placenta is attached. Each product of such a birth is considered liveborn.22
Despite the use of the WHO definition, there is still some variation in the recording of live births among some European countries (see Table 3). Although 12 European countries record all live births,23 other countries use weight, gestational age, or both in their definition of a live birth. For example, the Czech Republic records live births as infants born above 500 grams (1 pound and 1.63 ounces) or an infant at any birthweight that survives the first 24 hours.24
[856] Article: “International Infant Mortality Rankings: A Look Behind the Numbers.” By Korbin Liu and others. Health Care Financing Review, 1992. Pages 105–118. <www.ncbi.nlm.nih.gov>
Pages 107–108:
In making international comparisons, an important reason for examining measures other than the IMR [infant mortality rate] is that variations across countries in the registration of vital events may affect the overall rate. Because the number of deaths is always very small as a proportion of births, small differences in the way that deaths are measured can have particularly strong effects on the rates. Variations in the registration of live births indirectly affect the recording of infant deaths as well as live births; an infant death to be recorded as such, the infant must have been registered as a live birth. Death shortly after birth constitutes one reason an infant may not have been registered. …
Besides the differences across countries that may be associated with how recorded events are classified, additional differences may exist in whether pregnancy outcomes are recorded at all. Fetal deaths occurring before the officially recommended gestational age of 28 weeks may not be recorded as any type of pregnancy outcome.
[857] Article: “Why American Infant Mortality Rates Are So High.” Texas A&M University, October 13, 2016. <www.sciencedaily.com>
The first nuance is one of definition. Infant mortality is defined as the death of babies under the age of one year, but some of the differences between countries can be explained by a difference in how we count. Is a baby born weighing less than a pound and after only 21 weeks’ gestation actually “born?” In some countries, the answer is no, and those births would be counted as stillbirths. In the United States, on the other hand, despite these premature babies’ relatively low odds of survival, they would be considered born—thus counting toward the country’s infant mortality rates.
[858] Calculated with the dataset: “Health Status: Maternal and Infant Mortality, Infant Mortality, Minimum Threshold of 22 Weeks (or 500 Grams Birthweight), Deaths Per 1,000 Live Births.” Organization for Economic Cooperation and Development. Last updated November 9, 2021. Accessed December 20, 2021 at <stats.oecd.org>
NOTE: An Excel file containing the data and calculations is available upon request.
[859] Report: “Health at a Glance 2021: OECD Indicators.” Organization for Economic Cooperation and Development, November 5, 2021. <www.oecd-ilibrary.org>
Page 96:
The infant mortality rate is the number of deaths of children under one year of age per 1,000 live births. Some of the international variation in infant mortality rates may be due to variations in registering practices for very premature infants. While some countries register all live births including very small babies with low odds of survival, several countries apply a minimum threshold of a gestation period of 22 weeks (or a birthweight threshold of 500g) for babies to be registered as live births (Euro-Peristat Project, 201818). To remove this data comparability limitation, data presented in this section are based on a minimum threshold of 22 weeks’ gestation (or 500g birthweight) for a majority of OECD [Organization for Economic Cooperation and Development] countries that have provided these data. However, data for ten countries (Australia, Canada, Greece, Ireland, Italy, Lithuania, Luxembourg, Mexico, Norway and Portugal) continue to be based on all registered live births (with no minimum threshold of gestation period or birthweight), resulting in potential overestimation.
[860] Report: “The U.S. Infant Mortality Rate: International Comparisons, Underlying Factors, and Federal Programs.” By Elayne J. Heisler. Congressional Research Service, April 4, 2012. <fas.org>
Page 2: “Interventions that seek to improve the IMR [infant mortality rate] often do so by attempting to lower a particular cause of infant death. However, some causes of death, such as congenital malformations, the leading cause of U.S. infant death in 20089 may be less amenable to policy intervention.10”
[861] Report: “The U.S. Infant Mortality Rate: International Comparisons, Underlying Factors, and Federal Programs.” By Elayne J. Heisler. Congressional Research Service, April 4, 2012. <fas.org>
Page 3: “Sudden Infant Death Syndrome (SIDS) was the third-most frequent cause of death, accounting for 8.4% (2,353 deaths) of infant deaths [in 2008].”
[862] Report: “2017 Massachusetts State Health Assessment.” Massachusetts Department of Public Health, October 2017. <www.mass.gov>
Page 55:
Unsafe infant sleep practices, including placing infants to sleep on their stomachs or sides or in places other than cribs/bassinets/play yards—such as adult beds, baby slings, car seats, couches or armchairs—are known modifiable risk factors for SUID [sudden unexpected infant death].71 Preterm birth is also a risk factor72 along with prenatal and secondhand smoke exposure,73 low access to prenatal care,74 prenatal substance use,75 soft bedding,76 parental alcohol use,77 and overheating.78 In addition to supine sleep position, firm sleep surface, and separate sleep space, known protective factors for SUID include breastfeeding,79 pacifier use,80 and parental exposure to educational interventions.81
[863] Report: “The U.S. Infant Mortality Rate: International Comparisons, Underlying Factors, and Federal Programs.” By Elayne J. Heisler. Congressional Research Service, April 4, 2012. <fas.org>
Page 16:
The changing age composition of women giving birth may increase the average U.S. IMR [infant mortality rate].59 Births to women ages 40 to 44 have increased since 1990, which may increase the IMR.60 Women over age 30 are more likely to have multiple births. This occurs both because of the use of fertility treatments and because the likelihood of twins increases with age.61 Infants of multiple births are more likely to die and to be both of low birthweight and short gestational age.62 In addition to the increased risk of multiple births, increasing maternal age may raise the IMR because the risk of a number of health conditions, including birth defects and congenital abnormalities, increases with maternal age.63
Page 23: “Educational efforts to prevent teen pregnancy may reduce the IMR, because infants born to teenage mothers are more likely to die in the first year of life.106”
[864] Report: “Infant Mortality Statistics From the 2013 Period Link Birth/Infant Death Data Set.” By T.J. Matthews, Marian F. MacDorman, and Marie E. Thoma. Department of Health and Human Services, Centers for Disease Control and Prevention, National Center for Health Statistics, August 6, 2015. <www.cdc.gov>
Page 7:
Infant mortality rates varied by maternal age. In 2013, infants of mothers under 20 (8.52) and mothers aged 40–54 (7.7) were more likely to die in the first year of life compared with other ages (Table 1). …
The relationship between maternal age and infant mortality is complex. Both younger and older mothers are more likely to have adverse birth outcomes, such as early gestational age and low birthweight, which may increase the risk of infant mortality. In addition, multiple births and chronic conditions are more common with advanced maternal age.
[865] Report: “Health at a Glance 2015: OECD Indicators.” Organization for Economic Cooperation and Development, 2015. <www.oecd-ilibrary.org>
Page 58: “With an increasing number of women deferring childbearing and a rise in multiple births linked with fertility treatments, the number of pre-term births has tended to increase (see indicator ‘Infant health: low birth weight’). In a number of higher-income countries, this has contributed to a levelling-off of the downward trend in infant mortality over the past few years.”
[866] Report: “The U.S. Infant Mortality Rate: International Comparisons, Underlying Factors, and Federal Programs.” By Elayne J. Heisler. Congressional Research Service, April 4, 2012. <fas.org>
Page 17:
Since 1990, a number of maternal lifestyle and health characteristics that may raise the IMR [infant mortality rate] have increased. These include inappropriate weight gain during pregnancy,70 tobacco use, gestational diabetes, and hypertension. There has been a 30% increase in women gaining too much weight during pregnancy and a 50% increase in women gaining too little weight.71 Weight gains outside of the recommended guidelines have been associated with a number of adverse outcomes, including infant mortality.72 Research has found that tobacco use during pregnancy increases rates of low birthweight and short gestational age births, and the rate of SIDS [sudden infant death syndrome].73 Rates for gestational diabetes have increased 3% per year on average since 1990, and rates of both pregnancy-associated and chronic hypertension have increased by an average of 1% annually since 1990. These conditions are associated with greater risk of pregnancy complications and adverse outcomes.74
Page 18:
Prenatal care has been demonstrated to be an effective intervention to reduce infant mortality because it includes health care as well as education and counseling about how to handle various aspects of pregnancy, including nutrition, physical activity, and basic infant care skills.77 Women who did not receive any prenatal care are more likely to have an infant die in the first month after birth. …
Delayed prenatal care may increase infant mortality. Prenatal care may be particularly important at earlier points in the pregnancy because health education to encourage appropriate weight gain or to discourage alcohol or tobacco use will have more effect on the fetus at early stages of the pregnancy, when the fetus is developing most rapidly. For example, researchers found that young women who initiated prenatal care early in pregnancy were less likely to use alcohol, cigarettes, or marijuana.79