Please wait as we load hundreds of rigorously documented facts for you.
Please wait as we load hundreds of rigorously documented facts for you.
For example:

Please permit Just Facts a brief departure from our mission statement to offer some viewpoints about this issue.
First and foremost, we reject and disdain the notion that any particular race of people is superior or inferior to another. Second, we contend this research proves that the differences between races are insignificant and superficial. We look forward to a day when the word “race” is used only in reference to a contest of speed.
That said, many activists, politicians, journalists, and academics have used half-truths and outright falsehoods about racial issues that divide people and stir up hatred. Thus, we think it is important to factually address these topics.
By their very nature, some facts about race and ethnicity have the potential to offend people. Thus, if you should feel slighted at any point while reading this research, we suggest that you look more broadly at the context to understand the larger picture.
In our view, the concrete facts of racial issues don’t demean any race in any way. Instead, they pinpoint societal problems that have harmed many millions of good people and will continue to do so unless we deal with them openly and honestly.
* There is more genetic variation among the people of any race than there is between one race and another.[1] [2] [3]
* Every race has the same coloring pigment in their skin. It is called melanin. The difference between the skin color of one person and another is a result of the quantity of melanin present in their skin. Hispanics, Asians, blacks, and whites all have the same skin pigment, but people with darker skin have more of it.[4] [5]
* Variations in over 100 genes determine a person’s skin color.[6] [7] [8] Siblings inherit unique combinations of genes from each parent and can have significantly different skin colors.[9] [10] [11] For instance, these two girls are twins:

* A study published in the journal Digestive Diseases and Sciences about the effects of race on organ donations found that:
* In 2013, the American Economic Review published a study conducted by scholars from Harvard and the University of Chicago who analyzed data on the “mental function” of more than 10,000 children aged 8–10 months.[15] [16] [17] Per the study:
* In 1899, the students of “M Street High,” a segregated black school in Washington, D.C., “scored higher than the students of the white Eastern and Western high schools on standardized tests in English and general subjects.” Per the Records of the Columbia Historical Society:
* In 2009, Public School 172 in Sunset Park, Brooklyn, New York, had:
* In 2020, a non-profit organization named “brightbeam” published an analysis of student outcomes in the 12 most progressive and 12 most conservative U.S. cities.[21] Arne Duncan, the former Secretary of Education under Barack Obama, sits on the board of this organization.[22] [23] The study yielded the following results:
* Stephen Jay Gould, one of the world’s leading evolutionary biologists,[31] wrote in a 1977 book published by Harvard University Press:
* In an 1871 book entitled The Descent of Man, Charles Darwin claimed:
* Thomas Huxley was a British biologist who gave lectures to promote the acceptance of evolution and was called “Darwin’s bulldog.”[35] In a book published in 1872, he claimed:
* In 1874, John Tyndall, incoming President of the British Association for the Advancement of Science, claimed in his inaugural address:
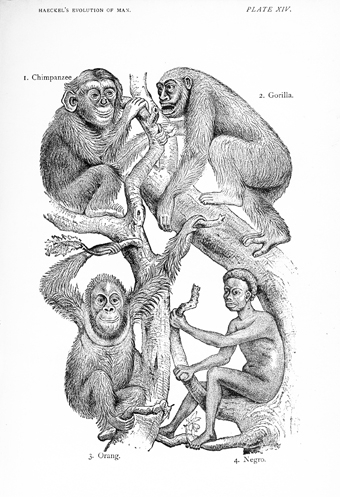
* Ernst Haeckel was a German biologist whose writings “exerted more influence than the works of any other scientist, including Darwin” in swaying people to accept evolution.[38] [39] [40] In The Descent of Man, Darwin wrote that Haeckel’s “knowledge on many points is much fuller than mine.”[41] In an 1874 book entitled The Evolution of Man, Haeckel presented the following claim and sketch:
* In an 1868 book entitled The History of Creation: Or the Development of the Earth and Its Inhabitants by the Action of Natural Causes, Haeckel claimed:
* In 1914, the American Book Company published a high school textbook entitled A Civic Biology that became the best-selling biology textbook in the United States and the subject of the famous Scopes “monkey trial.”[45] [46] In the section on evolution, it claims:
* In 1923, the Princeton University Press published a book written by the Chairman of the National Research Council entitled A Study of American Intelligence. It claims:
* A 2015 serial work about academic theories on Africa describes “a significant body of modern scientific literature” from “comparative and evolutionary psychology” claiming that “sub-Saharan African populations have, on average, very low intelligence….” This book also:
* Extensive documentation of false evolutionary beliefs is presented in the book Rational Conclusions by James D. Agresti, the president of Just Facts.
* Some modern scholars have claimed that the historically slow development of technically advanced civilizations in Africa is proof that black people are intellectually inferior.[50]
* Communication and commerce are essential elements in the development of technology.[51] [52] Before the modern era, communication was restricted in Africa by:
* Slavery has been widely practiced since the dawn of recorded history and up until recent centuries in places like China, India, Africa, England, Korea, Thailand, Indonesia, Scandinavia, and the Middle East.[59]
* The first Africans to set foot on mainland North America arrived in Jamestown, Virginia, in 1619. Historical records suggest they may have been indentured servants.[60]
* Slavery was officially instituted in Jamestown in 1640, Massachusetts in 1641, Connecticut in 1650, Virginia in 1661, Maryland in 1663, New York in 1665, and South Carolina in 1682. By the early 1700s, all the colonies of British North America had legalized slavery.[61] [62]
* In 1774, all of the British North American colonies except for Georgia formed an alliance to combat “a ruinous system of colony administration, adopted by the British ministry about the year 1763.” This coalition was called the “First Continental Congress.”[63] Its articles of association stated:
* On July 4th of 1776, the Second Continental Congress adopted the Declaration of Independence, which declared that they would no longer submit to the British government. It states:
* After the signing of the Declaration of Independence:
* James Madison was the primary author of the Bill of Rights and is known as the “Father of the Constitution” for his central role in its formation.[72] [73] In 1787 during the convention at which the Constitution was formed, Madison stated that all civilized societies are “divided into different Sects, Factions, and interests,” and “where a majority are united by a common interest or passion, the rights of the minority are in danger.” He stated that this was the cause of slavery, which he called “the most oppressive dominion ever exercised by man over man.”[74]
* During the Constitutional Convention, a debate arose over a provision to stop the slave trade. The states of Georgia and South Carolina objected that they would never agree to such a provision, and the delegates proposed a compromise that would forbid the federal government from stopping the slave trade until 1808. This provision was passed over “considerable opposition” from those who wanted to end the slave trade immediately. Summarizing the views of this opposition, Luther Martin, a delegate to the Convention stated:
* Benjamin Franklin was the first president of the nation’s first anti-slavery society. Other U.S. founding fathers who were leaders and members of anti-slavery societies include (but are not limited to) John Jay, Alexander Hamilton, Samuel Chase, Luther Martin, James Bayard, and Caesar Rodney.[76]
* Quotes from the founding fathers regarding slavery:
– Charles Carroll, member of the Continental Congress and signer of the Declaration of Independence[81]
– John Jay, president of the Continental Congress, chief justice of the U.S. Supreme Court, and governor of New York[83]
– Benjamin Rush, member of the Continental Congress and signer of the Declaration of Independence[85]
* Thomas Jefferson was the primary author of the Declaration of Independence, the third President of the U.S., and a lifelong opponent of slavery.[86] [87] [88] [89]
* When Jefferson was 14 years old, his father died, and he inherited 2,500 acres of land and about 40 slaves. He later inherited slaves from his father-in-law, sold slaves, and bought about 20 slaves in order to reunite families and fulfill labor needs. Jefferson owned about 600 slaves, freed two of them during his lifetime, freed five more in his will, and effectively freed three others by letting them escape.[90] [91]
* Jefferson’s original draft of the Declaration of Independence denounced the King of England for violating the “most sacred rights of life and liberty in the persons of a distant people who never offended him, captivating & carrying them into slavery” and “suppressing every legislative attempt to prohibit or to restrain this execrable commerce.” The Continental Congress removed this passage at the behest of South Carolina and Georgia. In his memoirs, Jefferson wrote:
* Writing about the debates that took place in the Continental Congress about slavery and other issues, Jefferson stated that all of the delegates agreed that the colonies must compromise and join together to be successful in their rebellion against Britain, because:
* In 1781/2, Jefferson wrote that the peaceful coexistence of blacks and whites in Virginia was not practical because of “rooted prejudices entertained by the whites,” and “ten thousand recollections, by the blacks, of the injuries they have sustained.” Thus, he supported a plan to:
* In 1783, Jefferson drafted a constitution for the state of Virginia that would have immediately stopped “the introduction of any more slaves to reside in this state” and banned the enslavement of anyone born after December 31, 1800.[96]
* In 1784, Jefferson drafted and pushed for a law to prohibit slavery in all western states. It lost by one vote, and Jefferson wrote, “The voice of a single individual would have prevented this abominable crime from spreading itself over the new country.”[97]
* In 1807, the U.S. Congress passed and President Thomas Jefferson signed a law “to prohibit the importation of slaves into any port or place within the jurisdiction of the United States” beginning on January 1, 1808. The law also prohibited any U.S. citizen from building, fitting, equipping, loading, or otherwise preparing a slave ship.[98]
* Quotes from Thomas Jefferson regarding slavery (arranged chronologically):
* Click here for an article and video from Just Facts about how college professors and others have misled the public about Jefferson’s views on race.
* In the 1850s, the Republican Party was formed on the basis of opposition to slavery. The founders chose the name “Republican” because they considered their principles to be aligned with those of Thomas Jefferson and the party he formed—which was called the “Republicans” and later the “Democratic-Republicans.”[106] [107] [108] [109] [110] [111] The modern Democratic Party also traced its roots to Jefferson and called him “the first Democratic President.”[112] [113]
* Abraham Lincoln—who often invoked Jefferson’s name and ideals—joined the Republican Party in 1856.[114] [115] [116]
* In the 1857 case of Dred Scott v. Sandford, the U.S. Supreme Court ruled (7–2) that black people were not “people of the United States” and “were not intended to be included, under the word ‘citizens’ in the Constitution, and can therefore claim none of the rights and privileges which that instrument provides for and secures to citizens of the United States.”[117]
* In 1860, Lincoln was elected as the first Republican president of the United States.[118] [119] [120] During his campaign, he stated that the Democrats:
* Before Lincoln’s election, Southern Democrats warned that a “Black Republican” presidential victory would cause them to split from the United States. In the period between Lincoln’s election and when he took office, seven Southern states seceded.[122] [123]
* The first state to split from the United States was South Carolina.[124] Its declaration of secession details “the immediate causes which have led to this act,” all of which pertain to slavery. For example, it states:
* The secession declarations of Georgia, Mississippi, and Texas all identify Northern hostility to slavery as their main reason for splitting from the United States.[126] [127] [128]
* In a March 1861 speech given less than a month before the outset of the Civil War,[129] the Vice President of the Confederacy, Alexander Stephens, stated:
* In March of 1861 during his first inaugural address, Abraham Lincoln stated that his objective was to preserve the Union and not to abolish slavery. He said that he would not take military action against the Southern states unless they attacked.[131] [132]
* The Civil War began in April of 1861 when Confederates attacked a federal fort in South Carolina. The war ended in the spring of 1865 when the Confederacy surrendered to the Union.[133] [134]
* In December of 1865, the United States ratified the 13th Amendment to the Constitution, which reads in full:
* Civil rights, as defined by the Britannica Dictionary, are:
* Less than year after the Civil War ended in 1865,[137] the Louisiana Democratic Party passed a resolution stating:
* In the winter of 1865/66, a group of Confederate Army veterans met in Pulaski, Tennessee and formed the Ku Klux Klan. Soon after its founding, some Klan members turned violent toward black people.[139] [140]
* In 1867, the Klan reorganized under the leadership of prominent Democrats to “secure unity of purpose,” ensure “concert of action,” and allegedly reign in violent members. Per the 1971 academic book White Terror: The Ku Klux Klan Conspiracy and Southern Reconstruction, this was the “real beginning” of the “Ku Klux conspiracy.”[141] [142] [143]
* After this “real beginning,” the Klan grew more violent and expanded to nearly every southern state with the following ramifications:[144] [145]
* In 1866, a bloc of Congressmen called the “Radical Republicans” passed a law to ensure that African Americans had the rights to:
* To guarantee that the Civil Rights Act of 1866 was constitutional, the Radical Republicans fought for and secured passage of the 14th Amendment to the Constitution in 1868,[166] [167] which reads in part:
* In 1870, the U.S. government ratified the 15th Amendment of the Constitution, which reads in full:
* In 1870, 1871, and 1875, the U.S. government enacted a series of civil rights laws to ensure that African Americans had the rights to:
* To enforce these civil rights laws, Republican President Ulysses S. Grant sent federal troops into the South and declared martial law in certain places.[173] [174] [175]
* By 1872, after “thousands of blacks and hundreds of whites had been massacred or driven from their homes and communities,” the Klan was temporarily disbanded. Factors that led to this included:
* In a decade surrounding the enactment of the 14th and 15th Amendments and the 1866–1875 federal civil rights laws, 16 African Americans became members of the U.S. Congress and 600 were elected to state legislatures.[180]
* In the 1875 case of United States v. Cruikshank, the U.S. Supreme Court ruled (5 to 4) that the U.S. Constitution:
* When Republican Senator Jacob Howard introduced the Constitution’s 14th Amendment, he stated that it would:
* When ratified, the language in the 14th Amendment that pertains to the three bullet points above was word-for-word the same as the amendment introduced by Jacob Howard.[185] [186] [187]
* The Supreme Court’s ruling in Cruikshank allowed white militias and mobs to subjugate black people through violence and intimidation.[188] [189] [190]
* In 1877, all federal troops left the South as part of a deal that some Republicans made with some Democrats to deliver a disputed presidential election to Republican Rutherford Hayes.[191]
* In 1877, Southern states began implementing laws and other measures that effectively restricted most black people from voting. These included (but were not limited to):
* Such restrictive voting laws were gradually enacted in different states, and over time, they “virtually eliminated” black people from voting in the South.[195] [196]
* In 1901, George White of North Carolina left the U.S. House of Representatives. He was the last black member of Congress from the South until 1973.[197]
* In 1913, Democrat Woodrow Wilson, a founder of progressivism and modern liberalism, became president of the United States.[198] [199] As president, Wilson:
* Between 1915 and the mid-1920s, the Ku Klux Klan grew to more than two million members. In addition to attacking black people, the Klan also targeted immigrants, Jews, and Catholics.[206]
* From 1901 to 1929, more than 1,200 African Americans were lynched in the South. During this period, Republicans tried to pass federal anti-lynching laws but were thwarted by Democrats.[207] [208]
* From the end of the Civil War until 1930, nearly all black voters were Republicans.[209] An exception to this was some prominent African Americans who supported the election of Democratic President Woodrow Wilson.[210]
* In the 1930s—while Southern blacks were effectively blocked from voting—Northern blacks began switching in large numbers to the Democratic Party. They did this because they supported the Great Depression-era “New Deal” programs of Democratic President Franklin Delano Roosevelt.[211] [212] [213] [214] [215] Such programs:
* Some New Deal programs contained provisions that discriminated against minorities.[221] For example, a law known as National Labor Relations Act of 1935 allowed labor unions to form “closed shops,” which gave unions control over who companies could employ.[222] [223] [224] [225] Since many unions excluded African Americans and other minorities from membership, people of color were locked out of numerous workplaces.[226] [227] [228]
* In 1947, Republicans in Congress enacted a law that banned closed shops by requiring that union membership be available to all employees.[229] [230] [231] [232] This significantly reduced but did not end racial discrimination by unions.[233] [234]
* In 1941, President Roosevelt nominated Hugo Black, a former member of the Ku Klux Klan, to the U.S. Supreme Court. With knowledge of this, the NAACP supported Black because of his liberal/progressive voting record.[235]
* In 1944, Hugo Black authored the Supreme Court’s decision in Korematsu v. United States. This 6 to 3 ruling allowed the Roosevelt administration to place U.S. citizens of Japanese descent into detention camps during World War II without any evidence that they were disloyal to the United States.[236] In this decision:
* Per the 1963 textbook The American Constitution: Its Origins and Development, during the post-World War II era:
* In the 1946 national elections, Democrats lost 55 seats in the House and 12 seats in the Senate, giving Republicans control of Congress.[239] [240]
* Three months before the next national elections (in 1948[241]):
* As a result of the actions above, some Southern Democrats split from the Democratic Party to form the States Rights Democratic Party, commonly called the Dixiecrats. Their party platform supported segregation and laws that banned interracial marriages. The Dixiecrats chose Strom Thurmond (D–SC) as their nominee, won four states in the 1948 presidential election, and then dissolved.[245] [246]
* The Republican Party platforms of 1952 and 1956 called for comprehensive civil rights legislation, and Northern Democrats joined Republicans in trying to pass this. Southern Democrats in the Senate led by Lyndon B. Johnson blocked these laws and removed enforcement processions from them. When one such law passed in 1960, Republican President Dwight Eisenhower called it “bitterly disappointing” because of its impotence.[247] [248]
* In 1957, Democrat Orval Faubus, the governor of Arkansas, ordered the Arkansas National Guard to physically block the integration of nine black students at a Little Rock high school. Faubus withdrew the Arkansas National Guard after Eisenhower instructed his attorney general to obtain an injunction against Faubus. A mob then formed that prevented the children from entering the school. This prompted Eisenhower to send several companies of the United States Army to disperse the mob and allow for the school to be integrated.[249] [250]
* In his 1960 “State of the Union” address, Eisenhower called for a new civil rights law to enforce voting rights for minorities. The bill was passed by Congress over the objections of Southern Democrats, who conducted one of the longest filibusters in the history of the Senate in attempts to stop it. Eisenhower then signed it into law.[251]
* In January of 1964, the U.S. Constitution was amended to abolish poll taxes for all federal elections and to ensure that no one could be excluded from federal primary elections on account of their race.[252] Previously, the Democratic Party in some states only allowed white people to vote in their primary elections.[253] [254]
* In the summer of 1964, the 88th U.S. Congress passed and Democratic President Lyndon B. Johnson signed a civil rights bill to:
* The Civil Rights Act of 1964 passed Congress with 65% of Democrats and 80% of Republicans voting for it.[256]
* The Civil Rights Act of 1964 was structured so that it would not affect labor union “seniority rights” that required workers to be “laid off or denied a chance for promotion” on account of time served with a union or company. President Johnson’s Department of Justice wrote that this “would be true” in cases where “white workers had more seniority than Negroes” even if “seniority rights were built up over a period of time during which Negroes were not hired ….”[257]
* The Civil Rights Act of 1964 was structured so that it exempted state and local governments from its provision that forbids employers from discriminating based upon race, color, religion, sex, or national origin.[258]
* In 1971, the U.S. Senate concluded that “employment discrimination in State and local governments is more pervasive than in the private sector.” In 1972, Congress passed and Republican President Richard Nixon signed a law that made such discrimination illegal.[259] [260] [261]
* In 1999, Democratic presidential candidate and former U.S. Senator Bill Bradley gave a speech he entitled, “Why I Am a Democrat.” In it, Bradley stated:
* In the U.S. Senate:
* In 1999, Democratic Vice President Al Gore gave a speech before the NAACP in which he stated:
* Al Gore, Sr.:
* The phrase “Southern Strategy” refers to the claim that Republicans have gained votes in the South since the mid-1900s by opposing civil rights and appealing to racism.[273] [274] [275]
* In 2012, the Daily Beast published a commentary by Jordan Michael Smith entitled “The Republican Party’s Race Problem and Strom Thurmond’s Legacy.” In this piece, Smith claimed:
* Among the 19 U.S. Senators who signed the 1956 Southern Manifesto denouncing the U.S. Supreme Court’s decision requiring racial integration in public schools:
* Among the:
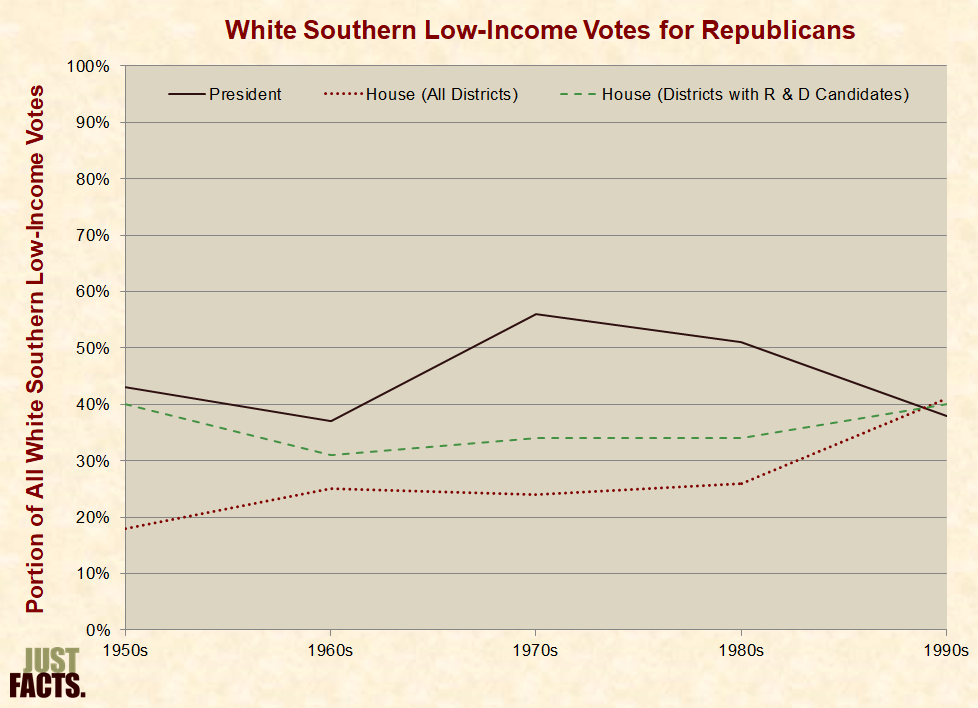
* The Southerners who voted for Thurmond in the 1948 presidential election were primarily whites who lived in poor areas with large black populations. These were whites with low incomes who felt their lives would be drastically changed by desegregation.[281] [282] From the 1950s to 1990s, white Southerners with incomes in the bottom third of the nation voted for Republicans approximately as follows:
* In the same Daily Beast commentary, Jordan Michael Smith claimed:
* Contrary to Smith’s narrative:
|
Election Year |
Southern Electoral Votes Won By Republicans |
|
1952 |
37% |
|
1956 |
44% |
|
1960 |
26% |
|
1964 |
37% |
|
1968 |
45% |
* In 2010, Princeton University history professor Sean Wilentz claimed:
* In 2013, Bloomberg published an editorial by Francis Wilkinson in which he claimed that:
* Among the 21 Democratic Senators who voted against the Civil Rights Act of 1964:
* Prominent Democrat segregationists who did not switch to the Republican Party include (but are not limited to):
* In 2015, the journal Political Analysis published an article by Timothy J. Hoffman about how “race dominates presidential elections.” In it, he claimed that in the 1968 presidential race, Republican Richard Nixon sought to “galvanize the support of old segregationist Southern Democrats through his ‘Southern Strategy,’ which involved using “racially tinged appeals to court white conservative voters.”[304] [305]
* In a 1966 op-ed in the Washington Post, Nixon detailed his strategy for winning the South. The first plank of this strategy was “human rights,” of which Nixon wrote:
* Richard Nixon:
* In the same Political Analysis article, Timothy J. Hoffman claimed that one of Nixon’s “racially tinged appeals” was supporting “states’ rights.”[312] [313] [314]
* In the same Washington Post op-ed detailing his Southern strategy, Nixon wrote:
* In the same Daily Beast commentary, Jordan Michael Smith claimed that “Nixon pioneered” the Southern strategy to “appeal to the prejudices” of Southerners and conservatives by “opposing busing and desegregating schools, advocating states’ rights and prioritizing law and order.”[316]
* From 1965 to 1974, the murder rate in the U.S. increased every year, growing by a total of 92% over this decade.[317]
* The policy of “busing” to desegregate schools involved:
* National polls conducted in 1971 and 1972 found that:
* In 1975, Congressional Quarterly reported:
* In 2015, the Washington Post published an article by Max Ehrenfreund entitled, “How Racism Explains Republicans’ Rise in the South.” In it, he claimed:
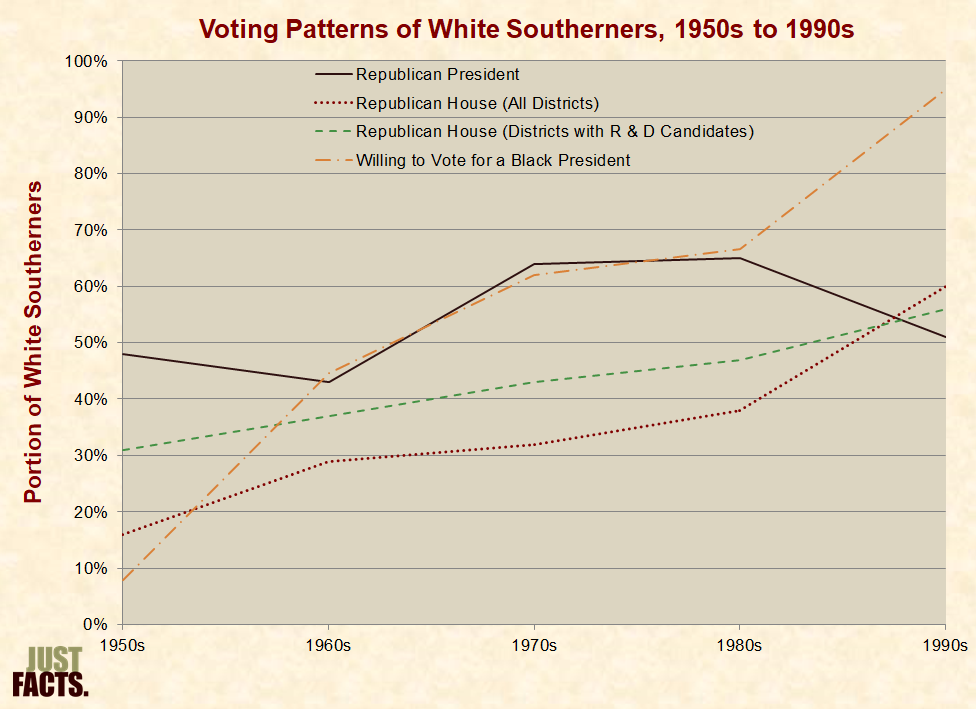
* From the 1950s to 1990s, the portion of white Southerners who said they would be willing to vote for a black president increased from 8% to 95%.[330] [331] During the same period, the portion of white Southerners who voted for Republicans in:
* Factors that may have played a role in Democratic Party losses in the South over past decades include but are not limited to:
* In 2005, New York magazine published a commentary by Frank Rich in which he claimed that Kevin Phillips was a “Nixon political strategist whose book The Emerging Republican Majority helped cement the party’s ‘southern strategy’ of mining white backlash to the civil-rights movement.”[346]
* Kevin Phillips:
* In the preface to the 1970 edition of The Emerging Republican Majority, Phillips wrote:
* In the same New York magazine commentary, Frank Rich wrote:
* Rich neglected to inform his readers that before this interview occurred:
* During this interview, Phillips was not “speaking to the Times” but to a freelance writer whose article was published by the Times. This writer, James Boyd:
* After various laws and court decisions in the 1950s and 1960s stopped whites from separating themselves from blacks,[355] [356] [357] [358] African Americans began forming numerous segregated all-black fraternities and professional organizations in the 1970s.[359]
* In 1972, 4,000 delegates attended a “National Black” political convention. The preliminary preamble to the convention stated that blacks were superior to whites. This language was removed at the behest of the NAACP.[360]
* In 1975 and 2007, two white Congressmen representing districts with large black populations attempted to join the Congressional Black Caucus. Members of this caucus denied them admission and stated that the group must remain “exclusively African-American.”[361]
* Some universities have tolerated student-organized anti-white segregation, such as:
* Other universities have actively participated in anti-white segregation. For example:
* In 2019, the National Association of Scholars surveyed 173 college campuses and found that:
* To prevent confusion that has surrounded the term “affirmative action,” the following three major forms of affirmative action are defined to clarify the facts below:
* Title 7 of the Civil Rights Act of 1964 states:
* Current federal law contains the same language as above.[388]
* During debates over the Civil Rights Act of 1964, the U.S. Department of Justice (under the authority of Democratic President Lyndon B. Johnson[389] [390]) authored a rebuttal to an opponent of the bill. The DOJ stated that the law:
* A review of federal affirmative action programs by the Congressional Research Service in 2011 identified more than 275 federal laws, regulations, and executive orders that:
* From 2011 to 2015, non-postal, civilian full-time federal workers received an average of 17% more compensation than private-sector workers with comparable occupations, levels of education, work experience, demographic characteristics, and geographic locations. Across various levels of education, this differential ranged from a low of –18% for workers with a professional degree or doctorate to a high of 53% for workers with a high school diploma or less.[393]
* In 2018, black people comprised:
* On average, the federal workforce is more educated than the private-sector workforce.[396] [397] The latest data on various educational accomplishments for white, black, and Hispanic people are as follows:
|
Educational Accomplishments |
White |
Black |
Hispanic |
|
4-Year High School Graduation Rate |
89% |
80% |
82% |
|
Recent High School Grads Enrolled in College |
68% |
50% |
63% |
|
3-Year Graduation Rate at 2-Year Colleges |
36% |
29% |
32% |
|
6-Year Graduation Rate at 4-Year Colleges |
67% |
44% |
58% |
|
4-Year College Grads Proficient in Document Literacy |
45% |
17% |
35% |
|
4-Year College Grads Proficient in Quantitative Literacy |
40% |
5% |
19% |
* In 2018, Hispanics comprised:
* In 2006, the U.S. Government Accountability Office analyzed why Hispanics are underrepresented in the federal workforce. The study found that:
* The U.S. Small Business Administration currently sets aside at least 5% of the value of all federal contracts for businesses owned by “disadvantaged” groups.[406] [407] Federal regulations instruct the Small Business Administration to presume that the following groups are “disadvantaged”:
* In 2002, a federal jury awarded $23.3 million in damages to eight white female librarians in Atlanta’s central library who were demoted and replaced by eight black librarians. These demotions occurred after one of the library board members stated “there are too many white faces in management.”[409]
* In 2003, the city of New Haven, Connecticut, threw out the results of an exam taken by 118 firefighters to qualify for a promotion. The city did this after the results showed that white firefighters did significantly better on the exam than minority firefighters. In 2009, the U.S. Supreme Court ruled (5 to 4) that the city’s actions violated the civil rights of 20 firefighters (19 white and one Hispanic) who scored well on the exam.[410] [411]
* Title 1 of the Civil Rights Act of 1991 states:
* Current federal law contains the same language as above.[413]
* The president of the United States has “full authority” over all executive agencies of the federal government, such as the Department of Defense, the Environmental Protection Agency, the CIA, and the Social Security Administration.[414]
* In 1995, Democratic President Bill Clinton stated that he was directing all federal agencies to comply with his “four standards of fairness” for affirmative action programs.[415] [416]
* Clinton’s first standard of fairness was “no quotas in theory or practice.”[417]
* During Clinton’s presidency, his Secretary of the Army instituted a policy of making high-level promotions using “a goal” to achieve a certain “selection rate in each minority or gender group,” including blacks, Hispanics, Asian/Pacific Islanders, American Indians, and females. After a white officer who was denied promotion sued the Army, a federal appeals court judge ruled that this policy was unconstitutional and:
* In April 2001, three months after George W. Bush replaced Bill Clinton as president of the United States, the software division chief of Robins Air Force Base in Georgia sent an email instructing a supervisor to alter the performance evaluations of employees to “balance the ethnic groups.” This email recommended:
* Clinton’s second standard of fairness was “no illegal discrimination of any kind, including reverse discrimination.”[423]
* In 1994, Clinton’s Defense Secretary, William Perry, announced “a vigorous effort to improve the representation of women, minorities and persons with disabilities among the department’s civilian managers.” In furtherance of that goal, the Defense Undersecretary for Personnel and Readiness, Edwin Dorn, issued memorandums that required his managers to obtain special permission before promoting any white men without disabilities to high-level positions.[424] [425]
* Clinton’s third standard of fairness was “no preference for people who are not qualified for any job or other opportunity.”[426]
* Clinton’s fourth standard of fairness was “as soon as a program has succeeded, it must be retired.”[427]
* During Clinton’s presidency, he instructed his senior policy advisor (George Stephanopoulos, currently the chief anchor for ABC News) and his special counsel (Christopher Edley, currently the president emeritus of the Opportunity Institute) to conduct a review of the federal government’s affirmative action programs. Their review:
* In 2004, the Stanford Law Review published a systematic analysis of 27,000 “law students from their entry into law school in the fall of 1991 through their eventual success (or failure) in passing the bar two or three years after graduation.” The study found that:
* The American Civil Liberties Union (ACLU) is a non-profit organization that claims to:
* The ACLU’s position paper on affirmative action contends that:
* In 1996, the state of California held a vote (on Proposition 209) to amend its constitution to read:
* The ACLU opposed Prop 209, and after the voters of California approved it, the ACLU sued to overturn it.[437] [438]
* Democratic President Bill Clinton joined the ACLU in trying to overturn Prop 209. These efforts failed.[439] [440]
* In its timeline of affirmative action milestones, the ACLU’s position paper on affirmative action claims:
* Johnson was not the first person or U.S. president to use the phrase “affirmative action.” In a 1961 executive order, President Kennedy used the phrase “affirmative action” and stated that it is:
* Kennedy’s executive order made no mention of rewarding or penalizing anyone based upon their race. Three times in this order, Kennedy instructed the government to make hiring, firing, and contracting decisions “without regard” to race.[443]
* Democratic President John F. Kennedy supported the idea that “race has no place in American life or law.”[444]
* Democratic President Lyndon B. Johnson supported the idea that “freedom” and “equal opportunity” are “not enough” to remedy past discrimination. He insisted that the government must dictate “equal” results for people of different races.[445]
* A 2019 Pew Research poll found that the following portion of adults in the U.S. think race should be a major factor, minor factor, or not a factor in college admissions decisions:
|
Affirmative Action in College Admissions |
|||
|
Group |
Major Factor |
Minor Factor |
Not a Factor |
|
U.S. Adults |
7 |
19 |
73 |
|
Whites |
4 |
18 |
78 |
|
Blacks |
18 |
20 |
62 |
|
Hispanics |
11 |
22 |
65 |
* A 2016 Gallup poll found that the following portions of adults in the U.S. think college admission decisions should consider race or be based solely on merit:
|
Affirmative Action in College Admissions |
||
|
Group |
Consider Race |
Solely on Merit |
|
U.S. Adults |
26 |
70 |
|
Whites |
22 |
76 |
|
Blacks |
44 |
50 |
|
Hispanics |
29 |
61 |
* A 2013 Gallup poll found that the following portions of adults in the U.S. favor or oppose affirmative action:
|
Affirmative Action |
||
|
Group |
Favor |
Oppose |
|
U.S. Adults |
58 |
37 |
|
Whites |
51 |
44 |
|
Blacks |
76 |
20 |
|
Hispanics |
69 |
25 |
* The same 2013 Gallup poll found that the following portions of adults in the U.S. think college admission decisions should consider race or be based solely on merit:
|
Affirmative Action in College Admissions |
||
|
Group |
Consider Race |
Solely on Merit |
|
U.S. Adults |
28 |
67 |
|
Whites |
22 |
75 |
|
Blacks |
48 |
44 |
|
Hispanics |
31 |
59 |
* Regarding the different results of this 2013 Gallup poll, Gallup explained:
* With regard to affirmative action:
* Since the early 1970s:
* In the U.S., public K–12 schools are mainly run by local governments.[463] [464] [465]
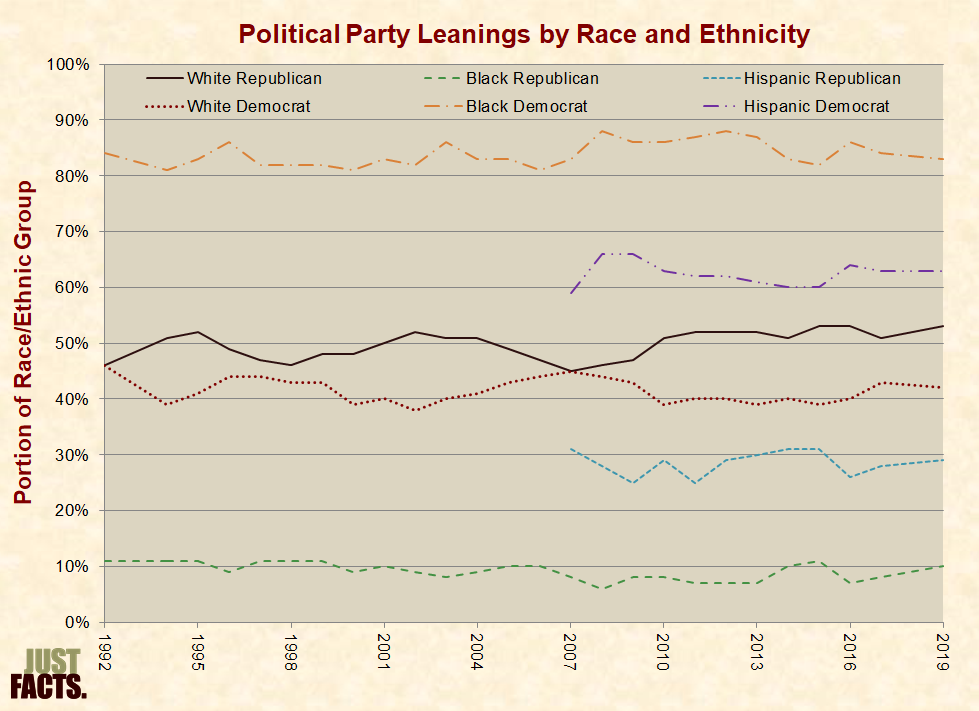
* The political affiliations/leanings of registered voters among the largest racial and ethnic groups are as follows:[466]
* Among public school students who began high school in 2015, 86% graduated within four years. This was true for:
* Among high school students who graduated in 2020 and took the ACT college readiness exam, 26% met ACT’s college readiness benchmarks in all four subjects. This varied by racial/ethnic group as follows:
* Among recent high school graduates of different racial/ethnic groups, the rates of college enrollment in 2019 were:
* Among full-time, new college students who entered a 2-year college in 2016, 34% graduated from it within 150% of the normal time required to do so (typically three years). This was true for:
* Among full-time, new college students who entered a 4-year college in 2013, 63% graduated from it within six years. This was true for:
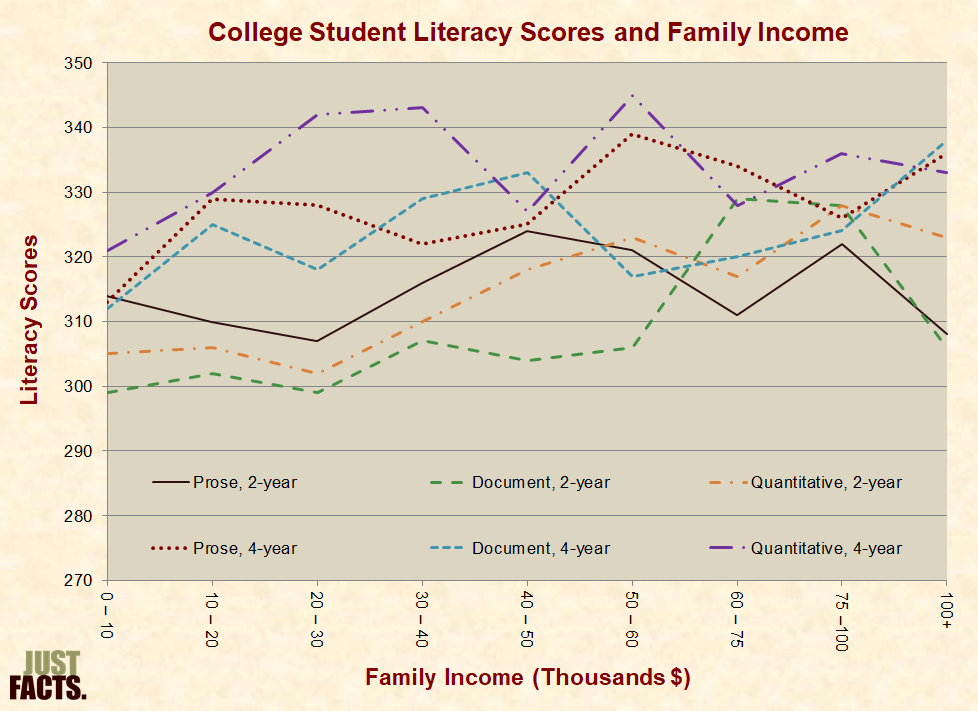
* A 2003 scientific survey assessed the literacy skills of 1,827 graduating college students. These students were randomly selected from across the U.S., and each was graded as Proficient, Intermediate, Basic, or Below Basic on three different types of literacy:[474]
1) Prose Literacy, which is the ability to “search, comprehend, and use information from continuous texts,” such as “editorials, news stories, brochures, and instructional materials.” Students who were proficient in this included:
2) Document Literacy, which is the ability to “search, comprehend, and use information from noncontinuous texts,” such as “job applications, payroll forms, transportation schedules, maps, tables, and drug or food labels.” Students who were proficient in this included:
3) Quantitative Literacy, which is the ability to “identify and perform computations … using numbers embedded in printed materials,” such as “balancing a checkbook, figuring out a tip, completing an order form, or determining the amount of interest on a loan from an advertisement.” Students who were proficient in this included:
* The study also found:
* In 2009, Public School 172 in Sunset Park, Brooklyn, New York, had:
* Per a New York Times article about Public School 172:
* A 1998 survey of parents with school-age children found that 73% of blacks and 77% of whites agreed with the following statement:
* School choice initiatives allow parents to select the schools their children attend, with part or all of the costs paid by their taxes or other government revenues. This can include:
* In 2011, the Quarterly Journal of Economics published an experimental study of a public school choice initiative in the 20th largest school district in the nation (Charlotte-Mecklenburg, North Carolina). The study compared the adult crime outcomes of male students who won and did not win a lottery for their parents’ first choice of school. The author found the following statistically significant results:
* At least 22 experimental (or quasi-experimental) studies have been conducted on the academic outcomes of students who experience school choice.[491] [492] Among them:
* In a 2014 interview, Bill O’Reilly asked Barack Obama, “Why do you oppose school vouchers when it would give poor people a chance to go to better schools?” Obama replied:
* A 2010 experimental study of a school voucher initiative in the District of Columbia published by the Obama administration’s Department of Education found the following statistically significant results:
* Per a 2004 report by the Civil Rights Project at Harvard University, the Urban Institute, Advocates for Children of New York, and the Civil Society Institute:
* The 2012 Democratic Party Platform stated:
* In 2013, the Journal of Policy Analysis and Management published an experimental study of the same District of Columbia voucher initiative by the same lead author. The study found the following statistically significant results:
* The following opponents of private school choice personally attended and also sent their own children to private K–12 schools:
* A nationally representative poll of 4,000 U.S. adults commissioned in 2015 by Education Next and the Kennedy School of Government at Harvard University found that the following portions of Americans:
* An analysis of U.S. Census data from the year 2000 by the Thomas B. Fordham Institute (a proponent of school choice) found that the following portions of parents were sending at least one of their own children to a private K–12 school:
* For more facts about school choice, visit Just Facts’ research on education.
* The American Heritage Dictionary defines “segregation” as the:
* In 1954, the U.S. Supreme Court ruled unanimously (9–0) that racial segregation in public schools is unconstitutional because it violates people’s “equal protection of the laws” under the 14th Amendment.[543] [544]
* In a 2019 report on the racial composition of public schools in the United States, the UCLA Civil Rights Project claimed that the “growth of racial and economic segregation … has now continued unchecked for nearly three decades….”[545] The authors based this conclusion on their finding that “intensely segregated minority schools, that is, schools that enroll 90–100% non-white students, more than tripled from 5.7% in 1988 to 18.2% in 2016.”[546]
* Various politicians and media outlets have cited this UCLA Civil Rights Project report to allege that America’s schools have grown increasingly segregated since the 1990s, including:
* None of the assertions above mention the following facts which are buried in the same report:
* Without providing any evidence, Vice-President Kamala Harris claimed in 2019 that racial “educational segregation is getting worse” and “the schools of America are as segregated, if not more segregated today than when I was in elementary school.”[556] [557]
* In 2019, the median reported household cash incomes of different races and ethnicities in the U.S. were as follows:
|
Cash Income |
|
|
Race / Ethnicity |
Median Income |
|
White |
$72,204 |
|
Black |
$45,438 |
|
Asian |
$98,174 |
|
Hispanic |
$56,113 |
* In 2020, the median reported cash earnings in the U.S. of full time workers in their primary working years of different races and ethnicities were as follows:
|
Cash Earnings in Primary Working Years |
|
|
Race / Ethnicity |
Median Earnings |
|
White |
$53,924 |
|
Black |
$42,588 |
|
Asian |
$72,696 |
|
Hispanic |
$41,458 |
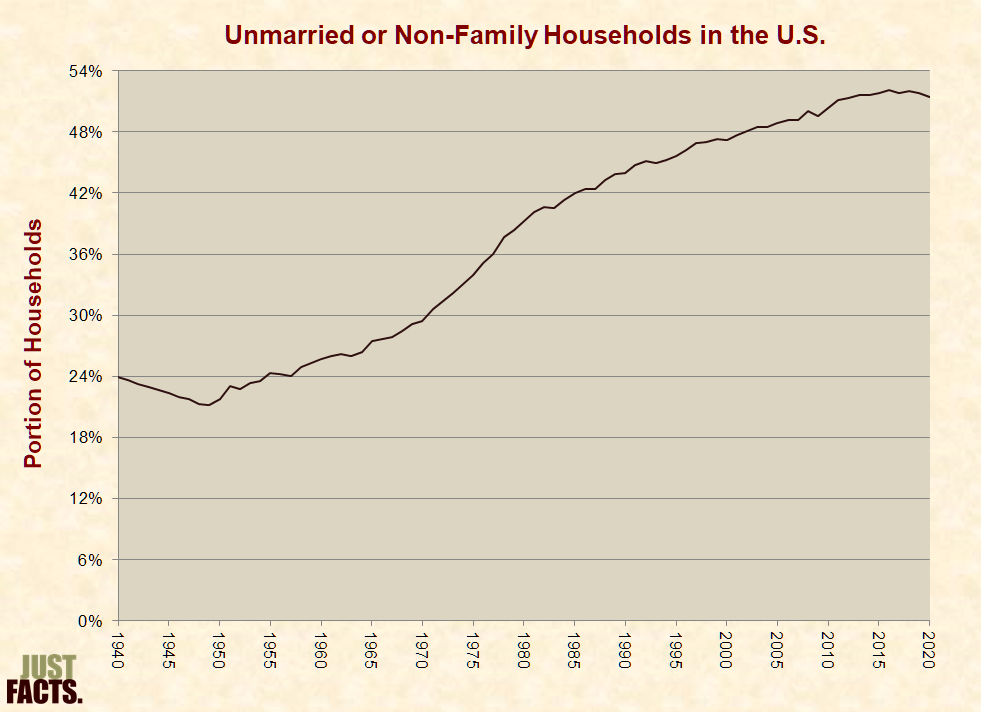
* From 1947 to 2020, the portion of unmarried or non-family households in the U.S. rose from 22% to 51%:
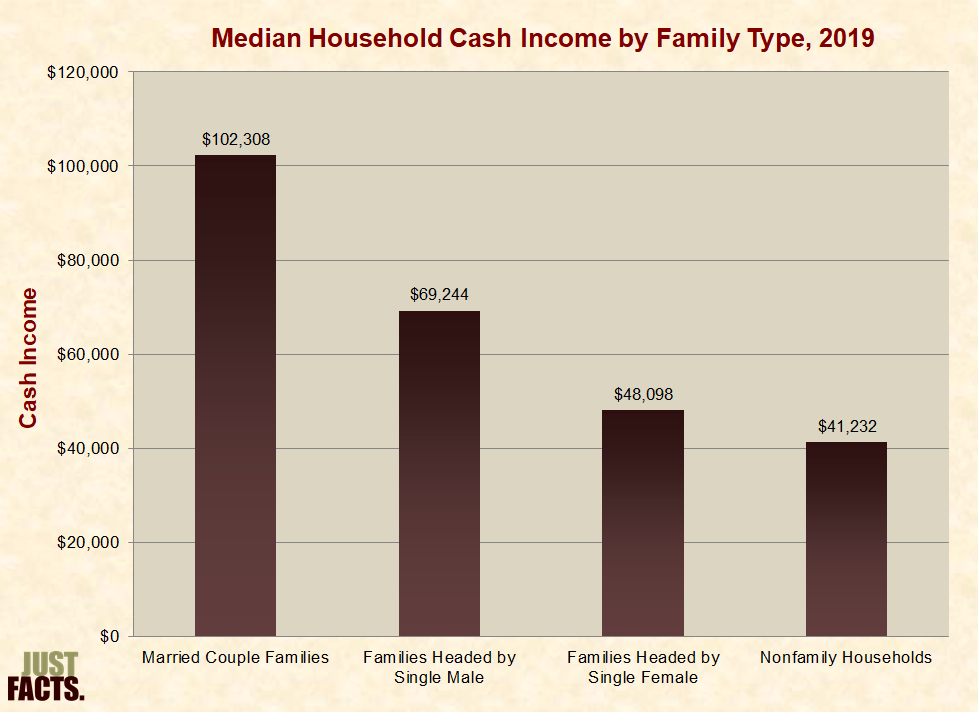
* In 2019, the median reported household cash incomes for U.S. households with different marital or family statuses were as follows:
* In 2020, the portion of U.S. residents living in married couple families ranged from 75% for Asians to 40% for blacks:

* In 2019, the median reported household cash incomes for U.S. households of different races, ethnicities, and marital or family statuses were as follows:
|
Race / Ethnicity |
Household Cash Income in Thousands of Dollars |
|||
|
Married Couple Families |
Families Headed by Single Male |
Families Headed by Single Female |
Nonfamily Households |
|
|
White |
$103 |
$72 |
$51 |
$43 |
|
Black |
$88 |
$58 |
$39 |
$30 |
|
Asian |
$124 |
$84 |
$70 |
$56 |
|
Hispanic |
$74 |
$64 |
$43 |
$36 |
* In 2019, the poverty rates for U.S. residents of different races, ethnicities, and marital statuses were as follows:
|
Race / Ethnicity |
Poverty Rates |
|||
|
Married, Spouse Present |
Divorced |
Separated |
Never Married |
|
|
White |
6% |
14% |
24% |
13% |
|
Black |
9% |
19% |
28% |
21% |
|
Asian |
9% |
13% |
26% |
14% |
|
Hispanic |
14% |
19% |
34% |
20% |
* In 2019, the median reported cash incomes of U.S. families with children raised by:
* From 1960 to 2020, the portion of children living in homes without two parents increased from:
* In 2013, the portions of people who considered the “growing number of children born to unmarried mothers” to be a “big problem” varied by race and age as follows:
* From 2001 to 2021, the U.S. public’s views on the moral acceptability of:
* In 2021, the U.S. public’s views on the matters above varied by political affiliations as follows:
|
Moral Acceptability of: |
Republicans |
Independents |
Democrats |
|
Divorce |
72% |
78% |
85% |
|
Sex Between an Unmarried Man and Woman |
61% |
75% |
81% |
|
Having a Baby Outside of Marriage |
56% |
73% |
70% |
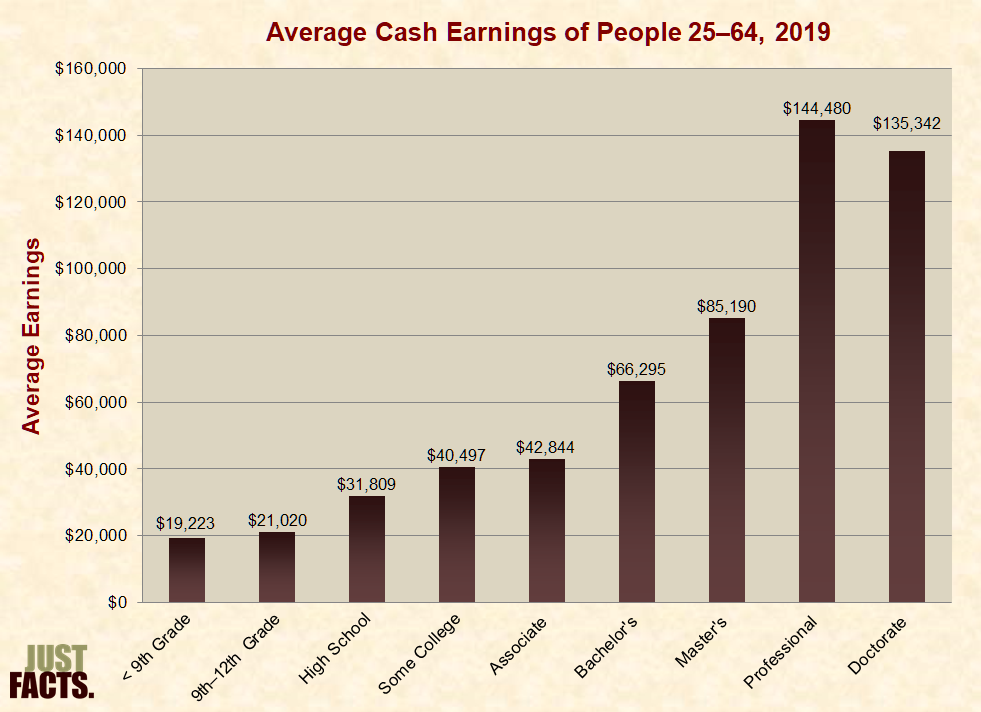
* In 2019, the average reported cash earnings of U.S. residents aged 25 to 64 for varying levels of formal education were as follows:
* In 2020, the formal education levels of U.S. residents in their primary working years were as follows:
|
Race / Ethnicity |
Formal Education |
|||
|
No High School Diploma |
High School |
Some College |
Bachelor’s or Higher |
|
|
White |
8% |
26% |
26% |
39% |
|
Black |
8% |
33% |
29% |
29% |
|
Asian |
6% |
15% |
14% |
65% |
|
Hispanic |
24% |
32% |
23% |
21% |
* In 2020, the median reported cash earnings full time workers in the U.S. aged 25 and older with different levels of formal education, races, and ethnicities were as follows:
|
Race / Ethnicity |
Median Earnings in Thousands of Dollars |
|
|
High School[591] |
Bachelor’s or Higher[592] |
|
|
White |
$42 |
$75 |
|
Black |
$36 |
$61 |
|
Asian |
$37 |
$86 |
|
Hispanic |
$37 |
$64 |
* A 2014 study by the Brookings Institution found that:
* In 2019, the average reported cash earnings of U.S. native-born citizens in their primary working years with different levels of formal education, races, and ethnicities were as follows:
|
Race / Ethnicity |
Average Earnings in Thousands of Dollars |
|
|
High School |
Bachelor’s or Higher |
|
|
White |
$32 |
$77 |
|
Black |
$24 |
$60 |
|
Asian |
$29 |
$82 |
|
Hispanic |
$29 |
$62 |
* In 2019, married U.S. native-born citizens in their primary working years with different levels of education, races, and ethnicities had the following average reported cash earnings:
|
Race / Ethnicity |
Average Earnings in Thousands of Dollars |
|
|
High School |
Bachelor’s or Higher |
|
|
White |
$36 |
$86 |
|
Black |
$31 |
$68 |
|
Asian |
$43 |
$94 |
|
Hispanic |
$34 |
$75 |
* A 2016 study by Georgetown University’s Center on Education and the Workforce found:
* In 2003, the National Center for Education Statistics assessed the literacy skills of 1,827 graduating college students. These students were randomly selected from across the U.S., and each was graded as Proficient, Intermediate, Basic, or Below Basic on three different types of literacy:[608]
1) Prose Literacy, which is the ability to “search, comprehend, and use information from continuous texts,” such as “editorials, news stories, brochures, and instructional materials.” Students at 4-year colleges who were proficient in this included:
2) Document Literacy, which is the ability to “search, comprehend, and use information from noncontinuous texts,” such as “job applications, payroll forms, transportation schedules, maps, tables, and drug or food labels.” Students at 4-year colleges who were proficient in this included:
3) Quantitative Literacy, which is the ability to “identify and perform computations … using numbers embedded in printed materials,” such as “balancing a checkbook, figuring out a tip, completing an order form, or determining the amount of interest on a loan from an advertisement.” Students at 4-year colleges who were proficient in this included:
* Per a 2004 paper in the Stanford Law Review:
* In a 2016 Washington Post commentary, Jared Bernstein, a former chief economist to Democratic Vice President Joe Biden, wrote:
* In 1930, the unemployment rates for whites and blacks were about the same. By 1965, the unemployment rate for blacks had become twice as high as for whites.[614] [615]
* In 1948, the unemployment rate for black teenagers was lower than for white teenagers. By 1965, the unemployment rate for black teenagers had risen to 23%, as compared to 13% for white teenagers.[616]
* In 1999, Democratic Vice President Al Gore gave a speech before the NAACP in which he stated:
* The 62% statistic cited by Gore corresponds to median cash income per household in 1998.[618] It does not account for work hours or education. In 1998:
* In 2004, the Leadership Conference, a coalition of more than 200 organizations including the NAACP, ACLU, and the National Council of La Raza, published a “fact sheet” that stated:
* These statistics cited by the Leadership Conference do not account for the career choices or practical skills of workers.
* A 2016 study by Georgetown University’s Center on Education and the Workforce found:
* In 2003, the National Center for Education Statistics assessed the literacy skills of 1,827 graduating college students. These students were randomly selected from across the U.S., and each was graded as Proficient, Intermediate, Basic, or Below Basic on three different types of literacy:[629]
1) Prose Literacy, which is the ability to “search, comprehend, and use information from continuous texts,” such as “editorials, news stories, brochures, and instructional materials.” Students at 4-year colleges who were proficient in this included:
2) Document Literacy, which is the ability to “search, comprehend, and use information from noncontinuous texts,” such as “job applications, payroll forms, transportation schedules, maps, tables, and drug or food labels.” Students at 4-year colleges who were proficient in this included:
3) Quantitative Literacy, which is the ability to “identify and perform computations … using numbers embedded in printed materials,” such as “balancing a checkbook, figuring out a tip, completing an order form, or determining the amount of interest on a loan from an advertisement.” Students at 4-year colleges who were proficient in this included:
NOTE: Like the FBI, this research uses the term “murders” as a shorthand for both murders and intentional manslaughters.[633]
* Approximately 16,425 murders were committed in the U.S. during 2019.[634] [635] For cases in which law enforcement identified the race or ethnicity of victims or perpetrators, the breakdown was as follows:
|
2019 Population and Murder Portions |
|||
|
Race / Ethnicity |
Portion of U.S. Population[636] |
Portion of Victims[637] |
Portion of Perpetrators[638] |
|
Race |
|||
|
White |
77% |
42% |
41% |
|
Black |
13% |
55% |
56% |
|
Other Race |
10% |
3% |
3% |
|
Ethnicity |
|||
|
Hispanic |
19% |
20% |
20% |
|
Non-Hispanic |
82% |
80% |
80% |
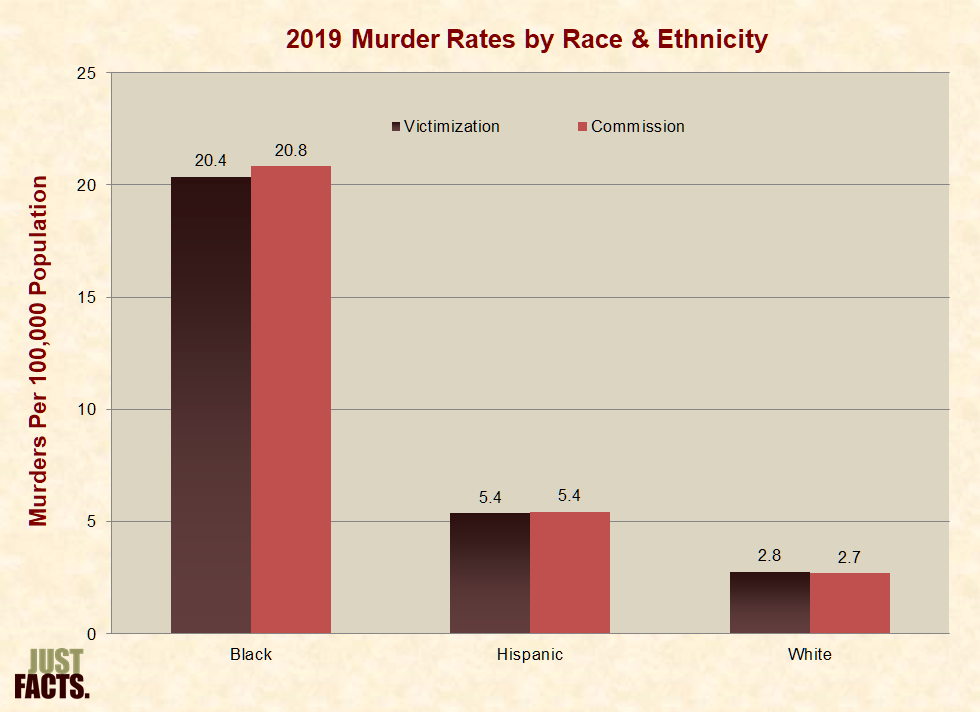
* Based on cases where law enforcement identified the race or ethnicity of victims or perpetrators, the approximate murder victimization and commission rates in 2019 were as follows:
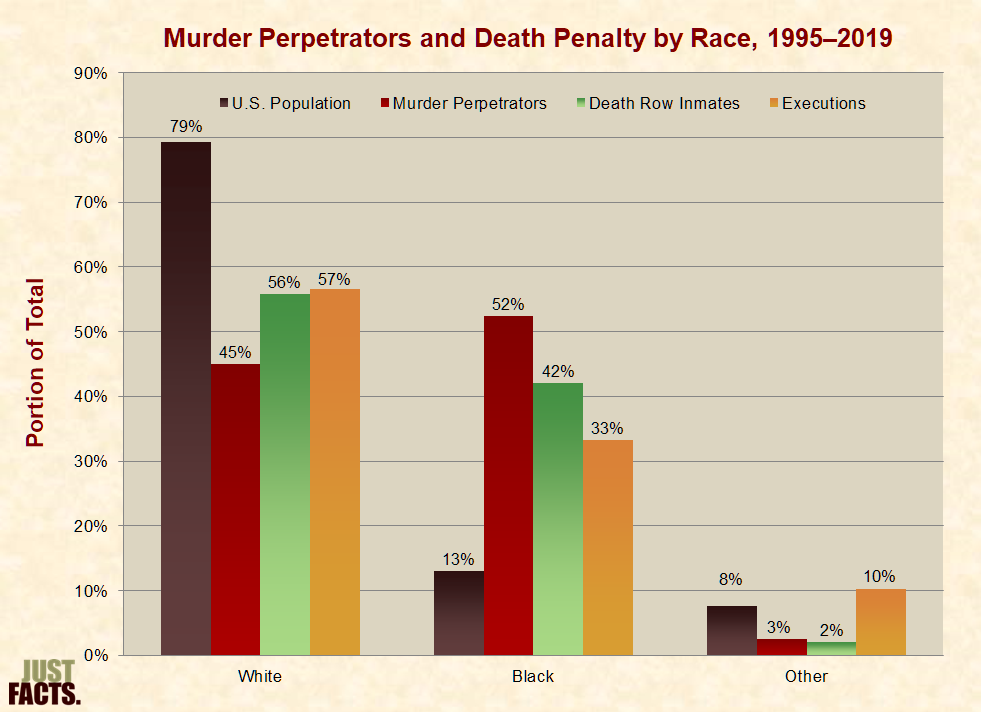
* In the U.S. from 1995 to 2019, black people comprised:
* From 1965 to 2019, roughly 321,094 murders were committed in the U.S. that were still unsolved as of 2019.[643] [644]
* The portion of murders committed by minorities is understated when accounting only for cases in which law enforcement has identified the perpetrators. This is because roughly 89% of murder perpetrators are the same race as their victims,[645] [646] and murders of black and Hispanic victims are less likely to be solved.[647] [648]
* When murders and other violent crimes remain unsolved:
* Some of the factors associated with the rates that murders are solved include:
* The portion of murders in the U.S. that resulted in a suspect being identified and acted upon by the criminal justice system declined from 92% in 1960 to 61% in 2019.[658] [659] [660]
* In Baltimore from 2015 to 2020, the portion of murders that resulted in a suspect being identified and acted upon by the criminal justice system averaged 39%.[661] [662]
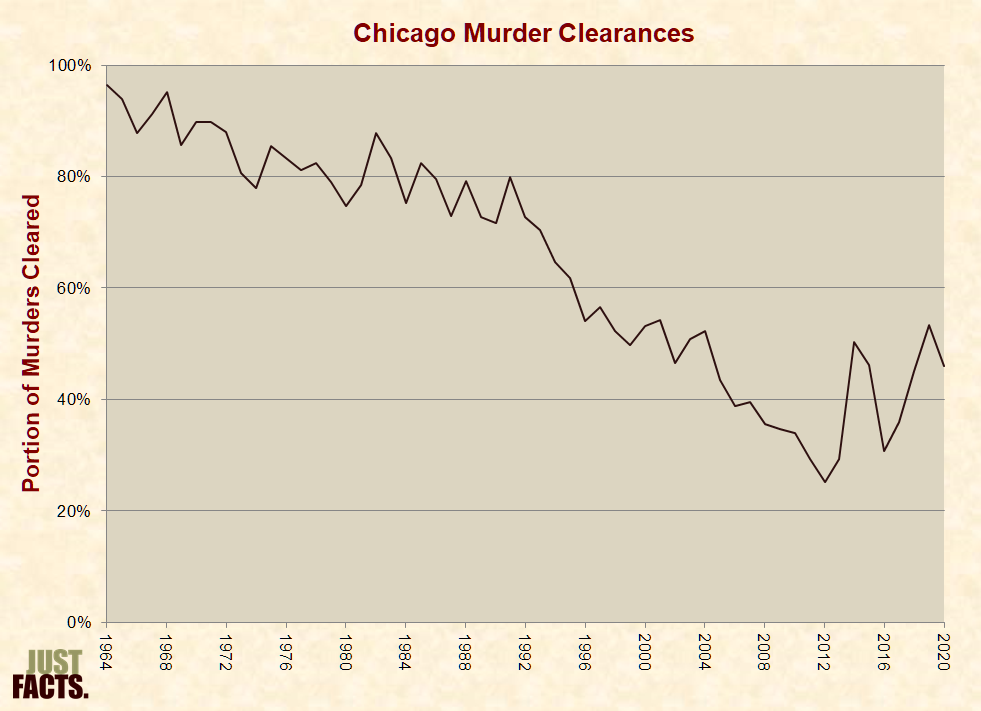
* In Chicago, Illinois, the portion of murders that resulted in a suspect being identified and acted upon by the criminal justice system declined from 96% in 1964 to 25% in 2012. In 2020, the figure was 46%:
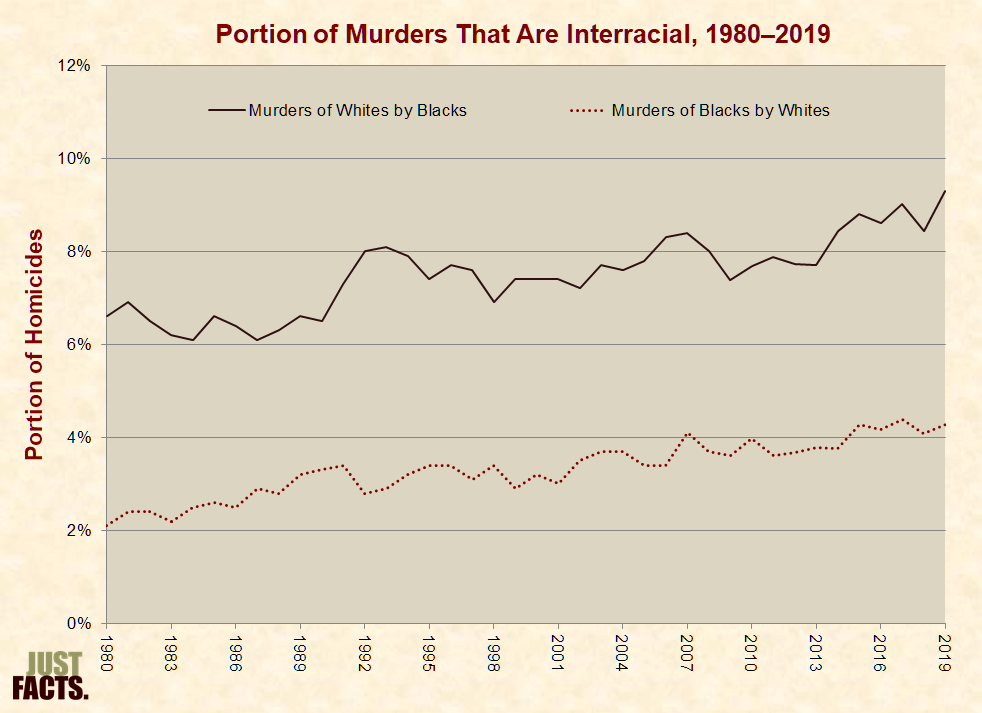
* In every year from 1980 to 2019, roughly 11% of murders were interracial. The rest involved people of the same races slaying one another.[665]
* In a 2015 New York Times op-ed, Patricia Williams Lessane, the director of the Avery Institute of Afro-American History and Culture at the College of Charleston, South Carolina, listed several killings of black people by white people and wrote that “we African-Americans”:
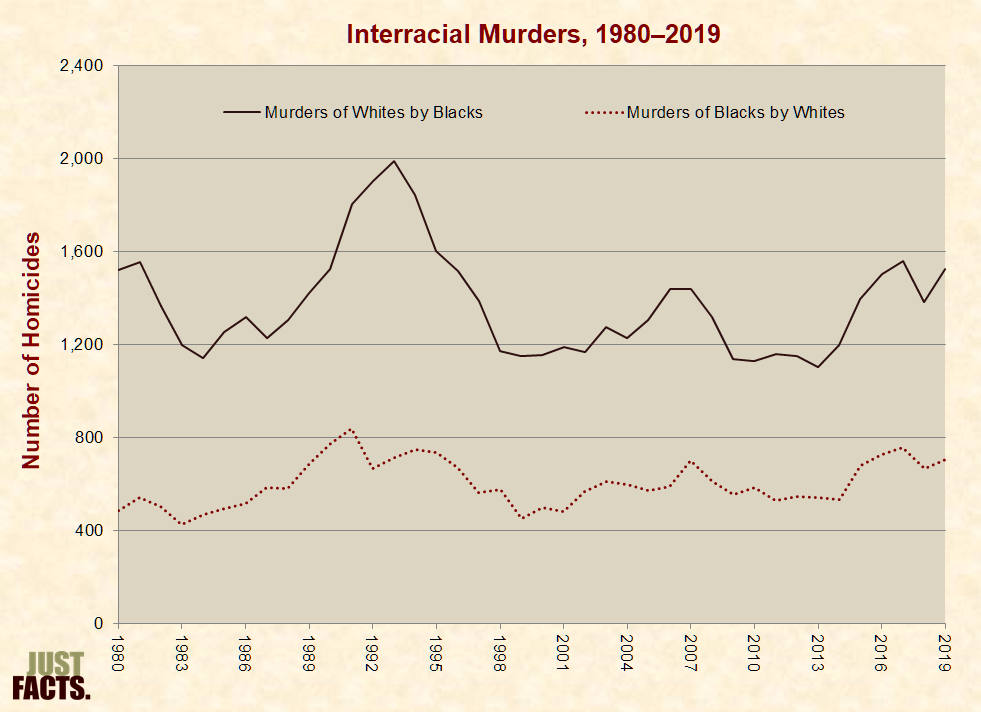
* In every year from 1980 to 2019, murders of white people by black people have been about two-to-three times more common than vice-versa:
* From 1980 to 2019, white people murdered an average of about 601 black people per year, and black people murdered an average of about 1,373 white people per year:
* Every year, the U.S. Department of Justice interviews a nationally representative sample of about 169,000 people age 12 or older to determine the frequencies and natures of certain crimes. This survey, which is called the National Crime Victimization Survey:
* National Crime Victimization Survey data from 2019 shows the following breakdown of violent crimes by the victims’ perceptions of the race and ethnicity of the perpetrators:
|
2019 Population and Violent Crimes Committed |
||
|
Race / Ethnicity |
Portion of: |
|
|
Population |
Completed Violent Crimes |
|
|
White, Non-Hispanic |
62% |
50% |
|
Black, Non-Hispanic |
12% |
22% |
|
Hispanic |
17% |
14% |
* In 2011, the Quarterly Journal of Economics published an experimental study of a public school choice initiative in the 20th largest school district in the nation (Charlotte-Mecklenburg, North Carolina). The study compared the adult crime outcomes of male students who won and did not win a lottery for their parents’ first choice of school. The author found the following statistically significant results:
* The “Black Lives Matter” movement is an association of groups and activists who claim that America is rife with racism against people of color.[678] [679]
* The official website of the #BlackLivesMatter organization contends that:
* The main launching point of the Black Lives Matter movement was the death of Trayvon Martin, a 17-year-old black teen who was shot and killed by a neighborhood watch volunteer named George Zimmerman.[682] [683] [684]
* Zimmerman, who is half-white, half-Hispanic, and partially black, shot Martin on a rainy night in Sanford, Florida in February 2012.[685] [686] [687]
* In the wake of the shooting, the police did not arrest Zimmerman based on their finding that he acted in self-defense.[688] [689] During the next six weeks:

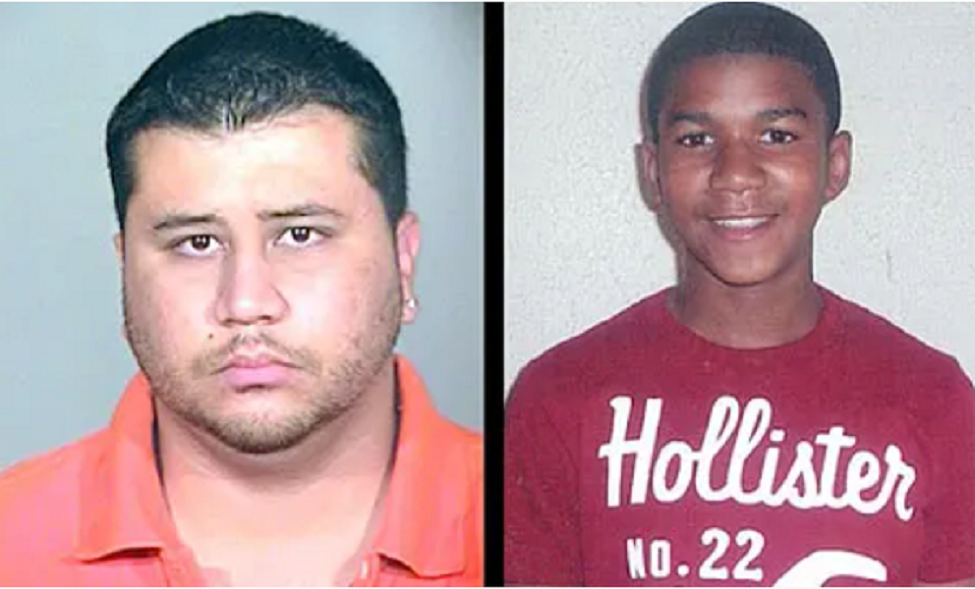
* On the night of the shooting, Martin was about five inches taller and 40 pounds lighter than Zimmerman.[706] Around that time, they looked like this:

* Approximately six weeks after the incident, Zimmerman was arrested and charged with second-degree murder and manslaughter.[709] [710] A jury found him not guilty of all charges on grounds that he shot Martin in self-defense.[711]
* The Obama administration’s Department of Justice conducted a separate investigation and found “insufficient evidence to pursue federal criminal civil rights charges” against Zimmerman.[712]
* The Black Lives Matter movement became prominent in 2014 as a result of the death of Michael Brown in Ferguson, Missouri.[713] [714] [715] [716] [717] Brown, an 18-year-old black teen, was shot and killed by a white police officer named Darren Wilson. A grand jury decided there was no evidence that would justify bringing charges against Wilson.[718] [719] [720]
* Before and after the grand jury’s decision, riots erupted, and the Obama administration’s Department of Justice launched an investigation to determine if Wilson deprived Brown of his civil rights.[721] [722] [723] [724]
* The Obama administration’s investigation found that the widely reported claims that Brown held up his hands in surrender (“Hands up, don’t shoot”) were either:
* The investigation also found that:
* Ten months after the Obama administration’s report was released, U.S. Congressman Bobby Rush (D-IL) and nine other members of the U.S. House of Representatives sponsored a bill that cited “the death of Michael Brown” as an example of “the unjustified use of lethal and excessive force by police officers against African-Americans.”[727]
* On four days surrounding Martin Luther King Day in 2016, Google News produced 429 results for a search on “Michael Brown” Ferguson. Among the first 36 of these results, 35 did not mention or hint that Brown attacked Wilson and was shot while charging at him.[728]
* A 2015 survey commissioned by Just Facts asked a nationally representative sample of voters:
* This poll found that 63% of all voters did not provide the correct answer (“No”). This was true for:
* The United States is third-most populous nation in the world, with more than 332 million people, 16,000 murders per year, and 800,000 law enforcement officers.[731] [732] [733]
* Books from academic publishers that address the topic of drawing conclusions based on comprehensive facts instead of anecdotes state:
* In 2018, the academic journal Social Psychological and Personality Science published a nationwide study that examined racial disparities in police use of deadly force. It found:
* A 1985 Supreme Court ruling (6 to 3) forbids police from using lethal force except in situations where there is a genuine risk of “death or serious physical injury.”[738] Roughly three police officers per year out of 800,000 are convicted of violating this standard.[739] [740]
* From 1980 to 2008, people of African descent comprised 13% of the U.S. population and committed 52% of all murders.[741]
* From 2003 to 2009, the U.S. Department of Justice recorded 2,876 cases in which people were killed by police and their races were reported. Among these, 33% were black.[742]
* From 2005 to 2019, prosecutors charged 111 police officers with murder or manslaughter resulting from an on-duty shooting, or an average of 7 per year.[743] Among the 95 cases completed by the end of 2019, each year an average of:
* In 2014, the editorial board of the New York Times claimed that:
* To support that accusation, the Times’ editorial board cited:
* In response to such statements, the authors of the ProPublica report wrote:
* Relative to the rates at which people of different races commit murder, police are less likely to use deadly force against black people than white people.[751] [752] [753]
* In 2016, the Washington Post published an article by Wesley Lowery claiming that:
* Among the four studies cited by Lowery, none of them examine correlations between murder and who is killed by police officers.[755] African Americans represented about:
* One of the studies cited by Lowery does not report the following results until its 20th page, and Lowery does not mention them at all:
* Another of the studies cited by Lowery uses an incomplete, crowd-sourced dataset that records 16 cases of civilians being shot by police in Houston, TX and surrounding areas from 2011 to 2014. During this period, at least 177 such shootings occurred in Houston alone.[764] [765]
* Three of the four studies cited by Lowery look for correlations using county-level or city-level crime data.[766] Per a 2015 paper in the journal Criminology and Public Policy, such data is “suboptimal” for studying correlations between race, violence, and police use of deadly force. This is because cities often contain diverse neighborhoods with major differences in “crime, demographic composition, and socioeconomic status,” and grouping such neighborhoods into a single dataset “masks” these disparities.[767] [768]
* As of 2015, two peer-reviewed studies had been conducted using sub-city data on violent crime rates and police use of deadly force. Each examines a single city, and both find correlations between crime levels and police shootings. One of these studies also examines racial data and finds that:
* George Washington Carver was born a slave near the end of the Civil War. He was not allowed to attend the school where he lived, because it only admitted white children.
* Around the age of 14, Carver discovered a school for black youth in a nearby town and left home to attend it. Over the next ten years, he worked to pay for his food and shelter while earning a high school diploma.
* Around the age of 24, Carver was accepted into a college and used nearly all of his savings to travel there. When he arrived, the principal told him there had been a “mistake.” Carver produced his letter of acceptance and replied, “Your letter said—I have it here.” The principal cut him off and stated, “I don’t care what it said. You didn’t tell me you were a Negro.”
* Carver worked for another five years before being accepted at another university. After his first year, he transferred to the nation’s leading agricultural college and graduated near the top of his class. He then stayed at the university for another two years and earned a master’s degree in agricultural and bacterial botany. Throughout his academic career, he labored long hours to earn his room, board and books.
* George Washington Carver is primarily known for developing hundreds of products derived from peanuts, but he is also responsible for many other important contributions to agriculture. He:
* In the early 1900’s, Thomas Edison offered Carver a job for over $100,000 a year, more than 65 times what he was earning. He declined this and many other lucrative offers to stay in his position at Tuskegee University for a period of 46 years, during which he declined every salary increase.
* While prodding Carver to take the high-income positions that were offered to him, several individuals said, “If you had all that money, you could help your people.” Carver replied, “If I had all that money, I might forget about my people.”
* Instead of accepting these positions, Carver helped those who asked for his expertise without charging them. He often spent hours per day answering the letters of major industrialists, farmers, and even individuals who had questions about their home gardens.
* Henry Ford described George Washington Carver as “the world’s greatest living scientist.”
* George Washington Carver wrote:
* In 1904, Branch Rickey was a 21 year-old baseball coach at Ohio Wesleyan. While on a road trip to play Notre Dame, a hotel clerk refused to give a room to Charles Thomas, the lone black player on Rickey’s team. This infuriated Rickey, and he ordered a cot for Thomas in his room.
* In 1942, Rickey became the general manager of the Brooklyn Dodgers. At the time, the league commissioner refused to allow blacks and whites to play together. Rickey instructed his scouts to watch the Negro leagues, and after a new commissioner was appointed, Rickey signed Jackie Robinson to the Dodger’s triple-A club in Montreal.
* When major league owners got word of Rickey’s intention to bring Jackie Robinson into the major leagues, they voted 15–1 to keep a “gentlemen’s agreement” banning blacks. Rickey responded by approaching the new commissioner, “Happy” Chandler, and gaining his support to let Robinson play.
* Rickey and Robinson received hundreds of death threats, and a number of the players on the Dodgers signed a petition against letting Robinson play.
* In April of 1947, Jackie Robinson became the first black player in the major leagues.
* In 1947, the Dodgers won the pennant, and Jackie Robinson was chosen as the Rookie of the Year in the National League.
* By 1958, every team in the major leagues was integrated.
* Rickey’s grandson said of him:
* In his office, Branch Rickey posted a sign on the wall that read:
* In the 1780s, William Wilberforce was a young member of the British Parliament who represented the biggest and most influential constituency in England. He was also a personal friend of the Prime Minister.
* At the age of 25, Wilberforce became an evangelical Christian, which compelled him to stand up on the floor of Parliament and denounce slavery. This stance caused him to lose his status as a political insider and to become the leader of a small minority in Parliament.
* Wilberforce’s political opponents argued that abolishing slavery would destroy thousands of jobs, result in revenue losses, and hurt the economy.
* Wilberforce and his allies worked twenty years for the abolition of the slave trade, printing and distributing brochures, circulating petitions, and giving speeches in churches and public places.
* In 1807, Parliament voted to outlaw the slave trade. In 1833, the same year that Wilberforce passed on, Parliament voted to abolish slavery throughout the British Empire.
* After Japan bombed Pearl Harbor in 1941, President Franklin Roosevelt authorized the military to put many Japanese civilians into internment camps to protect the U.S. against espionage and sabotage. He did this without requiring any proof that an individual was disloyal or a threat to the United States.
* Over the course of years, 110,000 people of Japanese descent—including 70,000 who were born in the United States—were detained in camps with barbed wire fences and armed guards. They were allowed to take limited belongings with them, and some lost everything they owned.
* During this era, Americans of Japanese descent were labeled as traitors and members of the “enemy race.”
* During World War II, a limited number of Japanese were allowed to volunteer for two segregated combat units. These units, the 100th Battalion and 442nd Regimental Combat Team, later merged and became the most decorated military unit of its size in the history of the United States.
* While fighting for the U.S., 700 men in this unit were killed in action. Members of this unit were awarded 9,486 Purple Hearts, 4,000 Bronze Stars, and 21 Medals of Honor.
[1] Textbook: Principles of Genetics (6th edition). By D. Peter Snustad & Michael J. Simmons. John Wiley & Sons, 2011.
Page 785:
Populations that are closely related share genetic properties that distantly related populations do not. Thus, by analyzing variation in genes, gene products, and DNA sequences, it is possible to determine the relatedness of different racial and ethnic groups, and to arrange them in a phylogenetic tree. …
Compared to other species, the humans species is genetically rather uniform. At the nucleotide level, humans have about one-fourth the genetic variation of chimpanzees and about one-tenth that of Drosophila. Furthermore, most of the genetic variation in the human species—perhaps 85 to 95 percent of it—is within rather than between populations.
[2] Teaching guide: “Human Genetic Variation.” National Institutes of Health, Biological Sciences Curriculum Study, 2007. <www.ncbi.nlm.nih.gov>
Page 4 (of PDF):
Furthermore, genetic variation around the world is distributed in a rather continuous manner; there are no sharp, discontinuous boundaries between human population groups. In fact, research results consistently demonstrate that about 85 percent of all human genetic variation exists within human populations, whereas about only 15 percent of variation exists between populations (Figure 4). That is, research reveals that Homo sapiens is one continuously variable, interbreeding species. Ongoing investigation of human genetic variation has even led biologists and physical anthropologists to rethink traditional notions of human racial groups. The amount of genetic variation between these traditional classifications actually falls below the level that taxonomists use to designate subspecies, the taxonomic category for other species that corresponds to the designation of race in Homo sapiens. This finding has caused some biologists to call the validity of race as a biological construct into serious question.
[3] Paper: “The First Korean Genome Sequence and Analysis: Full Genome Sequencing for a Socio-Ethnic Group.” By Sung-Min Ahn and others. Genome Research, September 2009. Pages 1622–1629. <www.ncbi.nlm.nih.gov>
Page 1622:
We present the first Korean individual genome sequence (SJK) and analysis results. … Despite a close similarity, significant differences were observed between the Chinese genome (YH), the only other Asian genome available, and SJK: (1) 39.87% (1,371,239 out of 3,439,107) SNPs [single nucleotide polymorphisms] were SJK-specific.…
Page 1625:
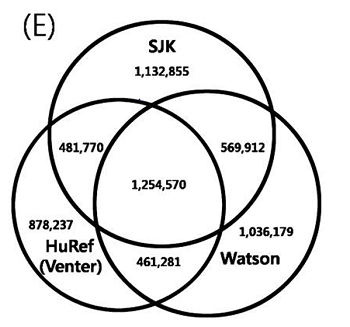
Figure 2. Comparisons of SNPs among … (E) SJK [Korean descent], HuRef [European descent], and Watson [European descent]….
NOTE: The diagram above depicts that the person of Korean descent has more SNPs in common with each person of European descent than the two people of European descent have with one another.
[4] Article: “Skin.” World Book Encyclopedia, 2007 Deluxe edition.
“The color of the skin varies greatly among population groups and individuals. Skin color depends mainly on the amount of the brown pigment melanin produced in the skin. Melanin is formed by the melanocytes in the epidermis. All people have about the same number of melanocytes.”
[5] Book: American Immigration: An Encyclopedia of Political, Social, and Cultural Change (2nd edition, Volume 1–4). Edited by James Ciment and John Radzilowski. Routledge, 2015. Article: “Census, U.S.” By Susan Wierzbicki. Pages 69–72.
Page 72:
In 1977, the federal government established guidelines for Hispanics, calling them an ethnic rather than a racial group, allowing a person to first identify as Latino or not and then to offer his or her racial identity. But many Latinos do not see themselves that way. In the 2010 census, more than a third of those who identified themselves as Hispanics then listed their race as neither “white” nor “black,” but “other.” As for multiracial individuals, the 2010 census included for the first time the option for people to identify themselves as belonging to more than one race.
[6] Article: “Fish Gene Sheds Light on Human Skin Color Variation.” Penn State, December 16, 2005. <www.sciencedaily.com>
The genetic determination of human skin color is one of biology’s enduring mysteries.
Previous studies on pigmentation have identified more than 100 genes involved in pigment production. … However, most of the genes responsible for normal differences in skin pigmentation remained unknown. The gene identified by Cheng’s team—called SLC24A5—previously had not been suspected to be involved in pigmentation.
[7] Paper: “Loci Associated with Skin Pigmentation Identified in African Populations.” By Nicholas G. Crawford and others. Science, November 17, 2017. Corrected 1/17/20. <science.sciencemag.org>
A genome-wide association study (GWAS) of 1,570 Africans identified variants significantly associated with skin pigmentation, which clustered in four genomic regions that together account for almost 30% of the phenotypic variation. …
Examining ethnically diverse African genomes, we identify variants in or near SLC24A5, MFSD12, DDB1, TMEM138, OCA2, and HERC2 that are significantly associated with skin pigmentation.
Skin Pigmentation Is a Complex Trait
To estimate the proportion of pigmentation variance explained by the top eight candidate SNPs [single nucleotide polymorphisms] at SLC24A5, MFSD12, DDB1/TMEM138, and OCA2/HERC2, we used a linear mixed model with two genetic random effect terms: one based on the genome-wide kinship matrix and the other based on the kinship matrix derived from the set of significant variants. About 28.9% (SE, 10.6%) of the pigmentation variance is attributable to these SNPs. Considering each locus in turn and all significantly associated variants (P < 5 × 10⁻⁸), the trait variation attributable to each locus is as follows: SLC24A5 (12.8%; SE, 3.5%), MFSD12 (4.5%; SE, 2.1%), DDB1/TMEM138 (2.2%; SE, 1.5%), and OCA2/HERC2 (3.9%; SE, 2.9%). Thus, ~29% of the additive heritability of skin pigmentation in Africans is due to variation at these four regions. …
By studying ethnically, genetically, and phenotypically diverse Africans, we identify novel pigmentation loci that are not highly polymorphic in European populations.
[8] Paper: “An Unexpectedly Complex Architecture for Skin Pigmentation in Africans.” By Alicia R. Martin and others. Cell, November 30, 2017. Pages 1340–1353. <www.cell.com>
Page 1349:
Most of the pigmentation variability in KhoeSan populations is not explained by previously identified loci, suggesting that more than 50 loci (and indeed, likely far more, given our genomic heritability estimates) with a distribution of mostly small effects contribute to variation in pigmentation in the KhoeSan. This suggests that skin pigmentation is a far more complex trait than previously discussed, analogous to numerous other complex traits discussed in biomedical literature.
[9] Paper: “Gene Mapping Study for Constitutive Skin Color in an Isolated Mongolian Population.” By Seung Hwan Paik and others. Experimental & Molecular Medicine, December 26, 2011. <www.nature.com>
The familial correlations between family pairs and heritability of MI [melanin index] are shown in Table 3. The familial correlation between parent and offspring was the largest (pair r = 0.52, SE = 0.08) and significant (P value < 0.0001). In addition, the correlation between siblings was also statistically significant (P value = 0.002). Notably, spouse correlations were not significant (P value = 0.971). Also, the heritability for MI was very high and statistically significant (h2 = 0.82, SE = 0.11; P value < 0.0001). The above results suggest a strong evidence for and importance of genetic factors in controlling skin color. …
We found parent–offspring and sibling correlations for MI level to be strongest while spouse pair correlation, representative of the effects of environmental sharing, were not significant (Table 3). The pattern of significant correlations between closer familial relationships supports genetically important effects. In previous studies, high heritability of human skin color was reported, ranging from 0.55 to 0.83 (Clark and others, 1981; Frisancho and others, 1981). Our heritability value of 0.82 is comparable (Table 3).
[10] Paper: “Genetic Architecture of Skin and Eye Color in an African-European Admixed Population.” By Sandra Beleza and others. PLoS Genetics, March 21, 2013. <journals.plos.org>
We study pigmentary variation in 699 individuals from Cape Verde, where extensive West African/European admixture has given rise to a broad range in trait values and genomic ancestry proportions. … We identify four major loci (SLC24A5 P = 5.4×10⁻²⁷, TYR P = 1.1×10⁻⁹, APBA2[OCA2] P = 1.5×10⁻⁸, SLC45A2 P = 6×10⁻⁹) for skin color that together account for 35% of the total variance, but the genetic component with the largest effect (∼44%) is average genomic ancestry. Our results suggest that adjacent cis-acting regulatory loci for OCA2 explain the relationship between skin and eye color, and point to an underlying genetic architecture in which several genes of moderate effect act together with many genes of small effect to explain ∼70% of the estimated heritability. …
Although eye color and skin color are correlated, their underlying genetic architecture in Cape Verde is very different. Beyond HERC2 (OCA2) and SLC24A5, individual genomic ancestry has relatively little effect on eye color. By contrast, the “rest of the genome” (beyond APBA2 (OCA2), GRM5-TYR, and SLC24A5) has a very strong influence on skin color, nearly twice that of all four single loci combined. … These observations also have important implications for potential forensic applications, and argue that efforts to predict pigmentary phenotype from genotype should be based on dense genotype and/or whole genome sequence information rather than small panels of SNPs [single nucleotide polymorphisms].
[11] Article: “What Controls Variation in Human Skin Color?” By Gregory S. Barsch. PLoS Biology, October 13, 2003. Updated 12/22/03. <journals.plos.org>
For any quantitative trait with multiple contributing factors, the most important questions are the overall heritability, the number of genes likely to be involved, and the best strategies for identifying those genes. For skin color, the broad sense heritability (defined as the overall effect of genetic vs. nongenetic factors) is very high (Clark and others 1981), provided one is able to control for the most important nongenetic factor, exposure to sunlight.
[12] Photos: “Black and White Twins Lucy and Maria Aylmer.” By Gary Roberts. Worldwide Features. Purchased September 24, 2020 at <www.worldwidefeatures.com.>
[13] Article: “Meet the Biracial Twins No One Believes Are Sisters.” By Chris Perez. New York Post, March 2, 2015. <nypost.com>
There’s a set of biracial twins in the UK [United Kingdom] who are turning heads because one is black and the other is white.
Born in 1997 to a white father and a half-Jamaican mother, the sisters have grown accustomed to getting mistaken for being just friends—and they have even had to produce their birth certificates in order to prove they are in fact related, Barcroft Media reports. …
“It was such a shock for her [the twins’ mother] because obviously things like skin color don’t show up on scans before birth,” Lucy said.
[14] Paper: “Effect of Race Upon Organ Donation and Recipient Survival in Liver Transplantation.” By Praga Pillay and others. Digestive Diseases and Sciences, November 1990. Pages 1391–1396. <www.ncbi.nlm.nih.gov>
Pages 1394–1395:
The genetic differences owing to race per se are not considered to be major, as the genetic variability within each race is greater than the variability between the races. Moreover, it has been variously estimated that black Americans have a 30–50% chance of having a white ancestor 10. Because of this fact and because of the findings in this study, the likelihood of graft failure solely as a result of the presence of a genetic difference between the race of the donor and recipient is not tenable. This conclusion is consistent with studies recently reported for renal transplantation from our center 11. Thus transplantation of organs across racial groups can be performed without fear of an additional problem occurring as a result of some inherent difference between the donor and recipient races. Our data indicate that the major problem in success of liver transplantation is the severity of the illness of the recipient immediately prior to the transplant.
[15] Webpage: “Testing for Racial Differences in the Mental Ability of Young Children.” Harvard University, Education Innovation. Accessed November 25, 2017 at <edlabs.harvard.edu>
Prior to this research, studies of the cognitive abilities of young children had been small-scale and rare. Using a newly available and nationally representative data set, the Early Childhood Longitudinal Survey Birth Cohort (ECLS-B), which includes data for over 10,000 children born in 2001, we were able to analyze a test of mental function for children aged eight to twelve months, to assess whether an achievement gap was present during the early months of childhood development.
[16] Webpage: “Roland G. Fryer, Jr.” University of Chicago. Accessed November 25, 2017 at <scholar.harvard.edu>
Roland G. Fryer, Jr. is the Henry Lee Professor of Economics at Harvard University and faculty director of the Education Innovation Laboratory (EdLabs). Fryer’s research combines economic theory, empirical evidence, and randomized experiments to help design more effective government policies. His work on education, inequality, and race has been widely cited in media outlets and Congressional testimony.
[17] Webpage: “Steven D. Levitt.” Harvard University. Accessed November 25, 2017 at <pricetheory.uchicago.edu>
Steve Levitt is the William B. Ogden Distinguished Service Professor of Economics at the University of Chicago, where he directs the Becker Center on Chicago Price Theory.
Levitt received his BA from Harvard University in 1989 and his PhD from MIT in 1994. He has taught at Chicago since 1997.
[18] Paper: “Testing for Racial Differences in the Mental Ability of Young Children.” By Roland G. Fryer Jr. and Steven D. Levitt. American Economic Review, April 2013. Pages 981–1005. <www.aeaweb.org>
Abstract:
On tests of intelligence, Blacks systematically score worse than Whites. Some have argued that genetic differences across races account for the gap. Using a newly available nationally representative data set that includes a test of mental function for children aged eight to twelve months, we find only minor racial differences in test outcomes (0.06 standard deviation units in the raw data) between Blacks and Whites that disappear with the inclusion of a limited set of controls. Relative to Whites, children of all other races lose ground by age two. We confirm similar patterns in another large, but not nationally representative data set. A calibration exercise demonstrates that the observed patterns are broadly consistent with large racial differences in environmental factors that grow in importance as children age. Our findings are not consistent with the simplest models of large genetic differences across races in intelligence, although we cannot rule out the possibility that intelligence has multiple dimensions and racial differences are present only in those dimensions that emerge later in life.
NOTE: A video of Dr. Fryer discussing the findings of this study and others is available here (begins at 12:45).
[19] Paper: “The M Street High School, 1891–1916.” By Henry S. Robinson. Records of the Columbia Historical Society, 1984. Pages 119–143. <www.jstor.org>
Page 119:
Though the “separate but equal doctrine” was in force regarding the public schools of the southern and border states until May 1954, the segregated system of Washington, D.C., was unique in that it provided excellent educational opportunities for its black youth. …
In November 1870 Congress established the Preparatory High School for Negro Youth. Originally it was hardly more than an advanced grammar school laboring under the disadvantages of an inadequate faculty, overcrowding, and dropouts. But gradually the high school’s curriculum improved through the efforts of strong principals.
Page 120:
Between September 1891 and September 1916 M Street High graduated a multitude of young men and women. Many of these graduates achieved prominence in the local Washington community, others in the national and international communities, while a few ranked among the first Afro-Americans to obtain eminence in their respective professions. Of these professions we can cite business, dentistry, education, law, medicine, the military, music, and teaching.
Page 122: “In 1899 the pupils of the M Street High School scored higher than the students of the white Eastern and Western high schools on standardized tests in English and general subjects.”
[20] Article: “Brooklyn School Scores High Despite Poverty.” By Sharon Otterman. New York Times, April 25, 2010. <www.nytimes.com>
… 80 percent of its [Public School 172’s] students are poor enough to qualify for free lunch, nearly a quarter receive special education services, and many among its predominately Hispanic population do not speak English at home.
In 2009, the 580-student primary school … topped the city with its fourth-grade math scores, with all students passing, all but one with a mark of “advanced,” or Level 4. In English, all but one of 75 fourth graders passed, earning a Level 3 or 4, placing it among the city’s top dozen schools.
On average, at schools with the same poverty rate, only 66 percent of the students pass the English test, and 29 percent score at an advanced level in math….
… [T]he school’s cost per pupil, in fact, is lower than the city’s average. … While about one-third of the students are still learning English, there are no bilingual classes.
[21] Report: “The Secret Shame: How America’s Most Progressive Cities Betray Their Commitment to Educational Opportunity for All.” Brightbeam, January 2020. <brightbeamnetwork.org>
Page 10:
A Snapshot of Our Approach:
1. Identified Progressive vs Conservative Cities.
We identified the 12 most progressive and 12 most conservative cities using an established study by Chris Tausanovitch and Christopher Warshaw ranking American cities. Plus, if you live in one of them, you’re probably nodding in agreement.
2. Analyzed Achievement Gaps From Publicly Available Data
We pulled available public achievement and graduation rate data from public school districts in these cities and looked at gaps — rather than rates — to account for potential bias.
[22] Webpage: “About Brightbeam.” Accessed November 3, 2020 at <brightbeamnetwork.org>
“Board of Directors … Arne Duncan”
[23] Article: “Arne Duncan, Ninth U.S. Education Secretary: Biography and Achievements.” Education Week, August 18, 2017. <www.edweek.org>
“Duncan served as the education secretary for most of President Barack Obama’s two terms.”
[24] Report: “The Secret Shame: How America’s Most Progressive Cities Betray Their Commitment to Educational Opportunity for All.” Brightbeam, January 2020. <brightbeamnetwork.org>
Page 5: “Students in America’s most progressive cities face greater racial inequity in achievement and graduation rates than students living in the nation’s most conservative cities. … We do not make a claim as to why progressive cities appear to have significantly larger gaps in student achievement.”
Page 6: “Our research shows that there are U.S. cities where little to no gaps exist. Those cities happen to be conservative. “
Page 11: “Unacceptable racial achievement gaps in our public education system are prevalent just about everywhere, from the most conservative cities to the least and everything in between.”
[25] Report: “The Secret Shame: How America’s Most Progressive Cities Betray Their Commitment to Educational Opportunity for All.” Brightbeam, January 2020. <brightbeamnetwork.org>
Page 11:
In contrast, three of the 12 conservative cities—Virginia Beach, Anaheim, and Fort Worth—have effectively closed the gap in at least one of the academic categories we looked at, literally achieving a gap of zero or one. The politically conservative Oklahoma City has even turned the tables on our typical thinking about race-based gaps. There, students of color outperform white students on high school graduation rates.
[26] Report: “The Secret Shame: How America’s Most Progressive Cities Betray Their Commitment to Educational Opportunity for All.” Brightbeam, January 2020. <brightbeamnetwork.org>
Page 5:
We Tried to Explain It Away, But We Couldn’t
There are many factors that contribute to student success, and while we could not control for all of them we did our best to consider the best explanations larger racialized gaps in progressive cities. For instance, progressive cities like New York and Chicago are much larger than any of the conservative cities we studied. We thought controlling for population size in our data might reveal that as a predictor for larger gaps. But it didn’t.
Page 14:
But our results demonstrate that there is a negative difference between our most progressive and most conservative cities, and it can’t be explained away by factors such as city size, racial demographics, spending, poverty or income inequality. In cities where most of the residents identify as political progressives, educational outcomes for marginalized children lag at a greater rate than other cities.
[27] Report: “The Secret Shame: How America’s Most Progressive Cities Betray Their Commitment to Educational Opportunity for All.” Brightbeam, January 2020. <brightbeamnetwork.org>
Page 14:
But our results demonstrate that there is a negative difference between our most progressive and most conservative cities, and it can’t be explained away by factors such as city size, racial demographics, spending, poverty or income inequality. In cities where most of the residents identify as political progressives, educational outcomes for marginalized children lag at a greater rate than other cities.
That finding is stable no matter how we looked at the data. The biggest predictor for larger educational gaps was whether or not the city has a progressive population.
[28] Report: “The Secret Shame: How America’s Most Progressive Cities Betray Their Commitment to Educational Opportunity for All.” Brightbeam, January 2020. <brightbeamnetwork.org>
Page 9:
When we look at the data for public schools in the 12 most progressive and the 12 most conservative cities, we find that while all students have roughly the same proficiency rates (i.e., students in progressive cities perform slightly better, on average, than students in conservative cities on reading and slightly worse in math), the black-white and Latino-white gaps in math proficiency were, on average, 15 percentage points greater in progressive cities.
Page 13: “Yet, spending is actually much higher in most progressive cities with large gaps than in conservative cities with small or negligible gaps, so that doesn’t explain it either.”
[29] Report: “The Secret Shame: How America’s Most Progressive Cities Betray Their Commitment to Educational Opportunity for All.” Brightbeam, January 2020. <brightbeamnetwork.org>
Page 5: “It is important to point out, though, that while this report shines a bright light on a striking correlation, it makes no claim as to causation. We do not make a claim as to why progressive cities appear to have significantly larger gaps in student achievement.”
[30] Book: Introductory Econometrics: Using Monte Carlo Simulation with Microsoft Excel. By Humberto Barreto and Frank M. Howland. Cambridge University Press, 2006.
Page 43:
Association Is Not Causation
A second problem with the correlation coefficient involves its interpretation. A high correlation coefficient means that two variables are highly associated, but association is not the same as causation.
This issue is a persistent problem in empirical analysis in the social sciences. Often the investigator will plot two variables and use the tight relationship obtained to draw absolutely ridiculous or completely erroneous conclusions. Because we so often confuse association and causation, it is extremely easy to be convinced that a tight relationship between two variables means that one is causing the other. This is simply not true.
[31] Article: “Stephen Jay Gould, 60, Is Dead; Enlivened Evolutionary Theory.” By Carol Kaesuk Yoon. New York Times, May 20, 2002. <www.nytimes.com>
“One of the most influential evolutionary biologists of the 20th century and perhaps the best known since Charles Darwin…. In 1967, he received a doctorate in paleontology from Columbia University and went on to teach at Harvard, where he would spend the rest of his career.”
[32] Book: On the Origin of Species by Means of Natural Selection, or the Preservation of Favoured Races in the Struggle for Life. By Charles Darwin. John Murray, 1859. <www.literature.org>
[33] Book: Ontogeny and Phylogeny. By Stephen Jay Gould. Belknap Press of Harvard University Press, 1977.
Page 127: “Biological arguments for racism may have been common before 1859, but they increased by orders of magnitude following the acceptance of evolutionary theory.”
[34] Book: The Descent of Man, and Selection in Relation to Sex. By Charles Darwin. John Murray, 1871.
Page 193:
At some future period, not very distant as measured by centuries, the civilized races of man will almost certainly exterminate, and replace, the savage races throughout the world. At the same time the anthropomorphous apes … will no doubt be exterminated. The break between man and his nearest allies will then be wider, for it will intervene between man in a more civilized state, as we may hope, even than the Caucasian, and some ape as low as a baboon, instead of as now between the negro or Australian and the gorilla.
[35] Article: “Thomas Henry Huxley.” By Adrian J. Desmond. Encyclopædia Britannica. Last updated April 30, 2021. <www.britannica.com>
“Thomas Henry Huxley, (born May 4, 1825, Ealing, Middlesex, England—died June 29, 1895, Eastbourne, Sussex), English biologist, educator, and advocate of agnosticism (he coined the word). Huxley’s vigorous public support of Charles Darwin’s evolutionary naturalism earned him the nickname ‘Darwin’s bulldog….’ ”
[36] Book: Lay Sermons, Addresses, and Reviews. By Thomas Henry Huxley. D. Appleton and Company, 1872.
Pages 20–21:
Quashie’s plaintive inquiry, “Am I not a man and a brother?” seems at last to have received its final reply—the recent decision of the fierce trial by battle on the other side of the Atlantic [i.e., the U.S. Civil War] fully concurring with that long since delivered here in a more peaceful way.
The question is settled; but even those who are most thoroughly convinced that the doom is just, must see good grounds for repudiating half the arguments which have been employed by the winning side; and for doubting whether its ultimate results will embody the hopes of the victors, though they may more than realize the fears of the vanquished. It may be quite true that some negroes are better than some white men; but no rational man, cognizant of the facts, believes that the average negro is the equal, still less the superior, of the average white man. And, if this be true, it is simply incredible that, when all his disabilities are removed, and our prognathous [having a projecting lower jaw] has a fair field and no favor, as well as no oppressor, he will be able to compete successfully with his bigger-brained and smaller-jawed rival, in a contest which is to be carried on by thoughts and not by bites. The highest places in the hierarchy of civilization will assuredly not be within the reach of our dusky cousins, though it is by no means necessary that they should be restricted to the lowest. But whatever the position of stable equilibrium into which the laws of social gravitation may bring the negro, all responsibility for the result will henceforward lie between Nature and him. The white man may wash his hands of it, and the Caucasian conscience be void of reproach for evermore. And this, if we look to the bottom of the matter, is the real justification for the abolition policy.
[37] “Address Delivered Before the British Association Assembled at Belfast, With Additions, 1874.” By John Tyndall. <www.victorianweb.org>
[T]here is an emotion of the intellect incident to the discernment of new truth which often colours and warms the pages of Mr. Darwin. His success has been great; and this implies not only the solidity of his work, but the preparedness of the public mind for such a revelation. …
Throughout this application and extension of the “Law of Inseparable Association,” Mr. Spencer stands upon his own ground, invoking, instead of the experiences of the individual, the registered experiences of the race. His overthrow of the restriction of experience to the individual is, I think, complete. That restriction ignores the power of organizing experience furnished at the outset to each individual; it ignores the different degrees of this power possessed by different races and by different individuals of the same race. Were there not in the human brain a potency antecedent to all experience, a dog or cat ought to be as capable of education as a man. These predetermined internal relations are independent of the experiences of the individual. The human brain is the “organised register of infinitely numerous experiences received during the evolution of life, or rather during the evolution of that series of organisms through which the human organism has been reached. The effects of the most uniform and frequent of these experiences have been successively bequeathed, principal and interest, and have slowly mounted to that high intelligence which lies latent in the brain of the infant. Thus it happens that the European inherits from twenty to thirty cubic inches more of brain than the Papuan. Thus it happens that faculties, as of music, which scarcely exist in some inferior races, become congenital in superior ones. Thus it happens that out of savages unable to count up to the number of their fingers, and speaking a language containing only nouns and verbs, arise at length our Newtons and Shakespeares.”
[38] Article: “Abscheulich! (Atrocious!)” By Stephen J. Gould. Natural History, March 2000. Pages 42–49.
Page 24: “[Haeckel’s books] surely exerted more influence than the works of any other scientist, including Darwin and Huxley (by Huxley’s own frank admission), in convincing people about the validity of evolution.”
[39] Article: “Stephen Jay Gould, 60, Is Dead; Enlivened Evolutionary Theory.” By Carol Kaesuk Yoon. New York Times, May 21, 2002. <www.nytimes.com>
“One of the most influential evolutionary biologists of the 20th century and perhaps the best known since Charles Darwin…. In 1967, he received a doctorate in paleontology from Columbia University and went on to teach at Harvard, where he would spend the rest of his career.”
[40] Article: “Ernst Heinrich Phillip August Haeckel.” Encyclopedia of World Biography, Volume 7. Gale, 1998.
Page 61: [I]n the late 19th and early 20th centuries, he was as famous as Charles Darwin….”
Page 62: “Throughout his life he received many honors and was elected to many scientific societies….”
[41] Book: The Descent of Man, and Selection in Relation to Sex (2nd edition). By Charles Darwin. John Murray, 1890.
Pages 2–3:
The sole object of this work is to consider, firstly, whether man, like every other species, is descended from some pre-existing form; secondly, the manner of his development; and thirdly, the value of the differences between the so-called races of man. …
… This last naturalist [Haeckel], besides his great work, “Generelle Morphologie” (1866), has recently (1868, with a second edition in 1870), published his “Naturliche Schopfungsgeschichte,” in which he fully discusses the genealogy of man. If this work had appeared before my essay had been written, I should probably never have completed it. Almost all the conclusions at which I have arrived I find confirmed by this naturalist, whose knowledge on many points is much fuller than mine.
[42] Book: The Evolution of Man: A Popular Exposition of the Principal Points of Human Ontogeny and Phylogeny (Volume 2). By Ernst Haeckel. D. Appleton and Company, 1896. Translated from the German book entitled Anthropogenie, which was first published in 1874.
Page 170: “Apes, on the contrary, can grasp in this way with the hind-foot as well as the fore-foot, and were therefore regarded as four-handed. Many tribes, however, among the lower races of men, especially many negro tribes, use the foot in the same way as the hand.”
Between pages 180 and 181:
[43] Book: The History of Creation: Or the Development of the Earth and Its Inhabitants by the Action of Natural Causes (Volume 2). By Ernst Haeckel. Translated by E. Ray Lankester. D. Appleton and Company, 1879. From German edition of the book entitled Naturliche Schöpfungsgeschichte (4th edition), 1873. The first edition was in 1868.
Page 313: “The color of the skin of the genuine Negroes is always more of less of a pure black. Their skin is velvety to the touch, and characterized by a peculiar offensive exhalation.”
Page 314:
The lowest stage of all straight-haired men, and on the whole perhaps all of the still living human species, is occupied by the Australian, or Austral-negro (Homo Australis). This species seems to be exclusively confined to the large island of Australia; it resembles the genuine African Negro by its black or brownish black hair, and the offensive smell of the skin, by its very slanting teeth and long-headed form of the skull, the receding forehead, broad nose, protruding lips, and also by the entire absence of calves.
[44] Book: The History of Creation: Or the Development of the Earth and Its Inhabitants by the Action of Natural Causes (Volume 2). By Ernst Haeckel. Translated by E. Ray Lankester. D. Appleton and Company, 1879. From German edition of the book entitled Naturliche Schöpfungsgeschichte (4th edition), 1873. The first edition was in 1868.
Page 321:
The Caucasian, or Mediterranean man (Homo Mediterraneus), has from time immemorial been placed at the head of all races of men, as the most highly developed and perfect. It is generally called the Caucasian race, but as, among all the varieties of the species, the Caucasian branch is the least important, we prefer the much more suitable appellation proposed by Friedrich Muller, namely, that of Mediterranese. For the most important varieties of this species, which are moreover the most eminent actors in what is called “Universal History,” first rose to a flourishing condition on the shores of the Mediterranean. The former area of the distribution of this species is ex pressed by the name “Indo-Atlantic,” whereas at present it is spread over the whole earth, and is overcoming most of the other species in the struggle for existence. In bodily as well as in mental qualities, no other human species can equal the Mediterranean. This species alone (with the exception of the Mongolian) has had an actual history; it alone has attained to that degree of civilization which seems to raise man above the rest of nature.
Page 322: “[W]e must assume within this one species four different races, which are only connected at their root.”
Page 323: “Lastly, the Indo-Germanic race, which has far surpassed all the other races of men in mental development, separated at a very early period, like the Semitic, into two diverging branches, the Ario-Romaic and the Slavo-Germanic branches.”
[45] Paper: “Civic Biology and the Origin of the School Antievolution Movement.” By Adam Shapiro. Journal of the History of Biology, September 1, 2008. Pages 409–433. <link.springer.com>
Pages 409–410:
The creation of “civic biology” curricula in the late 1910’s and early 20’s, spearheaded by a close-knit community of textbook authors, brought evolution into the high school classroom as part of a complete reshaping of “biology” as a school subject. It also incorporated progressive ideologies about the purposes of compulsory public education in shaping society, and civic biology was fundamentally focused on the applications of the life sciences to human life. …
When the American Book Company (ABC) first published George W. Hunter’s Civic Biology in 1914, its editors had no way of anticipating the Scopes trial.
Page 420:
The Civic Biology, with its pedagogical novelty and the weight of the American Book Company’s sales machinery behind it, was quickly a success. With most schools adopting books every few years, by the end of the decade it was the best-selling biology book (even securing adoption in Boston). In the textbook industry, success led to imitation and other publishers brought out textbooks that similarly reorganized biology around social principles.
[46] Article: “The Lingering Impact of the Scopes Trial on High School Biology Textbooks.” By Randy Moore. BioScience, September 2001. Pages 790–796. <www.bioone.org>
Page 791:
In 1925 in Dayton, Tennessee, John Scopes was a coach and substitute science teacher at Rhea County High School. Students in a biology class that he taught used a textbook entitled A Civic Biology: Presented in Problems by George William Hunter (Hunter 1914). On 23 April, Scopes assigned the evolution chapter, but didn’t teach his students about the topic because he missed school the next day because of illness (i.e., Scopes was not even in school on the day listed on the indictment that led to his trial; he merely assigned the offending pages as part of a review for an exam; Larson 1997). Hunter made clear his view that evolution was a reality; he used the word evolution, and credited the theory of evolution to Darwin. The textbook by Hunter, a former biology teacher, was the state-approved text in Tennessee high schools (Dayton schools had used the book since 1919). Hunter’s book—oriented toward public health rather than theoretical biology—was also blatantly racist; in its discussion of five races of humans, Hunter concluded that “the Caucasians represented by the civilized white inhabitants of Europe and America” were “the highest type of all.” Hunter’s book was a bestseller, despite the fact that it included sections entitled “The Doctrine of Evolution,” “Evolution of Man,” and “Charles Darwin and Natural Selection.”
[47] Textbook: A Civic Biology: Presented in Problems. By George W. Hunter. American Book Company, 1914. <ia800304.us.archive.org>
Page 196:
At the present time there exist upon the earth five races or varieties of man, each very different from each other in instincts, social customs, and, to an extent, in structure. There are the Ethiopian or negro type, originating in Africa; the Malay or brown race, from the islands of the Pacific; the American Indian; the Mongolian or yellow race, including the natives of China, Japan and the Eskimos; and finally, the highest type of all, the Caucasians, represented by the civilized white inhabitants of Europe and America.
[48] Book: A Study of American Intelligence. By Carl C. Brigham (Assistant Professor of Psychology, Princeton University). Foreword by Robert M. Yerkes (Chairman, Research Information Service: National Research Council). Princeton University Press, 1923. <archive.org>
The essential point is that there are 10,000,000 negroes here now and that the proportion of mulattoes to a thousand blacks has increased with alarming rapidity since 1850.
According to all evidence available, then, American intelligence is declining, and will proceed with an accelerating rate as the racial admixture becomes more and more extensive. The decline of American intelligence will be more rapid than the decline of the intelligence of European national groups, owing to the presence here of the negro. These are the plain, if somewhat ugly, facts that our study shows. The deterioration of American intelligence is not inevitable, however, if public action can be aroused to prevent it. There is no reason why legal steps should not be taken which would insure a continuously progressive upward evolution.
[49] Book: Theory in Africa, Africa in Theory: Locating Meaning in Archaeology. Edited by Stephanie Wynne-Jones and Jeffrey Fleisher. Routledge, 2015.
Chapter 2: “African Models in Global Histories.” By Scott MacEachern. Pages 9–37.
Pages 24–25:
[T]here remains a significant body of modern scientific literature that continues explicitly to place Africans in a timeless past. Much of this literature is situated in the disciplines of psychology and psychometrics, and in related fields like criminology and economics. … However, beliefs about the cognitive inferiority of Africans are more widespread in comparative and evolutionary psychology, to a significant degree because of a set of studies of “national intelligence” (consolidated IQ test score results from different countries), undertaken over the last decade by Richard Lynn and collaborators (Lynn and Vanhanen 2002; Lynn 2007, 2008) and which are directly derived front Lynn’s earlier writings on racial science and the racial inferiority of Africans (see for example Lynn 1991, 1996). These studies claim that sub-Saharan African populations have, on average, very low intelligence, such that the average intellectual level on the continent would be one of severe cognitive challenge (MacEachern 2006).
The trajectory of research initiatives using these studies on “national intelligence” has been interesting. Some of this work has involved straightforward applications of medical science and evolutionary psychology that somehow manage to evade or ignore without questioning the issue of whether the continent of Africa is really inhabited by people so much less intelligent than those living in other parts of the world (cf. Eppig and others 2010; Daniels and Ostoni 2013). Other research work toward more deliberately ideological ends, seeking to prove that Africans are less culturally advanced, more violent and indeed less evolved (in both the evolutionary and the intellectual sense) than are any other human continental populations (Itzkol 1991; Rushton 2000, 2004a; Kanazawa 2006; Lynn 2007; Templer 2008; Wrigh 2009; Lynn and Vanhanen 2002). Such work often makes vulgarized appeals to the concept of the environment of evolutionary adaptedness, claiming that the evolution of humans in Africa renders modern Africans less fit for life in the modern world—an ironic reversal of early twentieth-century disbelief that our species, Homo sapiens, could have originated on a continent as benighted as Africa.
The evidentiary basis of these research programmes is extremely poor (Lieberman 2001; Graves 2002; Peregrine and others 2003; MacEachern 2006; Dickens and others 2007; Wicherts and others 2009), and indeed open to parody (Westling 2011), but a number of these studies have been widely quoted and have proven to be extremely popular in public discourse. The all-purpose accusation of “political correctness” as a means of deflecting criticism of the research has proven to be very useful in this regard. Closer to archaeology, mass-market books like The 10,000 Year Explosion (Cochran and Harpending 2009) assume throughout that Africans (as well as a number of other aboriginal populations) have been left behind culturally and evolutionarily in the course of recent human evolutionary adaptation. Unsurprisingly, both authors are sympathetic to Philippe Rushton and other believers in the evolutionary and cultural inferiority of Africans. It is thus by no means outside the mainstream in some fields of scientific research to claim that Africans are cognitively and/or culturally inferior specimens of humanity not fully evolved from earlier forms or left behind in the course of recent and rapid biological and cultural evolution.
[50] Book: Theory in Africa, Africa in Theory: Locating Meaning in Archaeology. Edited by Stephanie Wynne-Jones and Jeffrey Fleisher. Routledge, 2015.
Chapter 2: “African Models in Global Histories.” By Scott MacEachern. Pages 9–37.
Pages 24–25:
[T]here remains a significant body of modern scientific literature that continues explicitly to place Africans in a timeless past. Much of this literature is situated in the disciplines of psychology and psychometrics, and in related fields like criminology and economics. … However, beliefs about the cognitive inferiority of Africans are more widespread in comparative and evolutionary psychology, to a significant degree because of a set of studies of “national intelligence” (consolidated IQ test score results from different countries), undertaken over the last decade by Richard Lynn and collaborators (Lynn and Vanhanen 2002; Lynn 2007, 2008) and which are directly derived front Lynn’s earlier writings on racial science and the racial inferiority of Africans (see for example Lynn 1991, 1996). These studies claim that sub-Saharan African populations have, on average, very low intelligence, such that the average intellectual level on the continent would be one of severe cognitive challenge (MacEachern 2006).
The trajectory of research initiatives using these studies on “national intelligence” has been interesting. Some of this work has involved straightforward applications of medical science and evolutionary psychology that somehow manage to evade or ignore without questioning the issue of whether the continent of Africa is really inhabited by people so much less intelligent than those living in other parts of the world (cf. Eppig and others 2010; Daniels and Ostoni 2013). Other research work toward more deliberately ideological ends, seeking to prove that Africans are less culturally advanced, more violent and indeed less evolved (in both the evolutionary and the intellectual sense) than are any other human continental populations (Itzkol 1991; Rushton 2000, 2004a; Kanazawa 2006; Lynn 2007; Templer 2008; Wrigh 2009; Lynn and Vanhanen 2002). Such work often makes vulgarized appeals to the concept of the environment of evolutionary adaptedness, claiming that the evolution of humans in Africa renders modern Africans less fit for life in the modem world….
[51] Book: History of the Transmission of Ancient Books to Modern Times Together with the Process of Historical Proof. By Isaac Taylor. Haskell House, 1971. First published in 1875.
Page 92:
[I]t was the fall of Constantinople in 1453 which filled the Italian cities with these learned strangers. The Italians of that age needed only to receive this kind of direction, and to be aided by these means of study; for they had for some time been placed under those peculiar circumstances which have ever proved the most favorable to the advancement of the human mind. Throughout a number of independent states—crowded upon a narrow space, the same language, yet diversified by dialects, was spoken. The energy, the rivalry, the munificence that accompany an active commerce kept the whole mass of society in movement….
[52] Commentary: “Genes and Racism.” By Thomas Sowell (Ph.D. in Economics). Jewish Word Review, April 23, 2013. <jewishworldreview.com>
[P]eople with the geographic handicap of living in isolated mountain valleys have seldom, if ever, produced world-class achievements that advanced science, technology or philosophy. On the contrary, people in such places have almost invariably lagged behind the progress in the rest of the world—including people of the very same race living on the plains below. Mountaineers were long noted for their poverty and backwardness in countries around the world, especially in the millennia before modern transportation and communication eased their isolation.
People geographically isolated on islands far from the nearest mainland or people isolated by deserts or other geographic features have likewise seldom kept up with the progress of others. Again, this was especially so before modern transportation and communication put them more in touch with the rest of the world.
Conversely, urbanized peoples have often been in the vanguard of progress, producing far more of the historic advances of the human race than a similar number of people scattered out in the hinterlands—even when both were of the same race.
Geography has been a factor in this as well, since not all geographic areas are equally suitable for building big cities. The overwhelming majority of cities have been built on navigable waterways, for example—and not all regions have navigable waterways available.
Isolation can be man-made, as well as created by nature. Centuries ago, when China was the most advanced nation in the world, its leaders decided to isolate the country from other peoples, all of whom they regarded as barbarians. After a few centuries of isolation, China was shocked to find itself overtaken by others, and to some extent at the mercy of those others.
[53] Book: The Geography of Transport Systems. By Jean-Paul Rodrigue, Claude Comtois, and Brian Slack. Routledge, 2006.
Page 14:
Waterways were the most efficient transport systems available and cities next to rivers were able to trade over longer distances and maintain political, economic and cultural cohesion over a larger territory. It is not surprising to find that the first civilizations emerged along river systems for agricultural but also for trading purposes (Tigris-Euphrates, Nile, Indus, Ganges, Huang He).
[54] Book: An Economic History of West Africa. By A. G. Hopkins. Taylor and Francis, 1973.
Page 72:
Communications by land were based entirely on animal and human power. One of the greatest transport innovations of the pre-colonial era was the introduction of the camel. This extraordinary animal was the principal means of transport in the desert for almost two thousand years. It was present in North Africa in the first century B.C., and it became known throughout the Sahara during the early centuries of the Christian era. The camel was more efficient in desert conditions than were horses and oxen, which had been used previously, and its supremacy remained unchallenged until the coming of the motor car in the 1920s. …
Water transport was used where possible, for it was known to be the cheapest means of transporting bulky commodities over long distances. However, many West African rivers were hard to navigate: a number had dangerous rapids; some were flooded during the rainy season; and others lacked water in the dry season.
Page 73:
Foodstuffs and other items of everyday use could rarely be transported far beyond the area of production by any means of carriage. The case of Timbuctu is an exception which proves the rule, for the city was able to use the relatively cheap Niger route and could also pay for imported supplies from foreign trade earnings. Even so, in the nineteenth century the price of imported cloth at Timbuctu was two to three and a half times as great as it was on the coast. Kola nuts, which today are common items of consumption, were a luxury enjoyed by the relatively wealthy in the pre-colonial period. In the late nineteenth century one kola nut bought at Gonja, in the area of production, for five cowries sold for 250–300 cowries by the time it reached Lake Chad (about 1,250 miles away).169
Page 74:
In two areas of West Africa environmental circumstances meant that there was little scope for wheeled transport. On the sand and rock of the Sahara the camel was a more efficient means of carriage, so much so that it replaced the wheel at an early date. In the forest the difficulty of keeping draught animals greatly reduced the value of wheeled vehicles. In the Western Sudan, however, both horses and oxen were present, and wheeled transport would have been possible. The problem in this case was that the gain from greater traction would have been nullified by the capital and maintenance costs of carts, wagons and draught animals, and by the slower rate of progress of wheeled vehicles. Since draught animals were not used on the farm, the cost of keeping them solely for transport purposes during the dry season was much higher than in other parts of the world, where there was scope for combining the two functions.
[55] Commentary: “Unequal Outcomes.” By Walter E. Williams (Ph.D. in Economics). Jewish Word Review, August 26, 1998. <www.jewishworldreview.com>
It doesn’t take much to convince me that Dr. Thomas Sowell, senior fellow at the Hoover Institution, must write with both hands. His most recent book, the last of a trilogy, Conquests and Cultures, is a masterpiece of research and thought. …
Let’s look at just geography. Africa is more than twice the size of Europe, but it has a shorter coastline. The European coastline constantly twists and turns, creating innumerable natural harbors, while the African coastline is smooth, with few harbors. Sowell asks how surprising it should be that international trade has played a smaller role in the economic history of Africa than of Europe, especially Western Europe. Less trade produces more isolation. No great civilization developed in isolation. …
Historically, large cities, as economic centers, emerged along navigable rivers and harbors. In the United States, it’s no accident that cities like Boston, New York, Philadelphia, Chicago, St. Louis, New Orleans and San Francisco are our old cities, and those like Denver, Phoenix and Kansas City are relatively new and didn’t become major cities until railroads and trucks were invented. Historically, water has been the cheapest way to ship goods. During the 1700s, it was cheaper to ship a ton of goods from London to Philadelphia than from Philadelphia to Lancaster, Pa., a mere 60 miles away.
In Western Europe and the United States, there are navigable rivers gently flowing hundreds of miles, connecting wide areas both culturally and economically. That’s not true in Africa. The rivers of tropical Africa plunge a 1,000 feet or more on their way to the sea, with waterfalls and cascades making them navigable for only tiny distances. In Western Europe and the United States, regular rainfall and melting snows keep rivers flowing year round, but Africa has neither, so rivers rise and fall dramatically, further limiting their usefulness.
[56] Calculated with data from “Total Population (Both Sexes Combined) by Region, Subregion and Country, Annually for 1950–2100 (Thousands).” United Nations, Population Division, Department of Economic and Social Affairs, August 2019. <population.un.org>
“2020 … World [=] 7,794,799” … Africa [=] 1,340,598”
CALCULATION: 1,340,598,000 / 7,794,799,000 = 17%
[57] Webpage: “The African Language Program at Harvard.” Harvard University Department of African and African American Studies. Accessed June 25, 2021 at <alp.fas.harvard.edu>
“With anywhere between 1,000 and 2,000 languages, Africa is home to approximately one-third of the world’s languages.”
[58] Commentary: “Unequal Outcomes.” By Walter E. Williams (Ph.D. in Economics). Jewish Word Review, August 26, 1998. <www.jewishworldreview.com>
It doesn’t take much to convince me that Dr. Thomas Sowell, senior fellow at the Hoover Institution, must write with both hands. His most recent book, the last of a trilogy, Conquests and Cultures, is a masterpiece of research and thought. …
Geographical disparities may be suggestive of the many ways that physical settings have restricted the cultural universe available to different peoples. One revealing indication of isolation and the resulting cultural fragmentation is that African peoples are 10 percent of the world’s population but have one-third of the world’s languages.
[59] Article: “Slavery.” By Richard Hellie. Encyclopædia Britannica. Last updated August 24, 2020. <www.britannica.com>
Slavery is known to have existed as early as the Shang dynasty (18th–12th century BCE) in China. … Slavery continued to be a feature of Chinese society down to the 20th century. …
Korea had a very large slave population, ranging from a third to half of the entire population for most of the millennium between the Silla period and the mid-18th century. …
Slavery existed in ancient India, where it is recorded in the Sanskrit Laws of Manu of the 1st century BCE. The institution was little documented until the British colonials in the 19th century made it an object of study because of their desire to abolish it. …
Slavery was widely practiced in other areas of Asia as well. A quarter to a third of the population of some areas of Thailand and Burma (Myanmar) were slaves in the 17th through the 19th centuries and in the late 19th and early 20th centuries, respectively. …
Other societies in the Philippines, Nepal, Malaya, Indonesia, and Japan are known to have had slavery from ancient until fairly recent times. The same was true among the various peoples inhabiting the regions of Central Asia: the peoples of Sogdiana, Khorezm, and other advanced civilizations; the Mongols, the Kalmyks, the Kazakhs; and the numerous Turkic peoples, most of whom converted to Islam. …
In England about 10 percent of the population entered in the Domesday Book in 1086 were slaves, with the proportion reaching as much as 20 percent in some places. Slaves were also prominent in Scandinavia during the Viking era, 800–1050 BCE, when slaves for use at home and for sale in the international slave markets were a major object of raids. Slaves also were present in significant numbers in Scandinavia both before and after the Viking era. …
Slavery was much in evidence in the Middle East from the beginning of recorded history. It was treated as a prominent institution in the Babylonian Code of Hammurabi of about 750 BCE. …
Slaves were owned in all Islamic societies, both sedentary and nomadic, ranging from Arabia in the centre to North Africa in the west and to what is now Pakistan and Indonesia in the east. …
Slaves have been owned in black Africa throughout recorded history. In many areas there were large-scale slave societies, while in others there were slave-owning societies. Slavery was practiced everywhere even before the rise of Islam, and black slaves exported from Africa were widely traded throughout the Islamic world.
[60] Article: “Africans Arrive in Virginia, 1619.” Gale Encyclopedia of U.S. Economic History. Thomson Gale, 1999. <www.encyclopedia.com>
One stormy day in August of 1619 a Dutch man-of-war with about 20 Africans on board entered port at the English colony of Jamestown, Virginia. Little is known of these newly arrived people: the first Africans to set foot on the North American continent. At this time the slave trade between Africa and the English colonies had not yet been established, and it is unlikely that the 20 or so newcomers became slaves upon their arrival. They were perhaps considered indentured servants, who worked under contract for a certain period of time (usually seven years) before they were granted freedom and the rights accorded to other settlers. …
The social status of the first Africans in Jamestown was confusing, and perhaps deliberately ambiguous. Records from 1623 and 1624 list the black inhabitants of the colony as servants, not slaves. In these same records, however, white indentured servants are listed along with the year in which they were to attain freedom; no such year accompanies the names of black servants. Freedom was the birthright of William Tucker, the first African born in the colonies. Yet court records show that at least one African had been declared a slave by 1640, the year that slavery was officially instituted in Jamestown.
[61] Article: “Africans Arrive in Virginia, 1619.” Gale Encyclopedia of U.S. Economic History. Thomson Gale, 1999. <www.encyclopedia.com>
Freedom was the birthright of William Tucker, the first African born in the colonies. Yet court records show that at least one African had been declared a slave by 1640, the year that slavery was officially instituted in Jamestown. After the legalization of slavery by the Virginia colony, the African population began to rise slowly and steadily. The number of blacks increased from 23 in 1625 to approximately three hundred in 1650.
[62] Book: The Routledge Atlas of African American History. By Jonathan Earle. Routledge, 2000.
Page 26:
The transition to slave labor from labor performed by free people and indentured servants was a complex one, and spanned most of the 17th century. Virginia settlers had enslaved local Indians as early as 1610, but gave up the practice in the face of massive Indian raids and attacks. The switch to African, perpetual, race-based slavery was slow: there were only 1,600 Africans in North America in 1640, with almost a third of them in Dutch New York. During the next four decades slavery was explicitly legalized in Massachusetts (1641), Connecticut (1650), Virginia (1661), Maryland (1663), New York (1665), and South Carolina (1682). Even before it legally recognized slavery in 1663, Maryland lawmakers had mandated slavery as a lifelong condition for Africans and their children; Virginia classified slavery as a lifelong, inheritable, and “racial” status for blacks in 1670. The remaining colonies of British North America legalized slavery in the early 18th century.
[63] Article: “Continental Congress.” Encyclopædia Britannica Ultimate Reference Suite 2004.
(1774–89), in the period of the American Revolution, the body of delegates who spoke and acted collectively for the people of the colony-states that later became the United States of America. The term most specifically refers to the bodies that met in 1774 and 1775–81 and respectively designated as the First Continental Congress and the Second Continental Congress.
In the spring of 1774, the British Parliament’s passage of the Intolerable (Coercive) Acts, including the closing of the port of Boston, provoked keen resentment in the colonies. The First Continental Congress, convened in response to the Acts by the colonial Committees of Correspondence, met in Philadelphia on September 5, 1774. Fifty-six deputies represented all the colonies except Georgia. …
Meeting in secret session, the body rejected a plan for reconciling British authority with colonial freedom. Instead, it adopted a declaration of personal rights, including life, liberty, property, assembly, and trial by jury. The declaration also denounced taxation without representation and the maintenance of the British army in the colonies without their consent. Parliamentary regulation of American commerce, however, was willingly accepted.
[64] Webpage: “Journals of the Continental Congress, Thursday, October 20, 1774.” U.S. Library of Congress. Accessed July 20, 2016 at <memory.loc.gov>
We, his majesty’s most loyal subjects, the delegates of the several colonies of New-Hampshire, Massachusetts-Bay, Rhode-Island, Connecticut, New-York, New-Jersey, Pennsylvania, the three lower counties of New-Castle, Kent and Sussex, on Delaware, Maryland, Virginia, North-Carolina, and South-Carolina, deputed to represent them in a continental Congress, held in the city of Philadelphia, on the 5th day of September, 1774, avowing our allegiance to his majesty, our affection and regard for our fellow-subjects in Great-Britain and elsewhere, affected with the deepest anxiety, and most alarming apprehensions, at those grievances and distresses, with which his Majesty’s American subjects are oppressed; and having taken under our most serious deliberation, the state of the whole continent, find, that the present unhappy situation of our affairs is occasioned by a ruinous system of colony administration, adopted by the British ministry about the year 1763, evidently calculated for inslaving these colonies, and, with them, the British empire. In prosecution of which system, various acts of parliament have been passed, for raising a revenue in America, for depriving the American subjects, in many instances, of the constitutional trial by jury, exposing their lives to danger, by directing a new and illegal trial beyond the seas, for crimes alleged to have been committed in America: and in prosecution of the same system, several late, cruel, and oppressive acts have been passed, respecting the town of Boston and the Massachusetts-Bay, and also an act for extending the province of Quebec, so as to border on the western frontiers of these colonies, establishing an arbitrary government therein, and discouraging the settlement of British subjects in that wide extended country; thus, by the influence of civil principles and ancient prejudices, to dispose the inhabitants to act with hostility against the free Protestant colonies, whenever a wicked ministry shall chuse so to direct them.
To obtain redress of these grievances, which threaten destruction to the lives, liberty, and property of his majesty’s subjects, in North America, we are of opinion, that a non-importation, non-consumption, and non-exportation agreement, faithfully adhered to, will prove the most speedy, effectual, and peaceable measure: and, therefore, we do, for ourselves, and the inhabitants of the several colonies, whom we represent, firmly agree and associate, under the sacred ties of virtue, honour and love of our country, as follows: …
2. We will neither import nor purchase, any slave imported after the first day of December next; after which time, we will wholly discontinue the slave trade, and will neither be concerned in it ourselves, nor will we hire our vessels, nor sell our commodities or manufactures to those who are concerned in it. …
11. That a committee be chosen in every county, city, and town, by those who are qualified to vote for representatives in the legislature, whose business it shall be attentively to observe the conduct of all persons touching this association; and when it shall be made to appear, to the satisfaction of a majority of any such committee, that any person within the limits of their appointment has violated this association, that such majority do forthwith cause the truth of the case to be published in the gazette; to the end, that all such foes to the rights of British-America may be publicly known, and universally contemned as the enemies of American liberty; and thenceforth we respectively will break off all dealings with him or her. …
14. And we do further agree and resolve, that we will have no trade, commerce, dealings or intercourse whatsoever, with any colony or province, in North-America, which shall not accede to, or which shall hereafter violate this association, but will hold them as unworthy of the rights of freemen, and as inimical to the liberties of their country. …
In Congress, Philadelphia, October 20, 1774.
Signed, Peyton Randolph, President.
New Hampshire
Jno. Sullivan
Nathel. Folsom
Massachusetts Bay
Thomas Cushing
Saml. Adams
John Adams
Robt.Treat Paine
Rhode Island
Step. Hopkins
Sam: Ward
Connecticut
Elipht Dyer
Roger Sherman
Silas Deane
New York
Isaac Low
John Alsop
John Jay
Jas. Duane
Phil. Livingston
Wm. Floyd
Henry Wisner
S: Boerum
New Jersey
J. Kinsey
Wil: Livingston
Stepn. Crane
Richd. Smith
John De Hart
Pennsylvania
Jos. Galloway
John Dickinson
Cha Humphreys
Thomas Mifflin
E. Biddle
John Morton
Geo: Ross
The Lower Counties New Castle
Cæsar Rodney
Tho. M: Kean
Geo: Read
Maryland
Mat Tilghman”
Ths. Johnson Junr.
Wm. Paca
Samuel Chase
[65] Webpage: “Declaration of Independence.” U.S. Library of Congress. Accessed August 10, 2020 at <guides.loc.gov>
“On July 4, 1776, the Second Continental Congress unanimously adopted the Declaration of Independence, announcing the colonies’ separation from Great Britain.”
[66] Declaration of Independence. Second Continental Congress, July 4, 1776. <www.archives.gov>
We hold these truths to be self-evident, that all men are created equal, that they are endowed by their Creator with certain unalienable Rights, that among these are Life, Liberty and the pursuit of Happiness. That to secure these rights, Governments are instituted among Men, deriving their just powers from the consent of the governed, –That whenever any Form of Government becomes destructive of these ends, it is the Right of the People to alter or to abolish it, and to institute new Government, laying its foundation on such principles and organizing its powers in such form, as to them shall seem most likely to effect their Safety and Happiness.
[67] Ruling: Gulf v. Ellis. U.S. Supreme Court, January 18, 1897. Decided 5–3. <caselaw.findlaw.com>
The first official action of this nation declared the foundation of government in these words: “We hold these truths to be self-evident, that all men are created equal, that they are endowed by their Creator with certain unalienable rights, that among these are life, liberty, and the pursuit of happiness.” While such declaration of principles may not have the force of organic law, or be made the basis of judicial decision as to the limits of right and duty, and while in all cases reference must be had to the organic law of the nation for such limits, yet the latter is but the body and the letter of which the former is the thought and the spirit, and it is always safe to read the letter of the constitution in the spirit of the Declaration of Independence. No duty rests more imperatively upon the courts than the enforcement of those constitutional provisions intended to secure that equality of rights which is the foundation of free government.
[68] Harper’s Book of Facts. Edited by Charlton T. Lewis. Harper & Brothers, 1906. <www.google.com>
Pennsylvania abolished slavery by gradual emancipation, 1780; Massachusetts by a Bill of Rights prefixed to the constitution, 1780; New Hampshire by her constitution, 1784; Connecticut and Rhode Island, 1784; Vermont by her constitution; New York by gradual abolition, 1799; further legislation in 1817 decreed total abolition after 4 July, 1827, when about 10,000 slaves were liberated; New Jersey, gradual abolition, 1804.
[69] Webpage: “Act to Prohibit the Importation of Slaves.” Ashland University, Ashbrook Center, TeachingAmericanHistory.org. Accessed July 20, 2016 at <teachingamericanhistory.org>
The U.S. Congress passed this piece of landmark legislation to end the profitable international slave trade on March 2, 1807, and President Thomas Jefferson promptly signed the act, making it law. The act went into effect on January 1, 1808, prohibiting from that time on the importation of African slaves to the United States.
An Act to Prohibit the Importation of Slaves into any Port or Place Within the Jurisdiction of the United States, From and After the First Day of January, in the Year of our Lord One Thousand Eight Hundred and Eight.
Be it enacted by the Senate and House of Representatives of the United States of America in Congress assembled, That from and after the first day of January, one thousand eight hundred and eight, it shall not be lawful to import or bring into the United States or the territories thereof from any foreign kingdom, place, or country, any negro, mulatto, or person of colour, with intent to hold, sell, or dispose of such negro, mulatto, or person of colour, as a slave, or to be held to service or labour.
Section 2. And be it further enacted, That no citizen or citizens of the United States, or any other person, shall, from arid after the first day of January, in the year of our Lord one thousand eight hundred and eight, for himself, or themselves, or any other person whatsoever, either as master, factor, or owner, build, fit, equip, load or otherwise prepare any ship or vessel, in any port or place within the jurisdiction of the United States, nor shall cause any ship or vessel to sail from any port or place within the same, for the purpose of procuring any negro, mulatto, or person of colour, from any foreign kingdom, place, or country, to be transported to any port or place whatsoever, within the jurisdiction of the United States, to be held, sold, or disposed of as slaves, or to be held to service or labour: and if any ship or vessel shall be so fitted out for the purpose aforesaid, or shall be caused to sail so as aforesaid, every such ship or vessel, her tackle, apparel, and furniture, shall be forfeited to the United States, and shall be liable to be seized, prosecuted, and condemned in any of the circuit courts or district courts, for the district where the said ship or vessel may be found or seized. …
[70] Webpage: “Emancipation.” United Kingdom National Archives. Accessed July 20, 2016 at <www.nationalarchives.gov.uk>
In August 1833, the Slave Emancipation Act was passed, giving all slaves in the British empire their freedom, albeit after a set period of years. Plantation owners received compensation for the “loss of their slaves” in the form of a government grant set at £20,000,000. In contrast, enslaved people received no compensation and continued to face much hardship. They remained landless, and the wages offered on the plantations after emancipation were extremely low.
The 1833 Act did not come into force until 1 August 1834. The first step was the freeing of all children under six. However, although the many thousands of enslaved people in the British West Indies were no longer legally slaves after 1 August 1834, they were still made to work as unpaid apprentices for their former masters. These masters continued to ill-treat and exploit them. Enslaved people in the British Caribbean finally gained their freedom at midnight on 31 July 1838.
[71] 13th Amendment to the U.S. Constitution. Ratified December 6, 1865. <www.justfacts.com>
Section 1. Neither slavery nor involuntary servitude, except as a punishment for crime whereof the party shall have been duly convicted, shall exist within the United States, or any place subject to their jurisdiction.
Section 2. Congress shall have power to enforce this article by appropriate legislation.
[72] Book: The Bill of Rights and the States: The Colonial and Revolutionary Origins of American Liberties. Edited by Patrick T. Conley and John P. Kaminski. Madison House Publishers, 1992.
Chapter 18: “The Bill of Rights: A Bibliographic Essay.” By Gaspare J. Saladino. Pages 461–514.
Page 484:
The best historical treatments of the legislative history of the Bill of Rights in the first federal Congress are in the general accounts by Rutland, Dumbauld, Brant, Schwartz, and Levy, and in David M. Matteson, The Organization of the Government under the Constitution (1941; reprint ed., New York, 1970). All agree that James Madison, against considerable odds, took the lead in the House of Representatives, and that without his efforts there probably would have been no Bill of Rights. Madison’s amendments, a distillation of those from the state conventions (especially Virginia’s) were, for the most part, those that the House eventually adopted.
[73] Article: “Madison, James.” By Robert J. Brugger (Ph.D., Editor, Maryland Historical Magazine, Maryland Historical Society). World Book Encyclopedia, 2007 Deluxe edition.
Madison, James (1751–1836), the fourth president of the United States, is often called the Father of the Constitution. He played a leading role in the Constitutional Convention of 1787, where he helped design the checks and balances that operate among Congress, the president, and the Supreme Court. He also helped create the U.S. federal system, which divides power between the central government and the states.
[74] Book: The Debates in the Federal Convention of 1787, Which Framed Constitution of the United States of America, Reported by James Madison, a Delegate From the State of Virginia. Edited by Gaillard Hund and James Brown Scott. Oxford University Press, 1920. <avalon.law.yale.edu>
June 6, 1787:
All civilized Societies would be divided into different Sects, Factions, & interests, as they happened to consist of rich & poor, debtors & creditors, the landed, the manufacturing, the commercial interests, the inhabitants of this district or that district, the followers of this political leader or that political leader, the disciples of this religious Sect or that religious Sect. In all cases where a majority are united by a common interest or passion, the rights of the minority are in danger. What motives are to restrain them? A prudent regard to the maxim that honesty is the best policy is found by experience to be as little regarded by bodies of men as by individuals. Respect for character is always diminished in proportion to the number among whom the blame or praise is to be divided. Conscience, the only remaining tie, is known to be inadequate in individuals: In large numbers, little is to be expected from it. Besides, Religion itself may become a motive to persecution & oppression. – These observations are verified by the Histories of every Country antient & modern. In Greece & Rome the rich & poor, the creditors & debtors, as well as the patricians & plebians alternately oppressed each other with equal unmercifulness. What a source of oppression was the relation between the parent cities of Rome, Athens & Carthage, & their respective provinces: the former possessing the power, & the latter being sufficiently distinguished to be separate objects of it? Why was America so justly apprehensive of Parliamentary injustice? Because G. Britain had a separate interest real or supposed, & if her authority had been admitted, could have pursued that interest at our expence. We have seen the mere distinction of colour made in the most enlightened period of time, a ground of the most oppressive dominion ever exercised by man over man. What has been the source of those unjust laws complained of among ourselves? Has it not been the real or supposed interest of the major number? Debtors have defrauded their creditors. The landed interest has borne hard on the mercantile interest. The Holders of one species of property have thrown a disproportion of taxes on the holders of another species. The lesson we are to draw from the whole is that where a majority are united by a common sentiment, and have an opportunity, the rights of the minor party become insecure. In a Republican Govt. the Majority if united have always an opportunity. The only remedy is to enlarge the sphere, & thereby divide the community into so great a number of interests & parties, that in the 1st. place a majority will not be likely at the same moment to have a common interest separate from that of the whole or of the minority; and in the 2d. place, that in case they shd. have such an interest, they may not be apt to unite in the pursuit of it. It was incumbent on us then to try this remedy, and with that view to frame a republican system on such a scale & in such a form as will controul all the evils wch. have been experienced.
[75] “Letter on the Federal Convention of 1787.” Luther Martin to Thomas Cockey Deye, January 27, 1788. <www.constitution.org>
By the ninth section of this article, the importation of such persons as any of the states now existing shall think proper to admit, shall not be prohibited prior to the year one thousand eight hundred and eight; but a duty may be imposed on such importation not exceeding ten dollars each person.
The design of this clause is to prevent the general government from prohibiting the importation of slaves; but the same reasons which caused them to strike out the word “national,” and not admit the word “stamps,” influenced them here to guard against the word “slaves.” They anxiously sought to avoid the admission of expressions which might be odious in the ears of Americans, although they were willing to admit into their system those things which the expressions signified; and hence it is that the clause is so worded as really to authorize the general government to impose a duty of ten dollars on every foreigner who comes into a state to become a citizen, whether he comes absolutely free, or qualifiedly so as a servant; although this is contrary to the design of the framers, and the duty was only meant to extend to the importation of slaves .
This clause was the subject of a great diversity of sentiment in the Convention. As the system was reported by the committee of detail, the provision was general, that such importation should not be prohibited, without confining it to any particular period. This was rejected by eight states—Georgia, South Carolina, and, I think, North Carolina, voting for it.
We were then told by the delegates of the two first of those states, that their states would never agree to a system which put it in the power of the general government to prevent the importation of slaves, and that they, as delegates from those states, must withhold their assent from such a system.
A committee of one member from each state was chosen by ballot, to take this part of the system under their consideration, and to endeavor to agree upon some report which should reconcile those states. To this committee also was referred the following proposition, which had been reported by the committee of detail, viz.: “No navigation act shall be passed without the assent of two thirds of the members present in each house”—a proposition which the staple and commercial states were solicitous to retain, lest their commerce should be placed too much under the power of the Eastern States, but which these last states were as anxious to reject. This committee—of which also I had the honor to be a member—met, and took under their consideration the subjects committed to them. I found the Eastern States, notwithstanding their aversion to slavery, were very willing to indulge the Southern States at least with a temporary liberty to prosecute the slave trade, provided the Southern States would, in their turn, gratify them, by laying no restriction on navigation acts; and after a very little time, the committee, by a great majority, agreed on a report, by which the general government was to be prohibited from preventing the importation of slaves for a limited time, and the restrictive clause relative to navigation acts was to be omitted.
This report was adopted by a majority of the Convention, but not without considerable opposition. It was said that we had just assumed a place among independent nations, in consequence of our opposition to the attempts of Great Britain to enslave us; that this opposition was grounded upon the preservation of those rights to which God and nature had entitled us, not in particular, but in common with the rest of all mankind—that we had appealed to the Supreme Being for his assistance, as the God of freedom, who could not but approve our efforts to preserve the rights which he had thus imparted to his creatures—that now, when we scarcely had risen from our knees, from supplicating his aid and protection, in forming our government over a free people,—a government formed pretendedly on the principles of liberty, and for its preservation,—in that government to have a provision not only putting it out of its power to restrain and prevent the slave trade, but even encouraging that most infamous traffic, by giving the states power and influence in the Union in proportion as they cruelly and wantonly sport with the rights of their fellow-creatures, ought to be considered as a solemn mockery of, and insult to, that God whose protection we had then implored; and could not fail to hold us up in detestation, and render us contemptible to every true friend of liberty in the world. It was said, it ought to be considered, that national crimes can only be, and frequently are, punished in this world by national punishments; and that the continuance of the slave trade, and thus giving it a national sanction and encouragement, ought to be considered as justly exposing us to the displeasure and vengeance of Him who is equally Lord of all, and who views with equal eye the poor African slave and his American master.
It was urged that, by this system, we were giving the general government full and absolute power to regulate commerce, under which general power it would have a right to restrain, or totally prohibit, the slave trade; it must therefore appear to the world absurd and disgraceful, to the last degree, that we should except from the exercise of that power the only branch of commerce which is unjustifiable in its nature, and contrary to the rights of mankind—that, on the contrary, we ought rather to prohibit expressly, in our Constitution, the further importation of slaves; and to authorize the general government, from time to time, to make such regulations as should be thought most advantageous for the gradual abolition of slavery, and the emancipation of the slaves which are already in the states—that slavery is inconsistent with the genius of republicanism, and has a tendency to destroy those principles on which it is supported, as it lessens the sense of the equal rights of mankind, and habituates us to tyranny and oppression. It was further urged that, by this system of government, every state is to be protected both from foreign invasion and from domestic insurrections; that, from this consideration, it was of the utmost importance it should have a power to restrain the importation of slaves, since, in proportion as the number of slaves was increased in any state, in the same proportion the state is weakened and exposed to foreign invasion or domestic insurrection, and by so much less will it be able to protect itself against either; and therefore will, by so much the more, want aid from, and be a burden to, the Union. It was further said that as, in this system, we were giving the general government a power, under the idea of national character or national interest, to regulate even our weights and measures, and have prohibited all possibility of emitting paper money, and passing insolvent laws, &c., it must appear still more extraordinary, that we should prohibit the government from interfering with the slave trade, than which nothing could so materially affect both our national honor and interest. These reasons influenced me, both on the committee and in Convention, most decidedly to oppose and vote against the clause, as it now makes a part of the system.
You will perceive, sir, not only that the general government is prohibited from interfering in the slave trade before the year eighteen hundred and eight, but that there is no provision in the Constitution that it shall afterwards be prohibited, nor any security that such prohibition will ever take place; and I think there is great reason to believe that, if the importation of slaves is permitted until the year eighteen hundred and eight, it will not be prohibited afterwards. At this time we do not generally hold this commerce in so great abhorrence as we have done. When our liberties were at stake, we warmly felt for the common rights of men. The danger being thought to be past which threatened ourselves, we are daily growing more insensible to those rights. In those states which have restrained or prohibited the importation of slaves, it is only done by legislative acts which may be repealed. When those states find that they must in their national character and connection, suffer in the disgrace, and share in the inconveniences, attendant upon that detestable and iniquitous traffic, they may be desirous also to share in the benefits arising from it; and the odium attending it will be greatly effaced by the sanction which is given to it in the general government.
[76] Harper’s Book of Facts. Edited by Charlton T. Lewis. Harper & Brothers, 1906. <www.google.com>
About the time of the Revolution, societies of prominent men were formed for the purpose of ameliorating the condition of the slaves. Pennsylvania was the first state to organize such a society, 1787, with Franklin as president. New York followed, with John Jay as its first president, and Alexander Hamilton as its second. Immediately after, Rhode Island; Maryland in 1780, with such members as Samuel Chase and Luther Martin; Delaware, with James A. Bayard and C A. Rodney; Connecticut, 1790; Virginia, 1791; New Jersey, 1792.
[77] Letter from George Washington to Robert Morris, April 12, 1786. <founders.archives.gov>
“I can only say that there is not a man living who wishes more sincerely than I do, to see a plan adopted for the abolition of it—but there is only one proper and effectual mode by which it can be accomplished, & that is by Legislative authority: and this, as far as my suffrage will go, shall never be wanting.”
[78] Article: “Washington, George.” By Philander D. Chase (Ph.D., Editor, The Papers of George Washington). World Book Encyclopedia, 2007 Deluxe edition.
“In three important ways, Washington helped shape the beginning of the United States. First, he commanded the Continental Army that won American independence from Britain in the Revolutionary War. Second, Washington served as president of the convention that wrote the United States Constitution. Third, he was elected the first president of the United States.”
[79] Book: The Debates in the Federal Convention of 1787, Which Framed Constitution of the United States of America, Reported by James Madison, a Delegate From the State of Virginia. Edited by Gaillard Hund and James Brown Scott. Oxford University Press, 1920. <avalon.law.yale.edu>
May 25, 1787 (First day of the Constitutional Convention):
Robert Morris … informed the members assembled that by the instruction & in behalf, of the deputation of Pena. he proposed George Washington Esqr. late Commander in chief for president of the Convention. Mr. JNo. Rutlidge seconded the motion; expressing his confidence that the choice would be unanimous, and observing that the presence of Genl. Washington forbade any observations on the occasion which might otherwise be proper. General Washington was accordingly unanimously elected by ballot, and conducted to the Chair by Mr. R. Morris and Mr. Rutlidge; from which in a very emphatic manner he thanked the Convention for the honor they had conferred on him, reminded them of the novelty of the scene of business in which he was to act, lamented his want of better qualifications, and claimed the indulgence of the House towards the involuntary errors which his inexperience might occasion.
[80] Book: The Life of Charles Carroll of Carrollton, 1737–1832 with His Correspondence and Public Papers (Volume 2). By Kate Mason Rowland. G.P. Putnam’s Sons, 1898.
Title page:
Grateful to Almighty God for the blessing which, through Jesus Christ our Lord, he conferred upon my beloved country, in her emancipation, and upon myself, in permitting me, under circumstances of mercy, to live to the age of 80 years and to survive the fiftieth year of American Independence, and certifying by my present signature my approbation of the Declaration of Independence adopted by Congress on the fourth day of July, in the year of our Lord, one thousand seven hundred and seventy-six, which I originally subscribed on the second day of August of the same year, and of which I am now the last surviving signer, I do hereby recommend to the present and future generations the principles of that important document as the best earthly inheritance their ancestors could bequeath to them, and pray that the civil and religious liberties they have secured to my country may be perpetuated to the remotest posterity and extended to the whole family of man.
Charles Carroll, Of Carrollton.
Baltimore. August 2, 1826.
Copy of Declaration of Independence, New York City Library.
Pages 320– 321:
April 23rd: Mr. Walsh has sent me four of the National Gazettes, no doubt with the expectation that I should become a subscriber. That the Gazette will be ably conducted, and contain many interesting dissertations and essays, the talents of Mr. Walsh are a sufficient guarantee; but why keep alive the question of slavery? It is admitted by all to be a great evil; let an effectual mode of getting rid of it be pointed out, or let the question sleep forever; the compromise will prevent the extension of slavery beyond 36 degrees north and west of the Missouri.
[81] Article: “Carroll, Charles.” Encyclopædia Britannica Ultimate Reference Suite 2004.
“American patriot leader, longest surviving signer of the Declaration of Independence, and the only Roman Catholic to sign that document. … Before and during the American Revolution, he served on committees of correspondence and in the Continental Congress (1776–78), where he was an important member of the board of war.”
[82] Book: The Life of John Jay, with Selections From His Correspondence and Miscellaneous Papers. By William Jay. Journal & Journal Harper, 1833.
Pages 173–174:
To the Rev. Doctor Price. New-York, 27th September, 1785.
I hope my letter, in answer to the one which enclosed a number of your political pamphlets, has reached you by this time. I do not recollect the date, but it went in one of the last vessels.
The cause of liberty, like most other good causes, will have its difficulties, and sometimes its persecutions, to struggle with. It has advanced more rapidly in this than other countries, but all its objects are not yet attained; and I much doubt whether they ever will be, in this or any other terrestrial state. That men should pray and fight for their own freedom, and yet keep others in slavery, is certainly acting a very inconsistent, as well as unjust and, perhaps, impious part; but the history of mankind is filled with instances of human improprieties. The wise and the good never form the majority of any large society, and it seldom happens that their measures are uniformly adopted; or that they can always prevent being overborne themselves by the strong and almost never-ceasing union of the wicked and the weak.
These circumstances tell us to be patient, and to moderate those sanguine expectations, which warm and good hearts often mislead even wise heads to entertain on those subjects. All that the best men can do is, to persevere in doing their duty to their country, and leave the consequences to Him who made it their duty; being neither elated by success, however great, nor discouraged by disappointments however frequent and mortifying.
[83] Article: “Jay, John.” Encyclopædia Britannica Ultimate Reference Suite 2004.
He helped assure the approval of the Declaration of Independence (1776) in New York, where he was a member of the provincial Congress. The following year he helped draft New York’s first constitution, was elected the state’s first chief justice, and in 1778 was chosen president of the Continental Congress. …
In 1789 President George Washington appointed Jay the country’s first chief justice, in which capacity he was instrumental in shaping Supreme Court procedures in its formative years. …
… New York Federalists, however, elected him governor (1795–1801), an office from which he retired to spend 27 years uneventfully on his farm.
[84] Book: Christian Life and Character of the Civil Institutions of the United States, Developed in the Official and Historical Annals of the Republic. By B. F. Morris. George W. Childs, 1864. <www.google.com>
Pages 171–173:
Societies having in view the abolition of slavery were formed in a number of States, in the early period of the republic, including Virginia and Maryland; and in 1794 a general convention of delegates from all the abolition societies in the United States was held in Philadelphia, to consult measures for the removal of slavery; and this general convention met annually for twelve years. To the first convention Dr. Rush was a delegate, and chairman of a committee to draft an address to the people of the United States, which contained the following condemnation of slavery:—
Many reasons concur in persuading us to abolish domestic slavery in our country.
It is inconsistent with the safety of the liberties of the United States.
Freedom and slavery cannot long exist together. An unlimited power over the time, labor, and posterity of our fellow creatures necessarily unfits men for discharging the public and private duties of citizens of a republic.
It is inconsistent with sound policy, in exposing the states which permit it to all those evils which insurrections and the most resentful war have introduced into one of the richest islands the West Indies.
It is unfriendly to the present exertions of the inhabitants Europe in favor of liberty. What people will advocate freedom with a zeal proportioned to its blessings, while they view the purest republic in the world tolerating in its bosom a body slaves
In vain has the tyranny of kings been rejected while we permit in our country a domestic despotism which involves in its nature most of the vices and miseries that we have endeavored to avoid.
It is degrading to our rank as men in the scale of being. Let us use our reason and social affections for the purposes for which they were given, or cease to boast a pre-eminence over animals that are unpolluted with our crimes.
But higher motives to justice and humanity towards our fellow-creatures remain yet to be mentioned.
Domestic slavery is repugnant to the principles of Christianity. It prostrates every benevolent and just principle of action in the human heart. It is rebellion against the authority of a common Father. It is a practical denial of the extent and efficacy of the death of a common Saviour. It is a usurpation the prerogatives of the great Sovereign of the universe, who has solemnly claimed an exclusive property in the souls of men.
But, if this view of the enormity of domestic slavery should not affect us, there is one consideration more, which ought to alarm and impress us, especially at the present juncture.
It is a violation of a divine precept of universal justice, which has in no case escaped with impunity.
[85] Article: “Rush, Benjamin.” Encyclopædia Britannica Ultimate Reference Suite 2004.
“Rush was an early and active American patriot. As a member of the radical provincial conference in June 1776, he drafted a resolution urging independence and was soon elected to the Continental Congress, signing the Declaration of Independence with other members on August 2.”
[86] Article: “Jefferson, Thomas.” By Noble E. Cunningham, Jr. (Ph.D., Curators’ Professor Emeritus of History, University of Missouri). World Book Encyclopedia, 2007 Deluxe edition.
Congress appointed a committee to draw up a declaration of independence. … The committee unanimously asked Jefferson to prepare the draft and approved it with few changes. … The members of Congress made some changes, but, as Richard Lee said: “the Thing in its nature is so good that no cookery can spoil the dish for the palates of freemen.”
[87] Autobiography Draft Fragment of Thomas Jefferson, July 27, 1821. Transcribed and edited by Gerard W. Gawalt. U.S. Library of Congress, February 13, 2015. <memory.loc.gov>
Pages 25–26:
The committee of five met; no such thing as a sub-committee was proposed, but they unanimously pressed on myself alone to undertake the draught. I consented; I drew it; but before I reported it to the committee, I communicated it separately to Doctor Franklin and Mr. Adams, requesting their corrections because they were the two members of whose judgments and amendments I wished most to have the benefit, before presenting it to the committee: and you have seen the original paper now in my hands, with the corrections of Doctor Franklin and Mr. Adams interlined in their own handwritings. Their alterations were two or three only, and merely verbal. I then wrote a fair copy, reported it to the committee, and from them unaltered, to Congress. This personal communication and consultation with Mr. Adams, he has misremembered into the actings of a sub-committee. Pickering’s observations, and Mr. Adams’ in addition, ‘that it contained no new ideas, that it is a common place compilation, its sentiments hacknied in Congress for two years before, and its essence contained in Otis’ pamphlet,’ may all be true. Of that I am not to be the judge. Richard Henry Lee charged it as copied from Locke’s treatise on government. Otis’ pamphlet I never saw, and whether I had gathered my ideas from reading or reflection I do not know. I know only that I turned to neither book nor pamphlet while writing it. I did not consider it as any part of my charge to invent new ideas altogether, and to offer no sentiment which had ever been expressed before.”– Letter to J. Madison, Aug. 30, 1823.
[88] Book: The Life of Thomas Jefferson, Third President of the United States. By George Tucker. Carey, Lea & Blanchard, 1837.
Page 119:
On the subject of slaves, one which Mr. Jefferson seems always to have regarded with the interest of a patriot, as well as of a philanthropist, the committee were content merely to make a digest of the laws concerning them. But they further agreed to an amendment to the bill, whenever it should be taken up, by which all the children of slaves, born after an appointed day, should be free, and be carried out of the state when they arrived at a certain age. “It was, however, found, he says, that the public mind would not yet bear the proposition, nor will it bear it even at this day. Yet the day is not distant when it must bear and adopt it, or worse will follow. Nothing is more certainly written in the book of fate, than that these people are to be free; nor is it less certain, that the two races, equally free, cannot live in the same government. Nature, habit, opinion, have drawn indelible lines of distinction between them. It is still in our power to direct the process of emancipation and deportation, peaceably, and in such slow degree, as that the evil will wear off insensibly, and their place be, pari passu, filled up by free white labourers. If, on the contrary it is left to force itself on, human nature must shudder at the prospect held up. We should in vain look for an example in the Spanish deportation or deletion of the Moors. This precedent would fall far short of our case.”
[89] Webpage: “Jefferson’s Attitudes Toward Slavery.” Monticello and the University of Virginia in Charlottesville. Accessed August 10, 2020 at <www.monticello.org>
Throughout his entire life, Thomas Jefferson was a consistent opponent of slavery. Calling it a “moral depravity”1 and a “hideous blot,”2 he believed that slavery presented the greatest threat to the survival of the new American nation.3 Jefferson also thought that slavery was contrary to the laws of nature, which decreed that everyone had a right to personal liberty.4 These views were radical in a world where unfree labor was the norm. …
At the time of the American Revolution, Jefferson was actively involved in legislation that he hoped would result in slavery’s abolition.5 In 1778, he drafted a Virginia law that prohibited the importation of enslaved Africans.6 In 1784, he proposed an ordinance that would ban slavery in the Northwest territories.7 …
Jefferson’s belief in the necessity of ending slavery never changed. From the mid-1770s until his death, he advocated the same plan of gradual emancipation.
[90] Article: “Thomas Jefferson and Slavery.” Thomas Jefferson Encyclopedia. Accessed July 20, 2016 at <www.monticello.org>
Jefferson was 14 years old when his father died. As the oldest son, he became head of the family. He inherited more than 2,500 acres (1,010 hectares) of land and at least 20 slaves. …
Jefferson was born into a slave society in which he continued to own slaves while opposing slavery. He never justified owning slaves, but he felt that freeing his slaves would not have ended slavery as an institution. He worked within the system to oppose slavery. He hoped the younger generation would end society’s dependence on this system. He wrote, “Nothing is more certainly written in the book of fate than that these people are to be free.”
[91] Webpage: “Slavery FAQs – Property.” Monticello and the University of Virginia in Charlottesville. Accessed August 10, 2020 at <www.monticello.org>
Jefferson acquired most of the over six hundred people he owned during his life through the natural increase of enslaved families. He acquired approximately 175 enslaved people through inheritance: about 40 from the estate of his father, Peter Jefferson, in 1764, and 135 from his father-in-law, John Wayles, in 1774. Jefferson purchased fewer than twenty slaves in his lifetime. …
Jefferson did buy and sell human beings. He purchased slaves occasionally, because of labor needs or to unite spouses. Despite his expressed “scruples” against selling slaves except “for delinquency, or on their own request,” he sold more than 110 in his lifetime, mainly for financial reasons. … Jefferson also “gifted” eighty-five people to family members and to provide dowries for his sister and daughters. His record of slaves “alienated” from his ownership—whether by sale or gift—in the ten-year period from 1784 to 1794 listed 160 men, women, and children.
… Thomas Jefferson freed two people during his life. He freed five people in his will. He allowed two or three people to escape without pursuit, and recommended informal freedom for two others. In total, of the more than six hundred people Jefferson enslaved, he freed only ten people—all members of the same family.
[92] Textbook: The American Spirit: United States History as Seen by Contemporaries (11th edition, Volume I). By David M. Kennedy (Stanford University) and Thomas A. Bailey. Houghton Mifflin, 2006.
Page 156:
The Abortive Slave Trade Indictment (1776)
Farsighted colonists had repeatedly attempted in their local assemblies to restrict or stop the odious African slave trade. But the London government, responding to the anguished cries of British (and New England) slave traders, had killed all such laws with the royal veto—five times in the case of Virginia alone. Jefferson added this grievance to the original indictment, but Congress threw it out, largely because of opposition from those parts of the South heavily dependent on the slave trade. Would this clause have added to the effectiveness of the Declaration of Independence? How, if at all, might its inclusion have changed the subsequent course of human history?
[93] Autobiography Draft Fragment of Thomas Jefferson, July 27, 1821. Transcribed and edited by Gerard W. Gawalt. U.S. Library of Congress, February 13, 2015. <memory.loc.gov>
Page 27:
Congress proceeded the same day to consider the declaration of independence which had been reported & lain on the table the Friday preceding, and on Monday referred to a commee of the whole. The pusillanimous idea that we had friends in England worth keeping terms with, still haunted the minds of many. For this reason those passages which conveyed censures on the people of England were struck out, lest they should give them offence. The clause too, reprobating the enslaving the inhabitants of Africa, was struck out in complaisance to South Carolina and Georgia, who had never attempted to restrain the importation of slaves, and who on the contrary still wished to continue it. Our northern brethren also I believe felt a little tender under those censures; for tho’ their people have very few slaves themselves yet they had been pretty considerable carriers of them to others.
Pages 29–33:
“I am also obliged by ye Original Declaration of Independence, which I find your brethren have treated as they did ye Manifesto last summer—altered it much for the worse; their hopes of a Reconciliation might restrain them from plain truths then, but what could cramp them now?” – E. Pendleton to Jefferson, Aug. 20, 1776. …
a declaration by the representatives of the united states of america, in general congress assembled
When in the course of human events it becomes necessary for one people to dissolve the political bands which have connected them with another, and to assume among the powers of the earth the separate & equal station to which the laws of nature and of nature’s God entitle them, a decent respect to the opinions of mankind requires that they should declare the causes which impel them to the separation. …
The history of the present king of Great Britain is a history of unremitting injuries & usurpations, among which appears no solitary fact to contradict the uniform tenor of the rest but all have in direct object the establishment of an absolute tyranny over these states. To prove this let facts be submitted to a candid world for the truth of which we pledge a faith yet unsullied by falsehood. …
He has waged cruel war against human nature itself, violating its most sacred rights of life and liberty in the persons of a distant people who never offended him, captivating & carrying them into slavery in another hemisphere, or to incur miserable death in their transportation thither. This piratical warfare, the opprobium of INFIDEL powers, is the warfare of the CHRISTIAN king of Great Britain. Determined to keep open a market where MEN should be bought & sold, he has prostituted his negative for suppressing every legislative attempt to prohibit or to restrain this execrable commerce. And that this assemblage of horrors might want no fact of distinguished die, he is now exciting those very people to rise in arms among us, and to purchase that liberty of which he has deprived them, by murdering the people on whom he also obtruded them: thus paying off former crimes committed against the LIBERTIES of one people, with crimes which he urges them to commit against the LIVES of another.
[94] Autobiography Draft Fragment of Thomas Jefferson, July 27, 1821. Transcribed and edited by Gerard W. Gawalt. U.S. Library of Congress, February 13, 2015. <memory.loc.gov>
Page 36:
On Friday July 12 [1776]. the Committee appointed to draw the articles of confederation reported them, and on the 22d. the house resolved themselves into a committee to take them into consideration. On the 30th. & 31st. of that month & 1st. of the ensuing, those articles were debated which determined the proportion or quota of money which each state should furnish to the common treasury, and the manner of voting in Congress. The first of these articles was expressed in the original draught in these words. “Art. XI. All charges of war & all other expenses that shall be incurred for the common defence, or general welfare, and allowed by the United States assembled, shall be defrayed out of a common treasury, which shall be supplied by the several colonies in proportion to the number of inhabitants of every age, sex & quality, except Indians not paying taxes, in each colony, a true account of which, distinguishing the white inhabitants, shall be triennially taken & transmitted to the Assembly of the United States.”
Page 37:
Mr. [Benjamin] Harrison proposed as a compromise, that two slaves should be counted as one freeman. He affirmed that slaves did not do so much work as freemen, and doubted if two effected more than one. That this was proved by the price of labor. The hire of a labourer in the Southern colonies being from 8 to £12. while in the Northern it was generally £24.
Page 42:
Dr. Witherspoon opposed every alteration of the article. All men admit that a confederacy is necessary. Should the idea get abroad that there is likely to be no union among us, it will damp the minds of the people, diminish the glory of our struggle, & lessen it’s importance; because it will open to our view future prospects of war & dissension among ourselves. If an equal vote be refused, the smaller states will become vassals to the larger; & all experience has shown that the vassals & subjects of free states are the most enslaved. He instanced the Helots of Sparta & the provinces of Rome.
[95] “Notes on the State of Virginia.” By Thomas Jefferson, 1781–1782. <avalon.law.yale.edu>
Many of the laws which were in force during the monarchy being relative merely to that form of government, or inculcating principles inconsistent with republicanism, the first assembly which met after the establishment of the commonwealth appointed a committee to revise the whole code, to reduce it into proper form and volume, and report it to the assembly. This work has been executed by three gentlemen, and reported; but probably will not be taken up till a restoration of peace shall leave to the legislature leisure to go through such a work.
The plan of the revisal was this. The common law of England, by which is meant, that part of the English law which was anterior to the date of the oldest statutes extant, is made the basis of the work. It was thought dangerous to attempt to reduce it to a text: it was therefore left to be collected from the usual monuments of it. Necessary alterations in that, and so much of the whole body of the British statutes, and of acts of assembly, as were thought proper to be retained, were digested into 126 new acts, in which simplicity of stile was aimed at, as far as was safe. The following are the most remarkable alterations proposed: …
To make slaves distributable among the next of kin, as other moveables. …
To emancipate all slaves born after passing the act. The bill reported by the revisors does not itself contain this proposition; but an amendment containing it was prepared, to be offered to the legislature whenever the bill should be taken up, and further directing, that they should continue with their parents to a certain age, then be brought up, at the public expence, to tillage, arts or sciences, according to their geniusses, till the females should be eighteen, and the males twenty-one years of age, when they should be colonized to such place as the circumstances of the time should render most proper, sending them out with arms, implements of houshold and of the handicraft arts, feeds, pairs of the useful domestic animals, &c. to declare them a free and independant people, and extend to them our alliance and protection, till they shall have acquired strength; and to send vessels at the same time to other parts of the world for an equal number of white inhabitants; to induce whom to migrate hither, proper encouragements were to be proposed.
It will probably be asked, Why not retain and incorporate the blacks into the state, and thus save the expence of supplying, by importation of white settlers, the vacancies they will leave? Deep rooted prejudices entertained by the whites; ten thousand recollections, by the blacks, of the injuries they have sustained; new provocations; the real distinctions which nature has made; and many other circumstances, will divide us into parties, and produce convulsions which will probably never end but in the extermination of the one or the other race.
[96] “Draft of a Constitution for Virginia.” By Thomas Jefferson, May–June 1783. <founders.archives.gov>
The General assembly30 shall not have power to … to permit the introduction of any more slaves to reside in this state, or the continuance of slavery beyond the generation which shall be living on the 31st. day of December 1800; all persons born after that day being hereby declared free.
30. In MHi MS the marginal gloss “Limits of power” appears beside this paragraph.
[97] Book: Transactions of the Illinois State Historical Society for the Year 1916. Illinois State Journal, 1917.
Page 90:
But by treaty made between Great Britain in 1794 commonly called the “Jay Treaty” under which the British finally evacuated the west, the rights of the ancient inhabitants who had not claimed citizenship of Virginia, were protected, and one year was given them to accept American citizenship. This also embraced the inhabitants of the north part of the Northwest Territory which was not conquered by Clark.
In 1784 the first ordinance for the government of the Territory was passed. As originally drawn there was an article of compact providing, “That after the year 1800, there shall be neither slavery or involuntary servitude in any of the said states, (those provided for in the ordinance) otherwise than in punishment of crime, whereof the party shall have been convicted to have been personally guilty.” Under the rules of Congress the affirmative vote of seven states was required to carry any measure. A motion having been made by a delegate from a southern state, to strike out the provision, the votes of six northern states were opposed to the motion. As each state had but one vote, and two delegates, one of the delegates from New Jersey being absent, that state had no vote, and the motion prevailed and the provision was stricken out.
The measure was drafted by Mr. Jefferson, and he was greatly chagrined at the striking out of the slavery clause. Two years later, he wrote, “The voice of a single individual would have prevented this abominable crime from spreading itself over the new country. Thus we see the fate of millions unborn hanging on the tongue of one man, and Heaven was silent in that awful moment, but it is to be hoped that it will not always be silent; and that the friends to the rights of human nature will in the end prevail.”
From this language, it will be seen that Mr. Jefferson did not consider the language of the Declaration of Independence, a string of glittering generalities, but that he intended to express a self evident truth, when he said that all men were endowed with certain inalienable rights of life, liberty and the pursuit of happiness, and that he did not exclude the slaves then in servitude.
[98] Webpage: “Act to Prohibit the Importation of Slaves.” Ashland University, Ashbrook Center, TeachingAmericanHistory.org. Accessed July 20, 2016 at <teachingamericanhistory.org>
The U.S. Congress passed this piece of landmark legislation to end the profitable international slave trade on March 2, 1807, and President Thomas Jefferson promptly signed the act, making it law. The act went into effect on January 1, 1808, prohibiting from that time on the importation of African slaves to the United States.
An Act to Prohibit the Importation of Slaves into any Port or Place Within the Jurisdiction of the United States, From and After the First Day of January, in the Year of our Lord One Thousand Eight Hundred and Eight.
Be it enacted by the Senate and House of Representatives of the United States of America in Congress assembled, That from and after the first day of January, one thousand eight hundred and eight, it shall not be lawful to import or bring into the United States or the territories thereof from any foreign kingdom, place, or country, any negro, mulatto, or person of colour, with intent to hold, sell, or dispose of such negro, mulatto, or person of colour, as a slave, or to be held to service or labour.
Section 2. And be it further enacted, That no citizen or citizens of the United States, or any other person, shall, from arid after the first day of January, in the year of our Lord one thousand eight hundred and eight, for himself, or themselves, or any other person whatsoever, either as master, factor, or owner, build, fit, equip, load or otherwise prepare any ship or vessel, in any port or place within the jurisdiction of the United States, nor shall cause any ship or vessel to sail from any port or place within the same, for the purpose of procuring any negro, mulatto, or person of colour, from any foreign kingdom, place, or country, to be transported to any port or place whatsoever, within the jurisdiction of the United States, to be held, sold, or disposed of as slaves, or to be held to service or labour: and if any ship or vessel shall be so fitted out for the purpose aforesaid, or shall be caused to sail so as aforesaid, every such ship or vessel, her tackle, apparel, and furniture, shall be forfeited to the United States, and shall be liable to be seized, prosecuted, and condemned in any of the circuit courts or district courts, for the district where the said ship or vessel may be found or seized. …
[99] Excerpt of Letter from Thomas Jefferson to Jean Nicolas Demeunier, June 26, 1786. <users.wfu.edu>
Of the two commissioners who had concerted the amendatory clause for the gradual emancipation of slaves Mr. Wythe could not be present as being a member of the judiciary department, and Mr. Jefferson was absent on the legation to France. But there wanted not in that assembly men of virtue enough to propose, & talents to vindicate this clause. But they saw that the moment of doing it with success was not yet arrived, and that an unsuccessful effort, as too often happens, would only rivet still closer the chains of bondage, and retard the moment of delivery to this oppressed description of men. What a stupendous, what an incomprehensible machine is man! who can endure toil, famine, stripes, imprisonment, & death itself in vindication of his own liberty, and the next moment be deaf to all those motives whose power supported him thro’ his trial, and inflict on his fellow men a bondage, one hour of which is fraught with more misery than ages of that which he rose in rebellion to oppose. …
[100] Letter from Thomas Jefferson to Edward Rutledge, July 14, 1787. <founders.archives.gov>
“I congratulate you, my dear friend, on the law of your state for suspending the importation of slaves, and for the glory you have justly acquired by endeavoring to prevent it for ever. This abomination must have an end, and there is a superior bench reserved in heaven for those who hasten it.”
[101] Letter from Thomas Jefferson to Edward Bancroft, January 26 , 1789. <founders.archives.gov>
I have deferred answering your letter on the subject of slaves, because you permitted me to do it till a moment of leisure, and that moment rarely comes, and because too, I could not answer you with such a degree of certainty as to merit any notice. I do not recollect the conversation at Vincennes to which you allude, but can repeat still on the same ground, on which I must have done then, that as far as I can judge from the experiments which have been made, to give liberty to, or rather, to abandon persons whose habits have been formed in slavery is like abandoning children. Many quakers in Virginia seated their slaves on their lands as tenants. They were distant from me, and therefore I cannot be particular in the details, because I never had very particular information. I cannot say whether they were to pay a rent in money, or a share of the produce: but I remember that the landlord was obliged to plan their crops for them, to direct all their operations during every season and according to the weather, but, what is more afflicting, he was obliged to watch them daily and almost constantly to make them work, and even to whip them. A man’s moral sense must be unusually strong, if slavery does not make him a thief. He who is permitted by law to have no property of his own, can with difficulty conceive that property is founded in any thing but force. These slaves chose to steal from their neighbors rather than work. They became public nuisances, and in most instances were reduced to slavery again. But I will beg of you to make no use of this imperfect information (unless in common conversation). I shall go to America in the Spring and return in the fall. During my stay in Virginia I shall be in the neighborhood where many of these trials were made. I will inform myself very particularly of them, and communicate the information to you. Besides these, there is an instance since I came away of a young man (Mr. Mayo) who died and gave freedom to all his slaves, about 200. This is about 4. years ago. I shall know how they have turned out. Notwithstanding the discouraging result of these experiments, I am decided on my final return to America to try this one. I shall endeavor to import as many Germans as I have grown slaves. I will settle them and my slaves, on farms of 50. acres each, intermingled, and place all on the footing of the Metayers [Medietarii] of Europe. Their children shall be brought up, as others are, in habits of property and foresight, and I have no doubt but that they will be good citizens Some of their fathers will be so: others I suppose will need government. With these, all that can be done is to oblige them to labour as the labouring poor of Europe do, and to apply to their comfortable subsistence the produce of their labour, retaining such a moderate portion of it as may be a just equivalent for the use of the lands they labour and the stocks and other necessary advances.
[102] Book: The Jeffersonian Cyclopedia: A Comprehensive Collection of the Views of Thomas Jefferson. Edited by John P. Foley. Funk & Wagnalls, 1900. <oll-resources.s3.us-east-2.amazonaws.com>
Page 818:
7988. SLAVES (Emancipation), Total.—It is impossible to be temperate and to pursue this subject through the various considerations of policy, of morals, of history, natural and civil. We must be contented to hope they will force their way into every one’s mind. … The way, I hope, is preparing, under the auspices of heaven, for a total emancipation, and that this is disposed, in the order of events, to be with the consent of the masters, rather than by their extirpation.—Notes on Virginia, viii, 404. Ford Ed., iii, 267. (1782.)
7989. SLAVES (Emancipation), United States purchase of.—The bare proposition of purchase [of the slaves] by the United Stairs generally would excite infinite indignation in all the States north of Maryland. The sacrifice must fall on the States alone which hold them; and the difficult question will be how to lessen this so as to reconcile our fellow citizens to it. Personally, I am ready and desirous to make any sacrifice which shall ensure their gradual but complete retirement from the State, and effectually, at the same time, establish them elsewhere in freedom and safety.—To Dr. Thomas Humphreys. vii, 58. Ford Ed., x, 76. (M., 1817.)
[103] Letter from Thomas Jefferson to John Holmes, April 22, 1820. U.S. National Archives. <founders.archives.gov>
I can say with conscious truth that there is not a man on earth who would sacrifice more than I would, to relieve us from this heavy reproach, in any practicable way. the cession of that kind of property, for so it is misnamed, is a bagatelle which would not cost me a second thought, if, in that way, a general emancipation and expatriation could be effected: and, gradually, and with due sacrifices, I think it might be.
[104] Autobiography Draft Fragment of Thomas Jefferson, July 27, 1821. Transcribed and edited by Gerard W. Gawalt. U.S. Library of Congress, February 13, 2015. <memory.loc.gov>
The bill on the subject of slaves was a mere digest of the existing laws respecting them, without any intimation of a plan for a future & general emancipation. It was thought better that this should be kept back, and attempted only by way of amendment whenever the bill should be brought on. The principles of the amendment however were agreed on, that is to say, the freedom of all born after a certain day, and deportation at a proper age. But it was found that the public mind would not yet bear the proposition, nor will it bear it even at this day. Yet the day is not distant when it must bear and adopt it, or worse will follow. Nothing is more certainly written in the book of fate than that these people are to be free. Nor is it less certain that the two races, equally free, cannot live in the same government. Nature, habit, opinion has drawn indelible lines of distinction between them. It is still in our power to direct the process of emancipation and deportation peaceably and in such slow degree as that the evil will wear off insensibly, and their place be pari passu filled up by free white laborers. If on the contrary it is left to force itself on, human nature must shudder at the prospect held up. We should in vain look for an example in the Spanish deportation or deletion of the Moors. This precedent would fall far short of our case.
[105] Letter from Thomas Jefferson to Frances Wright, August 7, 1825. <founders.archives.gov>
[A]t the age of 82. with one foot in the grave, and the other uplifted to follow it, I do not permit myself to take part in any new enterprises, even for bettering the condition of man, not even in the great one which is the subject of your letter, and which has been thro’ life that of my greatest anxieties. the march of events has not been such as to render it’s completion practicable within the limits of time alloted to me; and I leave it’s accomplishment as the work of another generation. and I am cheared when I see that on which it is devolved, taking it up with so much good will, and such mind engaged in it’s encoragement. the abolition of the evil is not impossible: it ought never therefore to be despaired of. every plan should be adopted, every experiment tried, which may do something towards the ultimate object.
[106] Book: The American Constitution: Its Origins and Development (3rd edition). By Alfred H. Kelly and Winfred A. Harbison. W. W. Norton & Company, 1963.
Page 383:
In the North, the growth of extremist antislavery sentiment resulted in the birth of the Republican Party, which adopted an attitude of uncompromising hostility toward all extension of slavery in the territories. The Republicans absorbed the Northern Whigs almost completely, while many important antislavery Democrats, including such outstanding figures as Lyman Trumbull of Illinois and Salmon P. Chase of Ohio, also shifted to the Republican camp.
In their first national convention, held in Philadelphia in 1856, the Republicans adopted a platform announcing that it was the Constitutional duty of Congress to exclude slavery from all federal territories.
[107] “Declaration of Secession.” State of Georgia, January 29, 1861. <www.digitalhistory.uh.edu>
A brief history of the rise, progress, and policy of anti-slavery and the political organization into whose hands the administration of the Federal Government has been committed will fully justify the pronounced verdict of the people of Georgia. The party of Lincoln, called the Republican party, under its present name and organization, is of recent origin. It is admitted to be an anti-slavery party. While it attracts to itself by its creed the scattered advocates of exploded political heresies, of condemned theories in political economy, the advocates of commercial restrictions, of protection, of special privileges, of waste and corruption in the administration of Government, anti-slavery is its mission and its purpose. By anti-slavery it is made a power in the state.
[108] Book: Abraham Lincoln: Sources and Style of Leadership. Edited by Frank J. Williams and others. Greenwood Press, 1994.
Chapter 2: “Lincoln’s View of the Founding Fathers.” By Ronald D. Reitveld.
Page 23: “A great fusion meeting at Jackson, Michigan, on 6 July [1854] adopted the name Republican in emulation of Thomas Jefferson’s Democratic-Republican Party. This embryonic Republican Party looked to the principles of Jefferson for its ideals.”
[109] A Political Text-Book for 1860: Comprising a Brief View of Presidential Nominations and Elections, Including All the National Platforms Ever Yet Adopted. Compiled by Horace Greely and John F. Cleveland. Tribune Association, 1860.
Page 22:
Republican National Convention—1856. This Convention met at Philadelphia on the 17th of June…. The Convention adopted the following Platform:
This Convention of Delegates, assembled in pursuance of a call addressed to the people of the United States, without regard to past political differences or divisions, who are opposed to the repeal of the Missouri Compromise, to the policy of the present Administration, to the extension of Slavery into Free Territory; in favor of admitting Kansas as a Free State, of restoring the action of the Federal Government to the principles of Washington and Jefferson, and who purpose to unite in presenting candidates for the offices of President and Vice-President, do resolve as follows …
NOTE: This was the first platform of the Republican Party. [Book: The American Constitution: Its Origins and Development (3rd edition). By Alfred H. Kelly and Winfred A. Harbison. W. W. Norton & Company, 1963. Page 383: “In the North, the growth of extremist antislavery sentiment resulted in the birth of the Republican Party…. In their first national convention, held in Philadelphia in 1856….”]
[110] First Inaugural Address of Thomas Jefferson, March 4, 1801. <founders.archives.gov>
“We have called by different names brethren of the same principle. We are all republicans: we are all federalists.”
[111] Article: “Federalist Party.” By Donald R. Hickey (Ph.D., Professor of History, Wayne State College). World Book Encyclopedia, 2007 Deluxe edition.
“Thomas Jefferson and James Madison opposed Hamilton. Their followers became known as Democratic-Republicans.”
[112] Article: “Jefferson, Thomas.” By Noble E. Cunningham, Jr. (Ph.D., Curators’ Professor Emeritus of History, University of Missouri). World Book Encyclopedia, 2007 Deluxe edition.
“Jefferson led the Democratic-Republicans (called Republicans at the time, though some historians regard it as the origin of the modern Democratic Party).”
[113] Webpage: “Party History.” Democratic National Committee. Accessed November 15, 2007 at <democrats.org>
The late Ron Brown—former Chairman of the Democratic Party—put it best when he wrote, “The common thread of Democratic history, from Thomas Jefferson to Bill Clinton, has been an abiding faith in the judgment of hardworking American families, and a commitment to helping the excluded, the disenfranchised and the poor strengthen our nation by earning themselves a piece of the American Dream. We remember that this great land was sculpted by immigrants and slaves, their children and grandchildren.”
James Madison and Thomas Jefferson founded the Democratic Party in 1792 as a congressional caucus to fight for the Bill of Rights and against the elitist Federalist Party. In 1798, the “party of the common man” was officially named the Democratic-Republican Party and in 1800 elected Jefferson as the first Democratic President of the United States.
NOTE: The Democratic Party’s history page has since been scrubbed of any reference to Jefferson. [Webpage: “Our History.” Democratic National Committee. Accessed May 29, 2018 at <democrats.org>]
[114] Article: “Lincoln, Abraham.” By Gabor S. Boritt (Ph.D., Professor of Civil War Studies, Gettysburg College). World Book Encyclopedia, 2007 Deluxe edition.
“In 1856, Lincoln joined the antislavery Republican Party, then only two years old.”
[115] Book: Abraham Lincoln: Sources and Style of Leadership. Edited by Frank J. Williams and others. Greenwood Press, 1994.
Chapter 2: “Lincoln’s View of the Founding Fathers.” By Ronald D. Reitveld.
Page 23: “Among the founding fathers, it now became apparent that Jefferson offered more support for Lincoln’s various positions, and he began to quote the author of the Declaration of Independence, his platform, his confession of faith, more frequently.”
[116] A Political Text-Book for 1860: Comprising a Brief View of Presidential Nominations and Elections, Including All the National Platforms Ever Yet Adopted. Compiled by Horace Greely and John F. Cleveland. Tribune Association, 1860.
Page 206:
Mr. Lincoln having been invited by the Republicans of Boston, to attend a Festival in honor of the anniversary of Jefferson’s birthday, on the 13th of April, 1859, replied as follows [on April 6, 1859]:
Gentlemen: Your kind note, inviting me to attend a festival in Boston, on the 18th inst., in honor of the birthday of Thomas Jefferson, was duly received. My engagements are such that I cannot attend. Bearing in mind that about seventy years ago two great political parties were first formed in this country; that Thomas Jefferson was the head of one of them and Boston the headquarters of the other, it is both curious and interesting that those supposed to descend politically from the party opposed to Jefferson, should now be celebrating his birthday in their own original seat of empire, while those claiming political descent from him have nearly ceased to breathe his name everywhere.
Remembering, too, that the Jefferson party was formed upon its supposed superior devotion to the personal rights of men, holding the rights of property to be secondary only, and greatly inferior; and then assuming that the so-called Democracy of to-day are the Jefferson, and their opponents the anti-Jefferson parties, it will be equally interesting to note how completely the two have changed ground as to the principle upon which they were originally supposed to be divided.
The Democracy of to-day hold the liberty of one man to be absolutely nothing, when in conflict with another man’s right of property. Republicans, on the contrary, are both for the man and the dollar, but in case of conflict the man before the dollar.
I remember being once much amused at seeing two partially intoxicated men engaged in a fight with their great-coats on, which fight, after a long and rather harmless contest, ended in each having fought himself out of his own coat and into that of the other. If the two leading parties of this day are really identical with the two in the days of Jefferson and Adams, they have performed the same feat as the two drunken men.
But soberly, it is now no child’s play to save the principles of Jefferson from total overthrow in this nation.
One would state with great confidence that he could convince any sane child that the simpler propositions of Euclid are true; but nevertheless, he would fail, with one who should deny the definitions and axioms. The principles of Jefferson are the definitions and axioms of free society. And yet they are denied and evaded, with no small show of success. One dashingly calls them “glittering generalities.” Another bluntly styles them “self-evident lies.” And others insidiously argue that they apply only to “superior races.”
These expressions, differing in form, are identical in object and effect—the supplanting the principles of free government, and restoring those of classification, caste, and legitimacy. They would delight a convocation of crowned heads plotting against the people. They are the vanguard, the sappers and miners, of returning despotism. We must repulse them, or they will subjugate us.
This is a world of compensations; and he who would be no slave must consent to have no slave. Those who deny freedom to others deserve it not for themselves; and, under a just God, cannot long retain it.
All honor to Jefferson—to the man who, in the concrete pressure of a struggle for national independence by a single people, had the coolness, forecast, and capacity, to introduce into a merely revolutionary document an abstract truth, applicable to all men and all times, and so to embalm it there, that to-day and in all coming days it shall be a rebuke and a stumbling-block to the harbingers of reappearing tyranny and oppression.
Your obedient servant, A. LINCOLN.
[117] Ruling: Dred Scott v. Sandford. U.S. Supreme Court, March 6, 1857. Decided 7–2. Majority: Taney, Wayne, Nelson, Grier, Daniel, Campbell, Catron. Concurring: Taney, Wayne, Nelson, Grier, Daniel, Campbell, Catron. Dissenting: Curtis, McLean. <caselaw.lp.findlaw.com>
Majority:
The words ‘people of the United States’ and ‘citizens’ are synonymous terms, and mean the same thing. They both describe the political body who, according to our republican institutions, form the sovereignty, and who hold the power and conduct the Government through their representatives. They are what we familiarly call the ‘sovereign people,’ and every citizen is one of this people, and a constituent member of this sovereignty. The question before us is, whether the class of persons described in the plea in abatement compose a portion of this people, and are constituent members of this sovereignty? We think they are not, and that they are not included, and were not intended to be included, under the word ‘citizens’ in the Constitution, and can therefore claim none of the rights and privileges which that instrument provides for and secures to citizens of the United States. On the contrary, they were at that time considered as a subordinate and inferior class of beings, who had been subjugated by the dominant race, and, whether emancipated or not, yet remained subject to their authority, and had no rights or privileges but such as those who held the power and the Government might choose to grant them. …
In the opinion of the court, the legislation and histories of the times, and the language used in the Declaration of Independence, show, that neither the class of persons who had been imported as slaves, nor their descendants, whether they had become free or not, were then acknowledged as a part of the people, nor intended to be included in the general words used in that memorable instrument.
[118] Article: “Lincoln, Abraham.” By Gabor S. Boritt (Ph.D., Professor of Civil War Studies, Gettysburg College). World Book Encyclopedia, 2007 Deluxe edition.
“In 1856, Lincoln joined the antislavery Republican Party, then only two years old.”
[119] Article: “Abraham Lincoln Elected President.” History.com. Accessed November 25, 2017 at <www.history.com>
“Abraham Lincoln is elected the 16th president of the United States over a deeply divided Democratic Party, becoming the first Republican to win the presidency.”
[120] Article: “Lincoln, Abraham.” Encyclopædia Britannica Ultimate Reference Suite 2004.
“With the Republicans united, the Democrats divided, and a total of four candidates in the field, he carried the election on November 6. Although he received no votes from the Deep South and no more than 40 out of 100 in the country as a whole, the popular votes were so distributed that he won a clear and decisive majority in the electoral college.”
[121] A Political Text-Book for 1860: Comprising a Brief View of Presidential Nominations and Elections, Including All the National Platforms Ever Yet Adopted. Compiled by Horace Greely and John F. Cleveland. Tribune Association, 1860.
Page 206:
Mr. Lincoln having been invited by the Republicans of Boston, to attend a Festival in honor of the anniversary of Jefferson’s birthday, on the 13th of April, 1859, replied as follows [on April 6, 1859]:
Gentlemen: Your kind note, inviting me to attend a festival in Boston, on the 18th inst., in honor of the birthday of Thomas Jefferson, was duly received. My engagements are such that I cannot attend. Bearing in mind that about seventy years ago two great political parties were first formed in this country; that Thomas Jefferson was the head of one of them and Boston the headquarters of the other, it is both curious and interesting that those supposed to descend politically from the party opposed to Jefferson, should now be celebrating his birthday in their own original seat of empire, while those claiming political descent from him have nearly ceased to breathe his name everywhere.
Remembering, too, that the Jefferson party was formed upon its supposed superior devotion to the personal rights of men, holding the rights of property to be secondary only, and greatly inferior; and then assuming that the so-called Democracy of to-day are the Jefferson, and their opponents the anti-Jefferson parties, it will be equally interesting to note how completely the two have changed ground as to the principle upon which they were originally supposed to be divided.
The Democracy of to-day hold the liberty of one man to be absolutely nothing, when in conflict with another man’s right of property. Republicans, on the contrary, are both for the man and the dollar, but in case of conflict the man before the dollar.
I remember being once much amused at seeing two partially intoxicated men engaged in a fight with their great-coats on, which fight, after a long and rather harmless contest, ended in each having fought himself out of his own coat and into that of the other. If the two leading parties of this day are really identical with the two in the days of Jefferson and Adams, they have performed the same feat as the two drunken men.
But soberly, it is now no child’s play to save the principles of Jefferson from total overthrow in this nation.
One would state with great confidence that he could convince any sane child that the simpler propositions of Euclid are true; but nevertheless, he would fail, with one who should deny the definitions and axioms. The principles of Jefferson are the definitions and axioms of free society. And yet they are denied and evaded, with no small show of success. One dashingly calls them “glittering generalities.” Another bluntly styles them “self-evident lies.” And others insidiously argue that they apply only to “superior races.”
These expressions, differing in form, are identical in object and effect—the supplanting the principles of free government, and restoring those of classification, caste, and legitimacy. They would delight a convocation of crowned heads plotting against the people. They are the vanguard, the sappers and miners, of returning despotism. We must repulse them, or they will subjugate us.
This is a world of compensations; and he who would be no slave must consent to have no slave. Those who deny freedom to others deserve it not for themselves; and, under a just God, cannot long retain it.
All honor to Jefferson—to the man who, in the concrete pressure of a struggle for national independence by a single people, had the coolness, forecast, and capacity, to introduce into a merely revolutionary document an abstract truth, applicable to all men and all times, and so to embalm it there, that to-day and in all coming days it shall be a rebuke and a stumbling-block to the harbingers of reappearing tyranny and oppression.
Your obedient servant, A. LINCOLN.
[122] Book: The American Constitution: Its Origins and Development (3rd edition). By Alfred H. Kelly & Winfred A. Harbison. W. W. Norton & Company, 1963.
Pages 397–398:
As early as the election of 1856, Southern leaders in and out of Congress had repeatedly warned the nation that the South would regard a black Republican presidential victory as justifiable cause for secession. This was no idle political threat, for a large number of Southerners were firmly convinced that a Republican administration would not only destroy Southern interests in the territories that would inaugurate a direct attack upon “internal institutions” in the slave states themselves. With Lincoln’s election in November 1860, the secessionists prepared to carry their threat into effect.
South Carolina acted first. As soon as the result of the election became known, the state legislature called a constitutional convention which met at Charleston on December 17. Three days later, the convention by unanimous vote adopted an ordinance of secession. … Alabama, Georgia, Florida, Mississippi, Louisiana, and Texas had also called conventions, all of which met in January and voted for secession by large majorities. Thus all seven states of the lower South had seceded by the end of January.
[123] First Inaugural Address of Abraham Lincoln, March 4, 1861. <www.nps.gov>
[124] Book: The American Constitution: Its Origins and Development (3rd edition). By Alfred H. Kelly & Winfred A. Harbison. W. W. Norton & Company, 1963.
Page 397: “South Carolina acted first. As soon as the result of the election became known, the state legislature called a constitutional convention which met at Charleston on December 17. Three days later, the convention by unanimous vote adopted an ordinance of secession.”
[125] “Declaration of the Immediate Causes Which Induce and Justify the Secession of South Carolina from the Federal Union.” State of South Carolina, December 24, 1860. <avalon.law.yale.edu>
The people of the State of South Carolina, in Convention assembled, on the 26th day of April, A.D., 1852, declared that the frequent violations of the Constitution of the United States, by the Federal Government, and its encroachments upon the reserved rights of the States, fully justified this State in then withdrawing from the Federal Union; but in deference to the opinions and wishes of the other slaveholding States, she forbore at that time to exercise this right. Since that time, these encroachments have continued to increase, and further forbearance ceases to be a virtue.
And now the State of South Carolina having resumed her separate and equal place among nations, deems it due to herself, to the remaining United States of America, and to the nations of the world, that she should declare the immediate causes which have led to this act. …
In the present case, that fact is established with certainty. We assert that fourteen of the States have deliberately refused, for years past, to fulfill their constitutional obligations, and we refer to their own Statutes for the proof.
The Constitution of the United States, in its fourth Article, provides as follows: “No person held to service or labor in one State, under the laws thereof, escaping into another, shall, in consequence of any law or regulation therein, be discharged from such service or labor, but shall be delivered up, on claim of the party to whom such service or labor may be due.”
This stipulation was so material to the compact, that without it that compact would not have been made. The greater number of the contracting parties held slaves, and they had previously evinced their estimate of the value of such a stipulation by making it a condition in the Ordinance for the government of the territory ceded by Virginia, which now composes the States north of the Ohio River.
The same article of the Constitution stipulates also for rendition by the several States of fugitives from justice from the other States.
The General Government, as the common agent, passed laws to carry into effect these stipulations of the States. For many years these laws were executed. But an increasing hostility on the part of the non-slaveholding States to the institution of slavery, has led to a disregard of their obligations, and the laws of the General Government have ceased to effect the objects of the Constitution. …
A geographical line has been drawn across the Union, and all the States north of that line have united in the election of a man to the high office of President of the United States, whose opinions and purposes are hostile to slavery. He is to be entrusted with the administration of the common Government, because he has declared that that “Government cannot endure permanently half slave, half free,” and that the public mind must rest in the belief that slavery is in the course of ultimate extinction.
[126] “Declaration of Secession.” State of Georgia, January 29, 1861. <www.digitalhistory.uh.edu>
The people of Georgia having dissolved their political connection with the Government of the United States of America, present to their confederates and the world the causes which have led to the separation. For the last ten years we have had numerous and serious causes of complaint against our non-slave-holding confederate States with reference to the subject of African slavery. They have endeavored to weaken our security, to disturb our domestic peace and tranquility, and persistently refused to comply with their express constitutional obligations to us in reference to that property, and by the use of their power in the Federal Government have striven to deprive us of an equal enjoyment of the common Territories of the Republic. This hostile policy of our confederates has been pursued with every circumstance of aggravation which could arouse the passions and excite the hatred of our people, and has placed the two sections of the Union for many years past in the condition of virtual civil war.
Our people, still attached to the Union from habit and national traditions, and averse to change, hoped that time, reason, and argument would bring, if not redress, at least exemption from further insults, injuries, and dangers. Recent events have fully dissipated all such hopes and demonstrated the necessity of separation.
[127] “Declaration of Secession.” State of Mississippi, January 1861. <avalon.law.yale.edu>
In the momentous step which our State has taken of dissolving its connection with the government of which we so long formed a part, it is but just that we should declare the prominent reasons which have induced our course.
Our position is thoroughly identified with the institution of slavery—the greatest material interest of the world. Its labor supplies the product which constitutes by far the largest and most important portions of commerce of the earth. These products are peculiar to the climate verging on the tropical regions, and by an imperious law of nature, none but the black race can bear exposure to the tropical sun. These products have become necessities of the world, and a blow at slavery is a blow at commerce and civilization. That blow has been long aimed at the institution, and was at the point of reaching its consummation. There was no choice left us but submission to the mandates of abolition, or a dissolution of the Union, whose principles had been subverted to work out our ruin.
That we do not overstate the dangers to our institution, a reference to a few facts will sufficiently prove.
[128] “Declaration of Secession.” State of Texas, February 2, 1861. <www.tsl.texas.gov>
Texas abandoned her separate national existence and consented to become one of the Confederated States to promote her welfare, insure domestic tranquility and secure more substantially the blessings of peace and liberty to her people. She was received into the confederacy with her own constitution, under the guarantee of the federal constitution and the compact of annexation, that she should enjoy these blessings. She was received as a commonwealth holding, maintaining and protecting the institution known as negro slavery—the servitude of the African to the white race within her limits—a relation that had existed from the first settlement of her wilderness by the white race, and which her people intended should exist in all future time. Her institutions and geographical position established the strongest ties between her and other slave-holding States of the confederacy. Those ties have been strengthened by association. But what has been the course of the government of the United States, and of the people and authorities of the non-slave-holding States, since our connection with them?
[129] Webpage: “Civil War Facts.” American Battlefield Trust. Accessed July 24, 2018 at <www.battlefields.org>
“The war began when the Confederates bombarded Union soldiers at Fort Sumter, South Carolina on April 12, 1861.”
[130] Webpage: “Cornerstone Speech.” American Battlefield Trust. Accessed August 10, 2020 at <www.battlefields.org>
Savannah, Georgia, March 21, 1861 …
In his March 21, 1861, Cornerstone Speech, Confederate Vice President Alexander H. Stephens presents what he believes are the reasons for what he termed was a “revolution.” This revolution resulted in the American Civil War. Stephens’s speech is remembered by many for its defense of slavery, its outlining of the perceived differences between the North and the South, and the racial rhetoric used to show the inferiority of African Americans. A few weeks after the speech, on April 12, 1861, Confederate forces fired on Fort Sumter in Charleston Harbor, initiating the American Civil War. …
But not to be tedious in enumerating the numerous changes for the better, allow me to allude to one other—though last, not least: the new Constitution has put at rest forever all the agitating questions relating to our peculiar institutions—African slavery as it exists among us—the proper status of the negro in our form of civilization. This was the immediate cause of the late rupture and present revolution. Jefferson, in his forecast, had anticipated this, as the “rock upon which the old Union would split.” He was right. What was conjecture with him, is now a realized fact. But whether he fully comprehended the great truth upon which that rock stood and stands, may be doubted. The prevailing ideas entertained by him and most of the leading statesmen at the time of the formation of the old Constitution were, that the enslavement of the African was in violation of the laws of nature; that it was wrong in principle, socially, morally and politically. It was an evil they knew not well how to deal with; but the general opinion of the men of that day was, that, somehow or other, in the order of Providence, the institution would be evanescent and pass away. This idea, though not incorporated in the Constitution, was the prevailing idea at the time. The Constitution, it is true, secured every essential guarantee to the institution while it should last, and hence no argument can be justly used against the constitutional guarantees thus secured, because of the common sentiment of the day. Those ideas, however, were fundamentally wrong. They rested upon the assumption of the equality of races. This was an error. It was a sandy foundation, and the idea of a Government built upon it fell when the “storm came and the wind blew.”
[131] First Inaugural Address of Abraham Lincoln, March 4, 1861. <www.nps.gov>
Apprehension seems to exist among the people of the Southern States, that by the accession of a Republican Administration, their property, and their peace, and personal security, are to be endangered. There has never been any reasonable cause for such apprehension. Indeed, the most ample evidence to the contrary has all the while existed, and been open to their inspection. It is found in nearly all the published speeches of him who now addresses you. I do but quote from one of those speeches when I declare that “I have no purpose, directly or indirectly, to interfere with the institution of slavery in the States where it exists. I believe I have no lawful right to do so, and I have no inclination to do so.” …
It follows from these views that no State, upon its own mere motion, can lawfully get out of the Union, that resolves and ordinances to that effect are legally void, and that acts of violence within any State or States, against the authority of the United States, are insurrectionary or revolutionary, according to circumstances.
I therefore consider that in view of the Constitution and the laws, the Union is unbroken; and to the extent of my ability I shall take care, as the Constitution itself expressly enjoins upon me, that the laws of the Union be faithfully executed in all the States. Doing this I deem to be only a simple duty on my part; and I shall perform it, so far as practicable, unless my rightful masters, the American people, shall withhold the requisite means, or, in some authoritative manner, direct the contrary. I trust this will not be regarded as a menace, but only as the declared purpose of the Union that it will constitutionally defend and maintain itself.
In doing this there needs to be no bloodshed or violence; and there shall be none, unless it be forced upon the national authority. The power confided to me will be used to hold, occupy, and possess the property and places belonging to the government, and to collect the duties and imposts; but beyond what may be necessary for these objects, there will be no invasion-no using of force against or among the people anywhere. Where hostility to the United States, in any interior locality, shall be so great and so universal, as to prevent competent resident citizens from holding the Federal offices, there will be no attempt to face obnoxious strangers among the people for that object. While the strict legal right may exist in the government to enforce the exercise of these offices, the attempt to do so would be so irritating, and so nearly impracticable with all, that I deem it better to forego, for the time, the uses of such offices. …
One section of our country believes slavery is right, and ought to be extended, while the other believes it is wrong, and ought not to be extended. This is the only substantial dispute. The fugitive slave clause of the Constitution, and the law for the suppression of the fugitive slave trade, are each as well enforced, perhaps, as any law can ever be in a community where the moral sense of the people imperfectly supports the law itself. The great body of the people abide by the dry legal obligation in both cases, and a few break over in each. This, I think, cannot be perfectly cured; and it would be worse in both cases after the separation of the sections, than before. The foreign slave trade, now imperfectly suppressed, would be ultimately revived without restriction, in one section; while the fugitive slaves, now only partially surrendered, would not be surrendered at all, by the other. …
In your hands, my dissatisfied fellow countrymen, and not in mine, is the momentous issue of civil war. The government will not assail you. You can have no conflict, without being yourselves the aggressors. You have no oath registered in Heaven to destroy the government, while I shall have the most solemn one to “preserve, protect and defend” it.
[132] Letter from Abraham Lincoln to Horace Greeley, August 22, 1862.
I would save the Union. I would save it the shortest way under the Constitution. The sooner the national authority can be restored; the nearer the Union will be “the Union as it was.” If there be those who would not save the Union, unless they could at the same time save slavery, I do not agree with them. If there be those who would not save the Union unless they could at the same time destroy slavery, I do not agree with them. My paramount object in this struggle is to save the Union, and is not either to save or to destroy slavery. If I could save the Union without freeing any slave I would do it, and if I could save it by freeing all the slaves I would do it; and if I could save it by freeing some and leaving others alone I would also do that. What I do about slavery, and the colored race, I do because I believe it helps to save the Union; and what I forbear, I forbear because I do not believe it would help to save the Union. I shall do less whenever I shall believe what I am doing hurts the cause, and I shall do more whenever I shall believe doing more will help the cause. I shall try to correct errors when shown to be errors; and I shall adopt new views so fast as they shall appear to be true views.
I have here stated my purpose according to my view of official duty; and I intend no modification of my oft-expressed personal wish that all men every where could be free.
[133] Webpage: “Civil War Facts.” American Battlefield Trust. Accessed July 24, 2018 at <www.battlefields.org>
The war began when the Confederates bombarded Union soldiers at Fort Sumter, South Carolina on April 12, 1861. The war ended in Spring, 1865. Robert E. Lee surrendered the last major Confederate army to Ulysses S. Grant at Appomattox Courthouse on April 9, 1865. The last battle was fought at Palmito Ranch, Texas, on May 13, 1865. … The Northern armies were victorious, and the rebellious states returned to the Union.
[134] Article: “Lincoln, Abraham.” Encyclopædia Britannica Ultimate Reference Suite 2004.
No sooner was he in office than Lincoln received word that the Sumter garrison, unless supplied or withdrawn, would shortly be starved out. … Finally Lincoln ordered the preparation of two relief expeditions, one for Fort Sumter and the other for Fort Pickens, in Florida. …
Without waiting for the arrival of Lincoln’s expedition, the Confederate authorities presented to Major Anderson a demand for Sumter’s prompt evacuation, which he refused. On April 12, 1861, at dawn, the Confederate batteries in the harbour opened fire.
“Then, and thereby,” Lincoln informed Congress when it met on July 4, “the assailants of the Government, began the conflict of arms.” The Confederates, however, accused him of being the real aggressor. They said he had cleverly maneuvered them into firing the first shot so as to put upon them the onus of war guilt. Although some historians have repeated this charge, it appears to be a gross distortion of the facts. Lincoln was determined to preserve the Union, and to do so he thought he must take a stand against the Confederacy. He concluded he might as well take this stand at Sumter.
Lincoln’s primary aim was neither to provoke war nor to maintain peace. In preserving the Union, he would have been glad to preserve the peace also, but he was ready to risk a war that he thought would be short.
[135] 13th Amendment to the U.S. Constitution. Ratified December 6, 1865. <www.justfacts.com>
Section 1. Neither slavery nor involuntary servitude, except as a punishment for crime whereof the party shall have been duly convicted, shall exist within the United States, or any place subject to their jurisdiction.
Section 2. Congress shall have power to enforce this article by appropriate legislation.
[136] Entry: “civil rights.” Britannica Dictionary. Accessed May 25, 2023 at <www.britannica.com>
“the rights that every person should have regardless of his or her sex, race, or religion”
[137] Article: “Lincoln, Abraham.” Encyclopædia Britannica Ultimate Reference Suite 2004.
No sooner was he in office than Lincoln received word that the Sumter garrison, unless supplied or withdrawn, would shortly be starved out. … Finally Lincoln ordered the preparation of two relief expeditions, one for Fort Sumter and the other for Fort Pickens, in Florida. …
Without waiting for the arrival of Lincoln’s expedition, the Confederate authorities presented to Major Anderson a demand for Sumter’s prompt evacuation, which he refused. On April 12, 1861, at dawn, the Confederate batteries in the harbour opened fire.
“Then, and thereby,” Lincoln informed Congress when it met on July 4, “the assailants of the Government, began the conflict of arms.” The Confederates, however, accused him of being the real aggressor. They said he had cleverly maneuvered them into firing the first shot so as to put upon them the onus of war guilt. Although some historians have repeated this charge, it appears to be a gross distortion of the facts. Lincoln was determined to preserve the Union, and to do so he thought he must take a stand against the Confederacy. He concluded he might as well take this stand at Sumter.
Lincoln’s primary aim was neither to provoke war nor to maintain peace. In preserving the Union, he would have been glad to preserve the peace also, but he was ready to risk a war that he thought would be short.
[138] Book: The American Annual Cyclopædia and Register of Important Events of the Year 1865. Volume V. United States, D. Appleton, 1866.
Pages 511–512:
On October 2 [1965], a Democratic Convention was held at New Orleans…. Government J.M. Wells was unanimously nominated by the convention, and the following series of resolutions adopted: …
Resolved, that we hold this to be a Government of white people, made and to be perpetuated for the exclusive benefit of the white race; and in accordance with the constant adjudication of the United States Supreme Court, that people of African descent cannot be considered as citizens of the United States, and that there can, in no event, nor under any circumstances, be any equality between the white and other races.
[139] Article: “The Rise and Fall of Jim Crow: Ku Klux Klan.” By Richard Wormser. PBS. Accessed July 21, 2016 at <www.thirteen.org>
The Ku Klux Klan was formed as a social club by a group of Confederate Army veterans in Pulaski, Tennessee in the winter of 1865–66. … Dressed in robes and sheets, intended to prevent identification by the occupying federal troops (and supposedly designed to frighten blacks), the Klan quickly became a terrorist organization in service of the Democratic Party and white supremacy. Between 1869 and 1871 its goal was to destroy Congressional Reconstruction by murdering blacks—and some whites—who were either active in Republican politics or educating black children. The Klan burned churches and schools and drove thousands of people out of their homes.
[140] Book: White Terror: The Ku Klux Klan Conspiracy and Southern Reconstruction. By Allen W. Trelease. Harper & Row, 1971. <books.google.com>
Page 11:
It may be that the playing of practical jokes on each other broadened into playing them on outsiders, especially Negros. Bullying Negroes was an established pastime with a sizeable portion of Southern white manhood, and the inclination increased with Emancipation. It is also true that many Negroes took their freedom literally and began to act more like white people…. Not only were they less servile, but many of them, poverty-stricken to the last degree and victims of generations of exploitation, engaged in petty thievery at the expense of those more favored than they. … Thus duty and inclination combined to produce bands of post war regulators or vigilantes throughout the South.
[141] Book: Ku Klux Klan: Its Origin, Growth and Disbandment. By John C. Lester and Daniel L. Wilson. Wheeler, Osborn & Duckworth Manufacturing Company, 1884. <www.google.com>
NOTE: John Lester was one of the original six founding Klansmen.
Pages 49–51:
Attempts had been made to correct by positive means evils which menaces had not been sufficient to remove. Rash, imprudent and bad men had gotten into the order. The danger which the more prudent and thoughtful had apprehended as possible was now a reality. Had it been possible to do so, some of the leaders would have been in favor of disbanding. That could not well be done, because at that time the organization was so loose and imperfect. So to speak, the tie that bound them together was too shadowy to be cut or untied. They had evoked a spirit from “the vasty deep.” It would not down at their bidding. And, besides, the Klan was needed. The only course which seemed to promise any satisfactory solution of the difficulty was this: To reorganize the Klan on a plan corresponding to its size and present purposes; to bind the isolated dens together; to secure unity of purpose and concert of action; to hedge the members up by such limitations and regulations as were best adapted to restrain them within proper limits; to distribute the authority among prudent men at local centres, and exact from them a close supervision of those under their charge.
In this way it was hoped the impending dangers would be effectually guarded against. With these objects in view the Grand Cyclops of the Pulaski den sent out a request to all the dens of which he had knowledge, to appoint delegates to meet in convention at Nashville, Tenn., in the early summer of 1867.
[142] Book: White Terror: The Ku Klux Klan Conspiracy and Southern Reconstruction. By Allen W. Trelease. Harper & Row, 1971. <books.google.com>
Page 13:
The details surrounding this even are even hazier than the Klan’s history until this point. Lester and Wilson are very vague and give no names; they say the initiative was taken by the leaders of the Pulaski den, alarmed by the tendency to violence within the order. But if these young men had been motivated solely by that consideration they would probably have done all they could to disband the order and then dissociated themselves from it. They might even have done this publicly for greater effect, as their skirts were still clean. Instead they sought a tighter organization and made plans to turn over the whole concern to men of far greater prestige and authority whose influence extended throughout the state. Here lies the real beginning of the Ku Klux conspiracy of which the nation heard so much in the next five years.
[143] Among the men that guided the Klan’s reorganization and subsequent growth were the following prominent Democrats:
• Nathan Bedford Forrest—first Grand Wizard of the Klan and a Democratic Memphis alderman.
• John W. Morton—Grand Cyclops of the Nashville Klan and a Democrat who became the Tennessee Secretary of State.
• John B. Gordon—head of the Georgia Klan and a Democratic governor and senator.
• George G. Dibrell—Deputy Grand Titan of the Klan and a Democratic congressman from Tennessee.
• Dudley M. DuBose—Grand Titan of the Klan’s Fifth Congressional District and a Democratic congressman from Georgia.
• Fredrick N. Strudwick—Klan leader in North Carolina and a Democratic state representative.
• George W. Gordon—Klan leader and a Democratic congressman from Tennessee.
• John C. Brown—“probable leader” of the Klan and a Democratic governor of Tennessee.
• Edmund Pettus—Grand Dragon of the Alabama Klan and a Democratic senator from Alabama.
[144] Book: White Terror: The Ku Klux Klan Conspiracy and Southern Reconstruction. By Allen W. Trelease. Harper & Row, 1971. <books.google.com>
Page 49:
However striking the Klan’s emergence in Tennessee may have been, it was dwarfed by the order’s spectacular expansion throughout the South during the spring and summer of 1868. The Ku Klux virus infected at least briefly every state of the former Confederacy, plus Kentucky. Most of this expansion—certainly its visible signs—took place almost at once in March and April, at a time when Radical state governments were being organized under the Congressional Reconstruction Acts of 1867. The timing alone is evidence of political inspiration, and Klan activities quickly confirmed it. But as in Tennessee, the Klan’s purpose was political in the broadest sense. It sprang up in opposition to every aspect of Radical Reconstruction: the whole idea of racial equality or “Negro domination,” as white Southerners chose to regard it, economic and social as well as narrowly political.
[145] “Ku Klux Klan: A Report to the Illinois General Assembly.” Illinois Legislative Investigating Commission, October 1976. <www.ojp.gov>
Pages 6–7:
Consequently, many felt that something had to be done to neutralize the perceived designs of the Radical Republicans. And the leaders of the few Ku Klux Klan dens in the Pulaski, Tennessee area proposed a solution in the Spring of 1867—the Ku Klux Klan was to be transformed into a secret political organization.
In April, 1867 Frank O. McCord, one of the six original founders of the Ku Klux Klan and the editor of the Pulaski Citizen (the only newspaper in Giles County) attended the Tennessee State Conservative Convention in Nashville. It is believed that he sold the idea to other prominent Conservatives during his stay in Nashville, and the following month the former Confederate General Nathan Bedford Forrest; became the first and only “Grand Wizard” (national leader) of the order. …
Because central control over the actions of the various local Klan groups did not really exist, it is probably incorrect to refer to the Ku Klux Klan as a single organization. Rather, because of the autonomy of the local Klan dens and because of the parallel rise of similar organizations throughout the South, it is probably more accurate to characterize the Klan as a loose association of autonomous local Klan organizations which were only a part of a regional movement to eliminate all vestiges of Radical Republican Control in the South.
What made the Ku Klux Klan so distinctive, and eventually notorious, was the degree of violence that local Klan organizations employed to achieve their political purpose. It was the most violent of the organizations that arose to neutralize the Radical Reconstruction. Furthermore, it appears that more local groups affiliated with the Klan than with any other anti-Republican organization in the South, making it more visible throughout the region.
[146] Article: “Ku Klux Klan.” Encyclopædia Britannica Ultimate Reference Suite 2004.
Klan members sought the restoration of white supremacy through intimidation and violence aimed at the newly enfranchised black freedmen. …
…Dressed in robes and sheets designed to frighten superstitious blacks and to prevent identification by the occupying federal troops, Klansmen whipped and killed freedmen and their white supporters in nighttime raids. …
The 19th-century Klan reached its peak between 1868 and 1870. A potent force, it was largely responsible for the restoration of white rule in North Carolina, Tennessee, and Georgia. But Forrest ordered it disbanded in 1869, largely as a result of the group’s excessive violence. Local branches remained active for a time, however, prompting Congress to pass the Force Act in 1870 and the Ku Klux Act in 1871. …
… In United States v. Harris in 1882, the Supreme Court declared the Ku Klux Act unconstitutional, but by that time the Klan had practically disappeared.
It disappeared because its original objective—the restoration of white supremacy throughout the South—had been largely achieved during the 1870s. The need for a secret antiblack organization diminished accordingly.
[147] Book: White Terror: The Ku Klux Klan Conspiracy and Southern Reconstruction. By Allen W. Trelease. Harper & Row, 1971. <books.google.com>
Page xlv:
The violence became more organized. In South Carolina white rifle clubs were organized, replacing the dissolved state militia. Eventually similar organizations would spring up in other states of the deep South, and they contributed importantly to the final overthrow of Reconstruction. But the more immediate source of harassment for Negroes and white Republicans throughout the South was the secret societies epitomized by the Ku Klux Klan.
Page xlvi:
The overriding purpose of the Ku Klux movement, no matter how decentralized, was the maintenance or restoration of white supremacy in every walk of life.
Page xlvii:
It punished Negro assertions of social equality and real or imaginary insolence. It conducted a vendetta against the teachers of Negro schools.
[148] “Report of the Joint Select Committee to Inquire into the Condition of Affairs in the Late Insurrectionary States,” U.S. Congress, 1872. <onlinebooks.library.upenn.edu>
Testimony, Alabama, Pages 679–686:
William Ford (colored) sworn and examined. …
They asked me who I was going to vote for; for Grant and Colfax, or Blair and Seymour [the Democrat candidates], and I claimed to them, as they had me out there overpowered, that I would vote for Blair and Seymour. I did that to get off. …
I don’t think the republican party got a vote in the district at all, or up there at Maysville. We all were kept away. The principal part of them—well, all—were kept away on account of being interrupted by Ku-Klux. …
There are some few, but very few, democratic colored folks. There is a good many of them that vote for the democratic ticket to keep on the good side of the white people, to keep from being interfered with, but most of them didn’t vote at all. When they can’t vote for a republican they don’t vote at all.
Testimony, Alabama, Pages 1649–1654:
Robert Fullerlove (colored) sworn and examined. …
They told me after my house was attacked the last time, if I would come over to the democratic side, they would stop this and it would save my life; and if I didn’t do it, I would be a dead man.
[149] “Report of the Joint Select Committee to Inquire into the Condition of Affairs in the Late Insurrectionary States,” U.S. Congress, 1872. <onlinebooks.library.upenn.edu>
Testimony, South Carolina, Pages 1256–60:
William K. Tolbert, of lawful age, being duly sworn …
Q. Were there any other instructions given to these committees by the democratic clubs in relation to the election to be held on the 3rd November?—A. Yes, sir. The day before the election the tickets were taken away from the republican party, from those who had charge of the tickets, by these committees. The committees were searching for them the night before the election, taking them wherever they could find them. I was one of the gangs myself. Ten or eleven were with me. I was a member of the committee myself. Destroyed the tickets. All of us were armed.
Q. What were your instructions if the persons having the tickets in charge refused to give them up?—A. Shoot them and take them by force. …
—A. Well, the negros, to the number of about 400 voters, in Abbeville County, assembled about 150 yards from the polls. The white men, democrats, were all around the door. Captain J.G. Boozer was sitting right by the door to examine the tickets. Don’t know whether Boozer was appointed. He was there for that business. Two republicans, colored men, came up to vote. They came from the main body. He said, “Let me see your papers.” They pulled out the republican tickets, with Hoge’s name on them for Congress. He told them tat they could not vote them sort there; they would have to go somewhere else to vote those papers. Boozer was armed. They turned back to the main body, who saw that there was no change to vote; so they disbanded and went home, about 400 of them, all voters in Abbeville county.
Q. Who would those men have voted for it they had been allowed to vote?—A. For the republican ticket, of course; for Judge Hoge for Congress. …
Q. State if it was safe for republican speakers to canvass that county.—A. No, sir; it was not safe.
Q. What was the general understanding as to how republican speakers were to be treated?—A. Shoot them; kill them; stop it.
Q. State if, in accordance with that general understanding in the county, any republican leaders or speakers were killed or shot.—A. There were. …
Q. About what proportion of the members of the democratic party in Abbeville belonged to that Klan?—A. Nearly all.
[150] “Report of the Joint Select Committee to Inquire into the Condition of Affairs in the Late Insurrectionary States,” U.S. Congress, 1872. <onlinebooks.library.upenn.edu>
Page 327: Letter from W. M. Harrison to Powell Clayton (Governor of Arkansas), November 5, 1868. <quod.lib.umich.edu>
Governor: I deem it my duty to lay before you a brief statement of affairs in this county. …
Many threats were made against all, white and black, who dared vote the republican ticket. Myself and Judge Preddy and one or two others were particularly named. The word was put out by them on Sunday that the roads would be picketed, and all colored men would be killed who voted with the republicans. Some sixty-five colored men came into the election; not one dared vote the republican ticket, and not two, I believe, desired to vote the Democratic. … Our sheriff and clerk, to save their lives, have declared themselves democrats. Mr. Butler, president of the board of registrars, did not come to the polls. Mr. Good another member of the board, did not vote. Mr. Z. H. Manees, our representative, an earnest republican, under fear of death voted the democratic ticket. I am not terrified, but think it probable I shall be assassinated in a few days. I shall die a republican. I pray you send us at least ten or fifteen soldiers.
[151] Webpage: “The Ku Klux Klan,” U.S. Capitol Visitor’s Center. Accessed June 9, 2022 at <www.visitthecapitol.gov>
“A Joint Committee to Inquire into the Conditions of Affairs in the Late Insurrectionary States formed in 1871 and exposed the Klan’s tactics, hastening a decline that lasted until the 1920s.”
[152] “Report of the Joint Select Committee to Inquire into the Condition of Affairs in the Late Insurrectionary States,” U.S. Congress, 1872. <onlinebooks.library.upenn.edu>
[153] “Report of the Joint Select Committee to Inquire into the Condition of Affairs in the Late Insurrectionary States,” U.S. Congress, 1872. <onlinebooks.library.upenn.edu>
Page 289: “Minority Report” <quod.lib.umich.edu>
Pages 583–84:
Any one who shall travel, with his eyes open, through Virginia and South Carolina will at once see the difference between the civilization of the white and black races in the science of government, and the folly and madness of the proposition that any country can prosper where the Anglo-Saxon is made politically subordinate to the African. … The most prominent disorders which now exist anywhere in the South are among and between the republicans themselves.
Page 516:
It was an oft-quoted political apothegm, long prior to the war, that no government could exist “half slave and half free.” The paraphrase of that proposition is equally true, that no government can long exist “half black and half white.” If the republican party, or its all-powerful leaders in the North, cannot see this, if they are so absorbed in the idea of this newly discovered political divinity in the negro, that they cannot comprehend its social repugnance or its political dangers; or, knowing it, have the wanton, wicked, and criminal purpose of disregarding its consequences … why then “farewell, a long farewell,” to constitutional liberty on this continent, and the glorious form of government bequeathed to us by our fathers.
Page 292:
While we do not intend to deny that bodies of disguised men have, in several of the States of the South, been guilty of the most flagrant crimes, crimes which we neither seek to palliate nor excuse, for the commission of which the wrongdoers should, when ascertained and duly convicted, suffer speedy and condign punishment, we deny that these men have any general organization, or any political significance, or that their conduct is indorsed by any respectable number of the white people in any state….
[154] Book: White Terror: The Ku Klux Klan Conspiracy and Southern Reconstruction. By Allen W. Trelease. Harper & Row, 1971. <books.google.com>
Page xlvii:
The one really new ingredient of regulator activity after 1867 was political opposition to the Radicals. And so far as the Klan loomed larger than the earlier vigilante groups, this was undoubtedly the reason. Only now did upper-class elements and Conservative political leaders take much interest in the idea. The Klan became in effect a terrorist arm of the Democratic party, whether the party leaders as a whole like it or not.
Page 114:
Nearly all members regarded the Klan (to use the generic term) as a secret political society in behalf of the Democratic party. Often they saw the deterrence or suppression of Negro crime, whether or not sponsored by the Union League, as another objective, but distinctly subsidiary.
Page 115:
As elsewhere, there was some talk of defensive organization against a possible Negro rising—this stimulated a continuing growth of the rifle clubs and led them to import repeating rifles as in North Carolina—but the Klan itself was universally regarded as a Democratic political device. It was still impossible to draw a distinct line between the Klan, the rifle clubs, and Democratic clubs.
[155] Book: White Terror: The Ku Klux Klan Conspiracy and Southern Reconstruction. By Allen W. Trelease. Harper & Row, 1971. <books.google.com>
Page 128:
Here, as in neighboring St. Martin, Lafayette, and Vermilion parishes, bands of armed men beginning in September regularly patrolled country roads on horseback and town streets on foot, and made the rounds of Negro cabins. sometimes they wore disguises and operated after dark, but more often they traveled without concealment and in broad daylight.
Although they sometimes argued the danger of a Negro uprising as the pretext for these activities, the whole operation was obviously and almost exclusively political. Republicans of both races were systematically threatened with death; a few were killed and others were forced to flee. Negroes were sometimes issued ‘protection papers’ if they promised to vote the Democratic ticket. Republican meetings were either broken up or prevented in advance, and it became impossible to express Republican views in public.
[156] Book: White Terror: The Ku Klux Klan Conspiracy and Southern Reconstruction. By Allen W. Trelease. Harper & Row, 1971. <books.google.com>
Page 309: “Most Democrats asserted that no regular or continuing Ku Klux organization existed in their counties, or in the state if they were statewide figures, and they denied even more vehemently that they disguised bands were politically motivated. Even those few who advocated prosecuting the terrorists grew furious at the thought of federal intervention for this purpose.”
Page xlvii: “Few Democrats were willing to admit the Klan’s political character and purpose, at least until long afterward, and Northern Democrats joined them in denying the obvious.”
[157] “Report of the Joint Select Committee to Inquire into the Condition of Affairs in the Late Insurrectionary States,” U.S. Congress, 1872. <onlinebooks.library.upenn.edu>
Testimony, Alabama, Pages 159–65:
June 16, 1871. Governor Robert B. Lindsay sworn and examined. ...
I will qualify my statement, however, by saying that up to the present time, and until these cases were brought to my knowledge, reported outrages by Ku-Klux or disguised persons had ceased for the last two years. Occasionally, during that time, it was reported that men had disguised themselves. I will refer to some particularly. I stated that I had heard, and from hearsay had reason to believe, that there was an organization known as the Ku-Klux organization; I only speak of that from hearsay. But I also heard, and has as much reason to believe, that that organization was disbanded in the State of Alabama upward of two years ago. And in this connection I may as well say that it is my solemn belief that there is no such thing to-day as a Ku-Klux organization within the limits of the State of Alabama.
NOTE: Lindsay was a Democrat. Per the academic book White Terror (Page 302): “Many Alabama Democrats had promised that outrages would fall off if they won the state elections in November 1870. Within limits this happened, but armed and disguised bands continued to traverse much of the state in 1871.”
[158] Statement of Senator John Stevenson, former Governor of Kentucky. March 18, 1871. Congressional Globe, 42nd Congress, Senate 1st Session. <web.archive.org>
Page 164:
I do not deny the fact that occasional acts of violence have been committed in Kentucky…. Perhaps during the last three and a half years that I administered the government of that State a dozen instances of violence did occur, not more; and what did they amount to? There was no evidence that they were the act of any secret political organization in that State. I know there are bad men in both parties; bad men do wrong everywhere; but I aver that I do not believe that the organization committing these outrages amounted to fifty men, and they confined to one locality.
NOTE: Stevenson was a Democrat. Per the academic book White Terror (Page 315): “The Frankfort Commonwealth listed eighty-one murders and seventy shootings or whippings during Stevenson’s governorship, as opposed to the minute figure given by him.”
[159] Book: White Terror: The Ku Klux Klan Conspiracy and Southern Reconstruction. By Allen W. Trelease. Harper & Row, 1971. <books.google.com>
Page 309: “Democratic newspapers continued to ignore violence more than they condemned it.”
Page 97:
The Democratic press in Louisiana played its familiar role as Klan apologist. In the spring it reported the order’s expansion and carried stories of miraculous hooded apparitions, water drinking, and other high jinks, along with pointed warnings to Radicals. But as atrocities came to be reported in the Republican papers, it began viewing the Ku Klux as a colossal hoax, or at least grossly exaggerated. As early as May 16 the New Orleans Times denied the existence of any such order, except as rural pranksters practiced foolish jokes on the freedmen “to keep them from stealing chickens and pigs in the night…. To this, and this alone, is due the existence of the frightful myth, the Ku Klux Klan.”
[160] Untitled Editorial. New York Tribune, October 19, 1868. <chroniclingamerica.loc.gov>
“The Ku-Klux Klan, with its murders, its arsons, and its tortures, have been declared by the Seymour papers to be a mythical maggot of distempered Republican brains.”
NOTE: Horatio Seymour was the Democratic candidate in the 1868 presidential election.
[161] Paper: “Klan Skepticism and Denial in Reconstruction-Era Public Discourse.” By Elaine Frantz Parsons. Journal of Southern History, February 2011. Pages 53–90. <www.jstor.org>
Pages 70–71:
Rejection of Klan evidence by Democrats and, at various times, by members of Republican factions hoping to play down Klan violence remained surprisingly bold and thorough through the Klan period, though their position was increasingly implausible. It was one thing to dismiss the Klan in 1868 as “a mythical maggot of distempered Republican brains,” but Klan deniers gave little ground as evidence accumulated.54 Democratic newspapers printed blanket denials of the existence of the Klan during and after its most active period of violence. It “has existence only in the imaginations of President Grant and the vile politicians who have poisoned his ears with false and malicious reports…. [T]he reports of collisions between armed bands of Ku-Klux and Federal troops are utterly false, base, and slanderous fabrications, uttered for a purpose.”55 Rather than retreat and regroup as more evidence about the Klan slammed their position, Klan deniers stood firm.
[162] Speech: “Enforcement of Fourteenth Amendment.” By Hon. C. W. Buckley, April 3, 1871. Appendix to the Congressional Globe, 42nd Congress, House of Representatives 1st Session. <web.archive.org>
Page 191:
After the above occurrence the editor of the Greensboro Beacon (Democratic) comes out in the following candid style:
“But it strikes us that the time has arrived, in this section at least, when it becomes the duty of all who have the good of the country at heart to aid, to the full extent of their influence, in suppressing lawless organizations and in securing the enforcement of the laws.
And one of the first steps to be taken to accomplish this most desirable result, is to bring about a sound public opinion. How, it may be asked, is that to be done?
In this work the press can do much, but, judging of the future by the past, we are not hopeful as to unanimity of action or views in that quarter. For to the teachings of some of the newspaper fraternity are the public greatly indebted for the evils upon which we are animadverting. So grossly personal and abusive have many of them been in their political discussions that a portion of their readers have come to look upon it as not only no crime, but a patriotic duty, to do personal violence to those who render themselves obnoxious by their political opinions.”
[163] Book: The American Constitution: Its Origins and Development (3rd edition). By Alfred H. Kelly & Winfred A. Harbison. W. W. Norton & Company, 1963.
Page 454:
Well before the war ended, this block, which came to be known as Radicals or Radical Republicans, assumed a more positive role in opposing the reconstruction program and favoring more extreme measures. This group objected to Lincoln’s program on several counts. First, while the program implied the abolition of slavery, it guaranteed neither Negro suffrage nor Negro civil rights. Many Radicals were convinced that the Negro ought to be elevated forcibly to a position of civil, social and political equality with the whites.
Page 459: “The Civil Rights Bill, passed by Congress on March 13, embodied another and more detailed attempt by the Radicals to extend federal guarantees over Negro civil rights.”
Page 460: “[Andrew] Johnson vetoed the bill, cogently presenting the same objections as he had stated against the Freedmen’s Bureau Bill, but Congress on April 9 passed the law over his veto.”
[164] “An Act to Protect All Persons in the United States in Their Civil Rights, and Furnish the Means of Their Vindication.” 39th U.S. Congress. Enacted into law on April 9, 1866 when Congress overrode a veto by President Andrew Johnson. <tile.loc.gov>
Chap. XXXI. — An Act to protect all Persons in the United States in their Civil Rights, and furnish the Means of their Vindication.
Be it enacted by the Senate and House of Representatives of the United States of America in Congress assembled, That all persons born in the United States and not subject to any foreign power, excluding Indians not taxed, are hereby declared to be citizens of the United States; and such citizens, of every race and color, without regard to any previous condition of slavery or involuntary servitude, except as a punishment for crime whereof the party shall have been duly convicted, shall have the same right, in every State and Territory in the United States, to make and enforce contracts, to sue, be parties, and give evidence, to inherit, purchase, lease, sell, hold, and convey real and personal property, and to full and equal benefit of all laws and proceedings for the security of person and property, as is enjoyed by white citizens, and shall be subject to like punishment, pains, and penalties, and to none other, any law, statute, ordinance, regulation, or custom, to the contrary notwithstanding.
Sec. 2. And be it further enacted, That any person who, under color of any law, statute, ordinance, regulation, or custom, shall subject, or cause to be subjected, any inhabitant of any State or Territory to the deprivation of any right secured or protected by this act, or to different punishment, pains, or penalties on account of such person having at any time been held in a condition of slavery or involuntary servitude, except as a punishment for crime whereof the party shall have been duly convicted, or by reason of his color or race, than is prescribed for the punishment of white persons, shall be deemed guilty of a misdemeanor, and, on conviction, shall be punished by fine not exceeding one thousand dollars, or imprisonment not exceeding one year, or both, in the discretion of the court. …
Sec. 6. And be it further enacted, That any person who shall knowingly and willfully obstruct, hinder, or prevent any officer, or other person charged with the execution of any warrant or process issued under the provisions of this act … [shall] be subject to a fine not exceeding one thousand dollars, and imprisonment not exceeding six months ….
[165] Webpage: “Andrew Johnson.” White House. Accessed July 24, 2018 at <www.whitehouse.gov>
During the secession crisis, Johnson remained in the Senate even when Tennessee seceded, which made him a hero in the North and a traitor in the eyes of most Southerners. In 1862 President Lincoln appointed him Military Governor of Tennessee, and Johnson used the state as a laboratory for reconstruction. In 1864 the Republicans, contending that their National Union Party was for all loyal men, nominated Johnson, a Southerner and a Democrat, for Vice President.
After Lincoln’s death, President Johnson proceeded to reconstruct the former Confederate States while Congress was not in session in 1865. He pardoned all who would take an oath of allegiance, but required leaders and men of wealth to obtain special Presidential pardons.
[166] Book: The American Constitution: Its Origins and Development (3rd edition). By Alfred H. Kelly & Winfred A. Harbison. W. W. Norton & Company, 1963.
Page 458: “By early January of 1866, the Radicals [Radical Republicans] were openly formulating their own program, and so preparing for a decisive conflict with the President. … A series of tentative Radical measures eventually led to the formulation of the Fourteenth Amendment to the Constitution, adopted by Congress in June 1866.”
Pages 460–461:
Although the Democratic minority continued to support the [Johnson] administration, the Radical Republican majority promptly passed all important reconstruction measures over Johnson’s veto. …
After some further delay, the Joint Committee on April 30 [1866] reported out a far more comprehensive constitutional amendment, destined to emerge with some modifications as the Fourteenth Amendment. …
These provisions, largely the work of Representative John A. Bingham of Ohio, were intended to remove all doubt as to the constitutionality of the Civil Rights Act, as Stevens presently made clear in debate.
[167] Book: Processes of Constitutional Decision-Making: Cases and Materials (5th edition). By Paul Brest and others. Aspen Publishers, 2006.
Senator Jacob Howard, Speech Introducing the Fourteenth Amendment
Speech delivered in the U.S. Senate, May 23, 1866
[Senator Jacob Howard of Michigan was a member of the Joint Committee on Reconstruction that drafted the Fourteenth Amendment. He was the floor manager for the Amendment in the Senate. In this speech, he introduces the Amendment on the floor of the Senate and explains its purposes.]
I can only promise to present to the Senate, in a very succinct way, the views and the motives which influenced th[e] committee, so far as I understand those views and motives, in presenting the report which is now before us for consideration, and the ends it aims to accomplish. …
The first section [of the 14th Amendment] … relates to the privileges and immunities of citizens of the several States, and to the rights and privileges of all persons, whether citizens or others, under the laws of the United States. …
To these privileges and immunities, whatever they may be—for they are not and cannot be fully defined in their entire extent and precise nature—to these should be added the personal rights guarantied and secured by the first eight amendments of the Constitution; such as the freedom of speech and of the press; the right of the people peaceably to assemble and petition the Government for a redress of grievances, a right appertaining to each and all the people; the right to keep and to bear arms; the right to be exempted from the quartering of soldiers in a house without the consent of the owner; the right to be exempt from unreasonable searches and seizures, and from any search or seizure except by virtue of a warrant issued upon a formal oath or affidavit; the right of an accused person to be informed of the nature of the accusation against him, and his right to be tried by an impartial jury of the vicinage; and also the right to be secure against excessive bail and against cruel and unusual punishments.
Now, sir, here is a mass of privileges, immunities, and rights, some of them secured by the second section of the fourth article of the Constitution, which I have recited, some by the first eight amendments of the Constitution; and it is a fact well worthy of attention that the course of decision of our courts and the present settled doctrine is, that all these immunities, privileges, rights, thus guarantied by the Constitution or recognized by it, are secured to the citizen solely as a citizen of the United States and as a party in their courts. They do not operate in the slightest degree as a restraint or prohibition upon State legislation. States are not affected by them, and it has been repeatedly held that the restriction contained in the Constitution against the taking of private property for public use without just compensation is not a restriction upon State legislation, but applies only to the legislation of Congress.
Now, sir, there is no power given in the Constitution to enforce and to carry out any of these guarantees. They are not powers granted by the Constitution to Congress, and of course do not come within the sweeping clause of the Constitution authorizing Congress to pass all laws necessary and proper for carrying out the foregoing or granted powers, but they stand simply as a bill of rights in the Constitution, without power on the part of Congress to give them full effect; while at the same time the States are not restrained from violating the principles embraced in them except by their own local constitutions, which may be altered from year to year. The great object of the first section of this amendment is, therefore, to restrain the power of the States and compel them at all times to respect these great fundamental guarantees….
[168] 14th Amendment to the U.S. Constitution. Ratified July 9, 1868. <www.justfacts.com>
Section 1. All persons born or naturalized in the United States, and subject to the jurisdiction thereof, are citizens of the United States and of the State wherein they reside. No State shall make or enforce any law which shall abridge the privileges or immunities of citizens of the United States; nor shall any State deprive any person of life, liberty, or property, without due process of law; nor deny to any person within its jurisdiction the equal protection of the laws.
Section 2. Representatives shall be apportioned among the several States according to their respective numbers, counting the whole number of persons in each State, excluding Indians not taxed. But when the right to vote at any election for the choice of electors for President and Vice President of the United States, Representatives in Congress, the Executive and Judicial officers of a State, or the members of the Legislature thereof, is denied to any of the male inhabitants of such State, being twenty-one years of age, and citizens of the United States, or in any way abridged, except for participation in rebellion, or other crime, the basis of representation therein shall be reduced in the proportion which the number of such male citizens shall bear to the whole number of male citizens twenty-one years of age in such State.
Section 3. No person shall be a Senator or Representative in Congress, or elector of President and Vice President, or hold any office, civil or military, under the United States, or under any State, who, having previously taken an oath, as a member of Congress, or as an officer of the United States, or as a member of any State legislature, or as an executive or judicial officer of any State, to support the Constitution of the United States, shall have engaged in insurrection or rebellion against the same, or given aid or comfort to the enemies thereof. But Congress may by a vote of two-thirds of each House, remove such disability.
Section 4. The validity of the public debt of the United States, authorized by law, including debts incurred for payment of pensions and bounties for services in suppressing insurrection or rebellion, shall not be questioned. But neither the United States nor any State shall assume or pay any debt or obligation incurred in aid of insurrection or rebellion against the United States, or any claim for the loss or emancipation of any slave; but all such debts, obligations and claims shall be held illegal and void.
Section 5. The Congress shall have power to enforce, by appropriate legislation, the provisions of this article.
[169] 15th Amendment to the U.S. Constitution. Ratified February 3, 1870. <www.justfacts.com>
Section 1. The right of citizens of the United States to vote shall not be denied or abridged by the United States or by any State on account of race, color, or previous condition of servitude.
Section 2. The Congress shall have power to enforce this article by appropriate legislation.
[170] “An Act to Enforce the Right of Citizens of the United States to Vote in
the Several States of This Union, and for Other Purposes.” 41st U.S. Congress. Signed into law by Ulysses S. Grant on May 31, 1870. <tile.loc.gov>
CHAP. CXIV. — An Act to enforce the Right of Citizens of the United States to vote in the several States of this Union, and for other Purposes.
Be it enacted by the Senate and House of Representatives of the United States of America in Congress assembled, That all citizens of the United States who are or shall be otherwise qualified by law to vote at any election by the people in any State, Territory, district, county, city, parish, township, school district, municipality, or other territorial subdivision, shall be entitled and allowed to vote at all such elections, without distinction of race, color, or previous condition of servitude; any constitution, law, custom, usage, or regulation of any State or Territory, or by or under its authority, to the contrary notwithstanding.
Sec. 2. And be it further enacted, That it shall be the duty of every person and officer to give to all citizens of the United States the same and equal opportunity to perform [any] prerequisite, and to become qualified to vote without distinction of race, color, or previous condition of servitude; and if any person or officer shall refuse or knowingly omit to give full effect to this section, he shall he shall, for every such offence, forfeit and pay the sum of five hundred dollars to the person aggrieved thereby, to be recovered by an action on the case, with full costs, and such allowance for counsel fees as the court shall deem just, and shall also, for every such offence, be deemed guilty of a misdemeanor, and shall, on conviction thereof, be fined not less than five hundred dollars, or be imprisoned not less than one month and not more than one year, or both, at the discretion of the court. …
Sec. 6. And be it further enacted, That if two or more persons shall band or conspire together, or go in disguise upon the public highway, or upon the premises of another, with intent to violate any provision of this act, or to injure, oppress, threaten, or intimidate any citizen with intent to prevent or hinder his free exercise and enjoyment of any right or privilege granted or secured to him by the Constitution or laws of the United States, or because of his having exercised the same, such persons shall be held guilty of felony, and, on conviction thereof, shall be fined or imprisoned, or both, at the discretion of the court,— the fine not to exceed five thousand dollars, and the imprisonment not to exceed ten years,—and shall, moreover, be thereafter ineligible to, and disabled from holding, any office or place of honor, profit, or trust created by the Constitution or laws of the United States. …
Sec. 17. And be it further enacted, That any person who, under color of any law, statute, ordinance, regulation, or custom, shall subject, or cause to be subjected, any inhabitant of any State or Territory to the deprivation of any right secured or protected by the last preceding section [giving all persons the same rights as white citizens] of this act, or to different punishment, pains, or penalties on account of such person being an alien, or by reason of his color or race, than is prescribed for the punishment of citizens, shall be deemed guilty of a misdemeanor, and, on conviction, shall be punished by fine not exceeding one thousand dollars, or imprisonment not exceeding one year, or both, in the discretion of the court.
[171] “An Act to Enforce the Provisions of the Fourteenth Amendment to the Constitution of the United States, and for Other Purposes.” 42nd U.S. Congress. Signed into law by Ulysses S. Grant on April 20, 1871. <tile.loc.gov>
Chap. XXII. — An Act to enforce the Provisions of the Fourteenth Amendment to the Constitution of the United States, and for other Purposes.
Be it enacted by the Senate and House of Representatives of the United States of America in Congress assembled, That any person who, under color of any law, statute, ordinance, regulation, custom, or usage of any State, shall subject, or cause to be subjected, any person within the jurisdiction of the United States to the deprivation of any rights, privileges, or immunities secured by the Constitution of the United States, shall, any such law, statute, ordinance, regulation, custom, or usage of the State to the contrary notwithstanding, be liable to the party injured in any action at law, suit in equity, or other proper proceeding for redress; such proceeding to be prosecuted in the several district or circuit courts of the United States, with and subject to the same rights of appeal, review upon error, and other remedies provided in like cases in such courts, under the provisions of the act of the ninth of April, eighteen hundred and sixty-six, entitled “An act to protect all persons in the United States in their civil rights, and to furnish the means of their vindication”; and the other remedial laws of the United States which are in their nature applicable in such cases.
Sec. 2. That if two or more persons within any State or Territory of the United States shall conspire together to overthrow, or to put down, or to destroy by force the government of the United States, or to levy war against the United States, or to oppose by force the authority of the government of the United States, or by force, intimidation, or threat to prevent, hinder, or delay the execution of any law of the United States, or by force to seize, take, or possess any property of the United States contrary to the authority thereof, or by force, intimidation, or threat to prevent any person from accepting or holding any office or trust or place of confidence under the United States, or from discharging the duties thereof, or by force, intimidation, or threat to induce any officer of the United States to leave any State, district, or place where his duties as such officer might lawfully be performed, or to injure him in his person or property on account of his lawful discharge of the duties of his office, or to injure his person while engaged in the lawful discharge of the duties of his office, or to injure his property so as to molest, interrupt, hinder, or impede him in the discharge of his official duty, or by force, intimidation, or threat to deter any party or witness in any court of the United States from attending such court, or from testifying in any matter pending in such court fully, freely, and truthfully, or to injure any such party or witness in his person or property on account of his having so attended or testified, or by force, intimidation, or threat to influence the verdict, presentment, or indictment, of any juror or grand juror in any court of the United States, or to injure such juror in his person or property on account of any verdict, presentment, or indictment lawfully assented to by him, or on account of his being or having been such juror, or shall conspire together, or go in disguise upon the public highway or upon the premises of another for the purpose, either directly or indirectly, of depriving any person or any class of persons of the equal protection of the laws, or of equal privileges or immunities under the laws, or for the purpose of preventing or hindering the constituted authorities of any State from giving or securing to all persons within such State the equal protection of the laws, or shall conspire together for the purpose of in any manner impeding, hindering, obstructing, or defeating the due course of justice in any State or Territory, with intent to deny to any citizen of the United States the due and equal protection of the laws, or to injure any person in his person or his property for lawfully enforcing the right of any person or class of persons to the equal protection of the laws, or by force, intimidation, or threat to prevent any citizen of the United States lawfully entitled to vote from giving his support or advocacy in a lawful manner towards or in favor of the election of any lawfully qualified person as an elector of President or Vice-President of the United States, or as a member of the Congress of the United States, or to injure any such citizen in his person or property on account of such support or advocacy, each and every person so offending shall be deemed guilty of a high crime, and, upon conviction thereof in any district or circuit court of the United States or district or supreme court of any Territory of the United States having jurisdiction of similar offences, shall be punished by a fine not less than five hundred nor more than five thousand dollars, or by imprisonment, with or without hard labor, as the court may determine, for a period of not less than six months nor more than six years, as the court may determine, or by both such fine and imprisonment as the court shall determine….
[172] “An Act to Protect All Citizens in Their Civil and Legal Rights.” 43rd U.S. Congress. Signed into law by Ulysses S. Grant on March 1, 1875. <tile.loc.gov>
Chap. 114. — An act to protect all citizens in their civil and legal rights.
Whereas, it is essential to just government we recognize the equality of all men before the law, and hold that it is the duty of government in its dealings with the people to mete out equal and exact justice to all, of whatever nativity, race, color, or persuasion, religious or political; and it being the appropriate object of legislation to enact great fundamental principles into law: Therefore,
Be it enacted by the Senate and House of Representatives of the United States of America in Congress assembled, That all persons within the jurisdiction of the United States shall be entitled to the full and equal enjoyment of the accommodations, advantages, facilities, and privileges of inns, public conveyances on land or water, theaters, and other places of public amusement; subject only to the conditions and limitations established by law, and applicable alike to citizens of every race and color, regardless of any previous condition of servitude.
Sec. 2. That any person who shall violate the foregoing section by denying to any citizen, except for reasons by law applicable to citizens of every race and color, and regardless of any previous condition of servitude, the full enjoyment of any of the accommodations, advantages, facilities, or privileges in said section enumerated, or by aiding or inciting such denial, shall, for every such offense, forfeit and pay the sum of five hundred dollars to the person aggrieved thereby, to be recovered in an action of debt, with full costs; and shall also, for every such offense, be deemed guilty of a misdemeanor and, upon conviction thereof, shall be fined not less than five hundred nor more than one thousand dollars, or shall be imprisoned not less than thirty days nor more than one year….
Sec. 4. That no citizen possessing all other qualifications which are or may be prescribed by law shall be disqualified for service as a grand or petit juror in any court of the United States, or of any State, on account of race, color, or previous condition of servitude; and any officer or other person charged with any duty in the selection or summoning of jurors who shall exclude or fail to summon any citizen for the cause aforesaid shall, on conviction thereof, be deemed guilty of a misdemeanor and be fined not more than five thousand dollars.
[173] Article: “The Rise and Fall of Jim Crow: The Enforcement Acts (1870–71).” By Richard Wormser. PBS. Accessed July 21, 2016 at <www.pbs.org>
One of the Acts, the Ku Klux Klan Act of 1871, made private criminal acts federal crimes; consequently, President Grant decreed that “insurgents were in rebellion against the authority of the United States.” He sent federal troops to restore law and order to many areas where violence was raging at its worst. …
In nine counties of South Carolina, martial law was declared and Klansmen were tried before predominantly black juries. … As a result of his efforts, a few hundred Klansmen were tried and sent to jail. Thousands of others fled or were let off with fines or warnings.
[174] Webpage: “Ku Klux Klan.” History.com. Accessed July 21, 2016 at <www.history.com>
The act authorized the president to suspend the writ of habeas corpus and arrest accused individuals without charge, and to send federal forces to suppress Klan violence. This expansion of federal authority–which Ulysses S. Grant promptly used in 1871 to crush Klan activity in South Carolina and other areas of the South–outraged Democrats and even alarmed many Republicans.
[175] Article: “Ku Klux Klan.” Encyclopædia Britannica Ultimate Reference Suite 2004.
But Forrest ordered it disbanded in 1869, largely as a result of the group’s excessive violence. Local branches remained active for a time, however, prompting Congress to pass the Force Act in 1870 and the Ku Klux Act in 1871.
These bills authorized the president to suspend the writ of habeas corpus, suppress disturbances by force, and impose heavy penalties upon terrorist organizations. President Grant was lax in utilizing this authority, although he did send federal troops to some areas, suspend habeas corpus in nine South Carolina counties, and appoint commissioners who arrested hundreds of Southerners for conspiracy. In United States v. Harris in 1882, the Supreme Court declared the Ku Klux Act unconstitutional, but by that time the Klan had practically disappeared.
[176] Article: “The Rise and Fall of Jim Crow: The Enforcement Acts (1870–71).” By Richard Wormser. PBS. Accessed July 21, 2016 at <www.pbs.org>
“By 1872, the Klan as an organization was broken. By the time the terror ended, thousands of blacks and hundreds of whites had been massacred or driven from their homes and communities.”
[177] Article: “The Rise and Fall of Jim Crow: Ku Klux Klan.” By Richard Wormser. PBS. Accessed June 25, 2021 at <www.thirteen.org>
“[T]he Klan quickly became a terrorist organization in service of the Democratic Party and white supremacy.”
[178] Webpage: “Ku Klux Klan.” History.com. Accessed July 21, 2016 at <www.history.com>
Though Congress passed legislation designed to curb Klan terrorism, the organization saw its primary goal—the reestablishment of white supremacy—fulfilled through Democratic victories in state legislatures across the South in the 1870s. …
From the early 1870s onward, white supremacy gradually reasserted its hold on the South as support for Reconstruction waned; by the end of 1876, the entire South was under Democratic control once again.
[179] Article: “Ku Klux Klan.” Encyclopædia Britannica Ultimate Reference Suite 2004.
The group was presided over by a grand wizard (Confederate cavalry general Nathan Bedford Forrest is believed to have been the first grand wizard) and a descending hierarchy of grand dragons, grand titans, and grand cyclopses.
The 19th-century Klan reached its peak between 1868 and 1870. A potent force, it was largely responsible for the restoration of white rule in North Carolina, Tennessee, and Georgia. But Forrest ordered it disbanded in 1869, largely as a result of the group’s excessive violence. Local branches remained active for a time, however….
… in 1882, the Supreme Court declared the Ku Klux Act unconstitutional, but by that time the Klan had practically disappeared. It disappeared because its original objective—the restoration of white supremacy throughout the South—had been largely achieved during the 1870s.
[180] Webpage: “Black Leaders During Reconstruction.” History.com. Accessed July 21, 2016 at <www.history.com>
During the decade known as Radical Reconstruction (1867–77) …
Beginning in 1867, branches of the Union League, which encouraged the political activism of African Americans, spread throughout the South. …
In all, 16 African Americans served in the U.S. Congress during Reconstruction; more than 600 more were elected to the state legislatures, and hundreds more held local offices across the South.
[181] Ruling: United States v. Cruikshank. U.S. Supreme Court, October 1, 1875. Decided 5–4. Majority: Waite, Swayne, Miller, Field, Strong. Dissenting: Clifford, Davis, Bradley, Hunt. <caselaw.findlaw.com>
Majority:
This case comes here with a certificate by the judges of the Circuit Court for the District of Louisiana that they were divided in opinion upon a question which occurred at the hearing. It presents for our consideration an indictment containing sixteen counts, divided into two series of eight counts each, based upon sect. 6 of the Enforcement Act of May 31, 1870 [a.k.a. the Civil Rights Act of 1870]. That section is as follows:–
“That if two or more persons shall band or conspire together, or go in disguise upon the public highway, or upon the premises of another, with intent to violate any provision of this act, or to injure, oppress, threaten, or intimidate any citizen, with intent to prevent or hinder his free exercise and enjoyment of any right or privilege granted or secured to him by the constitution or laws of the United States, or because of his having exercised the same, such persons shall be held guilty of felony, and, on conviction thereof, shall be fined or imprisoned, or both, at the discretion of the court,-the fine not to exceed $5,000, and the imprisonment not to exceed ten years; and shall, moreover, be thereafter ineligible to, and disabled from holding, any office or place of honor, profit, or trust created by the constitution or laws of the United States.” 16 Stat. 141.
The general charge in the first eight counts is that of “banding,” and in the second eight, that of “conspiring” together to injure, oppress, threaten, and intimidate Levi Nelson and Alexander Tillman, citizens of the United States, of African descent and persons of color, with the intent thereby to hinder and prevent them in their free exercise and enjoyment of rights and privileges “granted and secured” to them “in common with all other good citizens of the United States by the constitution and laws of the United States.” …
The first and ninth counts state the intent of the defendants to have been to hinder and prevent the citizens named in the free exercise and enjoyment of their “lawful right and privilege to peaceably assemble together with each other and with other citizens of the United States for a peaceful and lawful purpose.” The right of the people peaceably to assemble for lawful purposes existed long before the adoption of the Constitution of the United States. In fact, it is, and always has been, one of the attributes of citizenship under a free government. It “derives its source,” to use the language of Chief Justice Marshall, in Gibbons v. Ogden, 9 Wheat. 211, “from those laws whose authority is acknowledged by civilized man throughout the world.” It is found wherever civilization exists. It was not, therefore, a right granted to the people by the Constitution. The government of the United States when established found it in existence, with the obligation on the part of the States to afford it protection. As no direct power over it was granted to Congress, it remains, according to the ruling in Gibbons v. Ogden, id. 203, subject to State jurisdiction. [92 U.S. 542, 552] Only such existing rights were committed by the people to the protection of Congress as came within the general scope of the authority granted to the national government.
The first amendment to the Constitution prohibits Congress from abridging “the right of the people to assemble and to petition the government for a redress of grievances.” This, like the other amendments proposed and adopted at the same time, was not intended to limit the powers of the State governments in respect to their own citizens, but to operate upon the National government alone. …
The particular amendment now under consideration assumes the existence of the right of the people to assemble for lawful purposes, and protects it against encroachment by Congress. The right was not created by the amendment; neither was its continuance guaranteed, except as against congressional interference. For their protection in its enjoyment, therefore, the people must look to the States. The power for that purpose was originally placed there, and it has never been surrendered to the United States.
The right of the people peaceably to assemble for the purpose of petitioning Congress for a redress of grievances, or for any thing else connected with the powers or the duties of the national government, is an attribute of national citizenship, and, as such, under the protection of, and guaranteed by, the United States. The very idea of a government, republican in form, implies a right on the part of its citizens to meet peaceably for consultation in respect to public affairs and to petition for a redress of grievances. If it had been alleged in [92 U.S. 542, 553] these counts that the object of the defendants was to prevent a meeting for such a purpose, the case would have been within the statute, and within the scope of the sovereignty of the United States. Such, however, is not the case. The offence, as stated in the indictment, will be made out, if it be shown that the object of the conspiracy was to prevent a meeting for any lawful purpose whatever.
The second and tenth counts are equally defective. The right there specified is that of “bearing arms for a lawful purpose.” This is not a right granted by the Constitution. Neither is it in any manner dependent upon that instrument for its existence. The second amendment declares that it shall not be infringed; but this, as has been seen, means no more than that it shall not be infringed by Congress. This is one of the amendments that has no other effect than to restrict the powers of the national government, leaving the people to look for their protection against any violation by their fellow-citizens of the rights it recognizes, to what is called, in The City of New York v. Miln, 11 Pet. 139, the “powers which relate to merely municipal legislation, or what was, perhaps, more properly called internal police,” “not surrendered or restrained” by the Constitution of the United States. …
The third and eleventh counts are even more objectionable. They charge the intent to have been to deprive the citizens named, they being in Louisiana, “of their respective several lives and liberty of person without due process of law.” This is nothing else than alleging a conspiracy to falsely imprison or murder citizens of the United States, being within the territorial jurisdiction of the State of Louisiana. The rights of life and personal liberty are natural rights of man. “To secure these rights,” says the Declaration of Independence, “governments are instituted among men, deriving their just powers from the consent of the governed.” The very highest duty of the States, when they entered into the Union under the Constitution, was to protect all persons within their boundaries in the enjoyment of these “unalienable rights with which they were endowed by their Creator.” Sovereignty, for this purpose, rests alone with the States. It is no more the duty or within the power of the United States to punish for a conspiracy [92 U.S. 542, 554] to falsely imprison or murder within a State, than it would be to punish for false imprisonment or murder itself.
The fourteenth amendment prohibits a State from depriving any person of life, liberty, or property, without due process of law; but this adds nothing to the rights of one citizen as against another. It simply furnishes an additional guaranty against any encroachment by the States upon the fundamental rights which belong to every citizen as a member of society. As was said by Mr. Justice Johnson, in Bank of Columbia v. Okely, 4 Wheat. 244, it secures “the individual from the arbitrary exercise of the powers of government, unrestrained by the established principles of private rights and distributive justice.” These counts in the indictment do not call for the exercise of any of the powers conferred by this provision in the amendment. …
The fourteenth amendment prohibits a State from denying to any person within its jurisdiction the equal protection of the laws; but this provision does not, any more than the one which precedes it, and which we have just considered, add any thing [92 U.S. 542, 555] to the rights which one citizen has under the Constitution against another. The equality of the rights of citizens is a principle of republicanism. Every republican government is in duty bound to protect all its citizens in the enjoyment of this principle, if within its power. That duty was originally assumed by the States; and it still remains there. The only obligation resting upon the United States is to see that the States do not deny the right. This the amendment guarantees, but no more. The power of the national government is limited to the enforcement of this guaranty.
Dissent:
Power is vested in Congress to enforce by appropriate legislation the prohibition contained in the fourteenth amendment of the Constitution; and the fifth section of the Enforcement Act [a.k.a. the Civil Rights Act of 1870] provides to the effect, that persons who prevent, hinder, control, or intimidate, or who attempt to prevent, hinder, control, or intimidate, any person to whom the right of suffrage is secured or guaranteed by that amendment, from exercising, or in exercising such right, by means of bribery or threats; of depriving such person of employment or occupation; or of ejecting such person from rented house, lands, or other property; or by threats of refusing to renew leases or contracts for labor; or by threats of violence to himself or family,—such person so offending shall be deemed guilty of a misdemeanor, and, on conviction thereof, shall be fined or imprisoned, or both, as therein provided. …
… Enough has already been remarked to show that that particular clause of the section was passed to protect citizens in the free exercise and enjoyment of every right or privilege granted … or secured to them by the constitution and laws of Congress, and to provide for the punishment of those who band or conspire together, in the manner described, to injure, oppress, or intimidate any citizen, to prevent or hinder him from the free exercise and enjoyment of all such rights or privileges, or because of his having exercised any such right or privilege so granted or secured.
[182] Book: The Constitution of The United States of America: Analysis And Interpretation (Centennial edition). Edited by Kenneth R. Thomas and Larry M. Eig. Library of Congress, Congressional Research Service, 2013. <www.gpo.gov>
Page 2196:
Cruikshank did, however, recognize a small category of federal rights that Congress could protect against private deprivation, rights that the Court viewed as deriving particularly from one’s status as a citizen of the United States and that Congress had a general police power to protect.2093 These rights included the right to vote in federal elections, general and primary,2094 the right to federal protection while in the custody of federal officers,2095 and the right to inform federal officials of violations of federal law.2096 The right of interstate travel is a basic right derived from the Federal Constitution, which Congress may protect.2097
[183] Webpage: “Jacob Merritt Howard.” Historic Elmwood Cemetery & Foundation. Accessed April 24, 2017 at <www.elmwoodhistoriccemetery.org>
His once familiar name should continue to be honored as one of Michigan’s and the country’s most able and highly influential political figures. … He was Michigan Attorney General from 1855 to 1861. As one of the founders of the Republican Party, he made political and legislative history in Michigan and the nation’s capitol.
… His most significant body of work was done during the period from 1862 to 1871 while he was the U. S. Senator from Michigan. …
Following the Civil War, his actions led to the creation of the 13th, 14th and 15th Amendments to the U.S. Constitution.
[184] “Speech Introducing the Fourteenth Amendment.” By Senator Jacob Howard, May 23, 1866. Congressional Globe, 39th Congress, Senate 1st Session. Pages 2764–2768. <memory.loc.gov>
Mr. Howard. Mr. President, I regret that the state of the health of the honorable Senator from Maine [Mr. Fessenden] who is chairman, on the part of the Senate, of the joint committee of fifteen, is such as to disable him from opening the discussion of this grave and important measure. I was anxious that he should take the lead, and the prominent lead, in the conduct of this discussion, and still entertain the hope that before it closes the Senate will have the benefit of a full and ample statement of his views.
For myself, I can only promise to present to the Senate, in a very succinct way, the views and the motives which influenced that committee, so far as I understand those views and motives, in presenting the report which is now before us for consideration, and the ends it aims to accomplish.
The joint resolution creating that committee entrusted them with a very important inquiry, an inquiry involving a vast deal of attention and labor. They were instructed to inquire into the condition of the insurgent States, and authorized to report by bill or otherwise at their discretion. I believe that I do not overstate the truth when I say that no committee of Congress has ever proceeded with more fidelity and attention to the matter entrusted to them. They have been assiduous in discharging their duty. They have instituted an inquiry, so far as it was practicable for them to do so, into the political and social condition of the insurgent States. …
One result of their investigations has been the joint resolution for the amendment of the Constitution of the United States now under consideration. After most mature deliberation and discussion, reaching through weeks and even months, they came to the conclusion that it was necessary, in order to restore peace and quiet to the country and again to impart vigor and efficiency to the laws, and especially to obtain something in the shape of a security for the future against the recurrence of the enormous evils under which the country has labored for the last four years, that the Constitution of the United States ought to be amended; and the project which they have now submitted is the result of their deliberations upon that subject.
The first section of the amendment they have submitted for the consideration of the two Houses relates to the privileges and immunities of citizens of the several States, and to the rights and privileges of all persons, whether citizens or others, under the laws of the United States. It declares that—
No State shall make or enforce any law which shall abridge the privileges or immunities of citizens of the United States; nor shall any State deprive any person of life, liberty, or property without due process of law; nor deny to any person within its jurisdiction the equal protection of the laws.
It will be observed that this is a general prohibition upon all the States, as such, from abridging the privileges and immunities of the citizens of the United States. That is its first clause, and I regard it as very important. It also prohibits each one of the States from depriving any person of life, liberty, or property without due process of law, or denying to any person within the jurisdiction of the State the equal protection of its laws. …
The next clause is a very simple one. I have already remarked upon it; and shall spend no more time upon it. It gives to Congress power to enforce by appropriate legislation all the provisions of this article of amendment. Without this clause, no power is granted to Congress by the amendment or any one of its sections. It casts upon Congress the responsibility of seeing to it, for the future, that all the sections of the amendment are carried out in good faith, and that no State infringes the rights of persons or property. I look upon this clause as indispensable for the reason that it thus imposes upon Congress this power and this duty. It enables Congress, in case the States shall enact laws in conflict with the principles of the amendment, to correct that legislation by a formal congressional enactment. …
The first clause of this section relates to the privileges and immunities of citizens of the United States as such, and as distinguished from all other persons not citizens of the United States. …
To these privileges and immunities, whatever they may be—for they are not and cannot be fully defined in their entire extent and precise nature —to these should be added the personal rights guaranteed and secured by the first eight amendments of the Constitution; such as the freedom of speech and of the press; the right of the people peaceably to assemble and petition the Government for a redress of grievances, a right appertaining to each and all the people; the right to keep and to bear arms; the right to be exempted from the quartering of soldiers in a house without the consent of the owner; the right to be exempt from unreasonable searches and seizures, and from any search or seizure except by virtue of a warrant issued upon a formal oath or affidavit; the right of an accused person to be informed of the nature of the accusation against him, and his right to be tried by an impartial jury of the vicinage; and also the right to be secure against excessive bail and against cruel and unusual punishments.
Now, sir, here is a mass of privileges, immunities, and rights, some of them secured by the second section of the fourth article of the Constitution, which I have recited, some by the first eight amendments of the Constitution; and it is a fact well worthy of attention that the course of decision of our courts and the present settled doctrine is, that all these immunities, privileges, rights, thus guaranteed by the Constitution or recognized by it, are secured to the citizen solely as a citizen of the United States and as a party in their courts. They do not operate in the slightest degree as a restraint or prohibition upon State legislation. States are not affected by them, and it has been repeatedly held that the restriction contained in the Constitution against the taking of private property for public use without just compensation is not a restriction upon State legislation, but applies only to the legislation of Congress.
Now, sir, there is no power given in the Constitution to enforce and to carry out any of these guarantees. They are not powers granted by the Constitution to Congress, and of course do not come within the sweeping clause of the Constitution authorizing Congress to pass all laws necessary and proper for carrying out the foregoing or granted powers, but they stand simply as a bill of rights in the Constitution, without power on the part of Congress to give them full effect; while at the same time the States are not restrained from violating the principles embraced in them except by their own local constitutions, which may be altered from year to year. The great object of the first section of this amendment is, therefore, to restrain the power of the States and compel them at all times to respect these great fundamental guarantees. How will it be done under the present amendment? As I have remarked, they are not powers granted to Congress, and therefore it is necessary, if they are to be effectuated and enforced, as they assuredly ought to be, that additional power should be given to Congress to that end. This is done by the fifth section of this amendment, which declares that “the Congress shall have power to enforce by appropriate legislation the provisions of this article.” Here is a direct affirmative delegation of power to Congress to carry out all the principles of all these guarantees, a power not found in the Constitution.
The last two clauses of the first section of the amendment disable a State from depriving not merely a citizen of the United States, but any person, whoever he may be, of life, liberty, or property without due process of law, or from denying to him the equal protection of the laws of the State. This abolishes all class legislation in the States and does away with the injustice of subjecting one caste of persons to a code not applicable to another. It prohibits the hanging of a black man for a crime for which the white man is not to be hanged. It protects the black man in his fundamental rights as a citizen with the same shield which it throws over the white man. Is it not time, Mr. President, that we extend to the black man, I had almost called it the poor privilege of the equal protection of the law? Ought not the time to be now passed when one measure of justice is to be meted out to a member of one caste while another and a different measure is meted out to the member of another caste, both castes being alike citizens of the United States, both bound to obey the same laws, to sustain the burdens of the same Government, and both equally responsible to justice and to God for the deeds done in the body? But, sir, the first section of the proposed amendment does not give to either of these classes the right of voting. The right of suffrage is not, in law, one of the privileges or immunities thus secured by the Constitution. It is merely the creature of law. It has always been regarded in this country as the result of positive local law, not regarded as one of those fundamental rights lying at the basis of all society and without which a people cannot exist except as slaves, subject to a despotism.
As I have already remarked, section one is a restriction upon the States, and does not, of itself, confer any power upon Congress. The power which Congress has, under this amendment, is derived, not from that section, but from the fifth section, which gives it authority to pass laws which are appropriate to the attainment of the great object of the amendment. I look upon the first section, taken in connection with the fifth, as very important. It will, if adopted by the States, forever disable every one of them from passing laws trenching upon those fundamental rights and privileges which pertain to citizens of the United States, and to all persons who may happen to be within their jurisdiction. It establishes equality before the law, and it gives to the humblest, the poorest, the most despised of the race the same rights and the same protection before the law as it gives to the most powerful, the most wealthy, or the most haughty. That, sir, is republican government, as I understand it, and the only one which can claim the praise of a just Government. Without this principle of equal justice to all men and equal protection under the shield of the law, there is no republican government and none that is really worth maintaining.
[185] “Speech Introducing the Fourteenth Amendment.” By Senator Jacob Howard, May 23, 1866. Congressional Globe, 39th Congress, Senate 1st Session. Pages 2764–2768. <memory.loc.gov>
The Senate, as in Committee of the Whole, proceeded to consider the joint resolution (H. R. No. 127) proposing an amendment to the Constitution of the United States, which was read as follows:
Resolved by the Senate and House of Representatives of the United States of America in Congress assembled, (two thirds of both Houses concurring,) That the following article be proposed to the Legislatures of the several States as an amendment to the Constitution of the United States, which, when ratified by three fourths of said Legislatures, shall be valid as part of the Constitution, namely:
ARTICLE —.
Section 1. No State shall make or enforce any law which shall abridge the privileges or immunities of citizens of the United States; nor shall any State deprive any person of life, liberty, or property, without due process of law; nor deny to any person within its jurisdiction the equal protection of the laws. …
Section 5. The Congress shall have power to enforce by appropriate legislation the provisions of this article.
[186] 14th Amendment to the U.S. Constitution. Ratified July 9, 1868. <www.justfacts.com>
Section 1. … No State shall make or enforce any law which shall abridge the privileges or immunities of citizens of the United States; nor shall any State deprive any person of life, liberty, or property, without due process of law; nor deny to any person within its jurisdiction the equal protection of the laws. …
Section 5. The Congress shall have power to enforce, by appropriate legislation, the provisions of this article.
[187] Book: The American Constitution: Its Origins and Development (3rd edition). By Alfred H. Kelly and Winfred A. Harbison. W. W. Norton & Company, 1963.
Page 461:
These provisions [Sections 1 and 2 of the 14th Amendment], largely the work of Representative John A Bingham of Ohio, were intended to remove all doubt as to the constitutionality of the Civil Rights Act, as Stevens presently made clear in debate. The “privileges or immunities” clause, Bingham explained several times, was borrowed directly from the similar guarantee of interstate comedy in Article IV, Section 2 of the Constitution. Bingham and Senator Jacob Howard of Michigan, who presented the amendment to the upper house, agreed that the clause incorporated the entire federal Bill of Rights as a limitation upon the states.1 The “due process” clause was lifted from the Fifth Amendment; it now also became a guarantee against state action. The “equal protection” clause was specifically intended to reinforce the civil rights act; in everyday language, it warned the states not to discriminate against Negroes.
1 The Supreme Court destroyed this contention in the Slaughterhouse Cases. See pp. 503–504.
[188] Ruling: McDonald v Chicago. U.S. Supreme Court, June 28, 2010. Decided 5–4. Majority: Alito, Roberts, Scalia, Kennedy, Thomas. Dissenting: Stevens, Ginsburg, Breyer, Sotomayor. <www.law.cornell.edu>
Concurrence (Thomas):
Cruikshank’s holding that blacks could look only to state governments for protection of their right to keep and bear arms enabled private forces, often with the assistance of local governments, to subjugate the newly freed slaves and their descendants through a wave of private violence designed to drive blacks from the voting booth and force them into peonage, an effective return to slavery. Without federal enforcement of the inalienable right to keep and bear arms, these militias and mobs were tragically successful in waging a campaign of terror against the very people the Fourteenth Amendment had just made citizens.
Take, for example, the Hamburg Massacre of 1876. There, a white citizen militia sought out and murdered a troop of black militiamen for no other reason than that they had dared to conduct a celebratory Fourth of July parade through their mostly black town. The white militia commander, “Pitchfork” Ben Tillman, later described this massacre with pride: “[T]he leading white men of Edgefield” had decided “to seize the first opportunity that the negroes might offer them to provoke a riot and teach the negroes a lesson by having the whites demonstrate their superiority by killing as many of them as was justifiable.” S. Kantrowitz, Ben Tillman & the Reconstruction of White Supremacy 67 (2000) (ellipsis, brackets, and internal quotation marks omitted). None of the perpetrators of the Hamburg murders was ever brought to justice.
[189] “An Address to the People of the United States Adopted at a Conference of Colored Citizens Held at Columbia, SC.” Republican Printing Company, 1876. <omeka.coloredconventions.org>
Page 5:
We would next call attention to the fact that on Tuesday, the 4th day of July 1st, the militia company at Hamburg assembled for muster and drill, and, while so engaged, paraded through one of the least frequented streets of said town. That said street by actual measurement, of the width of one hundred and forty-eight feet, and that, while so parading, they were interrupted by a horse and buggy being driven into their ranks by one Thomas Butler and one Henry Getzen, white citizens, who resided about two miles from mid’ town. …
That on Wednesday, the 5th instant, Robert J. Butler … appeared before P. M. Rivers, one of the Trial Justices of the State, and made complaint that the militia company had on the previous day obstructed on of the public streets of the town of Hamburg, and had hindered and prevented his son Thomas Butler, and his son-in-law, Henry Getzen, from journeying thereon.
Page 7:
Another committee passed between General Butler and the officers, who announced to the officers General Butler’s ultimatum, that the officers should apologize for what took place on the 4th of July, and surrender their arms to him (General Butler.) Upon this, the officers asked General Rivers, who was not only the Trial Justice before whom their case was pending, but who was also the Major General commanding the division of the militia to which they belonged, if he (Rivers) demanded the arms of them; to which Rivers replied that he did not. Thereupon the officers declared their unwillingness to surrender their arms to general Butler, because they were responsible, and he (Butler) had no legal right to demand or receive them if surrendered. Subsequently a citizen, anxious to prevent what he feared would be a collision, called on General Butler, and asked him what he purposed doing. His reply was that he intended to have the arms in a half hour or lay the damned town in ashes.
[190] Speech: “The Struggles of ’76.” By Senator B. R. Tillman, August 25, 1901. Delivered at the Red Shirt Reunion at Anderson, SC. <babel.hathitrust.org>
Page 17:
It had been the settled purpose of the leading white men of Edgefield to seize the first opportunity that the negroes might offer them to provoke a riot and teach the negroes a lesson; as it was generally believed that nothing but bloodshed and a good deal of it could answer the purpose of redeeming the state from negro and carpet bag rule. … Col. A. P. Butler, the captain of the Sweetwater Sabre Club, summoned our company to meet at Summer Hill, three miles from Hamburg at twelve o’clock. It was our purpose to attend the trial to see that the young men had protection and, if any opportunity offered, to provoke a row, and if one did not offer, we were to make one.
Pages 24–25:
If young Meriwether had not lost his life I do not think any of these last negroes would have been killed, but the purpose of our visit to Hamburg was to strike terror, and the next morning (Sunday) when the negroes who had fled to the swamp returned to the town (some of them never did return, but kept on going) the ghastly sight which met their gaze of seven dead negroes lying stark and stiff, certainly had its effect. …
It was now after midnight, and the moon high in the heavens looked down peacefully on the deserted town and dead negroes, whose lives had been offered up as a sacrifice to the fanatical teachings and fiendish hate of those who sought to substitute the rule of the African for that of the Caucasian in South Carolina.”
NOTES:
[191] Webpage: “Compromise of 1877.” History.com, March 17, 2011. Updated 11/27/19. <www.history.com>
Immediately after the presidential election of 1876, it became clear that the outcome of the race hinged largely on disputed returns from Florida, Louisiana and South Carolina…. As a bipartisan congressional commission debated over the outcome early in 1877, allies of the Republican Party candidate Rutherford Hayes met in secret with moderate southern Democrats in order to negotiate acceptance of Hayes’ election. The Democrats agreed not to block Hayes’ victory on the condition that Republicans withdraw all federal troops from the South, thus consolidating Democratic control over the region.
[192] Book: The Constitution of The United States of America: Analysis And Interpretation (Centennial edition). Edited by Kenneth R. Thomas and Larry M. Eig. Library of Congress, Congressional Research Service, 2013. <www.gpo.gov>
Pages 2213–4:
Beginning in 1895, several states enacted temporary laws whereby persons who had been voters, or descendants of those who had been voters, on January 1, 1867, could be registered notwithstanding their inability to meet any literacy requirement. Unable because of the date to avail themselves of the exemption, African-Americans were disabled to vote on grounds of illiteracy or through discriminatory administration of literacy tests, while illiterate whites were permitted to register without taking any tests. With the achievement of the intended result, most states permitted their laws to lapse, but Oklahoma’s grandfather clause had been enacted as a permanent amendment to the state constitution. A unanimous Court condemned the device as recreating and perpetuating “the very conditions which the [Fifteenth] Amendment was intended to destroy.”10
The Court did not experience any difficulty in voiding a subsequent Oklahoma statute of 1916 that provided that all persons, except those who voted in 1914, who were qualified to vote in 1916 but who failed to register between April 30 and May 11, 1916, with some exceptions for sick and absent persons who were given an additional brief period to register, should be perpetually disenfranchised. The Fifteenth Amendment, Justice Frankfurter declared for the Court, nullified “sophisticated as well as simple-minded modes of discrimination. It hits onerous procedural requirements which effectively handicap exercise of the franchise by the colored race although the abstract right to vote may remain unrestricted as to race.”11 The impermissible effect of the statute, the Court said, was automatically to continue as permanent voters, without their being obliged to register again, all white persons who were on registration lists in 1914 by virtue of the previously invalidated grandfather clause, whereas African-Americans, prevented from registering by that clause, had been afforded only a 20-day registration opportunity to avoid permanent disenfranchisement.
Pages 2214–5:
Literacy Tests.—At an early date the Court held that literacy tests that are drafted so as to apply alike to all applicants for the voting franchise would be deemed to be fair on their face and in the absence of proof of discriminatory enforcement could not be said to deny equal protection.19 But an Alabama constitutional amendment, the legislative history of which disclosed that both its object and its intended administration were to disenfranchise African-Americans, was held to violate the Fifteenth Amendment.20
[193] Article: “Antiliteracy Laws.” By Peter Wallenstein. The Historical Encyclopedia of World Slavery (Volume 1). Edited by Junius P. Rodriguez. ABC-CLIO, 1997.
Page 42:
Slaveowners in the U.S. South thought they had ample reason to curtail the spread of literacy among slaves. Literate slaves might forge passes, read newspapers, or communicate conspiratorial plans. Thus, in 1740, after the Stono rebellion of 1739, South Carolina enacted a ban on educating slaves, and other colonies and states followed suit. Later, several states enacted anti-literacy laws between 1829 and 1834 after abolitionist publications began mounting. In South Carolina, and the nullifiers—radical proslavery men—led the way in imposing new restrictions
Anti-literacy laws, however, never became universal across the slave South. Some states, like Tennessee and Kentucky, never enacted anti-literacy laws. Of the four states that did maintain such laws from the 1830s through the Civil War, three–North Carolina, South Carolina, and Georgia—banned anyone from teaching any African-American, whether slave or free to read or write; Virginia banned schools for blacks but not private tutoring. …
The South’s anti-literacy laws died when slavery did. In summer 1865—after the surrender at Appomattox but before the ratification of the 13th amendment—Freedmen’s Bureau and American Missionary Association Schools sprouted across the southern landscape. No legislature had yet repealed the anti-literacy law, but every such law had become a dead letter. …
In the 1870s, every Southern state created a system of public schools that, on a segregated basis, might give all children access to literacy. Moreover, new institutions of higher education for African-Americans … emerged soon after emancipation. Not only were such institutions now legal, but some received public funds, either state or federal, and each trained black teachers for the new black elementary schools. Especially among young people, black illiteracy began to decline.
[194] Encyclopedia of Minorities in American Politics: Hispanic Americans and Native Americans (Volume 2). Edited by Jeffrey D. Schultz and others. Oryx Press, 2000.
Page 528:
The brief enfranchisement of African Americans ended, however, after 1877, when southern Democrats regained control of state governments after federal troops were withdrawn after Reconstruction. …
… For example, Georgia retained as law a poll tax from the time when the payment of taxes was a common requirement for voting. In 1877, Georgia moved to make this poll tax permanent and added a literacy test during its constitutional convention in 1890. Florida and Tennessee followed suit quickly thereafter, followed by Arkansas in 1894.
After 1896, the remaining southern states acted similarly by introducing poll tax laws where none had existed, making the amount of the poll tax higher, even charging would-be voters retroactively. … Actually, poll taxes had reduced voting participation among both whites and nonwhites in five southern states, but it brought greater hardship on minorities, a higher proportion of whom were poor. Furthermore, the poll tax was unequally enforced among whites and nonwhites. The result was that poll tax states had voter turnout in national elections equal to only about 50 percent of those in states without poll taxes.
Southern states added literacy tests to poll tax barriers. The political purpose behind the literacy test was to disenfranchise Native Americans, blacks, Mexican Americans, and Asians. To overcome the opposition of poor and illiterate whites, who would also be disenfranchised by these measures, grandfather clauses and “fighting grandfather” (pertaining to those whose grandfathers had served in the Confederate army) clauses were introduced to exempt illiterate whites threatened with disenfranchisement. The grandfather clause assured the franchise for those who could prove their grandfathers had voted prior to 1867. Meanwhile, southern states granted local election officers latitude to enforce these new procedures unevenly and selectively. Literacy tests, for example, could be administered differently at different sites and for various groups of people.
[195] Encyclopedia of Minorities in American Politics: Hispanic Americans and Native Americans (Volume 2). Edited by Jeffrey D. Schultz and others. Oryx Press, 2000.
Page 528:
The brief enfranchisement of African Americans ended, however, after 1877, when southern Democrats regained control of state governments after federal troops were withdrawn after Reconstruction. The removal of black and minority voting rights was then systematically legitimized in southern constitutions and laws through a series of changes to the electoral system that obstructed many from voting. By the 1920s, voting in the South among blacks, other minorities, and poor whites had been virtually eliminated.
The southern states attached conditions to the right to vote that did not violate the Fifteenth Amendment as such, but which minorities could nevertheless not meet. These disenfranchising devices were created gradually.
[196] The Concise Princeton Encyclopedia of American Political History. Edited by Michael Kazin and others. Princeton University Press, 2011.
Page 582:
“Discrimination” noted future Virginia senator Carter Glass at a constitutional convention in his state in 1901. “That, exactly, is what this Convention was elected for—to discriminate to the very extremity of permissible action under the limitations of the Federal Constitution, with a view to the elimination of every negro voter who can be gotten rid of.” These strategies were effective: in Louisiana, where more than 130,000 blacks had been registered to vote in 1896, only 1,300, were registered by 1904.
[197] Report: “African American Members of the United States Congress: 1870–2012.” By Jennifer E. Manning and Colleen J. Shogan. Congressional Research Service, November 26, 2012. <www.google.com>
Pages 54–55:
93rd Congress (1973–1975)
House: Yvonne B. Burke [CA], Shirley A. Chisholm [NY], William L. Clay Sr. [MI], Cardiss Collins [IL], John Conyers Jr. [MI], Ronald V. Dellums [CA], Charles C. Diggs Jr. [MI], Walter E. Fauntroy [DC], Augustus F. Hawkins [CA], Barbara C. Jordan [TX], Ralph H. Metcalfe [IL], Parren J. Mitchell [MD], Robert N.C. Nix Sr. [PA], Charles B. Rangel [NY], Louis Stokes [OH], Andrew J. Young [GA]
Senate: Edward W. Brooke [MA]
92nd Congress (1971–1973)
House: Shirley A. Chisholm [NY], William L. Clay Sr. [MI], George W. Collins [IL], John Conyers Jr. [MI], Ronald V. Dellums [CA], Charles C. Diggs Jr. [MI], Walter E. Fauntroy [DC], Augustus F. Hawkins [CA], Ralph H. Metcalfe [IL], Parren J. Mitchell [MD], Robert N.C. Nix Sr. [PA], Charles B. Rangel [NY], Louis Stokes [OH]
Senate: Edward W. Brooke [MA]
91st Congress (1969–1971)
House: Shirley A. Chisholm [NY], William L. Clay Sr. [MI], George W. Collins [IL], Augustus F. Hawkins [CA], John Conyers Jr. [MI], William L. Dawson [IL], Charles C. Diggs Jr. [MI], Robert N.C. Nix [PA], Adam C. Powell Jr. [NY], Louis Stokes [OH]
Senate: Edward W. Brooke [MA]
90th Congress (1967–1969)
House: John Conyers Jr. [MI], William L. Dawson [IL], Charles C. Diggs Jr. [MI], Augustus F. Hawkins [CA], Robert N.C. Nix Sr. [PA]
Senate: Edward W. Brooke [MA]
89th Congress (1965–1967)
House: John Conyers Jr. [MI], William L. Dawson [IL], Charles Diggs Jr. [MI], Augustus F. Hawkins [CA], Robert N.C. Nix Sr. [PA], Adam Clayton Powell Jr. [NY]
Senate: None
88th Congress (1963–1965)
House:: William L. Dawson [IL], Augustus F. Hawkins [CA], Adam C. Powell Jr. [NY], Charles C. Diggs Jr. [MI], Robert N.C. Nix Sr. [PA]
Senate: None
85th–87th Congresses (1957–1963)
House: William L. Dawson [IL], Charles C. Diggs Jr. [MI], Robert N.C. Nix Sr. [PA], Adam C. Powell Jr. [NY]
Senate: None
84th Congress (1955–1957)
House: William L. Dawson [IL], Charles C. Diggs Jr. [MI], Adam C. Powell Jr. [NY],
79th–83rd Congresses (1945–1955)
House: William L. Dawson [IL], Adam C. Powell Jr. [NY]
Senate: None
78th Congress (1943–1945)
House: William L. Dawson [IL]
Senate: None
74th–77th Congresses (1935–1943)
House: Arthur W. Mitchell [IL]
Senate: None
71st–73rd Congresses (1929–1935)
1 House: Oscar S. DePriest [IL]
Senate: None
57th–70th Congresses (1901–1929)
House: None
Senate None
55th–56th Congresses (1897–1901)
1 House: George H. White
Senate None
[198] Article: “Woodrow Wilson’s Legacy Gets Complicated.” By Jennifer Schuessler. New York Times, November 29, 2015. <www.nytimes.com>
“The irony here is that Wilson really is the architect of a lot of modern liberalism,” said Julian E. Zelizer, a professor of history and public affairs at Princeton. “The tradition that runs through F.D.R. to L.B.J. and Obama really starts with his administration.” …
“Going to the mat for Wilson should not be hard,” said David Greenberg, a historian at Rutgers University. “If your standards are liberal progressive values in general, Wilson deserves to be celebrated.”
[199] Webpage: “Past Inaugural Ceremonies.” Joint Congressional Committee on Inaugural Ceremonies. Accessed June 25, 2021 at <www.inaugural.senate.gov>
“President Woodrow Wilson … March 4, 1913”
[200] Article: “President Resents Negro’s Criticism; Refuses to be Cross-Questioned About Racial Segregation in Government Offices. Stands by His Policy.” New York Times, November 13, 1914. <www.nytimes.com>
Segregation of white and negro civil service employees in Government departments, a system inaugurated during the present Administration, is to be continued. President Wilson made clear his views on the subject today when he received a delegation representing the National Independence Equal Rights League. The President resented the attitude of the spokesman, William Monroe Trotter, of Boston, who was quoted as having attempted to cross-examine Mr. Wilson, when the President explained that the question was not a political one, and that he would not be influenced in his decision by the threats of the league to oppose the Democratic Party. …
Once outside Trotter said:
What the President told us was entirely disappointing. His statement that segregation was intended to prevent racial friction is not supported by facts. For fifty years negro and white employees have worked together in the Government departments in Washington. It was not until the present Administration came in that segregation was drastically introduced, and only because of the racial prejudices of John Skelton Williams, Secretary McAdoo and Postmaster General Burleson.
[201] Article: “The Long-Forgotten Racial Attitudes and Policies of Woodrow Wilson.” By William R. Keylor. Boston University Professor Voices, March 4, 2013. <www.bu.edu>
When [Wilson] he entered the White House a hundred years ago today, Washington was a rigidly segregated town—except for federal government agencies. They had been integrated during the post-war Reconstruction period, enabling African-Americans to obtain federal jobs and work side by side with whites in government agencies. Wilson promptly authorized members of his cabinet to reverse this long-standing policy of racial integration in the federal civil service.
Cabinet heads—such as his son-in-law, Secretary of the Treasury William McAdoo of Tennessee—re-segregated facilities such as restrooms and cafeterias in their buildings. In some federal offices, screens were set up to separate white and black workers. African-Americans found it difficult to secure high-level civil service positions, which some had held under previous Republican administrations.
A delegation of black professionals led by Monroe Trotter, a Phi Beta Kappa graduate of Harvard and Boston newspaper editor, appeared at the White House to protest the new policies. But Wilson treated them rudely and declared that “segregation is not a humiliation but a benefit, and ought to be so regarded by you gentlemen.”
[202] Article: “Woodrow Wilson’s Legacy Gets Complicated.” By Jennifer Schuessler. New York Times, November 29, 2015. <www.nytimes.com>
Wilson’s attitudes and record on race, even his staunchest defenders agree, is hardly a pretty one. As president of Princeton, the Virginia-born scholar discouraged an African-American prospective student from applying, calling it “altogether inadvisable for a colored man to enter Princeton.” His textbook “A History of the American People” referred to Reconstruction-era efforts to free the South from “the incubus of that ignorant and often hostile” black vote. …
After his election to the White House in 1912, Wilson, a Democrat, appointed a cabinet that was heavy on Southern racists, including William McAdoo as treasury secretary and Albert Burleson as postmaster general, both of whom quickly pushed to segregate their departments, demoting and firing many blacks.
[203] Article: “D.W. Griffith’s The Birth of a Nation.” By Richard Wormser. PBS. Accessed August 9, 2016 at <www.pbs.org>
On the evening of March 21, 1915, President Woodrow Wilson attended a special screening at the White House of The Birth of a Nation, a film directed by D.W. Griffith and based on The Clansman, a novel written by Wilson’s good friend Thomas Dixon. The film presented a distorted portrait of the South after the Civil War, glorifying the Ku Klux Klan and denigrating blacks. It falsified the period of Reconstruction by presenting blacks as dominating Southern whites (almost all of whom are noble in the film) and sexually forcing themselves upon white women. The Klan was portrayed as the South’s savior from this alleged tyranny. Not only was this portrayal untrue, it was the opposite of what actually happened. During Reconstruction, whites dominated blacks and assaulted black women. The Klan was primarily a white terrorist organization that carried out hundreds of murders.
NOTE: The full 3-hour film can be seen here.
[204] Article: “The Rise and Fall of Jim Crow: Ku Klux Klan.” By Richard Wormser. PBS. Accessed July 21, 2016 at <www.thirteen.org>
William J. Simmons, a former Methodist preacher, organized a new Klan in Stone Mountain, Georgia in 1915 as a patriotic, Protestant fraternal society. This new Klan directed its activity against not just blacks, but immigrants, Jews, and Roman Catholics. The Ku Klux Klan grew rapidly from there and had more than two million members throughout the country by the mid-1920s. D.W. Griffith’s film The Birth of a Nation, which glorified the Klan and denigrated blacks, was used as a recruiting tool.
[205] Article: “Birth of a Quotation: Woodrow Wilson and ‘Like Writing History with Lightning.’ ” By Mark E. Benbowa1. Journal of the Gilded Age and Progressive Era, October 2010. Pages 509–533. <journals.cambridge.org>
In February 1915, upon viewing The Birth of a Nation at a special White House screening, President Woodrow Wilson reportedly remarked, “It’s like writing history with lightning. My only regret is that it is all so terribly true.” This line has appeared in numerous books and articles over the past seventy years. This article examines the history of this alleged quotation and the sources where it has appeared. The article weighs the evidence that Wilson effusively praised in these words one of the most racist major movies in American history.
[206] Article: “The Rise and Fall of Jim Crow: Ku Klux Klan.” By Richard Wormser. PBS. Accessed July 21, 2016 at <www.thirteen.org>
William J. Simmons, a former Methodist preacher, organized a new Klan in Stone Mountain, Georgia in 1915 as a patriotic, Protestant fraternal society. This new Klan directed its activity against not just blacks, but immigrants, Jews, and Roman Catholics. The Ku Klux Klan grew rapidly from there and had more than two million members throughout the country by the mid-1920s. D.W. Griffith’s film The Birth of a Nation, which glorified the Klan and denigrated blacks, was used as a recruiting tool.
[207] Article: “Anti-Lynching Legislation Renewed.” U.S. House of Representatives, History, Art & Archives, Office of the Historian, 2008. Accessed June 28, 2021 at <history.house.gov>
The passage of anti-lynching legislation became one of the NAACP’s [National Association for the Advancement of Colored People] central goals. Although slow to join the cause because its leaders worried about the constitutionality of imposing such a federal law on the states, the NAACP eventually embraced the anti-lynching movement, using it to educate the often ambivalent white population and spur substantive action.
Statistics supported the NAACP’s increased urgency in the anti-lynching campaign. Thousands of southern African Americans had been murdered in the 1890s, and that violence continued into the 20th century. Between 1901 and 1929, more than 1,200 African Americans were lynched in the South. Forty-one percent of these lynchings occurred in two exceptionally violent states: Georgia (250) and Mississippi (245).122 …
… After months of consultation with legal experts and the NAACP, Representative Dyer introduced H.R. 11279 on April 18, 1918, “to protect citizens of the United States against lynching in default of protection by the States.” Dyer’s bill, which provided the blueprint for all subsequent NAACP-backed anti-lynching measures, sought to charge lynch mobs with capital murder and to try lynching cases in federal court. It levied on each county where a lynching occurred, a fine of between $5,000 and $10,000 that would be paid to the victim’s immediate family or, if none existed, to the U.S. government to facilitate prosecution of the case. The Dyer bill also mandated jail time and imposed a fine of up to $5,000 on state and local law enforcement officials who refused to make a reasonable effort to prevent a lynching or surrendered a prisoner in their custody to a lynch mob. Finally, the bill sought to establish guidelines for fair courtroom proceedings by excluding lynch mob participants and supporters from juries.130 …
… In the Democrat-controlled 65th Congress (1917–1919), however, the measure remained stuck in the Judiciary Committee. …
When Republicans gained majorities in the House and Senate at the start of the 66th Congress in 1919, however, supporters of the Dyer bill grew more optimistic. …
Southern Democrats rebuffed the measure, mustering familiar arguments. Hatton W. Sumners of Texas, a Dallas attorney who later served 16 years as chairman of the House Judiciary Committee, led the opposition. …
… In the end, the Dyer bill passed the Republican-controlled chamber on January 26, 1922, by a vote of 231 to 119, with four Members voting “present” and 74 others not voting.138 Among the 119 who voted “no” were four future Speakers of the House, each a southern Democrat who eventually presided over the chamber after Democrats assumed control of the House in 1931: John Nance Garner of Texas, Joseph Byrns of Tennessee, William Bankhead of Alabama, and Sam Rayburn of Texas.139
In the Senate, a combination of ambivalent Republican support and spirited southern opposition doomed the Dyer bill to legislative limbo. It withered in the Judiciary Committee under the unsympathetic oversight of Chairman William Borah of Idaho, who doubted its constitutionality. Nevertheless, Borah pledged not to block consideration of the measure if a majority of his colleagues assented. The measure passed out of the committee 8 to 6 in the summer of 1922—with Borah dissenting.140
The NAACP proceeded to engage in a formidable public campaign, increasing direct pressure on Majority Leader Henry Cabot Lodge of Massachusetts, who faced re-election that fall. Lodge, who had authored the federal elections bill in 1890, had greatly moderated his previously progressive stance on federal oversight of black civil rights. He reluctantly brought the measure to the Senate Floor in September, but his choice of a manager to shepherd the bill through debate—Samuel Shortridge, California’s junior Senator and a relative novice—indicated he had little enthusiasm for the endeavor. Byron (Pat) Harrison of Mississippi swiftly upstaged Shortridge by gaining control of the debate. Reluctant to debate the bill during an election year, the Senate stalled consideration until after the November 1922 midterms.141
When the bill came up for consideration in late November after the elections, southern Members again rebuffed Shortridge with parliamentary maneuvers. As he had with the reduction issue two decades earlier, Alabama’s Oscar Underwood, now Senate Minority Leader, played a key role in killing the Dyer measure. Underwood threatened Lodge and the Republicans with a filibuster that would shut down end-of-session business in the Senate. Fearful they would be unable to secure a ship subsidy bill desired by the Harding administration, the members of the Senate Republican Conference voted to abandon the Dyer bill. Though Representative Dyer reintroduced the measure in each new Congress in the 1920s, it failed to gain significant political traction. The public awareness campaign relentlessly pushed by the NAACP, however, likely contributed to a general decline in lynching after the 1920s. It would be 15 years before Congress would seriously consider the subject again. In the words of historian Robert Zangrando, anti-lynching legislation was “displaced by the indifference of its friends and the strategy of its enemies.”142
[208] “Republican Party Platform of 1928.” June 12, 1928. <www.presidency.ucsb.edu>
“We renew our recommendation that the Congress enact at the earliest possible date a Federal Anti-Lynching Law so that the full influence of the Federal Government may be wielded to exterminate this hideous crime.”
[209] Textbook: AP U.S. History: All Access. By Gregory Feldmeth and others. Research and Education Association, 2012.
Page 446: “All of the black Reconstruction-era elected officials ran as members of the Republican Party. Virtually all blacks who could vote were registered as Republicans from 1865 until the 1930s.”
[210] Article: “President Resents Negro’s Criticism; Refuses to be Cross-Questioned About Racial Segregation in Government Offices. Stands by His Policy.” New York Times, November 13, 1914. <www.nytimes.com>
Segregation of white and negro civil service employees in Government departments, a system inaugurated during the present Administration, is to be continued. President Wilson made clear his views on the subject today when he received a delegation representing the National Independence Equal Rights League. The President resented the attitude of the spokesman, William Monroe Trotter, of Boston, who was quoted as having attempted to cross-examine Mr. Wilson, when the President explained that the question was not a political one, and that he would not be influenced in his decision by the threats of the league to oppose the Democratic Party. …
When the President had concluded his remarks. Trotter stepped forward and began questioning Mr. Wilson. He suggested that unless the Administration abandoned the segregation policy the Democratic Party could expect the united opposition of the negro voters in 1916. …
… Trotter continued to argue that he was merely trying to show how the negro race felt, and asserted that he and others were now being branded as traitors to their race because they advised the colored people “to support the ticket.” …
The President spoke frankly saying that if the colored people had made a mistake in voting for him they ought to correct it, but that he would insist that politics should not be brought into the question because it was not a political problem.
[211] Encyclopedia of Minorities in American Politics: Hispanic Americans and Native Americans (Volume 2). Edited by Jeffrey D. Schultz and others. Oryx Press, 2000.
Page 528: “By the 1920s, voting in the South among blacks, other minorities, and poor whites had been virtually eliminated.”
[212] Book: Black and Blue: African Americans, the Labor Movement, and the Decline of the Democratic Party. By Paul Frymer. Princeton University Press, 2008.
Page 27:
Because of the strong tradition of economic populism in the South, it was not surprising that southern members of Congress joined in many of the economic policies of the New Deal. At the same time, this coalition was fundamentally opposed to even the most tepid suggestions of civil rights reform, forcing party leaders to continually take race questions off the political agenda in order to pass legislation. Southern Democrats were particularly powerful in Congress, as they relied on various internal mechanisms such as seniority rules that—because they ran unopposed in southern elections at a time when most Republican Party voters in the region were disenfranchised—enabled them to control committee chairs, and because the filibuster rule enabled them to block efforts at civil rights reforms in the Senate regardless of their minority numbers.
[213] Book: The End of Southern Exceptionalism: Class, Race, and Partisan Change in the Postwar South. By Byron E. Shafer and Richard Johnston. Harvard University Press, 2006.
“Registration by Southern blacks accelerated remarkably: 5 percent in 1940, 20 percent in 1952, 29 percent in 1960, but 65 percent by 1969 (Bartley and Graham 1975).”
[214] Textbook: AP U.S. History: All Access. By Gregory Feldmeth and others. Research and Education Association, 2012.
Page 446:
The election of Democrat Franklin Roosevelt in 1932, however, caused a massive switch in allegiance from the Republican to the Democratic Party, as New Deal programs offering economic opportunities and labor protections benefited black voters. In addition, the migration of blacks from the deep South to the North and West which began during World War 1 accelerated during the 1930s, affecting local politics. By the election of John F. Kennedy in 1960, almost all black voters were Democrats and voting in regions outside of the former Confederacy.
[215] Book: The American Constitution: Its Origins and Development (3rd edition). By Alfred H. Kelly and Winfred A. Harbison. W. W. Norton & Company, 1963.
Page 924:
In certain northern cities, Negroes also became increasingly powerful politically. … The New Deal somewhat hasten this process. It was concerned with jobs and security for the working class generally, including Negroes, and the result was a substantial shift in the Negroes political allegiance. In many northern urban centers, the Democratic political machine of the 1930s now depended heavily on Negro support to help win local, state, and national elections.
[216] Article: “New Deal.” By David A. Shannon (Ph.D., Former Professor of History, University of Virginia). World Book Encyclopedia, 2007 Deluxe edition.
“The Federal Emergency Relief Administration provided the states with money for the needy.”
[217] Article: “New Deal.” By David A. Shannon (Ph.D., Former Professor of History, University of Virginia). World Book Encyclopedia, 2007 Deluxe edition.
“The United States Housing Act of 1937 … provided money for more federal public housing projects.”
[218] “The Social Security Act of 1935.” United States Congress, August 14, 1935. <www.ssa.gov>
An act to provide for the general welfare by establishing a system of Federal old-age benefits, and by enabling the several States to make more adequate provision for aged persons, blind persons, dependent and crippled children, maternal and child welfare, public health, and the administration of their unemployment compensation laws; to establish a Social Security Board; to raise revenue; and for other purposes.
[219] Article: “Roosevelt, Franklin D.” Encyclopædia Britannica Ultimate Reference Suite 2004.
“The Home Owners’ Refinancing Act provided mortgage relief for millions of unemployed Americans in danger of losing their homes.”
[220] Article: “New Deal.” By David A. Shannon (Ph.D., Former Professor of History, University of Virginia). World Book Encyclopedia, 2007 Deluxe edition.
“The Home Owners Loan Corporation (HOLC) provided money at low interest for persons struggling to pay mortgages.”
[221] Book: Black and Blue: African Americans, the Labor Movement, and the Decline of the Democratic Party. By Paul Frymer. Princeton University Press, 2008.
Pages 27–28:
Thus, when race is added to our history of the Wagner Act and the New Deal, we see not simply a more complicated interpretation of the New Deal and its legacies but a completely new understanding. Because civil rights was not a part of New Deal state making, many of its fundamental features, particularly the triumph of the elected branches over the courts, would turn out to be not so fundamental.
Even in the hey-day of the Democratic Party’s most progressive and activist years, when it routed Republicans at the ballot box to win the White House and outnumber Republicans in Congress by three to one, party leaders knew that they remained vitally dependant on a coalition of southern whites.22 The party’s “Conservative Coalition” consisted of white segregationists whose support of the party dated to before the Civil War. Because of the strong tradition of economic populism in the South, it was not surprising that southern members of Congress joined in many of the economic policies of the New Deal. At the same time, this coalition was fundamentally opposed to even the most tepid suggestions of civil rights reform, forcing party leaders to continually take race questions off the political agenda in order to pass legislation. Southern Democrats were particularly powerful in Congress, as they relied on various internal mechanisms such as seniority rules that—because they ran unopposed in southern elections at a time when most Republican Party voters in the region were disenfranchised—enabled them to control committee chairs, and because the filibuster rule enabled them to block efforts at civil rights reforms in the Senate regardless of their minority numbers.
The presence of southern Democrats and their willingness to stray from the party line to block civil rights legislation not only prevented such legislation but necessitated that economic bills include provisions that either explicitly or, more often simply in a de facto manner, discriminated against large numbers of minority workers. The common method of this was for legislators to exclude categories of workers where African Americans and other minorities predominated, such as domestic and agricultural workers.
[222] Article: “Wagner Act.” Encyclopædia Britannica Ultimate Reference Suite 2004.
“… officially National Labor Relations Act (1935) the single most important piece of labour legislation enacted in the United States in the 20th century.”
NOTE: Extensive facts about this law are available in Just Facts’ research on unions.
[223] Ruling: Pattern Makers’ League of North America v. National Labor Relations Board. U.S. Supreme Court, June 27, 1985. Decided 6–3. Majority: Powell, Burger, White, Rehnquist, O’Connor. Concurring: Blackmun. Dissenting: Brennan, Marshall, Stevens. <caselaw.findlaw.com>
Majority: “Closed shop agreements, legalized by the Wagner Act in 1935,15 became quite common in the early 1940’s. Under these agreements, employers could hire and retain in their employ only union members in good standing.”
[224] Article: “Closed Shop.” By Andrew Journal Waskey. The Encyclopedia of the Industrial Revolution in World History (Volume 3). Edited by Kenneth E. Hendrickson, III. Rowman & Littlefield, 2015. Pages 189–190.
Page 190:
The NLRA [National Labor Relations Act] was signed into law by President Franklin Roosevelt in 1935. Among the workers’ rights that the NLRA guaranteed was the right to enter into a closed-shop agreement. Closed-shop agreements prevent workers who are not unionized or who are members of another union from working in a workplace controlled by a closed-shop agreement. The agreements have enforcement mechanisms that keep worker solidarity during strikes. Labor leaders were convinced from long experience that negotiations for improvements in wages and working conditions were much better if the union was a closed shop. …
In 1947, Congress amended the NLRA with an act that is called the Labor–Management-Relations Act (29 USCA 151 et seq.), best known by its popular name, the Taft–Hartley Act. Prior to its adoption, about a third of all union contracts were closed-shop agreements.
[225] Report: “Legislative History of the Labor Management Relations Act, 1947 (Volume I).” National Labor Relations Board, 1948.
Pages 412–413:
We have felt that on the record before us the abuses of the system have become too serious and numerous to justify permitting present law to remain unchanged. It is clear that the closed shop which requires preexisting union membership as a condition of obtaining employment creates too great a barrier to free employment to be longer tolerated. In the maritime industry and to a large extent in the construction industry union hiring halls now provide the only method of securing employment. This not only permits unions holding such monopolies over jobs to exact excessive fees but it deprives management of any real choice of the men it hires. Extension of this principle to licensed deck and engine officers has created the greatest problems in connection with the safety of American vessels et sea. (See testimony of Almon E. Roth, id., vol. 2, p. 612.) Numerous examples were presented to the committee of the way union leaders have used closed-shop devices as a method of depriving employees of their jobs, and in some cases a means of securing a livelihood in their trade or calling, for purely capricious reasons.
[226] Book: Black Labor and the American Legal System: Race, Work, and the Law. By Herbert Hill. University of Wisconsin Press, 1985.
Page 121:
In the late 1950s the NLRB [National Labor Relations Board] attempted to institute a practice which would have benefited many thousands of black workers who were denied equal employment rights because they were discriminatorily denied union membership. As demonstrated by the extensive hearings of the Fair Employment Practice Committee during World War II (see Part 2), closed-shop agreements were effectively used in many instances to prevent Negro workers from obtaining employment. Under the closed-shop arrangement, the employer agreed not to hire anyone who was not a member of the union. Therefore, through exclusionary membership policies, many labor unions prevented the employment of Negro workers.
[227] Article: “Closed Shop.” By Andrew Journal Waskey. The Encyclopedia of the Industrial Revolution in World History (Volume 3). Edited by Kenneth E. Hendrickson, III. Rowman & Littlefield, 2015. Pages 189–190.
Page 190:
The Wagner Act had allowed closed-shop unions to exclude blacks, Puerto Ricans, Chinese, women, and others. In the economics of the struggle between labor and management, it has been in the interest of labor to restrict the entry of new skilled workers to the labor force. If the supply of labor can be controlled, then wages and other terms of labor can be negotiated from a position of greater strength.
[228] Book: The Other Missouri History: Populists, Prostitutes, and Regular Folk. By Thomas Morris Spencer. University of Missouri Press, 2004.
Chapter: “Race, Power, and the Building Trades Industry in Postwar St. Louis.” By Deborah Journal Henry. Pages 81–114.
Page 97:
The report further summarized the number of Negro electricians, plumbers, painters, brick masons, and plasterers that held either city licenses and/or union cards from locals in other cities. Nonetheless, as long as closed shop provisions remained in place, building trades unions continued to deny membership to blacks. At the same time, other members of the urban renewal coalition—contractors, private capital, St. Louis City Hall—refused to force change to these exclusionary practices, reinforcing white workers’ control over the city, skilled building trades jobs.
[229] Article: “Taft–Hartley Act.” Encyclopædia Britannica Ultimate Reference Suite 2004.
“… formally Labor–Management Relations Act (1947), in U.S. history, law—enacted over the veto of Pres. Harry S. Truman—amending much of the pro-union Wagner Act of 1935. … Republican majorities in both houses of Congress—the first since 1930—sought to remedy the union abuses seen as permitted under the Wagner Act.”
[230] Ruling: Pattern Makers’ League of North America v. National Labor Relations Board. U.S. Supreme Court, June 27, 1985. Decided 6–3. Majority: Powell, Burger, White, Rehnquist, O’Connor. Concurring: Blackmun. Dissenting: Brennan, Marshall, Stevens. <caselaw.findlaw.com>
Majority:
Because of mounting objections to the closed shop, in 1947—after hearings and full consideration—Congress enacted the Taft–Hartley Act. Section 8(a)(3) of that Act effectively eliminated compulsory union membership by outlawing the closed shop. The union security agreements permitted by 8(a)(3) require employees to pay dues, but an employee cannot be discharged for failing to abide by union rules or policies with which he disagrees.16
[231] Ruling: Communications Workers v. Beck. U.S. Supreme Court, June 29, 1988. Decided 5–3. Majority: Brennan, Rehnquist, White, Marshall, Stevens. Dissenting in part: Blackmun, O’Connor, Scalia. <caselaw.findlaw.com>
Majority:
Prior to the enactment of the Taft–Hartley Act of 1947, 61 Stat. 140, 8(3) of the Wagner Act of 1935 (NLRA) [National Labor Relations Act] permitted majority unions to negotiate “closed shop” agreements requiring employers to hire only persons who were already union members. … By 1947, such agreements had come under increasing attack, and after extensive hearings Congress determined that the closed shop and the abuses associated with it “create[d] too great a barrier to free employment to be longer tolerated.”
Dissent:
Congress’ solution [in the 1947 Taft–Hartley Act] was to ban the closed shop and to permit the enforcement of union-shop agreements as long as union membership is available “on the same terms and conditions” to all employees, and mandatory discharge is required only for “nonpayment of regular dues and initiation fees.” … Congress was of the view, that, as Senator Taft stated, “[t]he fact that the employee will have to pay dues to the union seems … to be much less important. The important thing is that the man will have the job.” … “[A] man can get a job with an employer and can continue in that job if, in effect, he joins the union and pays the union dues.”
[232] Public Law 80-101: “Labor Management Relations Act of 1947” (a.k.a “Taft–Hartley Act”). 80th U.S. Congress. Enacted over the veto of Harry Truman on June 23, 1947. <tile.loc.gov>
Sec. 8 (a) … (3) … [N]o employer shall justify any discrimination against an employee for nonmembership in a labor organization (A) if he has reasonable grounds for believing that such membership was not available to the employee on the same terms and conditions generally applicable to other members, or (B) if he has reasonable grounds for believing that membership was denied or terminated for reasons other than the failure of the employee to tender the periodic dues and the initiation fees uniformly required as a condition of acquiring or retaining membership….
[233] Article: “Closed Shop.” By Andrew Journal Waskey. The Encyclopedia of the Industrial Revolution in World History (Volume 3). Edited by Kenneth E. Hendrickson, III. Rowman & Littlefield, 2015. Pages 189–190.
Many labor union historians believe that the banning of the closed shop was a significant step in the movement to stop unions from engaging in racial discrimination. The Wagner Act had allowed closed-shop unions to exclude blacks, Puerto Ricans, Chinese, women, and others. …
Landrum-Griffin relegalized closed shops. They had continued in effect, although not in name, by means of a number of subterfuges. These included agreements that allowed the union to supply workers first, and then if they could not find them, then companies could make nonunion hires. Other devices for circumventing Taft-Hartley included hiring only workers who were in a union prior to a certain date, or the use of training programs to ensure that only those experienced or trained by the union were hired.
[234] Article: “NAACP Seeks More Anti-Bias.” Jet, March 10, 1960. Pages 44–45. <books.google.com>
Pages 44–45:
Steps to insure compliance with anti-bias clauses in government contracts were ordered by Vice-President Richard M. Nixon, chairman of the President’s Committee on Government Contracts, on the eve of a meeting with NAACP [National Association for the Advancement of Colored People] executive secretary Roy Wilkins and labor secretary Herbert Hill. Unleashing a double barreled attack on labor union bias last week, the NAACP executives appealed to Mr. Nixon to end discrimination against Negro workers on all levels from sharecroppers to skilled tradesmen.
[235] Book: The American Constitution: Its Origins and Development (3rd edition). By Alfred H. Kelly & Winfred A. Harbison. W. W. Norton & Company, 1963.
Page 763:
A momentary furor occurred in September, when Senator Hugo Black of Alabama, whom Roosevelt named to fill the Van Devanter vacancy, was “exposed” as having once been a member of the Ku Klux Klan. The connection was certainly an incongruous one for a liberal, but Black’s record in the Senate had in fact been consistently progressive. Although this one-time Klan connection had been exposed in his last Alabama senatorial campaign, the National Association for the Advancement of Colored People had continued, in recognition of his liberalism, to lend him enthusiastic support. Justice Black’s subsequent consistent liberalism on the Court soon silenced those who feared he might be a reactionary in disguise.
[236] Ruling: Korematsu v. United States. U.S. Supreme Court, December 18, 1944. Decided 6–3. Majority: Black, Douglas, Reed, Rutledge, Stone. Concurring: Frankfurter. Dissenting: Roberts, Murphy, Jackson. <caselaw.findlaw.com>
Majority:
Mr. Justice Black delivered the opinion of the Court.
The petitioner, an American citizen of Japanese descent, was convicted in a federal district court for remaining in San Leandro, California, a “Military Area,” contrary to Civilian Exclusion Order No. 34 of the Commanding General of the Western Command, U.S. Army, which directed that after May 9, 1942, all persons of Japanese ancestry should be excluded from that area. No question was raised as to petitioner’s loyalty to the United States.
It should be noted, to begin with, that all legal restrictions which curtail the civil rights of a single racial group are immediately suspect. That is not to say that all such restrictions are unconstitutional. It is to say that courts must subject them to the most rigid scrutiny. Pressing public necessity may sometimes justify the existence of such restrictions; racial antagonism never can. …
One of the series of orders and proclamations, a curfew order, which like the exclusion order here was promulgated pursuant to Executive Order 9066, subjected all persons of Japanese ancestry in prescribed West Coast military areas to remain in their residences from 8 p.m. to 6 a.m. As is the case with the exclusion order here, that prior curfew order was designed as a “protection against espionage and against sabotage.” In Kiyoshi Hirabayashi v. United … we sustained a conviction obtained for violation of the curfew order. The Hirabayashi conviction and this one thus rest on the same 1942 Congressional Act and the same basic executive and military orders, all of which orders were aimed at the twin dangers of espionage and sabotage. …
In the light of the principles we announced in the Hirabayashi case, we are unable to conclude that it was beyond the war power of Congress and the Executive to exclude those of Japanese ancestry from the West Coast war area at the time they did. True, exclusion from the area in which one’s home is located is a far greater deprivation than constant confinement to the home from 8 p.m. to 6 a.m. Nothing short of apprehension by the proper military authorities of the gravest imminent danger to the public safety can constitutionally justify either. But exclusion from a threatened area, no less than curfew, has a definite and close relationship to the prevention of espionage and sabotage. The military authorities, charged with the primary responsibility of defending our shores, concluded that curfew provided inadequate protection and ordered exclusion. They did so, as pointed out in our Hirabayashi opinion, in accordance with Congressional authority to the military to say who should, and who should not, remain in the threatened areas. …
Like curfew, exclusion of those of Japanese origin was deemed necessary because of the presence of an unascertained number of disloyal members of the group, most of whom we have no doubt were loyal to this country. It was because we could not reject the finding of the military authorities that it was impossible to bring about an immediate segregation of the disloyal from the loyal that we sustained the validity of the curfew order as applying to the whole group. In the instant case, temporary exclusion of the entire group was rested by the military on the same ground. The judgment that exclusion of the whole group was for the same reason a military imperative answers the contention that the exclusion was in the nature of group punishment based on antagonism to those of Japanese origin. That there were members of the group who retained loyalties to Japan has been confirmed by investigations made subsequent to the exclusion. Approximately five thousand American citizens of Japanese ancestry refused to swear unqualified allegiance to the United States and to renounce allegiance to the Japanese Emperor, and several thousand evacuees requested repatriation to Japan.
… Compulsory exclusion of large groups of citizens from their homes, except under circumstances of direst emergency and peril, is inconsistent with our basic governmental institutions. But when under conditions of modern warfare our shores are threatened by hostile forces, the power to protect must be commensurate with the threatened danger. …
Some of the members of the Court are of the view that evacuation and detention in an Assembly Center were inseparable. After May 3, 1942, the date of Exclusion Order No. 34, Korematsu was under compulsion to leave the area not as he would choose but via an Assembly Center. The Assembly Center was conceived as a part of the machinery for group evacuation. The power to exclude includes the power to do it by force if necessary. And any forcible measure must necessarily entail some degree of detention or restraint whatever method of removal is selected. But whichever view is taken, it results in holding that the order under which petitioner was convicted was valid. …
Dissent:
Mr. Justice Roberts.
I dissent, because I think the indisputable facts exhibit a clear violation of Constitutional rights.
This is not a case of keeping people off the streets at night as was Kiyoshi Hirabayashi v. United States, 320 U.S. 81, 63 S.Ct. 1375, nor a case of temporary exclusion of a citizen from an area for his own safety or that of the community, nor a case of offering him an opportunity to go temporarily out of an area where his presence might cause danger to himself or to his fellows. On the contrary, it is the case of convicting a citizen as a punishment for not submitting to imprisonment in a concentration camp, based on his ancestry, and solely because of his ancestry, without evidence or inquiry concerning his loyalty and good disposition towards the United States. If this be a correct statement of the facts disclosed by this record, and facts of which we take judicial notice, I need hardly labor the conclusion that Constitutional rights have been violated. …
The petitioner, a resident of San Leandro, Alameda County, California, is a native of the United States of Japanese ancestry who, according to the uncontradicted evidence, is a loyal citizen of the nation. …
February 19, 1942, the President issued Executive Order No. 9066,1 which, after stating the reason for issuing the order as “protection against espionage and against sabotage to national-defense material, national-defense premises, and national-defense utilities,” provided that certain Military Commanders might, in their discretion, “prescribe military areas” and define their extent, “from which any or all persons may be excluded, and with respect to which, the right of any person to enter, remain in, or leave shall be subject to whatever restrictions” the “Military Commander may impose in his discretion.”
February 20, 1942, Lieutenant General DeWitt was designated Military Commander of the Western Defense Command embracing the westernmost states of the Union,—about one-fourth of the total area of the nation.
March 2, 1942, General DeWitt promulgated Public Proclamation No. 1,2 which recites that the entire Pacific Coast is “particularly subject to attack, to attempted invasion … and, in connection therewith, is subject to espionage and acts of sabotage.” …
May 3, 1942, General DeWitt issued Civilian Exclusion Order No. 346 providing that, after 12 o’clock May 8, 1942, all persons of Japanese ancestry, both alien and non-alien, were to be excluded from a described portion of Military Area No. 1, which included the County of Alameda, California. The order required a responsible member of each family and each individual living alone to report, at a time set, at a Civil Control Station for instructions to go to an Assembly Center, and added that any person failing to comply with the provisions of the order who was found in the described area after the date set would be liable to prosecution under the Act of March 21, 1942, supra. It is important to note that the order, by its express terms, had no application to persons within the bounds “of an established Assembly Center pursuant to instructions from this Headquarters ….” The obvious purpose of the orders made, taken together, was to drive all citizens of Japanese ancestry into Assembly Centers within the zones of their residence, under pain of criminal prosecution. The predicament in which the petitioner thus found himself was this: He was forbidden, by Military Order, to leave the zone in which he lived; he was forbidden, by Military Order, after a date fixed, to be found within that zone unless he were in an Assembly Center located in that zone. General DeWitt’s report to the Secretary of War concerning the programme of evacuation and relocation of Japanese makes it entirely clear, if it were necessary to refer to that document,—and, in the light of the above recitation, I think it is not,—that an Assembly Center was a euphemism for a prison. No person within such a center was permitted to leave except by Military Order. …
… We further know that, on March 18, 1942, the President had promulgated Executive Order No. 91027 establishing the War Relocation Authority under which so-called Relocation Centers, a euphemism for concentration camps, were established pursuant to cooperation between the military authorities of the Western Defense Command and the Relocation Authority, and that the petitioner has been confined either in an Assembly Center, within the zone in which he had lived or has been removed to a Relocation Center where, as the facts disclosed … demonstrate, he was illegally held in custody. …
We cannot shut our eyes to the fact that had the petitioner attempted to violate Proclamation No. 4 and leave the military area in which he lived he would have been arrested and tried and convicted for violation of Proclamation No. 4. The two conflicting orders, one which commanded him to stay and the other which commanded him to go, were nothing but a cleverly devised trap to accomplish the real purpose of the military authority, which was to lock him up in a concentration camp. The only course by which the petitioner could avoid arrest and prosecution was to go to that camp according to instructions to be given him when he reported at a Civil Control Center. We know that is the fact. Why should we set up a figmentary and artificial situation instead of addressing ourselves to the actualities of the case? …
The judicial test of whether the Government, on a plea of military necessity, can validly deprive an individual of any of his constitutional rights is whether the deprivation is reasonably related to a public danger that is so “immediate, imminent, and impending” as not to admit of delay and not to permit the intervention of ordinary constitutional processes to alleviate the danger. … Civilian Exclusion Order No. 34, banishing from a prescribed area of the Pacific Coast “all persons of Japanese ancestry, both alien and non-alien,” clearly does not meet that test. Being an obvious racial discrimination, the order deprives all those within its scope of the equal protection of the laws as guaranteed by the Fifth Amendment. It further deprives these individuals of their constitutional rights to live and work where they will, to establish a home where they choose and to move about freely. In excommunicating them without benefit of hearings, this order also deprives them of all their constitutional rights to procedural due process. Yet no reasonable relation to an “immediate, imminent, and impending” public danger is evident to support this racial restriction which is one of the most sweeping and complete deprivations of constitutional rights in the history of this nation in the absence of martial law.
[237] Webpage: “Members of the Supreme Court of the United States.” U.S. Supreme Court. Accessed October 6, 2014 at <www.supremecourt.gov>
|
Name |
Appointed By |
Judicial Oath Taken |
Date Service Terminated |
Decision in Korematsu |
|
Chief Justices |
||||
|
Stone, Harlan Fiske |
Roosevelt, F. |
July 3, 1941 |
April 22, 1946 |
Majority |
|
Associate Justices |
||||
|
Roberts, Owen Josephus |
Hoover |
June 2, 1930 |
July 31, 1945 |
Dissent |
|
Stone, Harlan Fiske |
Coolidge |
March 2, 1925 |
July 2, 1941† |
Majority |
|
Black, Hugo Lafayette |
Roosevelt, F. |
August 19, 1937 |
September 17, 1971 |
Majority author |
|
Reed, Stanley Forman |
Roosevelt, F. |
January 31, 1938 |
February 25, 1957 |
Majority |
|
Frankfurter, Felix |
Roosevelt, F. |
January 30, 1939 |
August 28, 1962 |
Concurrence |
|
Douglas, William Orville |
Roosevelt, F. |
April 17, 1939 |
November 12, 1975 |
Majority |
|
Murphy, Frank |
Roosevelt, F. |
February 5, 1940 |
July 19, 1949 |
Dissent |
|
Jackson, Robert Houghwout |
Roosevelt, F. |
July 11, 1941 |
October 9, 1954 |
Dissent |
|
Rutledge, Wiley Blount |
Roosevelt, F. |
February 15, 1943 |
September 10, 1949 |
Majority |
|
† Elevated |
||||
[238] Book: The American Constitution: Its Origins and Development (3rd edition). By Alfred H. Kelly & Winfred A. Harbison. W. W. Norton & Company, 1963.
Page 952:
By 1956, however, the political atmosphere with respect to civil-rights legislation was undergoing substantial change. Northern Democrats had become acutely aware that the Southern Democratic stand on civil rights badly damaged the party strength not only in presidential campaigns but also in local Northern congressional elections. Republican politicians, by contrast, seized upon the civil rights issue is a means whereby the all-important Northern Negro vote might be wooed away from its old New Deal political allegiance. Republican party platforms of 1952 in 1956 were strong and unequivocal in the demand for comprehensive civil rights legislation, while Vice President Richard Nixon was an avowed member of the NAACP [National Association for the Advancement of Colored People]. The civil rights issue, in short, posed an issue upon which Republicans now eagerly seized and which Northern Democrats were obliged to meet.
[239] Calculated with data from the webpage: “Party Divisions of the House of Representatives.”
Accessed August 10, 2016 at <history.house.gov>
|
Congress (Years) |
# of House Seats |
Democrats |
Republicans |
|
79th (1945–1947) |
435 |
244 |
189 |
|
80th (1947–1949) |
435 |
188 |
246 |
CALCULATION: 244 – 189 = 55
[240] Calculated with data from the webpage: “Party Division in the Senate, 1789–Present.” U.S. Senate Historical Office. Accessed August 8, 2015 at <www.senate.gov>
79th Congress (1945–1947)
Majority Party: Democrat (57 seats)
Minority Party: Republican (38 seats)
Other Parties: 1 Progressive
Total Seats: 96
80th Congress (1947–1949)
Majority Party: Republican (51 seats)
Minority Party: Democrat (45 seats)
Other Parties: 0
Total Seats: 96
CALCULATION: 57 – 45 = 12
[241] Article: “United States Presidential Election of 1948.” By Michael Levy. Encyclopædia Britannica. Accessed August 10, 2016 at <www.britannica.com>
“American presidential election held on Nov. 2, 1948, in which Democratic Pres. Harry S. Truman defeated Republican Thomas E. Dewey.”
[242] Executive Order: “Establishing the President’s Committee on Equality of Treatment and Opportunity in the Armed Services.” By Harry S. Truman. White House, July 26, 1948. <www.govinfo.gov>
Page 4313:
WHEREAS it is essential that there be maintained in the armed services of the United States the highest standards of democracy, with equality of treatment and opportunity for all those who serve in our country’s defense:
NOW, THEREFORE, by virtue of the authority vested in me as President of the United States, by the Constitution and the statutes of the United States, and as Commander in Chief of the armed services, it is hereby ordered as follows:
1. It is hereby declared to be the policy of the President that there shall be equality of treatment and opportunity for all persons in the armed services without regard to race, color, religion or national origin. This policy shall be put into effect as rapidly as possible, having due regard to the time required to effectuate any necessary changes without impairing efficiency or morale.
[243] Article: “July 26, 1948: President Truman Issues Executive Order No. 9981 Desegregating the Military.” Harry S. Truman Library and Museum, National Archives and Records Administration. Accessed August 09, 2016 at <www.trumanlibrary.org>
President Truman had been examining the issue of segregation in the armed forces since at least 1947, when he appointed the President’s Committee on Civil Rights. By January 1948, internal White House memos indicated that the President was determined to end military segregation by executive order. However, it was not until the delegates at the 1948 Democratic National Convention called for a liberal civil rights plank that included desegregation of the armed forces that Truman felt comfortable enough to issue Executive Order No. 9981 on July 26. The order stated that “It is hereby declared to be the policy of the President that there shall be equality of treatment and opportunity for all persons in the armed services without regard to race, color, religion, or national origin.” The order also established the President’s Committee on Equality of Treatment and opportunity in the Armed Services (Fahy Committee).
Naturally, there was resistance to this order within the military. Staff officers from all branches protested anonymously and sometimes even openly to integration. The Fahy Committee worked with the different branches of the military to ensure that the armed forces instituted integration in their recruitment and unit composition practices. Full integration did not come until the Korean War however, when heavy casualties forced segregated units to merge for survival.
[244] “1948 Democratic Party Platform.” July 12, 1948. <www.presidency.ucsb.edu>
The Democratic Party is responsible for the great civil rights gains made in recent years in eliminating unfair and illegal discrimination based on race, creed or color.
The Democratic Party commits itself to continuing its efforts to eradicate all racial, religious and economic discrimination.
We again state our belief that racial and religious minorities must have the right to live, the right to work, the right to vote, the full and equal protection of the laws, on a basis of equality with all citizens as guaranteed by the Constitution.
We highly commend President Harry S. Truman for his courageous stand on the issue of civil rights.
We call upon the Congress to support our President in guaranteeing these basic and fundamental American Principles: (1) the right of full and equal political participation; (2) the right to equal opportunity of employment; (3) the right of security of person; (4) and the right of equal treatment in the service and defense of our nation.
[245] Article: “Dixiecrats.” By Scott E. Buchanan. New Georgia Encyclopedia, July 27, 2004. Last edited on 8/11/2020. <www.georgiaencyclopedia.org>
The faction consisted of malcontented southern delegates to the Democratic Party who protested the insertion of a civil rights plank in the party platform and U.S. president Harry S. Truman’s advocacy of that plank. Before the convention southern delegates were dismayed by Truman’s 1948 executive order to desegregate the armed forces. …
When the Democratic national convention convened in July 1948, some Alabama and Mississippi delegates were prepared to walk out of the convention if the civil rights platform passed. When it did, all of the Mississippi delegates and half of the Alabama delegates stormed out of the convention. On July 17, 1948, the Alabama and Mississippi delegations, and a few individual delegates from other southern states, met in Birmingham, Alabama, to select a presidential ticket to oppose the Democrats. The Dixiecrats chose South Carolina’s governor, Strom Thurmond, for president and Fielding L. Wright, governor of Mississippi, for vice president.
On election day 1948, the Dixiecrats won Alabama, Louisiana, Mississippi, and South Carolina but failed to win any state in which Thurmond appeared as a third-party candidate. …
Although the Dixiecrats immediately dissolved after the 1948 election, their impact lasted much longer.
[246] “Platform of the States Rights Democratic Party.” August 14, 1948. <www.presidency.ucsb.edu>
- 4 -
We stand for the segregation of the races and the racial integrity of each race; the constitutional right to choose one’s associates; to accept private employment without governmental interference, and to earn one’s living in any lawful way. We oppose the elimination of segregation, the repeal of miscegenation statutes [banning interracial marriage], the control of private employment by Federal bureaucrats called for by the misnamed civil rights program. We favor home-rule, local self-government and a minimum interference with individual rights.
- 5 -
We oppose and condemn the action of the Democratic Convention in sponsoring a civil rights program calling for the elimination of segregation, social equality by Federal fiat, regulations of private employment practices, voting, and local law enforcement.
- 6 -
We affirm that the effective enforcement of such a program would be utterly destructive of the social, economic and political life of the Southern people, and of other localities in which there may be differences in race, creed or national origin in appreciable numbers.
[247] Book: The American Constitution: Its Origins and Development (3rd edition). By Alfred H. Kelly & Winfred A. Harbison. W. W. Norton & Company, 1963.
Pages 952–953:
By 1956, however, the political atmosphere with respect to civil-rights legislation was undergoing substantial change. Northern Democrats had become acutely aware that the Southern Democratic stand on civil rights badly damaged the party strength not only in presidential campaigns but also in local Northern congressional elections. Republican politicians, by contrast, seized upon the civil rights issue is a means whereby the all-important Northern Negro vote might be wooed away from its old New Deal political allegiance. Republican party platforms of 1952 in 1956 were strong and unequivocal in the demand for comprehensive civil rights legislation, while Vice President Richard Nixon was an avowed member of the NAACP [National Association for the Advancement of Colored People]. The civil rights issue, in short, posed an issue upon which Republicans now illegally seized in which Northern Democrats were obliged to meet.
… In June 1956, the House passed an administration civil-rights bill, 297 to 126, but the measure thereafter died of calculated strangulation in the Senate Judiciary committee. …
When Congress assembled in January 1957, following a second Eisenhower victory produced in some part by Negro votes, a coalition of Northern Democrats and Republicans at once began a new civil-rights drive.
Page 954:
The Senate took up consideration of the House bill in early July. It soon became evident that a coalition of moderates under the leadership of majority party leader Lyndon Johnson of Texas was in control of affairs. Under Johnson’s leadership, the Senate struck out (92 to 0) a provision that would have activated an old Reconstruction statute authorizing the president to use troops to enforce civil rights decrees, killed (52 to 38) a more important provision allowing the Attorney General to seek injunctions against conspiracies against civil rights, and voted to modify the content provisions to require jury trial in criminal as distinct from civil contempt cases. Although Richard Russell of Georgia from one side attacked the bill as “a cunningly devised scheme to put black heels on white necks,” and Eisenhower on the other hand castigated it is so weak as to be “bitterly disappointing,” the Senate passed the bill in August, 72 to 18. After Senate–House conference changes the president signed the bill into law in September.
The Civil Rights Act of 1957, as finally adopted, was an extremely modest measure, it’s immediate value limited largely to strengthening somewhat the judicial enforcement of voting rights in the South.
[248] Report: “A Review of the Operations of the Voting Section of the Civil Rights Division.” U.S. Department of Justice, Office of the Inspector General, March 2013. <oig.justice.gov>
Page 9:
Created by the enactment of the Civil Rights Act of 1957, the Department’s Civil Rights Division (the “Division” or “CRT”) enforces a wide array of laws that protect the civil rights of all individuals, including the enforcement of federal statutes prohibiting discrimination on the basis of race, color, sex, disability, religion, familial status, and national origin.
[249] Article: “Orval Eugene Faubus (1910–1994).” By Roy Reed. Encyclopedia of Arkansas. Last updated September 22, 2011. <www.encyclopediaofarkansas.net>
His record was in many ways progressive, but he is most widely remembered for his attempt to block the desegregation of Little Rock’s Central High School in 1957. …
… Pragmatism and ambition drove him toward the Democratic Party as Roosevelt’s New Deal took hold. … He remained a politician for the rest of his life. …
… The Little Rock School Board made cautious plans to place the first black pupils in all-white Central High School in September 1957, three years after the Supreme Court had ruled segregated schools unconstitutional. …
On September 2, 1957, Faubus called out the National Guard to block the admission of nine black pupils to Central High School. His justification was that violence threatened and he had to preserve the peace. A federal judge ordered the guardsmen removed. The students, known as the Little Rock Nine, returned to the school but were met by a mob of enraged segregationists. The local police, unable to control the crowd, spirited the Nine out of the building. President Dwight D. Eisenhower federalized the National Guard and dispatched Army troops to restore order and enforce the court’s ruling.
[250] Book: The American Constitution: Its Origins and Development (3rd edition). By Alfred H. Kelly & Winfred A. Harbison. W. W. Norton & Company, 1963.
Page 938:
A conference between Faubus and the President failed to produce any result, and Attorney General Herbert Brownell, Jr., acting on the president’s instructions, sought and obtained an injunction against Faubus, ordering him and the officers of the National Guard to cease forthwith from blocking enforcement of the federal court integration orders. The Governor thereupon withdrew the National Guard. However when Negro students again attempted to enter the high school they were prevented from doing so by a large and ugly-tempered mop.
Accordingly, the President on September 25 dispatched several companies of the United States Army to Little Rock, in effect putting the city under martial law.
[251] Book: The American Constitution: Its Origins and Development (3rd edition). By Alfred H. Kelly & Winfred A. Harbison. W. W. Norton & Company, 1963.
Page 955:
When Congress assembled in January, 1960, on the eve of a new presidential election, it was apparent that the civil-rights issue would dominate the session. President Eisenhower’s annual message called for a new civil-rights law providing for a system of voter referees appointed by the federal courts. Other proposals follow the Commission report.
Although the rules committee under Representative Smith again attempted to bottle up the administration bill in the House, in mid-February the threat of a discharge petition forced the committee to allow this measure to go to the floor. In addition to the voter referee scheme, the bill made it a crime to interfere with the school desegregation orders of the federal courts, punished arson and bombing where the perpetrators crossed state lines, and required two-year preservation of voting records. After five weeks of debate, the bill passed by overwhelming majorities substantially unchanged.
Meanwhile, the Southern Democrats under Russell’s leadership tied up consideration of civil rights and that body with one of the most protracted filibusters in Senate history. However, Johnson by another series of parliamentary maneuvers now took the house bill to the Senate floor, with the Northern coalition succeeded in forcing the bill to a favorable vote, 71 to 18.
[252] 24th Amendment to the U.S. Constitution. Ratified January 23, 1964. <www.justfacts.com>
Section 1. The right of citizens of the United States to vote in any primary or other election for President or Vice President, for electors for President or Vice President, or for Senator or Representative in Congress, shall not be denied or abridged by the United States or any state by reason of failure to pay any poll tax or other tax.
Section 2. The Congress shall have power to enforce this article by appropriate legislation.
[253] The Concise Princeton Encyclopedia of American Political History. Edited by Michael Kazin and others. Princeton University Press, 2011.
Page 582: “Once the Republican Party was so diminished that it had no possibility of winning elections in the South, most states simplified the practice of discrimination by adopting a ‘white primary’ within the Democratic Party. The only meaningful elections in the South, by the early twentieth century, were the Democratic primaries, and African Americans were expressly barred from participation.”
[254] Book: The Constitution of The United States of America: Analysis And Interpretation (Centennial edition). Edited by Kenneth R. Thomas and Larry M. Eig. Library of Congress, Congressional Research Service, 2013. <www.gpo.gov>
Page 2214:
The White Primary.—The Court displayed indecision, however, when it was called upon to deal with the exclusion of African-Americans from participation in primary elections. Prior to its becoming convinced that primary contests were in fact elections to which federal constitutional guarantees applied,12 the Court had relied upon the Equal Protection Clause to strike down the Texas White Primary Law13 as well as a later Texas statute that contributed to a similar exclusion by limiting voting in primary elections to members of state political parties as determined by the central committees of such parties.14 When exclusion of African-Americans was thereafter perpetuated by political parties not acting in obedience to any statutory command, this discrimination was for a time viewed as not constituting state action and therefore as not prohibited by either the Fourteenth or the Fifteenth Amendments.15 This holding was reversed nine years later when the Court declared that, where the selection of candidates for public office is entrusted by statute to political parties, a political party in making its selection at a primary election is a state agency, and consequently may not under the Fifteenth Amendment exclude African-Americans from such elections.16 An effort by South Carolina to escape the effects of this ruling by repealing all statutory provisions regulating primary elections and political organizations conducting them was nullified by a lower federal court with no doctrinal difficulty,17 but the Supreme Court, although nearly unanimous on the result, was unable to come to a majority agreement with regard to the exclusion of African-Americans by the Jaybird Association, a countywide organization that, independently of state laws and the use of state election machinery or funds, nearly monopolized access to Democratic nomination for local offices. The exclusionary policy was held unconstitutional but there was no opinion of the Court.18
[255] Public Law 88-352: “Civil Rights Act of 1964.” 88th U.S. Congress. Signed into law by Lyndon B. Johnson on July 2, 1964. <www.govinfo.gov>
An Act
To enforce the constitutional right to vote, to confer jurisdiction upon the district courts of the United States to provide injunctive relief against discrimination in public accommodations, to authorize the Attorney General to institute suits to protect constitutional rights in public facilities and public education, to extend the Commission on Civil Rights, to prevent discrimination in federally assisted programs, to establish a Commission on Equal Employment Opportunity, and for other purposes. …
Sec. 601. No person in the United States shall, on the ground of race, color, or national origin, be excluded from participation in, be denied the benefits of, or be subjected to discrimination under any program or activity receiving Federal financial assistance. …
Sec. 701. For the purposes of this title …
(b) The term “employer” means a person engaged in an industry affecting commerce who has twenty-five or more employees for each working day in each of twenty or more calendar weeks in the current or preceding calendar year, and any agent of such a person, but such term does not include (1) the United States, a corporation wholly owned by the Government of the United States, an Indian tribe, or a State or political subdivision thereof, (2) a bona fide private membership club (other than a labor organization) which is exempt from taxation under section 501(c) of the Internal Revenue Code of 1954: Provided, That during the first year after the effective date prescribed in subsection (a) of section 716, persons having fewer than one hundred employees (and their agents) shall not be considered employers, and, during the second year after such date, persons having fewer than seventy-five employees (and their agents) shall not be considered employers, and, during the third year after such date, persons having fewer than fifty employees (and their agents) shall not be considered employers: Provided further, That it shall be the policy of the United States to insure equal employment opportunities for Federal employees without discrimination because of race, color, religion, sex or national origin and the President shall utilize his existing authority to effectuate this policy. …
Sec. 703.
(a) It shall be an unlawful employment practice for an employer—
(1) to fail or refuse to hire or to discharge any individual, or otherwise to discriminate against any individual with respect to his compensation, terms, conditions, or privileges of employment, because of such individual’s race, color, religion, sex, or national origin; or
(2) to limit, segregate, or classify his employees in any way which would deprive or tend to deprive any individual of employment opportunities or otherwise adversely affect his status as an employee, because of such individual’s race, color, religion, sex, or national origin.
(b) It shall be an unlawful employment practice for an employment agency to fail or refuse to refer for employment, or otherwise to discriminate against, any individual because of his race, color, religion, sex, or national origin, or to classify or refer for employment any individual on the basis of his race, color, religion, sex, or national origin.
(c) It shall be an unlawful employment practice for a labor organization–
(1) to exclude or to expel from its membership, or otherwise to discriminate against, any individual because of his race, color, religion, sex, or national origin;
(2) to limit, segregate, or classify its membership, or to classify or fail or refuse to refer for employment any individual, in any way which would deprive or tend to deprive any individual of employment opportunities, or would limit such employment opportunities or otherwise adversely affect his status as an employee or as an applicant for employment, because of such individual’s race, color, religion, sex, or national origin; or
(3) to cause or attempt to cause an employer to discriminate against an individual in violation of this section.
(d) It shall be an unlawful employment practice for any employer, labor organization, or joint labor-management committee controlling apprenticeship or other training or retraining, including on-the-job training programs to discriminate against any individual because of his race, color, religion, sex, or national origin in admission to, or employment in, any program established to provide apprenticeship or other training. …
[256] Calculated with data from:
a) Book: “Congressional Record: Proceedings and Debates of the 88th Congress, Second Session, Volume 111, Part 11.” U.S. Government Printing Office, 1965.
Page 15534: “Of the 289 favorable [House] votes, 158 were Democratic and 136 were Republican. Ninety-one Democrats and 35 Republicans voted ‘no.’ President Lyndon B. Johnson signed the Civil Rights Act of 1964 on July 3, 1964.”
b) Article: “Civil Rights Bill Passed, 73–27; Johnson Urges All To Comply; Dirksen Berates Goldwater.” By E. W. Kenworthy. New York Times, June 19, 1964. <www.nytimes.com>
“The final roll-call [in the Senate] came at 7:40 P.M. on the 83d day of debate, nine days after closure was invoked. Voting for the bill were 46 Democrats and 27 Republicans. Voting against it were 21 Democrats and six Republicans.”
NOTE: Results do not include those not voting or those who voted “Present.”
|
House |
||||
|
Party |
Voted YES |
Voted NO |
||
|
Republican |
136 |
80% |
35 |
20% |
|
Democrat |
158 |
63% |
91 |
37% |
|
Senate |
||||
|
Party |
Voted YES |
Voted NO |
||
|
Republican |
27 |
82% |
6 |
18% |
|
Democrat |
46 |
69% |
21 |
31% |
|
Congress as a Whole |
||||
|
Party |
Voted YES |
Voted NO |
||
|
Republican |
163 |
80% |
41 |
20% |
|
Democrat |
204 |
65% |
112 |
35% |
[257] Statement of U.S. Senator Joseph S. Clark (D-PA). Congressional Record, April 8, 1964. Pages 7206–7207. <www.congress.gov>
I have also had prepared by the Department of Justice a summary statement in rebuttal to the argument made by the Senator from Alabama [Mr. HILL] to the effect that title VII would undermine the vested rights of seniority; that it would deny to unions their representation rights under the National Labor Relations Act and the Railway Labor Act; that the operation of title VI would in some way affect adversely the rights of organized labor; and that title VII would impose the requirement of racial balance.
I submit that those assertions of the able senior Senator from Alabama are untenable.
Mr. President, I ask unanimous consent that the rebuttal to the argument prepared at my request by the Department of Justice be printed in full in the RECORD at this point in my remarks.
There being no objection, the statement was ordered to be printed in the RECORD, as follows:
Reply to Arguments Made by Senator Hill
First, it has been asserted that title VII would undermine vested rights of seniority. This is not correct. Title VII would have no effect on seniority rights existing at the time it takes effect. If, for example, a collective bargaining contract provides that in the event of layoffs, those who were hired last must be laid off first, such a provision would not be affected in the least by title VII. This would be true even in the case where owing to discrimination prior to the effective date of the title, white workers had more seniority than Negroes. Title VII is directed at discrimination based on race, color, religion, sex, or national origin. It is perfectly clear that when a worker is laid off or denied a chance for promotion because under established seniority rules he is “low man on the totem pole” he is not being discriminated against because of his race. Of course, if the seniority rule itself is discriminatory, it would be unlawful under title VII. If a rule were to state that all Negroes must be laid off before any white man, such a rule could not serve as the basis for a discharge subsequent to the effective date of the title. I do not know how anyone could quarrel with such a result. But, in the ordinary case, assuming that seniority rights were built up over a period of time during which Negroes were not hired, these rights would not be set aside by the taking effect of title VII. Employers and labor organizations would simply be under a duty not to discriminate against Negroes because of their race. Any differences in treatment based on established seniority rights would not be based on race and would not be forbidden by the title.
[258] Paper: “United States v. City of Chicago: Impact Standard Applicable to State and Local Governments Under Title VII.” By Lydia C. Taylor and Francis C. Bagbey. William & Mary Law Review, December 1978. Pages 357–392. <scholarship.law.wm.edu>
Pages 357–358:
Title VII of the Civil Rights Act of 19641 prohibits employment practices that discriminate because of race, color, religion, sex, or national origin. As originally enacted, Title VII exempted state and local governments from the provisions of the Act.3 …
3 Section 2000e(b)(1) reads in pertinent part: “The term ‘employer’ means a person engaged in an industry affecting commerce … but such term does not include (1) … a State or political subdivision thereof ….”
[259] Paper: “United States v. City of Chicago: Impact Standard Applicable to State and Local Governments Under Title VII.” By Lydia C. Taylor and Francis C. Bagbey. William & Mary Law Review, 1978. Pages 357–392. <scholarship.law.wm.edu>
Pages 357–358:
Title VII of the Civil Rights Act of 19641 prohibits employment practices that discriminate because of race, color, religion, sex, or national origin.2 As originally enacted, Title VII exempted state and local governments from the provisions of the Act.3 The United States Commission on Civil Rights, finding that state and local government employment was characterized by many discriminatory procedures, criticized the denial of this federal remedy to employees of those governments.4 Congress recognized the anomaly of extending discriminatory practices while denying assistance to similarly aggrieved public employees5 and responded by adopting the Equal Employment Opportunity Act of 1972,6 thereby amending Title VII to include state and local government employees.7 …
3 Section 2000e(b)(1) reads in pertinent part: “The term ‘employer’ means a person engaged in an industry affecting commerce … but such term does not include (1) … a State or political subdivision thereof….”
4 United States Commission on Civil Rights, For All the People … By All the People 121 (1969) [hereinafter cited as For All the People]. The Commission found that “[m]inority group members are denied equal access to State and local government jobs.” Id. at 118. This exclusion is accomplished, the Commission explained, “by overt discrimination in personnel actions and hiring decisions, a lack of positive action by governments to redress the consequences of past discrimination, and discriminatory and biased treatment on the job.” Id. at 119. Particularly relevant to the subject of this Comment, the Commission suggested that the “[b]arriers to equal employment are greater in police and fire departments than in any other area of State and local government.” Id. Concluding that enforcement of the fourteenth amendment’s prohibition against discriminatory state action had been sporadic and burdensome, the Commission recommended eliminating the exemption of state and local governments from the coverage of Title VII. Id. at 128.
5 The report accompanying the Senate bill, S. 2515, containing a provision expanding the jurisdiction of the Civil Rights Act of 1964 to include state and local governments, interpreted the findings of For All the People, supra note 4, to indicate that “employment discrimination in State and local governments is more pervasive than in the private sector.” Senate Report No. 415, 92d Cong., 1st Sess. 10 (1971) [hereinafter cited as S. Rep. No. 415]. The report accompanying the analogous House bill, H.R. 1746, emphasized the injustice of withholding federal remedies from the victims of constitutionally prohibited discrimination because of their peculiar employment status. House of Representatives Report No. 238, 92d Cong., 1st Sess. 17–19 [hereinafter cited as H.R. Rep. No. 238], reprinted in [1972] U.S. Code Cong. & Ad. News 2137, 2152–54 [hereinafter cited as Ad. News].
6 Pub. L. No. 92-261, 86 Stat. 103 (amending 42 U.S.C. § 2000e (1970) [hereinafter cited as the 1972 amendments].
For discussion and analysis of the Equal Employment Opportunity Act of 1972 and its legislative history, see Sape and Hart, Title VII Reconsidered: The Equal Employment Opportunity Act of 1972, 40 George Washington law Review 824 (1972).
7 The definition of “person” found in § 2000e(a) of the Civil Rights Act of 1964 was amended to include “governments, governmental agencies, [and] political subdivisions.” 42 U.S.C. § 2000e(a) (Supp. V 1975). Section 2000e(b), defining “employer” was amended to include persons employing fifteen or more employees, and the “State or political subdivision thereof” exemption was deleted. Id. § 2000e(b).
One commentator has described the expansion of Title VII to state and local government employees as “the most significant change in the scope of the Act.” Mitchell, An Advocate’s View of the 1972 Amendments to Title VII, 5 Columbia Human Rights Law Review 311, 322 (1973).
[260] Public Law 92-261: “Equal Employment Opportunity Act of 1972.” 92nd U.S. Congress. Signed into law by Richard Nixon on March 24,1972. <www.govinfo.gov>
[261] Statement: “Equal Employment Opportunity Act of 1972.” By Richard Nixon, March 25, 1972. <www.presidency.ucsb.edu>
By strengthening and expanding the Government’s powers against discrimination in employment, this legislation is an important step toward true equality on the job front. Where promises have sometimes failed, we may now expect results. …
Additionally, the legislation extends the protections of Title VII to millions of American citizens previously excluded from its coverage. The experiences of both the Justice Department and the EEOC [U.S. Equal Employment Opportunity Commission] under Title VII have demonstrated that considerable discrimination problems have existed in State and local governments, with small employers, and in some educational institutions. Individuals employed in these areas have not heretofore been protected by Title VII. This bill corrects that defect.
[262] “Remarks to the Virginia Democratic Party Jefferson Jackson Dinner.” By Bill Bradley, February 6, 1999. Accessed in December 1999 at <www.billbradley.com>
[263] Calculated with data from the article “Civil Rights Bill Passed, 73–27; Johnson Urges All To Comply; Dirksen Berates Goldwater.” By E. W. Kenworthy. New York Times, June 19, 1964. <www.nytimes.com>
“The final roll-call [in the Senate] came at 7:40 P.M. on the 83d day of debate, nine days after closure was invoked. Voting for the bill were 46 Democrats and 27 Republicans. Voting against it were 21 Democrats and six Republicans.”
NOTE: Results do not include those not voting or those who voted “Present.”
|
Senate |
||||
|
Party |
Voted YES |
Voted NO |
||
|
Republican |
27 |
82% |
6 |
18% |
|
Democrat |
46 |
69% |
21 |
31% |
[264] Article: “Senate Votes Cloture on Civil Rights Bill, 71–29.” Congressional Quarterly, 1965. Pages 368–380.
For the first time in its history, the Senate June 10 voted to close off debate on a civil rights filibuster. The vote for cloture was 71–29. With all 100 Senators present and voting, 67 votes were needed. The vote ended a filibuster that occupied 57 days after formal Senate consideration of the Civil Rights Act began March 26, and 74 days after the bill was put before the Senate Feb. 26. …
Forty-four Democrats and 27 Republicans joined in voting to end the Southern filibuster. The cloture motion was opposed by 23 Democrats and 6 Republicans. The 6 Republicans were: Wallace F. Bennett (Utah), Barry Goldwater (Ariz.), Edwin L. Mechem (N.M.), Milward L. Simpson (Wyo.), John G. Tower (Texas) and Milton R. Young (N.D.). The following Democrats joined 18 from the deep South in voting against ending the debate: Alan Bible (Nev.), Robert C. Byrd (W.Va.), Albert Gore (Tenn.), Herbert S. Walters (Tenn.) and Carl Hayden (Ariz.), dean of the Senate, who had never voted for cloture.
[265] Vote: “Civil Rights Act of 1963, Cloture Motion.” Congressional Record, June 10, 1964. Pages 7206–7207. <www.congress.gov>
Page 13327:
A quorum being present, the Chair submits to the Senate, without debate, the question: Is it the sense of the Senate that the debate shall be brought to a close?
The yeas and nays are required by the rule; and the Secretary will call the roll.
The Chief Clerk called the roll.
The yeas and nays resulted-yeas 71, nays 29, as follows:
|
[No. 281 Leg.] |
||
|
YEAS—71 |
||
|
Aiken |
Gruening |
Monroney |
|
Allott |
Hart |
Morse |
|
Anderson |
Hartke |
Morton |
|
Bartlett |
Hickenlooper |
Moss |
|
Bayh |
Hruska |
Mundt |
|
Beall |
Humphrey |
Muskie |
|
Boggs |
Inouye |
Nelson |
|
Brewster |
Jackson |
Neuberger |
|
Burdick |
Javits |
Pastore |
|
Cannon |
Jordan, Idaho |
Pearson |
|
Carlson |
Keating |
Pell |
|
Case |
Kennedy |
Prouty |
|
Church |
Kuchel |
Proxmire |
|
Clark |
Lausche |
Randolph |
|
Cooper |
Long, Mo. |
Ribicoff |
|
Cotton |
Magnuson |
Saltonstall |
|
Curtis |
Mansfield |
Scott |
|
Dirksen |
McCarthy |
Smith |
|
Dodd |
McGee |
Symington |
|
Dominick |
McGovern |
Williams, N.J. |
|
Douglas |
McIntyre |
Williams, Del. |
|
Edmondson |
McNamara |
Yarborough |
|
Engle |
Metcalf |
Young, Ohio |
|
Fong |
Miller |
|
|
NAYS—29 |
||
|
Bennett |
Hayden |
Simpson |
|
Bible |
Hill |
Smathers |
|
Byrd, Va. |
Holland |
Sparkman |
|
Byrd, W.Va. |
Johnston |
Stennis |
|
Eastland |
Jordan, N.C. |
Talmadge |
|
Ellender |
Long, La. |
Thurmond |
|
Ervin |
McClellan |
Tower |
|
Fulbright |
Mechem |
Walters |
|
Goldwater |
Robertson |
Young, N.Dak. |
|
Gore |
Russell |
|
The ACTING PRESIDENT pro tempore. Two-thirds of the Senators present having voted in the affirmative, the motion is agreed to.
[266] Commentary: “Blacks ‘Gored’ By a Lie: Al Gore Sr., the GOP and the Civil Rights Act of 1964.” National Center for Public Policy Research, May 1, 1999. <nationalcenter.org>
“In a recent speech to the NAACP [National Association for the Advancement of Colored People], Vice President Gore said his father lost his Senate seat because he supported civil rights legislation. Fellow black Americans, let me set history straight. Al Gore, Sr., together with the rest of the southern Democrats, voted against the Civil Rights Act of 1964.”
[267] “Civil Rights.” Accessed in February 2000 at <www.algore2000.com>
My commitment to civil rights is a deeply personal one. I watched my father when he was, a U.S. Senator from Tennessee, take courageous stands for civil rights. He opposed the poll tax in the 40s, and supported civil rights in the 50s, he supported voting rights in 1963, and was one of two Southern Senators to refuse to sign the hateful Southern Manifesto opposing integration in our schools. He lost his Senate seat because [sic] his stands.
[268] Webpage: “Roll Call Tally on Civil Rights Act 1964, June 19, 1964.” U.S. National Archives. <www.archives.gov>
“Nays … Gore.”
[269] Article: “Senate Votes Cloture on Civil Rights Bill, 71–29.” Congressional Quarterly, 1965. Pages 368–380.
For the first time in its history, the Senate June 10 voted to close off debate on a civil rights filibuster. The vote for cloture was 71–29. With all 100 Senators present and voting, 67 votes were needed. The vote ended a filibuster that occupied 57 days after formal Senate consideration of the Civil Rights Act began March 26, and 74 days after the bill was put before the Senate Feb. 26. …
Forty-four Democrats and 27 Republicans joined in voting to end the Southern filibuster. The cloture motion was opposed by 23 Democrats and 6 Republicans. The 6 Republicans were: Wallace F. Bennett (Utah), Barry Goldwater (Ariz.), Edwin L. Mechem (N.M.), Milward L. Simpson (Wyo.), John G. Tower (Texas) and Milton R. Young (N.D.). The following Democrats joined 18 from the deep South in voting against ending the debate: Alan Bible (Nev.), Robert C. Byrd (W.Va.), Albert Gore (Tenn.), Herbert S. Walters (Tenn.) and Carl Hayden (Ariz.), dean of the Senate, who had never voted for cloture.
[270] Vote to Strike Out Title VI, Civil Rights Act of 1963. Congressional Record, June 10, 1964. Pages 7206–7207. <www.congress.gov>
Page 13418:
The question is on agreeing to the amendment offered by the Senator from Tennessee [Mr. Gore] to strike out title VI. The yeas and nays have been ordered, and the clerk will call the roll. …
The result was announced-yeas 25, nays 69, as follows:
|
[No. 287 Leg.] |
||
|
YEAS—25 |
||
|
Byrd, Va. |
Hruska |
Russell |
|
Byrd, W.Va. |
Johnston |
Smathers |
|
Cooper |
Jordan, N.C. |
Sparkman |
|
Eastland |
Long, La. |
Stennis |
|
Ellender |
McClellan |
Talmadge |
|
Ervin |
Mechem |
Thurmond |
|
Gore |
Monroney |
Walters |
|
Hill |
Morton |
|
|
Holland |
Robertson |
|
|
NAYS—69 |
||
|
Aiken |
Fong |
Morse |
|
Allott |
Gruening |
Moss |
|
Anderson |
Hart |
Mundt |
|
Bartlett |
Hartke |
Muskie |
|
Bayh |
Hickenlooper |
Nelson |
|
Beall |
Humphrey |
Neuberger |
|
Bennett |
Inouye |
Pastore |
|
Bible |
Jackson |
Pearson |
|
Boggs |
Javits |
Pell |
|
Brewster |
Jordan, Idaho |
Prouty |
|
Burdick |
Keating |
Proxmire |
|
Cannon |
Kennedy |
Randolph |
|
Carlson |
Kuchel |
Ribicoff |
|
Case |
Lausche |
Scott |
|
Church |
Long, Mo. |
Simpson |
|
Clark |
Magnuson |
Smith |
|
Cotton |
McCarthy |
Symington |
|
Curtis |
McGee |
Tower |
|
Dirksen |
McGovern |
Williams, Del. |
|
Dodd |
Mcintyre |
Williams, N.J. |
|
Dominick |
McNamara |
Yarborough |
|
Douglas |
Metcalf |
Young, N.Dak. |
|
Edmondson |
Miller |
Young, Ohio |
|
NOT VOTING—6 |
||
|
Engle |
Goldwater |
Mansfield |
|
Fulbright |
Hayden |
Saltonstall |
So Mr. Gore’s amendment was rejected.
[271] Article: “Senate Votes Cloture on Civil Rights Bill, 71–29.” Congressional Quarterly, 1965. Pages 368–380.
Next, the Senate rejected an amendment by Gore to strike Title VI, covering cutoff of federal funds if discriminatorily administered. The vote was 25–69 (R [Republicans] 4–27; ND [Northern Democrats] 1–40; SD [Southern Democrats] 20–2). Gore said the title was a “sledgehammer provision” that would punish the innocent in an attempt to punish state or local officials. Abraham A. Ribicoff (D Conn.), former Secretary of Health, Education and Welfare (1961–62), said that the intention of the provision was not to cut off funds, but to bring about policy changes through negotiation and conciliation. Gordon Allott (R Colo.) said “this bill represents nothing if we continue to use the taxes of this country for the benefit of one group.” Sens. John Sherman Cooper (R Ky.) and Monroney supported Gore, arguing that the programs to be covered should be spelled out in the bill. Despite this support, Gore’s amendment was rejected by a lopsided vote. Many Republicans, including the conservative Tower (R Texas), voted against Gore in order to be consistent with their earlier votes for anti-discrimination riders when federal programs were being approved by Congress.
[272] NOTE: Credit for bringing to attention many of the facts in the three bullets points above belongs to R.D. Davis of Project 21. [Commentary: “Blacks ‘Gored’ By a Lie: Al Gore Sr., the GOP and the Civil Rights Act of 1964.” National Center for Public Policy Research, May 1, 1999. <nationalcenter.org>].
[273] Book review: “The Myth of ‘the Southern Strategy.’ ” By Clay Risen. New York Times, December 10, 2006. <www.nytimes.com>
Everyone knows that race has long played a decisive role in Southern electoral politics. From the end of Reconstruction until the beginning of the civil rights era, the story goes, the national Democratic Party made room for segregationist members—and as a result dominated the South. But in the 50s and 60s, Democrats embraced the civil rights movement, costing them the white Southern vote. Meanwhile, the Republican Party successfully wooed disaffected white racists with a “Southern strategy” that championed “states’ rights.”
It’s an easy story to believe, but this year two political scientists called it into question.
[274] Commentary: “Whitewash.” By Frank Rich. New York Magazine, May 3, 2013. <nymag.com>
“You also have to disregard the political game plan codified by Kevin Phillips, the Nixon political strategist whose book The Emerging Republican Majority helped cement the party’s ‘southern strategy’ of mining white backlash to the civil-rights movement.”
[275] Article: “The Civil Rights Realignment: How Race Dominates Presidential Elections.” By Timothy J. Hoffman (Seton Hall University). Political Analysis, May 2015. <scholarship.shu.edu>
Page 10:
After a failed bid for the White House in 1960, Nixon won in 1968 with 301 electoral votes, beating Democrat Hubert Humphrey, and third-party candidate, George Wallace from the American Independent Party (Government Printing Office 1969). Nixon sought votes by expanding upon Barry Goldwater’s “Operation Dixie” to galvanize the support of old segregationist Southern Democrats through his “Southern Strategy” (Greenberg 2000). … Despite Wallace’s supremacy in the South, Nixon’s Southern Strategy paid long-term dividends for Nixon and the Republican Party. The Southern Strategy used states’ rights and other racially tinged appeals to court white conservative voters and exploited dissatisfaction with Johnson’s liberal racial and economic policies.
[276] Commentary: “The Republican Party’s Race Problem and Strom Thurmond’s Legacy.” By Jordan Michael Smith. Daily Beast, September 22, 2012. Updated 7/14/17. <www.thedailybeast.com>
As the Democrats abandoned their longtime hostility to African-Americans’ civil rights in the 1940s, Thurmond and his compatriots moved to the Republican Party. …
It was not until the mid-1960s that the South turned from blue to red. In 1964 and ’65, Democratic President Lyndon Johnson introduced and signed the strongest civil-rights bills yet enacted by Congress. The 1964 Republican presidential nominee, Barry Goldwater, voted against the laws and took up the mantle of “states’ rights.” Again the standard-bearer was Thurmond, who campaigned hard for the conservative icon. Republicans won South Carolina and four other Southern states, the best showing in the South for the party since reconstruction.
[277] Webpage: “Southern Manifesto on Integration (March 12, 1956).” PBS. Accessed August 13, 2016 at <www.pbs.org>
From Congressional Record, 84th Congress Second Session. Vol. 102, part 4. Washington, D.C.: Governmental Printing Office, 1956. 4459–4460. …
Transcript …
In the case of Plessy v. Ferguson in 1896 the Supreme Court expressly declared that under the Fourteenth Amendment no person was denied any of his rights if the states provided separate but equal public facilities. This decision has been followed in many other cases. It is notable that the Supreme Court, speaking through Chief Justice Taft, a former President of the United States, unanimously declared in 1927 in Lum v. Rice that the “separate but equal” principle is “* * * within the discretion of the state in regulating its public schools and does not conflict with the Fourteenth Amendment.” …
With the gravest concern for the explosive and dangerous condition created by this decision and inflamed by outside meddlers. …
We decry the Supreme Court’s encroachments on rights reserved to the states and to the people, contrary to established law and to the Constitution.
We commend the motives of those states which have declared the intention to resist forced integration by any lawful means. …
Signed by:
Members of the United States Senate:
Alabama – John Sparkman and Lister Hill.
Arkansas – J. W. Fulbright and John L. McClellan.
Florida – George A. Smathers and Spessard L. Holland.
Georgia – Walter F. George and Richard B. Russell.
Louisiana – Allen J. Ellender and Russell B. Long.
Mississippi – John Stennis and James O. Eastland.
North Carolina – Sam J. Ervin Jr. and W. Kerr Scott.
South Carolina – Strom Thurmond and Olin D. Johnston.
Texas – Price Daniel.
Virginia – Harry F. Bird and A. Willis Robertson.
Members of the United States House of Representatives:
Alabama – Frank J. Boykin, George M. Grant, George M. Andrews, Kenneth R. Roberts, Albert Rains, Armistead I. Selden Jr., Carl Elliott, Robert E. Jones and George Huddleston Jr.
Arkansas – E. C. Gathings, Wilbur D. Mills, James W. Trimble, Oren Harris, Brooks Hays, F. W. Norrell.
Florida – Charles E. Bennett Robert L. Sikes, A. S. Her Jr., Paul G. Rogers, James A. Haley, D. R. Matthews.
Georgia – Prince H. Preston, John L. Pilcher, E. L. Forrester, John James Flint Jr., James C. Davis, Carl Vinson, Henderson Lanham, Iris F. Blitch, Phil M. Landrum, Paul Brown.
Louisiana – F. Edward Hebert, Hale Boggs, Edwin E. Willis, Overton Brooks, Otto E. Passman, James H. Morrison, T. Ashton Thompson, George S. Long.
Mississippi – Thomas G. Abernethy, Jamie L. Whitten, Frank E. Smith, John Bell Williams, Arthur Winsted, William M. Colmer.
North Carolina – Herbert C. Bonner, L. H. Fountain, Graham A. Barden, Carl T. Durham, F. Ertel Carlyle, Hugh Q. Alexander, Woodrow W. Jones, George A. Shuford.
South Carolina – L. Mendel Rivers, John J. Riley, W. J. Bryan Dorn, Robert T. Ashmore, James P. Richards, John L. McMillan.
Tennessee – James B. Frazier Jr., Tom Murray, Jere Cooper, Clifford Davis.
Texas – Wright Patman, John Dowdy, Walter Rogers, O. C. Fisher.
Virginia – Edward J. Robeson Jr., Porter Hardy Jr., J. Vaughan Gary, Watkins M. Abbitt, William M. Tuck, Richard H. Poff, Burr P. Harrison, Howard W. Smith, W. Pat Jennings, Joel T. Brothill.
NOTE: Just Facts made some spelling corrections to the PBS transcription of signatories.
[278] “Biographical Directory of the United States Congress, 1774–2005.” U.S. Congress, September 13, 2010. <www.govinfo.gov>
1) John Sparkman [D]
2) Lister Hill [D]
3) J. W. Fulbright [D]
4) John L. McClellan [D]
5) George A. Smathers [D]
6) Spessard L. Holland [D]
7) Walter F. George [D]
8) Richard B. Russell [D]
9) Allen J. Ellender [D]
10) Russell B. Lono [D]
11) John Stennis [D]
12) James O. Eastland [D]
13) Sam J. Ervin Jr. [D]
14) W. Kerr Scott [D]
15) Strom Thurmond [D to R]
16) Olin D. Johnston [D]
17) Price Daniel [D]
18) Harry F. Bird [D]
19) A. Willis Robertson [D]
NOTE: A spreadsheet detailing offices held, years of service, and party affiliations for each of these individuals is available here.
[279] Book: The End of Southern Exceptionalism: Class, Race, and Partisan Change in the Postwar South. By Byron E. Shafer and Richard Johnston. Harvard University Press, 2006.
Page 167:
Of the 29 congressional districts that Governor Thurmond had pulled away from the Democrats in 1948, those districts which had been carried by President Franklin Roosevelt in 1944 and were carried by Thurman in 1948, the overwhelming majority—25 out of 29—returned to Democrat Adlai Stevenson in 1952. By contrast, of the 68 congressional districts that had ignored Thurmond and stayed with Harry Truman in 1948, all of which had voted for Franklin Roosevelt in 1944, almost 40% [26 of 68] abandoned Stevenson in 1952 and went to the Republican candidate, Dwight Eisenhower. In other words, Dixiecratic districts remained overwhelmingly Democratic. Loyalist districts were more likely to go Republican. Thus if the bridging metaphor had any validity, it was Truman, not Thurman, who was the bridge to enhanced Republican prospects!
[280] Book: The End of Southern Exceptionalism: Class, Race, and Partisan Change in the Postwar South. By Byron E. Shafer and Richard Johnston. Harvard University Press, 2006.
Page 167:
Of the 29 congressional districts that Governor Thurmond had pulled away from the Democrats in 1948, those districts which had been carried by President Franklin Roosevelt in 1944 and were carried by Thurman in 1948, the overwhelming majority—25 out of 29—returned to Democrat Adlai Stevenson in 1952. By contrast, of the 68 congressional districts that had ignored Thurmond and stayed with Harry Truman in 1948, all of which had voted for Franklin Roosevelt in 1944, almost 40% [26 of 68] abandoned Stevenson in 1952 and went to the Republican candidate, Dwight Eisenhower. In other words, Dixiecratic districts remained overwhelmingly Democratic. Loyalist districts were more likely to go Republican. Thus if the bridging metaphor had any validity, it was Truman, not Thurman, who was the bridge to enhanced Republican prospects!
[281] Article: “Dixiecrats.” By Scott E. Buchanan. New Georgia Encyclopedia, July 27, 2004. Last edited 8/11/20. <www.georgiaencyclopedia.org>
A closer analysis of the [1948] Dixiecrat phenomenon revealed an interesting pattern: the Dixiecrats were most successful in the states and counties where Black citizens were the most numerous. The Deep South states boasted the largest Black populations, and white voters in those states were the most determined to preserve racial segregation and Black disenfranchisement, and thus were more likely to vote for the Dixiecrat ticket. A similar trend is evident in county-level election returns, in which Thurmond was more likely to win counties where Black populations were large and white voters feared racial change.
[282] Book: The End of Southern Exceptionalism: Class, Race, and Partisan Change in the Postwar South. By Byron E. Shafer and Richard Johnston. Harvard University Press, 2006.
Page 166:
Given that black areas were poor areas generally….
Despite the absence of individual-level data, the effect of racial context on (white) Southern voters remains clear enough in the Dixiecratic ballot of 1948. Governor Thurmond actually carried the more-black states in the South, while losing less-black counterparts just as he carried the more-black black districts within each group of states, while losing their less-black brethren. Moreover, for 1948, it is possible to know that this effect was not an ecological fallacy, since blacks were not enfranchised generally in the South and were particularly scarce as voters in these more-black areas.
[283] Book: The End of Southern Exceptionalism: Class, Race, and Partisan Change in the Postwar South. By Byron E. Shafer and Richard Johnston. Harvard University Press, 2006.
Pages 25–26:
Table 2.1. Social Class and the Coming of Southern Republicanism: The House …
Table 2.1A does contain what will prove to be the overall story of partisan change among Southern whites during all the postwar years. Yet its aggregation still very much masks the extent of the change, even in just this one institution, because it still includes many who could not vote Republican for the House of Representatives because they had no Republican candidate. Accordingly, the analysis should really be restricted to white Southerners who possessed both a Democratic and a Republican congressional alternative. When this restriction is imposed, the same patterns recur, writ larger still. …
Page 31:
Table 2.3. Social Class and the Coming of Southern Republicanism: The Presidency …
Yet despite clear differences in their electoral districting, the Senate and the House often behaved in highly parallel ways…. If we compare the mean Republican vote in contested districts across the postwar years, the two bodies are effectively indistinguishable (Figure 2.1A). …
In the 1950 election, for example, the one before Dwight Eisenhower energized a Republican presidential vote in the South, his party could manage no House challengers at all in Arkansas, Georgia, Louisiana, and South Carolina. That was the situation in the old South.
NOTE: The sample sizes for the data points in these tables range from 59 to 423. This equates to a margin of error of ±13% to ±5% with a 95% level of confidence. The average sample size is 208, which equates to a margin of error of ± 7%. [“Margin of Error Calculator.” ComRes, 2017. Accessed August 13, 2016 at <comresglobal.com>]
[284] Commentary: “The Republican Party’s Race Problem and Strom Thurmond’s Legacy.” By Jordan Michael Smith. Daily Beast, September 22, 2012. <www.thedailybeast.com>
As the Democrats abandoned their longtime hostility to African-Americans’ civil rights in the 1940s, Thurmond and his compatriots moved to the Republican Party. …
It was not until the mid-1960s that the South turned from blue to red. In 1964 and ’65, Democratic President Lyndon Johnson introduced and signed the strongest civil-rights bills yet enacted by Congress. The 1964 Republican presidential nominee, Barry Goldwater, voted against the laws and took up the mantle of “states’ rights.” Again the standard-bearer was Thurmond, who campaigned hard for the conservative icon. Republicans won South Carolina and four other Southern states, the best showing in the South for the party since reconstruction.
[285] Encyclopedia of Minorities in American Politics: Hispanic Americans and Native Americans (Volume 2). Edited by Jeffrey D. Schultz and others. Oryx Press, 2000.
Page 528: “The brief enfranchisement of African Americans ended, however, after 1877, when southern Democrats regained control of state governments after federal troops were withdrawn after Reconstruction.”
[286] Calculated with data from:
a) Book: “Congressional Record: Proceedings and Debates of the 88th Congress, Second Session, Volume 111, Part 11.” U.S. Government Printing Office, 1965.
Page 15534: “Of the 289 favorable [House] votes, 158 were Democratic and 136 were Republican. Ninety-one Democrats and 35 Republicans voted ‘no.’ President Lyndon B. Johnson signed the Civil Rights Act of 1964 on July 3, 1964.”
b) Article: “Civil Rights Bill Passed, 73–27; Johnson Urges All To Comply; Dirksen Berates Goldwater.” By E. W. Kenworthy. New York Times, June 19, 1964. <www.nytimes.com>
“The final roll-call [in the Senate] came at 7:40 P.M. on the 83d day of debate, nine days after closure was invoked. Voting for the bill were 46 Democrats and 27 Republicans. Voting against it were 21 Democrats and six Republicans.”
NOTE: Results do not include those not voting or those who voted “Present.”
|
House |
||||
|
Party |
Voted YES |
Voted NO |
||
|
Republican |
136 |
80% |
35 |
20% |
|
Democrat |
158 |
63% |
91 |
37% |
|
Senate |
||||
|
Party |
Voted YES |
Voted NO |
||
|
Republican |
27 |
82% |
6 |
18% |
|
Democrat |
46 |
69% |
21 |
31% |
|
Congress as a Whole |
||||
|
Party |
Voted YES |
Voted NO |
||
|
Republican |
163 |
80% |
41 |
20% |
|
Democrat |
204 |
65% |
112 |
35% |
[287] Calculated with data from:
a) Dataset: “Historical Election Results, Electoral Votes, by State.” National Archives and Records Administration, U.S. Electoral College. Accessed August 12, 2016 at <www.archives.gov>
b) Webpage: “Civil War Facts.” National Park Service. Accessed August 12, 2016 at <www.nps.gov>
“The Confederacy included the states of Texas, Arkansas, Louisiana, Tennessee, Mississippi, Alabama, Georgia, Florida, South Carolina, North Carolina and Virginia.”
NOTE: An Excel file containing the data and calculations is available upon request.
[288] Commentary: “NRSC [National Republican Senatorial Committee] Calls Dem Condemnation Of Paul Civil Rights Act Statements ‘Ironic.’ ” By Evan McMorris-Santoro. Talking Points Memo, May 21, 2010. <talkingpointsmemo.com>
“Everybody knows that in 1964, a proud southern Democratic President, Lyndon Johnson, pushed hard to secure the Civil Rights Bill, with the aid of a coalition of northern Democrats and Republicans,” Wilentz said. “This sent the defeated segregationist Southern Democrats (led by Strom Thurmond) fleeing into the Republican Party, where its remnants, along with a younger generation of extremist conservative white southerners, including Rand Paul, still reside.” …
“In many ways, the 1964 Act defined the modern political parties—with the Republicans becoming the heirs to the traditions of the Confederacy and Jim Crow, and the Democrats embracing the tradition of Abraham Lincoln,” he wrote.
[289] The following citation makes similar claims:
[290] Commentary: “Whitewash.” By Frank Rich. New York Magazine, May 5, 2013. <nymag.com>
“Strom Thurmond, whose primacy in the GOP’s racial realignment is the most incriminating truth the right keeps trying to cover up.”
[291] Editorial: “Conservatives, Race and Denial: ‘Unrequited Love’ Edition.” By Francis Wilkinson. Bloomberg, December 8, 2013. <www.bloomberg.com>
Perhaps the most eloquent response is found in Friday’s Wall Street Journal, which seems to have inadvertently stumbled into the argument. Like a drunk walking home with a lantern, the paper’s review of Timothy N. Thurber’s new book, “Republicans and Race,” is enlightening if you can follow the staggered trail of logic.
The headline nicely sums up the review by Lee Edwards: “A Love Unrequited.” The love in question is that of the Republican Party for black Americans, who have incomprehensibly spurned the Republicans’ warm embrace. A more apt title might be: “A Concise History of Conservative Self-Delusion.”
Here is Edwards’s remarkable take on the 1960s: “During this period, African-Americans, long denied the most basic rights, demanded that Republicans act decisively on a variety of fronts, including civil rights, voting rights and economic rights. When Republicans didn’t respond to blacks’ satisfaction, they were called racists, although the real racists were almost exclusively Southern Democrats.”
Yowza.
Casting of guilt onto racist Southern Democrats without acknowledging that approximately 100 percent of racist Southern Democrats switched parties to become Republicans between 1960 and 1980? Check.
[292] Webpage: “Roll Call Tally on Civil Rights Act 1964, June 19, 1964.” U.S. National Archives. <www.archives.gov>
Nays
1) Byrd, Va.
2) Byrd, W. Va.
3) Cotton
4) Eastland
5) Ellender
6) Ervin
7) Fulbright
8) Goldwater
9) Gore
10) Hickenlooper
11) Hill
12) Holland
13) Johnston
14) Jordan, N.C.
15) Long, La.
16) McClellan
17) Mechem
18) Robertson
19) Russel
20) Simpson
21) Smathers
22) Sparkman
23) Stennis
24) Talmadge
25) Thurmond
26) Tower
27) Walters
[293] Biographical Directory of the United States Congress.” Accessed August 13, 2016 at <www.govinfo.gov>
1) Harry F. Byrd [D]
2) Robert Carlyle Byrd [D]
3) Cotton, Norris H. [R]
4) James O. Eastland [D]
5) Allen J. Ellender [D]
6) Sam J. Ervin Jr. [D]
7) J. W. Fulbright [D]
8) Barry Goldwater [R]
9) Albert Arnold Gore [D]
10) Hickenlooper [R]
11) Lister Hill [D]
12) Spessard L. Holland [D]
13) Olin D. Johnston [D]
14) Benjamin Everett Jordan [D]
15) Russell B. Long [D]
16) John L. McClellan [D]
17) Edwin Leard Mechem [R]
18) A. Willis Robertson [D]
19) Richard B. Russell [D]
20) Milward Lee Simpson [R]
21) George A. Smathers [D]
22) John Sparkman [D]
23) John Stennis [D]
24) Herman Eugene Talmadge [D]
25) Strom Thurmond [D to R]
26) John Goodwin Tower [R]
27) Herbert Sanford Walters [D]
NOTE: A spreadsheet detailing offices held, years of service, and party affiliations for each of these individuals is available here.
[294] Article: “Wallace, George C.” Encyclopædia Britannica Ultimate Reference Suite 2004.
… U.S. Democratic Party politician and four-time governor of Alabama who led the South’s fight against federally ordered racial integration in the 1960s. …
Wallace won the governorship of Alabama in 1962 on a platform emphasizing segregation and economic issues. Within his first year in office he kept his pledge “to stand in the schoolhouse door” by blocking the enrollment of black students at the University of Alabama (June 1963). Declaring that the federal government was usurping state authority in the field of education, he yielded only in the face of the federalized National Guard. Further confrontations at Tuskegee, Birmingham, Huntsville, and Mobile made him a nationwide symbol of intransigence toward racial integration in the schools. …
[In 1968] Wallace was a vigorous but unsuccessful third-party candidate for the U.S. presidency, winning 13 percent of the vote and five Southern states as the nominee of the anti-liberal American Independent Party. …
Wallace won Alabama’s governorship again in 1970, but in 1972, while campaigning for the Democratic presidential nomination, he was wounded and left permanently paralyzed below the waist in an assassination attempt…. He was reelected to the governorship in 1974, and he again campaigned for the Democratic presidential nomination in 1976. In the 1980s Wallace renounced his segregationist ideology and sought reconciliation with civil rights leaders. In 1982 he sought anew term as governor and won the election with substantial support from black voters.
[295] Commentary: “MSNBC: George Wallace a … Republican?” By Ian Tuttle. National Review, June 12, 2013. <www.nationalreview.com>
Noting the 50-year anniversary of Wallace’s infamous “Stand in the Schoolhouse Door,” in which the governor physically blocked two black students from entering the University of Alabama in Tuscaloosa, MSNBC’s All In with Chris Hayes showed a photo of Wallace—identifying him as “(R) Alabama.”
NOTE: The commentary shows the actual photo displayed by MSNBC.
[296] Transcript: “This Week: Live from Philadelphia Democratic National Convention.” ABC News, July 24, 2016. <abcnews.go.com>
Rep. Keith Ellison (D), Minnesota:
Well, I’m with Bernie on this. I mean, we’re focused on getting rid of Donald Trump, making sure he is not the president of the United States.
I agree with Bernie, I’m disappointed to read about it, but at the same time, we do have the worst Republican nominee since George Wallace. We have somebody who is so dangerous, in a number of ways, not the least of which is his attacks on the press, in his pulling press credentials.
[297] Article: “Eugene ‘Bull’ Connor.” By James L. Baggett. Encyclopedia Of Alabama, March 9, 2007. Last updated 8/15/12. <www.encyclopediaofalabama.org>
In 1934, Connor entered the Democratic primary race for a seat in the Alabama House of Representatives. …
Connor served as a delegate to five Democratic National Conventions (1948, 1956, 1960, 1964, and 1968). …
… While apparently not a member of the Ku Klux Klan, Connor protected Klansmen who committed racial violence, including bombings. In 1961, he ordered Birmingham police to stay away from the Trailways bus station while Klansmen attacked the Freedom Riders, a group of civil rights activists who were touring the South to protest segregation. This attack, combined with his closing of city parks to prevent desegregation, the threatened closing of city schools, and Birmingham’s worsening reputation in the national media, turned the local business community and a majority of the white electorate against Connor. …
During this time, Rev. Martin Luther King Jr., in cooperation with local civil rights leaders, led demonstrations in Birmingham against racial segregation. Connor ordered Birmingham police officers and firemen to use dogs and high-pressure water hoses against demonstrators. Images of the resulting mayhem appeared on television and in newspapers throughout the country and helped to shift public opinion in favor of national civil-rights legislation. Images of the demonstrations are still regularly broadcast and published and have helped cement Connor and Birmingham as symbols of racial intolerance.
[298] Article: “Letitia James Compares Rob Astorino to Bull Connor.” By Will Bredderman. Observer, October 10, 2014. <observer.com>
Public Advocate Letitia James today compared Republican gubernatorial candidate Rob Astorino to Bull Connor, the segregationist public safety commissioner from Birmingham who loosed attack dogs and turned firehoses on black civil rights demonstrators in the early 1960s.
Speaking at a Women’s Equality Party rally with Gov. Andrew Cuomo and host of African-American elected officials from central Brooklyn, Ms. James–who appeared in an advertisement for the rival Working Families Party earlier this week–cast the Westchester County executive, whom she repeatedly incorrectly referred to as “Rick Astorino,” as an ultra-conservative bigot.
“We have a far-right Republican, someone who reminds me of Bull Connor in the 1960s. He’s anti-choice, anti-LGBT, anti-women’s equality, anti-progress,” said Ms. James, urging the largely black crowd to boo.
[299] Article: “Georgia [State, U.S.].” By Jonathan M. Bryant and Susan K. Langley. World Book Encyclopedia, 2007 Deluxe edition.
Integration also took place in other areas of Georgia life, including libraries and restaurants. Some white people in Georgia resisted the change. In 1964, for example, Lester G. Maddox closed his Atlanta restaurant rather than obey a federal court order to serve blacks.
In 1966, Maddox, a Democrat, became a candidate for governor. None of the candidates received 50 percent of the votes, and Georgia law provided that the state legislature choose a winner. The legislature elected Maddox governor in January 1967.
[300] Article: “Lester Maddox (?-GA), Nets Refuse to ID Party of Segregationist.” Media Research Center, June 26, 2003. <archive2.mrc.org>
The media had no reticence last year about making sure their readers and viewers understood that the Trent Lott who belonged to a racially-discriminatory fraternity was part of the Southern rise of the Republican Party, but in announcing the Wednesday passing away of former Georgia Governor Lester Maddox, the racist, segregationist who led the state in the late 1960s, the networks refused to inform their viewers that he was a Democrat. …
ABC and CNBC even ran full stories which consumed more than two minutes each, yet neither ABC’s Peter Jennings or CNBC’s Don Teague found Maddox’s party affiliation worth mentioning even though both noted how in 1966, as Jennings recalled, “no candidate had a majority, and the state legislature chose Maddox.” …
– ABC’s Good Morning America, June 25….
– CNN’s American Morning. Daryn Kagan announced, as transcribed by the MRC’s Ken Shepherd….
– FNC’s Lauren Green at 9:30am EDT….
– NBC’s Today….
CNN at 4pm EDT, Judy Woodruff just before Inside Politics….
– CBS Evening News. Dan Rather intoned: “Former Georgia Governor Lester Maddox died today at the age of 87. Maddox first made national headlines in 1964 as a hardline segregationist. He closed and sold his restaurant rather than obey federal civil rights laws and serve black customers. After becoming Governor in 1976, Maddox named some African-Americans to some state jobs.”
– CNBC’s The News with Brian Williams….
– NBC Nightly News….
– ABC’s World News Tonight ended with a full story narrated by Peter Jennings, complete with vintage black and white video of Jennings reporting on Maddox, but Jennings refused to mention Maddox’s affiliation with the political party which imposed and enforced segregation for a century.
[301] Article: “Orval Eugene Faubus (1910–1994).” By Roy Reed. Encyclopedia of Arkansas. Last updated September 22, 2011. <www.encyclopediaofarkansas.net>
His record was in many ways progressive, but he is most widely remembered for his attempt to block the desegregation of Little Rock’s Central High School in 1957. …
Pragmatism and ambition drove him toward the Democratic Party as Roosevelt’s New Deal took hold. … He remained a politician for the rest of his life. …
Faubus lost the battle with Eisenhower, but his actions ensured his election as governor four more times. He left office undefeated in 1967 after knocking off one opponent after another….
He tried unsuccessfully three times—in 1970, 1974, and 1986—to recapture the governor’s office. However, a new generation of voters and leaders had moved into place.
[302] Book: The American Constitution: Its Origins and Development (3rd edition). By Alfred H. Kelly and Winfred A. Harbison. W. W. Norton & Company, 1963.
Page 938:
A conference between Faubus and the President failed to produce any result, and Attorney General Herbert Brownell, Jr., acting on the president’s instructions, sought and obtained an injunction against Faubus, ordering him and the officers of the National Guard to cease forthwith from blocking enforcement of the federal court integration orders. The Governor thereupon withdrew the National Guard. However when Negro students again attempted to enter the high school they were prevented from doing so by a large and ugly-tempered mop.
Accordingly, the President on September 25 dispatched several companies of the United States Army to Little Rock, in effect putting the city under martial law.
[303] Article: “Orval Faubus, Segregation’s Champion, Dies at 84.” By Peter Applebome. New York Times, December 15, 1994. <www.nytimes.com>
Former Gov. Orval E. Faubus of Arkansas, whose defiance of a Federal desegregation order in 1957 led to a school crisis in Little Rock and set the tone for the South’s white resistance to integration, died yesterday at his home in Conway, Ark. He was 84. …
As Governor, Mr. Faubus was regarded as a moderate with little interest in race, less a defining issue in Arkansas than in other Southern states. Early in his term, Arkansas desegregated buses and public transportation. He brought blacks into the ruling circles of the Democratic Party and looked on as some measure of school integration began to take place. Early in 1957, he passed a debated tax increase to raise teachers’ pay, and faced a challenge on the right from a segregationist, Jim Johnson.
[304] Article: “The Civil Rights Realignment: How Race Dominates Presidential Elections.” By Timothy J. Hoffman (Seton Hall University). Political Analysis, May 2015. <scholarship.shu.edu>
Page 10:
After a failed bid for the White House in 1960, Nixon won in 1968 with 301 electoral votes, beating Democrat Hubert Humphrey, and third-party candidate, George Wallace from the American Independent Party (Government Printing Office 1969). Nixon sought votes by expanding upon Barry Goldwater’s “Operation Dixie” to galvanize the support of old segregationist Southern Democrats through his “Southern Strategy” (Greenberg 2000). … Despite Wallace’s supremacy in the South, Nixon’s Southern Strategy paid long-term dividends for Nixon and the Republican Party. The Southern Strategy used states’ rights and other racially tinged appeals to court white conservative voters and exploited dissatisfaction with Johnson’s liberal racial and economic policies.
[305] Book review: “The Myth of ‘the Southern Strategy.’ ” By Clay Risen. New York Times, December 10, 2006. <www.nytimes.com>
Everyone knows that race has long played a decisive role in Southern electoral politics. From the end of Reconstruction until the beginning of the civil rights era, the story goes, the national Democratic Party made room for segregationist members—and as a result dominated the South. But in the 50s and 60s, Democrats embraced the civil rights movement, costing them the white Southern vote. Meanwhile, the Republican Party successfully wooed disaffected white racists with a “Southern strategy” that championed “states’ rights.”
It’s an easy story to believe, but this year two political scientists called it into question.
[306] Commentary: “GOP to Be Reckoned with in South.” By Richard M. Nixon. Washington Post, May 8, 1966. Page E3.
The Republican opportunity in the South is a golden one; but Republicans must not go prospecting for the fool’s gold of racist votes. Southern Republicans must not climb aboard the sinking ship of racial injustice. They should let Southern Democrats sink with it, as they have sailed with it.
Any Republican victory that would come of courting racists, black or white, would be a defeat for our future in the South, and our party in the Nation. It would be a battle won in a lost cause.
The Democratic Party in the South has ridden to power for a century on an annual tide of racist oratory. The Democratic Party runs with the hounds in the North and the hares in the South.
The Republicans, as the South’s party of the future, should reject this hypocritical policy of the past. On this issue, it is time for both Republicans and Democrats to stop talking of what is smart politically and start talking of what is right morally.
A short time ago, in a demagogic appeal to segregationist sympathies, Alabama Democrat Lister Hill proclaimed, “If it hadn’t been for Republicans we would have still been talking. If the Republican members had voted with the South, none of that (civil rights) legislation would have been passed.”
Sen. Hill is correct. Republicans should adhere to the principles of the party of Lincoln. They should leave it to the George Wallaces and the Lister Hills to squeeze the last ounces of political juice from the rotting fruit of racial injustice.
But respect for human rights means respect for the laws which protect those rights. The racial problems which will confront the South in the years ahead must be settled in the courts—not decided in the streets.
[307] Book: The American Constitution: Its Origins and Development (3rd edition). By Alfred H. Kelly & Winfred A. Harbison. W. W. Norton & Company, 1963.
Page 953: “Republican party platforms of 1952 in 1956 were strong and unequivocal in the demand for comprehensive civil rights legislation, while Vice President Richard Nixon was an avowed member of the NAACP [National Association for the Advancement of Colored People].”
[308] Article: “NAACP Seeks More Anti-Bias.” Jet, March 10, 1960. Pages 44–45. <books.google.com>
Pages 44–45:
Steps to insure compliance with anti-bias clauses in government contracts were ordered by Vice-President Richard M. Nixon, chairman of the President’s Committee on Government Contracts, on the eve of a meeting with NAACP [National Association for the Advancement of Colored People] executive secretary Roy Wilkins and labor secretary Herbert Hill. Unleashing a double barreled attack on labor union bias last week, the NAACP executives appealed to Mr. Nixon to end discrimination against Negro workers on all levels from sharecroppers to skilled tradesmen.
[309] Paper: “United States v. City of Chicago: Impact Standard Applicable to State and Local Governments Under Title VII.” By Lydia C. Taylor and Francis C. Bagbey. William & Mary Law Review, 1978. Pages 357–392. <scholarship.law.wm.edu>
Pages 357–358:
Title VII of the Civil Rights Act of 19641 prohibits employment practices that discriminate because of race, color, religion, sex, or national origin.2 As originally enacted, Title VII exempted state and local governments from the provisions of the Act.3 The United States Commission on Civil Rights, finding that state and local government employment was characterized by many discriminatory procedures, criticized the denial of this federal remedy to employees of those governments.4 Congress recognized the anomaly of extending discriminatory practices while denying assistance to similarly aggrieved public employees5 and responded by adopting the Equal Employment Opportunity Act of 1972,6 thereby amending Title VII to include state and local government employees.7 …
3 Section 2000e(b)(1) reads in pertinent part: “The term ‘employer’ means a person engaged in an industry affecting commerce … but such term does not include (1) … a State or political subdivision thereof….”
4 United States Commission on Civil Rights, For All the People … By All the People 121 (1969) [hereinafter cited as For All the People]. The Commission found that “[m]inority group members are denied equal access to State and local government jobs.” Id. at 118. This exclusion is accomplished, the Commission explained, “by overt discrimination in personnel actions and hiring decisions, a lack of positive action by governments to redress the consequences of past discrimination, and discriminatory and biased treatment on the job.” Id. at 119. Particularly relevant to the subject of this Comment, the Commission suggested that the “[b]arriers to equal employment are greater in police and fire departments than in any other area of State and local government.” Id. Concluding that enforcement of the fourteenth amendment’s prohibition against discriminatory state action had been sporadic and burdensome, the Commission recommended eliminating the exemption of state and local governments from the coverage of Title VII. Id. at 128.
5 The report accompanying the Senate bill, S. 2515, containing a provision expanding the jurisdiction of the Civil Rights Act of 1964 to include state and local governments, interpreted the findings of For All the People, supra note 4, to indicate that “employment discrimination in State and local governments is more pervasive than in the private sector.” Senate Report No. 415, 92d Cong., 1st Sess. 10 (1971) [hereinafter cited as S. Rep. No. 415]. The report accompanying the analogous House bill, H.R. 1746, emphasized the injustice of withholding federal remedies from the victims of constitutionally prohibited discrimination because of their peculiar employment status. House of Representatives Report No. 238, 92d Cong., 1st Sess. 17–19 [hereinafter cited as H.R. Rep. No. 238], reprinted in [1972] U.S. Code Cong. & Ad. News 2137, 2152–54 [hereinafter cited as Ad. News].
6 Pub. L. No. 92-261, 86 Stat. 103 (amending 42 U.S.C. § 2000e (1970) [hereinafter cited as the 1972 amendments].
For discussion and analysis of the Equal Employment Opportunity Act of 1972 and its legislative history, see Sape and Hart, Title VII Reconsidered: The Equal Employment Opportunity Act of 1972, 40 George Washington law Review 824 (1972).
7 The definition of “person” found in § 2000e(a) of the Civil Rights Act of 1964 was amended to include “governments, governmental agencies, [and] political subdivisions.” 42 U.S.C. § 2000e(a) (Supp. V 1975). Section 2000e(b), defining “employer” was amended to include persons employing fifteen or more employees, and the “State or political subdivision thereof” exemption was deleted. Id. § 2000e(b).
One commentator has described the expansion of Title VII to state and local government employees as “the most significant change in the scope of the Act.” Mitchell, An Advocate’s View of the 1972 Amendments to Title VII, 5 Columbia Human Rights Law Review 311, 322 (1973).
[310] Public Law 92-261: “Equal Employment Opportunity Act of 1972.” 92nd U.S. Congress. Signed into law by Richard Nixon on March 24,1972. <www.govinfo.gov>
[311] Statement: “Signing the Equal Employment Opportunity Act of 1972.” By Richard Nixon, March 25, 1972. <www.presidency.ucsb.edu>
I am gratified to have signed into law H.R. 1746, the Equal Employment Opportunity Act of 1972.
By strengthening and expanding the Government’s powers against discrimination in employment, this legislation is an important step toward true equality on the job front. Where promises have sometimes failed, we may now expect results. …
Under this legislation, the Equal Employment Opportunity Commission and the Justice Department will now be able to make substantial advances against employment discrimination.
The most significant aspect of this legislation is a new authority consistently advocated by this Administration since 1969—a provision arming the Equal Employment Opportunity Commission with power to bring lawsuits in the Federal district courts to enforce the rights guaranteed by Title VII of the Civil Rights Act of 1964. Such actions arc to be expedited by the courts whenever possible.
Everyone familiar with the operation of Title VII over the past 7 years has realized that the promise of that historic legislation would remain unfulfilled until some additional, broad-based enforcement machinery was created. This bill provides that enforcement capability.
Additionally, the legislation extends the protections of Title VII to millions of American citizens previously excluded from its coverage. The experiences of both the Justice Department and the EEOC [U.S. Equal Employment Opportunity Commission] under Title VII have demonstrated that considerable discrimination problems have existed in State and local governments, with small employers, and in some educational institutions. Individuals employed in these areas have not heretofore been protected by Title VII. This bill corrects that defect. …
One of the basic principles of our way of life in America has always been that individuals would be free to pursue the work of their own choice, and to advance in that work, subject only to considerations of their individual qualifications, talents, and energies.
This bill, addressing specific needs in concrete and practical ways, is bound to make a real difference in the lives of great numbers of minority Americans. It thus is another step toward writing our best principles into the day-to-day realities of our economic system.
[312] Article: “The Civil Rights Realignment: How Race Dominates Presidential Elections.” By Timothy J. Hoffman (Seton Hall University). Political Analysis, May 2015. <scholarship.shu.edu>
Page 10:
After a failed bid for the White House in 1960, Nixon won in 1968 with 301 electoral votes, beating Democrat Hubert Humphrey, and third-party candidate, George Wallace from the American Independent Party (Government Printing Office 1969). Nixon sought votes by expanding upon Barry Goldwater’s “Operation Dixie” to galvanize the support of old segregationist Southern Democrats through his “Southern Strategy” (Greenberg 2000). … Despite Wallace’s supremacy in the South, Nixon’s Southern Strategy paid long-term dividends for Nixon and the Republican Party. The Southern Strategy used states’ rights and other racially tinged appeals to court white conservative voters and exploited dissatisfaction with Johnson’s liberal racial and economic policies.
[313] The following citation makes similar claims:
[314] Commentary: “The Republican Party’s Race Problem and Strom Thurmond’s Legacy.” By Jordan Michael Smith. Daily Beast, September 22, 2012. <www.thedailybeast.com>
“The plan was to attract Americans to the GOP by opposing busing and desegregating schools, advocating states’ rights and prioritizing law and order.”
[315] Commentary: “GOP to Be Reckoned With in South.” By Richard M. Nixon. Washington Post, May 8, 1966. Page E3.
Another foundation of the party of the future in the South is a new concept of states rights. Republicans reject the old concept that belongs to the party of the past.
Southern Democrats have used states rights as instruments of reaction; Republicans support states rights as instruments of progress. Southern Democrats insisted on states rights so that they might avoid state obligations; Republicans support states rights because they want the states, rather than the Federal Government, to assume responsibilities—in education, transportation, health and human welfare.
The best answer to bigger government in Washington is better government in the states. As a positive step toward this goal, Republicans are introducing legislation remitting to the states a fixed percentage of Federal income tax collections. This will provide the states with the means to deal with their own problems in their own way—without Federal domination and control.
[316] Commentary: “The Republican Party’s Race Problem and Strom Thurmond’s Legacy.” By Jordan Michael Smith. Daily Beast, September 22, 2012. <www.thedailybeast.com>
It was not until the mid-1960s that the South turned from blue to red. In 1964 and ’65, Democratic President Lyndon Johnson introduced and signed the strongest civil-rights bills yet enacted by Congress. The 1964 Republican presidential nominee, Barry Goldwater, voted against the laws and took up the mantle of “states’ rights.” Again the standard-bearer was Thurmond, who campaigned hard for the conservative icon. Republicans won South Carolina and four other Southern states, the best showing in the South for the party since reconstruction.
Goldwater lost badly, but Richard Nixon pioneered the “Southern strategy,” which Crespino persuasively argues is misnamed because it was designed to appeal to the prejudices of both Southerners and a newly conservative Sun Belt. The plan was to attract Americans to the GOP by opposing busing and desegregating schools, advocating states’ rights and prioritizing law and order. … The strategy worked brilliantly. Today Democrats cannot hope to compete in the South, which is now as solidly Republican as it was once Democratic.
[317] Calculated with the dataset: “Uniform Crime Reports, Murder and Nonnegligent Manslaughter, 1960–2012.” U.S. Department of Justice. Accessed July 26, 2012 at <www.ucrdatatool.gov>
NOTE: An Excel file containing the data and calculations is available upon request.
[318] Article: “United States, Social Services.” Encyclopædia Britannica Ultimate Reference Suite 2004.
“In Swann v. Charlotte-Mecklenburg County (North Carolina) Board of Education (1971), the Supreme Court mandated busing to achieve racially integrated schools, a remedy that often required long commutes for African American children living in largely segregated enclaves.”
[319] Book: Education and Learning in America. By Catherine Reef. Facts on File, 2009.
Page 238: “Busing proved to be unpopular as well with black parents, who often objected to the long rides their children had to take and the fact that it was hard for their children to see friends or participate in extracurricular activities when they lived far away from their schools.”
[320] Book: The Judiciary: The Supreme Court in the Governmental Process (10th edition). By Henry J. Abraham. New York University Press, 1996.
Page 217:
A series of cases came up, headed by one for the Charlotte-Mecklenburg, North Carolina, Metropolitan School District, in which a group of parents contended that the “color-blind” ruling of the Supreme Court in the Brown case meant that assignments of students would have to be made on just such a “color-blind” basis, and that, accordingly, busing to achieve integration was patently unconstitutional. In April 1971, speaking for his unanimous Court, Chief Justice Burger—in what must have surprised not only a large segment of the country but, specifically, the land’s most highly placed opponent to busing, President Nixon58 —specifically upheld not only busing but also racial quotas, pairing or grouping of schools, and gerrymandering of attendance zones as well as other devices designed to “remove all vestiges of state imposed segregation…. Desegregation plans cannot be limited to the walk-in school,” he declared.59 The Court’s controversial decision stopped short of ordering the elimination of all-black schools or of requiring racial balance in the schools. (And, at that point, it made clear that the instant decision did not apply to Northern-style de facto segregation, based on neighborhood patterns.)60 But it said that the existence of all-black schools created a presumption of discrimination and held that federal district judges—to whom it gave enormously broad discretion—may indeed use racial quotas61 as a guide in fashioning desegregation decrees. …
… The latter decisions, however, went further by ordering cross-district busing between the core city (usually heavily black) and the surrounding suburbs (almost always predominantly white). Thus, in 1972 Judge Robert R. Merhige, Jr.—in a 325-page opinion (!)—had ordered the merger of the public schools in the City of Richmond, Virginia (then with a black school enrollment of 70 percent) with those of suburban Chesterfield and Henrico counties (almost 91 percent white).66 The uproar caused by that decision was matched only by a similar one handed down for the Detroit area.
[321] Article: “Busing of Pupils Sways Votes in Town Election.” By Fred Ferretti. New York Times, May 14, 1972. <www.nytimes.com>
“Montclair’s busing program, devised by its new Superintendent of Schools, James Adams, divides the town’s elementary schools into three general clusters. In kindergarten through the fourth grade, children will be bused one year out of those five school years; then, beginning with the fifth grade, students will attend three middle schools. Some will be bused.”
[322] Book: The Changing American Mind: How and Why American Public Opinion Changed Between 1960 and 1998. By William G. Mayer. University of Michigan Press, 1993.
Page 369:
Table 3.5: Trends in Public Attitudes about Governmental Actions to Prohibit Racial Discrimination
1. NORC [National Opinion Research Center]: “Do you think white students and Negro/black students should go to the same schools or to separate schools?”
Whites Only … Feb.–Apr. 1972 … Same [=] 85% … Separate [=] 14% … Don’t Know [=] 2% …
Blacks only … Feb.–Apr. 1972 … Same [=] 92% … Separate [=] 4% … Don’t Know [=] 4% …
Page 372:
Table 3.6: Trends in Public Attitudes toward Busing and Affirmative Action
1a. AIPO [American Institute of Public Opinion]: “Have you heard or read about the busing of Negro and white school children from one school district to another? [If Yes] In general, do you favor or oppose the busing of Negro and white school children from one school district to another?” …
Oct. 1971 … Favor [=] 16% … Oppose [=] 74% … Don’t Know [=] 6% … Haven’t Heard [=] 4%
[323] Webpage: “Timeline Of Polling History: Events That Shaped the United States, and the World.” Gallup. Accessed August 17, 2016 at <www.gallup.com>
“1970 Busing and School Integration. Widespread court-ordered busing to achieve school integration draws numerous protests, with 86% opposing busing from one school district to another.”
[324] Report: “Busing Reappraisal.” Congressional Quarterly, December 26, 1975. <library.cqpress.com>
Busing, it is said, destroys neighborhood schools, forces youngsters to travel long distances to hostile environments, places them in uncomfortable and dangerous situations where learning is virtually impossible, removes parental control over their education and discriminates against the urban poor.
… Many of the people who once supported busing as educationally and socially beneficial to both races are questioning or even forsaking it as a remedy.
For the 1976 presidential contenders, outright advocacy of busing for desegregation is considered political suicide. Public-opinion polls indicate that the vast majority of Americans strongly oppose such busing. In a recent national survey, the Gallup organization found that only 18 per cent of those interviewed favored busing. Whites rejected it by a margin of 75 to 15 per cent and blacks by 47 to 40 per cent. Seventy-two per cent of those contacted said they would support a constitutional amendment to prohibit it.
[325] Article: “How Racism Explains Republicans’ Rise in the South.” By Max Ehrenfreund. Washington Post, November 24, 2015. <www.washingtonpost.com>
At the end of the World War II, nearly 80 percent of white Southerners were Democrats, compared to 40 percent of whites in the rest of the country. By the Reagan administration, white Southerners were no more likely to identify as Democrats than whites elsewhere. Today, the white vote in the South is almost solidly Republican.
The Question of Race
For decades, Gallup has been asking Americans whether they would consider voting for a black presidential candidate. White Southerners who said they would were no less likely to call themselves Democrats after the spring of 1963 than before. But many of those who said they wouldn’t vote for a black candidate left the party.
NOTE: The statements above provide an uncritical report of the draft paper shown in the footnote below.
[326] Draft paper: “Why did the Democrats Lose the South? Using New Data to Resolve an Old Debate.” By Ilyana Kuziemko and Ebonya Washington. New York University, Wilf Family Department of Politics, February 27, 2015 <docplayer.net>
Page 1:
After nearly a century of loyalty and despite the general stability of Americans party identification in adulthood, Southern whites left the Democratic party en masse in the second half of the twentieth century.1 As illustrated in Figure 1, at mid-century white Southerners were 25 percentage points more likely to identify as Democrats than were other whites, a gap that disappeared by the mid 1980s and has since flipped in sign.2 Despite the massive, concurrent enfranchisement of Southern blacks, who overwhelmingly favored the Democrats from 1964 onward, the resulting shifts in aggregate Southern political outcomes were stark: to take but one example, in 1960, all U.S. senators from the South were Democrats, whereas today all are Republican.
This paper explores why this shift occurred, and in particular quantifies the role of racial attitudes among Southern whites. We suspect that many readers are presently questioning the need to read further, given the strong presumption that racially conservative Southerners reaction to the Democratic Party’s Civil Rights initiatives of the 1960s explains most if not all of this shift.
NOTES:

Page 4:
We find that … racial attitudes explain the entire white Southern shift away from the Democrats. That Southern white political preferences are dominated by racial attitudes helps explain how the poorest part of the country now serves as the base for the anti-redistributive political party.6
6 A recent policy manifestation of this pattern is the refusal of almost all Southern states to expand Medicaid coverage to poor adults under the Affordable Care Act.
[327] The following two citations make similar claims:
[328] Commentary: “Impossible, Ridiculous, Repugnant.” By Bob Herbert. New York Times, October 6, 2005. <query.nytimes.com>
The truth is that there was very little that was subconscious about the G.O.P.’s relentless appeal to racist whites. Tired of losing elections, it saw an opportunity to renew itself by opening its arms wide to white voters who could never forgive the Democratic Party for its support of civil rights and voting rights for blacks.
The payoff has been huge. Just as the Democratic Party would have been crippled in the old days without the support of the segregationist South, today’s Republicans would have only a fraction of their current political power without the near-solid support of voters who are hostile to blacks.
[329] Book review: “The Myth of ‘the Southern Strategy.’ ” By Clay Risen. New York Times, December 10, 2006. <www.nytimes.com>
Everyone knows that race has long played a decisive role in Southern electoral politics. From the end of Reconstruction until the beginning of the civil rights era, the story goes, the national Democratic Party made room for segregationist members—and as a result dominated the South. But in the 50s and 60s, Democrats embraced the civil rights movement, costing them the white Southern vote. Meanwhile, the Republican Party successfully wooed disaffected white racists with a “Southern strategy” that championed “states’ rights.”
It’s an easy story to believe, but this year two political scientists called it into question.
[330] a) Dataset: “Gallup ‘Black President’ Question by Race, Political Party Preference, and Census Region, 1958, 1999, 2012, 2015.” Compiled for Just Facts by the Roper Center for Public Opinion Research at Cornell University, September 15, 2016. <ropercenter.cornell.edu>
1958 … White … South [=] 8% … [Sample Size =] 327 …
1999 … White … South [=] 95% … [Sample Size =] 237 …
b) Dataset: “Gallup ‘Black President’ Question by Race, Political Party Preference, and Census Region, 1969, 1978, 1987.” Compiled by the Roper Center for Public Opinion Research at Cornell University, October 14, 2016. <ropercenter.cornell.edu>
1969 … White … South [=] 45% … [Sample Size =] 385 (Unweighted), 890 (Weighted) …
1978 … White … South [=] 62% … [Sample Size =] 337 (Unweighted), 642 (Weighted) …
1987 … White … South [=] 67% … [Sample Size =] 400 (Unweighted), 716 (Weighted)
NOTE: The polling data is posted here.
[331] Report: “June Wave 1 Final Topline.” By Jeff Jones and Lydia Saad. Gallup, June 2–7, 2015. <www.gallup.com>
Page 2 (of PDF):
(Asked of a half sample [in 2015]) Between now and the 2016 political conventions, there will be discussion about the qualifications of presidential candidates—their education, age, religion, race, and so on. If your party nominated a generally well-qualified person for president who happened to be [ITEMS A-K READ IN ORDER], would you vote for that person?
Page 4 (of PDF):
C. Black
2015 Jun 2–7
2012 Jun 7–10 …
1999 Feb 19–21 …
1958 Jul 30–Aug 4 ^ …
^ WORDING: “…if your party nominated a generally well-qualified man for president and he happened to be a Negro, would you vote for him?”
[332] Book: The End of Southern Exceptionalism: Class, Race, and Partisan Change in the Postwar South. By Byron E. Shafer and Richard Johnston. Harvard University Press, 2006.
Table 2.1. Social Class and the Coming of Southern Republicanism: The House …
Table 2.1A does contain what will prove to be the overall story of partisan change among Southern whites during all the postwar years. Yet its aggregation still very much masks the extent of the change, even in just this one institution, because it still includes many who could not vote Republican for the House of Representatives because they had no Republican candidate. Accordingly, the analysis should really be restricted to white Southerners who possessed both a Democratic and a Republican congressional alternative. When this restriction is imposed, the same patterns recur, writ larger still. …
Table 2.3. Social Class and the Coming of Southern Republicanism: The Presidency …
Yet despite clear differences in their electoral districting, the Senate and the House often behaved in highly parallel ways…. If we compare the mean Republican vote in contested districts across the postwar years, the two bodies are effectively indistinguishable (Figure 2.1A). …
In the 1950 election, for example, the one before Dwight Eisenhower energized a Republican presidential vote in the South, his party could manage no House challengers at all in Arkansas, Georgia, Louisiana, and South Carolina. That was the situation in the old South.
NOTE: The sample sizes for the data points in these tables range from 59 to 423. This equates to a margin of error of ±13% to ±5% with a 95% level of confidence. The average sample size is 208, which equates to a margin of error of ± 7%. [“Margin of Error Calculator.” ComRes, 2017. Accessed August 13, 2016 at <comresglobal.com>]
[333] Book: The End of Southern Exceptionalism: Class, Race, and Partisan Change in the Postwar South. By Byron E. Shafer and Richard Johnston. Harvard University Press, 2006.
Table 2.1. Social Class and the Coming of Southern Republicanism: The House …
Table 2.1A does contain what will prove to be the overall story of partisan change among Southern whites during all the postwar years. Yet its aggregation still very much masks the extent of the change, even in just this one institution, because it still includes many who could not vote Republican for the House of Representatives because they had no Republican candidate. Accordingly, the analysis should really be restricted to white Southerners who possessed both a Democratic and a Republican congressional alternative. When this restriction is imposed, the same patterns recur, writ larger still. …
Table 2.3. Social Class and the Coming of Southern Republicanism: The Presidency …
Yet despite clear differences in their electoral districting, the Senate and the House often behaved in highly parallel ways…. If we compare the mean Republican vote in contested districts across the postwar years, the two bodies are effectively indistinguishable (Figure 2.1A). …
In the 1950 election, for example, the one before Dwight Eisenhower energized a Republican presidential vote in the South, his party could manage no House challengers at all in Arkansas, Georgia, Louisiana, and South Carolina. That was the situation in the old South.
NOTE: The sample sizes for the data points in these tables range from 59 to 423. This equates to a margin of error of ±13% to ±5% with a 95% level of confidence. The average sample size is 208, which equates to a margin of error of ± 7%. [“Margin of Error Calculator.” ComRes, 2017. Accessed August 13, 2016 at <comresglobal.com>]
[334] Constructed with data from:
a) Dataset: “Gallup ‘Black President’ Question by Race, Political Party Preference, and Census Region, 1958, 1999, 2012, 2015.” Compiled for Just Facts by the Roper Center for Public Opinion Research at Cornell University, September 15, 2016. <ropercenter.cornell.edu>
1958 … White … South [=] 8% … [Sample Size =] 327 …
1999 … White … South [=] 95% … [Sample Size =] 237 …
b) Dataset: “Gallup ‘Black President’ Question by Race, Political Party Preference, and Census Region, 1969, 1978, 1987.” Compiled by the Roper Center for Public Opinion Research at Cornell University, October 14, 2016. <ropercenter.cornell.edu>
1969 … White … South [=] 45% … [Sample Size =] 385 (Unweighted), 890 (Weighted) …
1978 … White … South [=] 62% … [Sample Size =] 337 (Unweighted), 642 (Weighted) …
1987 … White … South [=] 67% … [Sample Size =] 400 (Unweighted), 716 (Weighted) …
NOTE: The polling data is posted here.
[335] Report: “June Wave 1 Final Topline.” By Jeff Jones and Lydia Saad. Gallup, June 2–7, 2015. <www.gallup.com>
Page 2 (of PDF):
(Asked of a half sample [in 2015]) Between now and the 2016 political conventions, there will be discussion about the qualifications of presidential candidates—their education, age, religion, race, and so on. If your party nominated a generally well-qualified person for president who happened to be [ITEMS A-K READ IN ORDER], would you vote for that person?
Page 4 (of PDF):
C. Black
2015 Jun 2–7
2012 Jun 7–10 …
1999 Feb 19–21 …
1958 Jul 30–Aug 4 ^ …
^ WORDING: “…if your party nominated a generally well-qualified man for president and he happened to be a Negro, would you vote for him?”
[336] Webpage: “Exit Polls 2012: How the Vote Has Shifted.” Washington Post. Last updated November 6, 2012. <www.washingtonpost.com>
|
Questions |
% of Voters |
Income |
Obama ’12 |
Romney |
Obama ’08 |
McCain |
|
Income |
41% |
Under $50k |
60% |
38% |
60% |
38% |
|
31 |
$50k –$99,999 |
46 |
52 |
49 |
49 |
|
|
28 |
$100k or more |
44 |
54 |
49 |
49 |
[337] Book: The End of Southern Exceptionalism: Class, Race, and Partisan Change in the Postwar South. By Byron E. Shafer and Richard Johnston. Harvard University Press, 2006.
“Table 2.3. Social Class and the Coming of Southern Republicanism: The Presidency”
NOTES:
[338] Article: “Politics and Intergroup Relations in the United States.” By Murray Friedman. American Jewish Year Book, 1973. Pages 139–193. <www.bjpa.org>
Page 166: “According to Lipset and Raab, over 90 per cent of the black vote in slum areas was for [Democrat George] McGovern [in the 1968 presidential election]; but it was 80 per cent in other city areas and only 67 per cent in suburbia.”
[339] Book: The End of Southern Exceptionalism: Class, Race, and Partisan Change in the Postwar South. By Byron E. Shafer and Richard Johnston. Harvard University Press, 2006.
Nevertheless, in the aggregate, the South had managed a per capita income only half that of the rest of the nation at the beginning of World War II—at $3,002 in constant 1940 dollars, a mere 53 percent of the non-Southern figure. The 1950s, 1960s, and 1970s were all explosive by this measure, and the income gap was substantially closed by 1980, at $14,138 or 85 percent….
The economic South thus became a sharply different place within a historically short period of time. Once, within living memory of most of those who experienced the change, the Southern economy had been so backward as to be unable to sustain the familiar divisions of an industrial society-by class, by occupation, and by income-divisions that had come to characterize politics outside the South.
[340] See Just Facts’ research on:
[341] Paper: “Gun Ownership and Social Gun Culture.” By Bindu Kalesan and others. Injury Prevention, June 29, 2015. <injuryprevention.bmj.com>
Page 1:
We assessed gun ownership rates in 2013 across the USA and the association between exposure to a social gun culture and gun ownership. We used data from a nationally representative sample of 4000 US adults, from 50 states and District of Columbia, aged >18 years to assess gun ownership and social gun culture performed in October 2013. State-level firearm policy information was obtained from the Brady Law Center and Injury Prevention and Control Center. …
We used data from a survey by YouGov … among individuals aged >18 years in USA in 2013. YouGov is a nonpartisan research firm that recruits its panel online through a polling website and develops nationally representative surveys used widely for research.7 A description of YouGov is presented in online supplementary appendix I. YouGov invited 11,471 potential participants, out of which 5,392 (47.0%) started the survey and eventually 4,622 (40.3%) completed the survey. Using the 4622 participants, propensity score matching with 2010 American Community Survey sample with selection within strata by weighted sampling with replacements was performed to obtain a nationally representative population. Out of the 4622 respondents, 4000 were matched and identified to be nationally representative. This study was performed using the 4000 respondents who were identified as a nationally representative cohort.
Page 2: “Gun ownership was the lowest in Northeast states, while south US census-defined states had highest rates.”
[342] See Just Facts’ research on the politics of:
[343] Article: “Politics and Intergroup Relations in the United States.” By Murray Friedman. American Jewish Year Book, 1973. Pages 139–193. <www.bjpa.org>
Page 139: “According to an extensive postelection survey conducted for CBS, Roman Catholic voters for the first time in the country’s history selected a Republican candidate [Richard Nixon], by a margin of 53 to 46 per cent.”
Page 147: “Angered by [Democrat George] McGovern’s stand on welfare, busing, and other civil-rights issues directly affecting their neighborhoods and jobs, as well as his position on abortion, drugs, proposed ‘surrender’ to Communist Vietnam, and amnesty for draft dodgers, ethnic groups shunned the Democratic national ticket.”
[344] Report: “America’s Changing Religious Landscape.” By Gregory Smith and others. Pew Research Center, May 12, 2015. <www.pewforum.org>
Page 6:
The latest survey was conducted in English and Spanish among a nationally representative sample of 35,071 adults interviewed by telephone, on both cellphones and landlines, from June 4–Sept. 30, 2014. Findings based on the full sample have a margin of sampling error of plus or minus 0.6 percentage points. The survey is estimated to cover 97% of the non-institutionalized U.S. adult population; 3% of U.S. adults are not reachable by telephone or do not speak English or Spanish well enough to participate in the survey. (See Appendix A for more information on how the survey was conducted, margins of error for subgroups analyzed in this report and additional details.)
Page 86: “Christian … Evangelical … 2014 … Among those who live in the … Northeast [=] 13% … Midwest [=] 26% … South [=] 34% … West [=] 22%”
[345] Article: “5 Facts About Abortion.” By Michael Lipka. Pew Research Center, June 27, 2016. <www.pewresearch.org>
Views of Having an Abortion, by Religion
% of each religious group that says having an abortion is morally wrong
White evangelical Protestant [=] 75
Hispanic Catholic [=] 64
Black Protestant [=] 58
White Catholic [=] 53
White mainline Protestant [=] 38
Unaffiliated [=] 25
[346] Commentary: “Whitewash.” By Frank Rich. New York Magazine, May 5, 2013. <nymag.com>
“You also have to disregard the political game plan codified by Kevin Phillips, the Nixon political strategist whose book The Emerging Republican Majority helped cement the party’s ‘southern strategy’ of mining white backlash to the civil-rights movement.”
[347] Book: The Emerging Republican Majority. By Kevin Phillips. Originally published in 1969. Princeton University Press, 2015. With a general editor’s introduction by Sean Wilentz and prefaces written by Kevin Phillips in 1970 and 2014.
Preface to the Princeton University Press Edition …
I had left the Nixon administration in early 1970, at twenty-nine years old, never again to serve in government or in any Republican party role. …
Kevin Phillips
January, 2014
Preface to the 1970 Paperback Edition …
When the results of the 1966 elections convinced me that the New Deal Democratic era was about to end in favor of an emerging Republican majority, I decided to turn a hobby into a book. A first version was complete in October, 1967, and by Christmas I had found a publisher. …
But it was decided to postpone publication until after the 1968 presidential election results were in hand. I used the first eight months of 1968 to enlarge and rewrite the book. By Election Day, all the chapters were set up, awaiting only the actual 1968 statistics to ratify and confirm the book’s structure and trend projections. Happily, virtually all the data meshed with the trends I had projected, otherwise the logic and structure of the chapters and subchapters would have come unglued. By early January, 1969, the book was complete. …
In June of 1968, I approached the Nixon campaign for a job premised on my voting behavioral research and expertise. I submitted some of the material from my book and was signed on in July, eventually becoming special assistant to Nixon campaign manager John N. Mitchell.
Statistics and analyses from the book were used in campaign memoranda, and as Roscoe Drummond noted in an October, 1968 newspaper column, the Nixon press office distributed excerpts from the book (short summaries of the cyclical theory of an emerging Republican majority).
After the 1968 election was over, I added its results to the appropriate chapters. I want to make clear that the completed manuscript (sent to the publisher in mid-January, 1969) was in no sense cleared or censored by the Nixon Administration. ….
Now for the inhibitions under which I wrote the book. As I completed the final version in November, December and January 1968–1969, I knew that I would be in the new GOP Administration; and not unreasonably, I had been advised to keep away from policy matters and to make no policy recommendations. Nor did I feel free to criticize the Republican Party. So I wrote a clinical book, projecting trends and not moralizing over their occurrence. …
Kevin P. Phillips
Washington, D.C.
January, 1970
NOTE: Phillips was born on November 30, 1940.
[348] Article/Commentary: “Nixon’s Southern Strategy ‘It’s All In the Charts’ ” By James Boyd (Director of the Fund for Investigative Journalism). New York Times, May 17, 1970. <www.nytimes.com>
“Intellectuals in politics usually get a good press, but the early chroniclers of the Nixon era have come down pretty hard on Kevin Phillips, who has just concluded a month stint as special assistant to Attorney General John Mitchell, resigning last month to become a syndicated newspaper columnist.”
[349] Book: The Emerging Republican Majority. By Kevin Phillips. Originally published in 1969. Princeton University Press, 2015. With a general editor’s introduction by Sean Wilentz and prefaces written by Kevin Phillips in 1970 and 2014.
Preface to the 1970 Paperback Edition
Publication of The Emerging Republican Majority in July, 1969, triggered quite a hullabaloo. Over the next six months, critics and observers were to call it everything from “baloney”1 to “the most talked about book of the year”2 to “the most important political book of the decade.”3 Given this degree of controversy, it seems useful to set the record straight—to tell what the book is and is not, how it took shape and the part it played in 1968–70 events. For this reason, I have decided to write a new preface to replace the old one written just after the 1968 election. …
The book was not and is not a “strategy”—Northern, Southern or Western. It is a portrait of American presidential voting behavior from Civil War days to 1968. In the first (1967) draft, the 1968 upheaval was a projection of pre-1968 trends; this version tries to project 1960–68 and existing trends forward into the Seventies.
If it were a strategy, it would be phrased instructionally: the GOP should, ought to and so forth. But there is none of this. The book is a projection—and one with a high batting average to date. Read it as such. …
Next the book’s connection with the 1968 Nixon presidential campaign and with the ensuing Republican Administration: In June of 1968, I approached the Nixon campaign for a job premised on my voting behavioral research and expertise. I submitted some of the material from my book and was signed on in July, eventually becoming special assistant to Nixon campaign manager John N. Mitchell. …
The book does not represent—or purport to represent—the past or present “strategy” of the Nixon Administration. Critics who say it does ignore the fact that it makes no strategic or policy recommendations. If its statistics, analyses and projection suggest courses of action, they merely parallel the role of market research from which an advertising campaign can be blueprinted.
… I knew that I would be in the new GOP Administration; and not unreasonably, I had been advised to keep away from policy matters and to make no policy recommendations. Nor did I feel free to criticize the Republican Party. So I wrote a clinical book, projecting trends and not moralizing over their occurrence.
Inasmuch as the book does project relatively low presidential Republicanism among Negroes and in the Northeast, I have been accused of “writing off” both segments. This is not true. I simply projected existing trends perhaps with more candor than is usual. …
The emerging Republican majority of the Nineteen-Seventies is centered in the South, the West and in the “Middle American” urban-suburban districts. Whatever limousine-liberalism says, this is not reactionary country. …
The emerging Republican majority I hope for is in this tradition: another popular upheaval which over-throws the obsolescent “liberal” ideology and interests of today’s Establishment. Policies able to resurrect the vitality and commitment of Middle America—from sharecroppers and truckers to the alienated lower middle class—will do far more for the entire nation than the environmental manipulation, social boondoggling, community agitation and incendiary promises of the Nineteen-Sixties. …
Kevin P. Phillips Washington, D.C. January, 1970
[350] Commentary: “Whitewash.” By Frank Rich. New York Magazine, May 5, 2013. <nymag.com>
You also have to disregard the political game plan codified by Kevin Phillips, the Nixon political strategist whose book The Emerging Republican Majority helped cement the party’s “southern strategy” of mining white backlash to the civil-rights movement. Speaking to the Times in 1970, Phillips said, “The more Negros who register as Democrats in the South, the sooner the Negrophobe whites will quit the Democrats and become Republicans. That’s where the votes are.”
[351] Article/Commentary: “Nixon’s Southern Strategy ‘It’s All In the Charts’.” By James Boyd (Director of the Fund for Investigative Journalism). New York Times, May 17, 1970. <www.nytimes.com>
Intellectuals in politics usually get a good press, but the early chroniclers of the Nixon era have come down pretty hard on Kevin Phillips, who has just concluded a month stint as special assistant to Attorney General John Mitchell, resigning last month to become a syndicated newspaper columnist. Author Joe McGinnis, in “The Selling of the President 1968,” portrays Phillips as a quack, an absurdly misprogrammed human computer filled with sawdust. Richard Harris, in “Justice,” depicts him as a bumptious ass, an insensitive Neanderthal with almost sadistic social concepts. Senate Republican Leader Hugh Scott dismisses his book as “baloney,” and 10 other senators, including Charles Percy, George McGovern, Marlow Cook and Charles Mathias, have joined in a bipartisan assault on his theories. The [Nixon] Administration feigns to disown him, though during the 1968 campaign Nixon press chief Herb Klein covertly circulated key segments of the Phillips book. …
On Negroes and the G.O.P.:
“All the talk about Republicans making inroads into the Negro vote is persiflage. Even ‘Jake the Snake’ [Senator Jacob K. Javits] only gets 20 per cent. From now on, the Republicans are never going to get more than 10 to 20 per cent of the Negro vote and they don’t need any more than that … but Republicans would be shortsighted if they weakened enforcement of the Voting Rights Act. The more Negroes who register as Democrats in the South, the sooner the Negrophobe whites will quit the Democrats and become Republicans. That’s where the votes are. Without that prodding from the blacks, the whites will backslide into their old comfortable arrangement with the local Democrats.”
NOTE: The ellipses in the above quote is in the article itself.
[352] Book: The Emerging Republican Majority. By Kevin Phillips. Originally published in 1969. Princeton University Press, 2015. With a general editor’s introduction by Sean Wilentz and prefaces written by Kevin Phillips in 1970 and 2014.
Preface to the Princeton University Press Edition: “I had left the Nixon administration in early 1970, at twenty-nine years old, never again to serve in government or in any Republican party role.”
[353] Article/Commentary: “Nixon’s Southern Strategy ‘It’s All In the Charts.’ ” By James Boyd (Director of the Fund for Investigative Journalism). New York Times, May 17, 1970. <www.nytimes.com>
On Negroes and the G.O.P.:
“All the talk about Republicans making inroads into the Negro vote is persiflage. Even ‘Jake the Snake’ [Senator Jacob K. Javits] only gets 20 per cent. From now on, the Republicans are never going to get more than 10 to 20 per cent of the Negro vote and they don’t need any more than that … but Republicans would be shortsighted if they weakened enforcement of the Voting Rights Act. The more Negroes who register as Democrats in the South, the sooner the Negrophobe whites will quit the Democrats and become Republicans. That’s where the votes are. Without that prodding from the blacks, the whites will backslide into their old comfortable arrangement with the local Democrats.” …
“This is not a strategy or a blueprint,” insists Phillips, “just the deciphering of an inexorable trend that will run its course and then be displaced by a new cycle whose origins are already with us, somewhere.”
NOTES:
[354] Webpage: “About Us.” Fund for Investigative Journalism. Accessed August 19, 2016 at <fij.org>
The Fund for Investigative Journalism was founded in 1969 by the late Philip M. Stern, a public-spirited philanthropist who devoted his life “to balancing the scales of justice,” in the words of a friend. Stern was convinced small amounts of money invested in the work of determined journalists would yield enormous results in the fight against racism, poverty, corporate greed and governmental corruption.
[355] Webpage: “Legal Highlight: The Civil Rights Act of 1964.” U.S. Department of Labor, Office of the Assistant Secretary for Administration & Management. Accessed October 1, 2020 at <www.dol.gov>
In 1964, Congress passed Public Law 88-352 (78 Stat. 241). The Civil Rights Act of 1964 prohibits discrimination on the basis of race, color, religion, sex or national origin. …
The Civil Rights Act of 1964 is the nation’s benchmark civil rights legislation, and it continues to resonate in America. Passage of the Act ended the application of “Jim Crow” laws, which had been upheld by the Supreme Court in the 1896 case Plessy v. Ferguson, in which the Court held that racial segregation purported to be “separate but equal” was constitutional.
[356] U.S. Code Title 42, Chapter 21, Subchapter II, Section 2000a: “Civil Rights, Prohibition Against Discrimination or Segregation.” Accessed July 2, 2021 at <www.law.cornell.edu>
(a) Equal Access
All persons shall be entitled to the full and equal enjoyment of the goods, services, facilities, privileges, advantages, and accommodations of any place of public accommodation, as defined in this section, without discrimination or segregation on the ground of race, color, religion, or national origin.
NOTE: For more background on this legislation, see the section of this research on the Civil Rights Act of 1964.
[357] Ruling: Brown v. Board of Education of Topeka. U.S. Supreme Court, May 16, 1954. Decided 9–0. <supreme.justia.com>
Today, education is perhaps the most important function of state and local governments. … In these days, it is doubtful that any child may reasonably be expected to succeed in life if he is denied the opportunity of an education. Such an opportunity, where the state has undertaken to provide it, is a right which must be made available to all on equal terms.
We come then to the question presented: does segregation of children in public schools solely on the basis of race, even though the physical facilities and other “tangible” factors may be equal, deprive the children of the minority group of equal educational opportunities? We believe that it does. …
We conclude that, in the field of public education, the doctrine of “separate but equal” has no place. Separate educational facilities are inherently unequal. Therefore, we hold that the plaintiffs and others similarly situated for whom the actions have been brought are, by reason of the segregation complained of, deprived of the equal protection of the laws guaranteed by the Fourteenth Amendment.
[358] Ruling: Heart of Atlanta Motel v. United States. U.S. Supreme Court, December 14, 1964. Decided 9–0. <www.law.cornell.edu>
As we have seen, 32 States prohibit racial discrimination in public accommodations. These laws but codify the common-law innkeeper rule which long predated the Thirteenth Amendment. …
We … conclude that the action of the Congress in the adoption of the Act [Civil Rights Act of 1964] as applied here to a motel which concededly serves interstate travelers is within the power granted it by the Commerce Clause of the Constitution, as interpreted by this Court for 140 years. It may be argued that Congress could have pursued other methods to eliminate the obstructions it found in interstate commerce caused by racial discrimination. But this is a matter of policy that rests entirely with the Congress not with the courts. How obstructions in commerce may be removed—what means are to be employed—is within the sound and exclusive discretion of the Congress. It is subject only to one caveat—that the means chosen by it must be reasonably adapted to the end permitted by the Constitution. We cannot say that its choice here was not so adapted. The Constitution requires no more.
[359] Article: “Politics and Intergroup Relations in the United States.” By Murray Friedman. American Jewish Year Book, 1973. Pages 139–193. <www.bjpa.org>
Page 163:
A growing sense of black group identity continued as a powerful force, often turning into a quest for separatism. Black fraternities made significant gains at a time when white fraternities were slipping. Increasingly, black economists, journalists, ministers, teachers, accountants, lawyers, psychiatrists, and even nuns were leaving integrated professional organizations to form their own groups. Professor Charles L. Sanders of Atlanta University and Hunter College reported to the National Association of Black Social Workers the formation of at least 22 all-black national professional organization.
[360] Article: “Politics and Intergroup Relations in the United States.” By Murray Friedman. American Jewish Year Book, 1973. Pages 139–193. <www.bjpa.org>
Blacks strived for unity during the year, but the effort only underlined existing sharp divisions. This was dramatically demonstrated at the National Black Political convention, held in Gary, Ind., on March 10–12, and attended by over 4,000 delegates from across the country. The meeting was convened on the premise that blacks were beginning to hold the balance of power in a number of states; that it therefore was possible for them to form a political entity through which black political and economic demands could be realized or maximized A key issue was whether blacks should continue working on their agenda within the two major political parties, or develop an independent black politics. Militants like Imamu Baraka, one of the three convention co-chairmen, wanted to set up a Black Political party, but initially agreed not to press the issue since this would polarize the convention.87 Congresswoman Shirley Chisholm (D., N.Y.) indicated she was available as a candidate around whom blacks and others might rally.88
NAACP [National Association for the Advancement of Colored People] entered the convention with a public attack on the proposed preamble to the National Black Political Agenda which preached racial superiority.89 The platform finally adopted called for “a permanent political movement, the reshaping of American institutions, proportional representation in political office, full employment, local control over police, reparations, and a guaranteed annual income.”
[361] Article: “Black Caucus: Whites Not Allowed.” By Josephine Hearn. Politico, January 22, 2007. <www.politico.com>
As a white liberal running in a majority African American district, Tennessee Democrat Stephen I. Cohen made a novel pledge on the campaign trail last year: If elected, he would seek to become the first white member of the Congressional Black Caucus.
Now that he’s a freshman in Congress, Cohen has changed his plans. He said he has dropped his bid after several current and former caucus members made it clear to him that whites need not apply. …
… [F]ormer Rep. William Lacy Clay Sr., D-Mo., a co-founder of the caucus, had circulated a memo telling members it was “critical” that the group remain “exclusively African-American.”
Other members, including the new chairwoman, Rep. Carolyn Cheeks Kilpatrick, D-Mich., and Clay’s son, Rep. William Lacy Clay, D-Mo., agreed.
“Mr. Cohen asked for admission, and he got his answer. … It’s time to move on,” the younger Clay said. “It’s an unwritten rule. It’s understood. It’s clear.” …
Rep. Pete Stark, D-Calif., who is white, tried in 1975 when he was a sophomore representative and the group was only six years old.
“Half my Democratic constituents were African American. I felt we had interests in common as far as helping people in poverty,” Stark said. “They had a vote, and I lost. They said the issue was that I was white, and they felt it was important that the group be limited to African Americans.”
[362] Article: “White Students Discouraged From Participating in Monday’s Ferguson Demonstrations.” By Yvonne Dean-Bailey. Campus Reform, December 2, 2014. <www.campusreform.org>
Susanna Holmstrom urged classmates Sunday night not to raise their hands in mock surrender in the “Five College Mass Walk Out” if they were “white folks.”
“I encourage white folks participating tomorrow to keep our hands down, to avoid centering ourselves in the actions, and to listen much more than we speak,” Holmstrom said on the event’s public Facebook page. …
Monday’s “Five College Mass Walk Out” included Mount Holyoke College (MHC), the University of Massachusetts at Amherst, Amherst College, Hampshire College, and Smith College. The grassroots effort, led by MHC, invited thousands of students via Facebook.
“This is a call for action coming directly out of Ferguson,” Dianna Tejada, an MHC student who helped organize the multi-college walkout, told Campus Reform. …
In a campus-wide email to all students, Marcella Hall, Dean of Students, encouraged students to attend the walk out.
[363] Article: “Missouri White Students Told Not to Take Part in Ferguson ‘Die-in’ Demonstration.” By Christopher White. College Fix, December 4, 2014. <www.thecollegefix.com>
“During the demonstration we will hold a ‘die-in’ in the student center. We are asking that only people of color be the ones to do so,” event organizers stated in an email obtained by The College Fix. “We are asking non-people of color to stand holding hands in solidarity.” …
The “die-in”—a play on “sit-in demonstrations” popular at universities—was 4 1/2 minutes of silence to represent the 4 1/2 hours Brown lay dead in the street after Wilson shot him. During the die-in, a large group of black students laid on the ground, although a couple of white students still took part despite organizers’ instructions.
[364] Article: “UC-Berkeley Protesters Built a Human Wall to Violently Stop White Students From Crossing Bridge.” By Robby Soave. Reason.com, October 26, 2016. <reason.com>
Student protesters at the University of California-Berkeley gathered in front of a bridge on campus and forcibly prevented white people from crossing it. Students of color were allowed to pass. …
According to video footage of the protest, demonstrators blocked off the bridge completely. Students who needed to get to class had no choice but to cross the stream by jumping from rock to rock. Dozens of people can be seen doing so.
In the video, the activists appeared to let several students of color pass unmolested, but white students were forced to find other routes. …
Another student was told, “This is bigger than you,” by a protester. “This is about whiteness.”
[365] Article: “Cal Students Blocked at Sather Gate in ‘Safe Space’ Protest.” By Mike Moffitt. SFGate, October 26, 2016. <www.sfgate.com>
A video posted on YouTube by Diego Reyes claimed that white students were prevented from passing through the gate but students of color were allowed through.
But UC Berkeley Assistant Vice Chancellor Dan Mogulof said that race and ethnicity played no role in who was allowed to cross the line.
“Simply put, no one, of any ethnicity, was allowed to pass except for one or two individuals who asked to join the protest itself,” Mogulof wrote in an email.
[366] Webpage: “Event Information: Hurting and Healing: Individuations and Communities.” Pomona College Women’s Union. Accessed October 5, 2020 at <docs.google.com>
a *for POC [persons of color], by POC* art show …
Invite your POC friends!
You are encouraged to make art on your own, in your friend groups, clubs, and other communities. For example, the Women’s Union may hold an art-making event with the theme “hurting and healing,” and make something as a collective, but it would be up to the POC individuals to submit the work.
[367] Webpage: “Mission for Show and Guidelines in Curation.” Pomona College Women’s Union. Accessed October 5, 2020 at <docs.google.com>
The priorities of this show are people of color.
People of color are hurting, scared, and angry. People of color are also healing, loving, creating and enjoying community, and supporting each other.
This show’s intent is to create a space that is pro-POC, pro-black, and anti-white supremacist.
Things to keep in mind:
• This show is “for POC, by POC [persons of color],”
• This show is not meant to re-traumatize
• This show is not for allies nor the general student body
◦ the purpose of this show is not to educate, but to empower and support our community
Contact: hurtingandhealingshow@[xxxx].com
[368] Article: “Students at Claremont Colleges Refuse to Live with White People.” By Elliot Dordick. Claremont Independent, August 9, 2016. <claremontindependent.com>
A group of students at the Claremont Colleges are in search of a roommate for next year, but insist that the roommate not be white. Karé Ureña (PZ ’18) posted on Facebook that non-white students in need of housing arrangements should reach out to either her or two other students with whom she plans to live in an off-campus house. The post states that “POC [people of color] only” will be considered for this living opportunity. “I don’t want to live with any white folks,” Ureña added. …
“White people always mad when they don’t feel included but at the end of the day y’all are damaging asf [as f*ck] and if a POC feels they need to protect themselves from that toxic environment THEY CAN! …” noted Terriyonna Smith (PZ ’18), an Africana Studies major and Resident Assistant (RA) for the 2016–2017 year. …
Another Resident Assistant and Black Student Union member, Jessica Saint-Fleur (PZ ’18) added to the thread of comments, “White people have cause [sic] so much mf [motherf*cking] trauma on these campuses … why in the world would I want to live with that? Bring that into my home? A place that is supposed to be safe for me?”
[369] Article: “College Denounces Black Student’s Non-White Roommate Request.” Associated Press, August 12, 2016. <apnews.com>
“Pitzer President Melvin Oliver calls the post ‘inconsistent with our mission and values.’ He says the college wants to engage ‘complex intercultural issues, not to isolate individuals on the basis of any protected status.’ ”
[370] Article: “California College Denounces Black Student’s Facebook Post Seeking Non-White Roommates Only.” Associated Press, August 12, 2016. <www.dailymail.co.uk>
“While the college has denounced the post as inconsistent with its views, it does not appear any disciplinary action has been taken against Urena.”
[371] Email from the Claremont Independent to Just Facts on December 4, 2017:
“To our knowledge, no disciplinary action was taken against the students.”
[372] Article: “UTSA Students Launch ‘No Whites Allowed’ Magazine.” By Brian Dunlop. Coed.com, March 1, 2018. Updated 9/30/2020. <coed.com>
A group of students at the University of Texas at San Antonio [UTSA] are planning to publish a magazine called “No Whites Allowed” (NWA). This magazine is said to be written by “QPOC for QPOC” which means it is written by and for “Queer Persons of Color.” …
Student Kayla Ramey explained the main goal and purpose of the event in a Facebook comment. “I keep having to make this post but I’ll try it one last time so everyone clearly understands. The name of the zine is No Whites Allowed. It’s a zine for QPOC and by QPOC,” Ramey wrote. She added that while “white people are welcome to come to the event,” the “main goal is to celebrate and empower people that society routinely ignores and rejects.”
“Support from white people and heterosexual people is appreciated but is not necessary for the success of this event,” she noted, writing in another comment that “inclusion is not inherently good, and exclusion is not inherently bad.” …
However, UTSA Chief Communications Officer Joe Izbrand informed Campus Reform that the “No Whites Allowed” flyer had, in fact, been removed upon its discovery by university officials.
“This flyer showed up on Feb. 15,” he said. “It was not approved or authorized by the university and was not affiliated with any campus organization or event. It was immediately removed.”
[373] Webpage: “A Guide to the Zine Collection, 2002–2018.” University of Texas at San Antonio Libraries. Accessed October 7, 2020 at <legacy.lib.utexas.edu>
“No Whites Allowed #1–2 [San Antonio, TX, February/March 2018]”
[374] Article: “Day of Absence Changes Form.” By Cloe Marina Manchester. Evergreen State College Cooper Point Journal, April 10, 2017. <www.evergreen.edu>
The Evergreen Day of Absence began as a collective action organized by Evergreen faculty and staff of color in the early 1970s … to create an event in which students of color would leave campus for the day … and leaving white students to consider the importance of their fellow community members by sensing the real loss of their presence. Day of Absence encouraged white students to discuss race, and work toward dismantling racism, while students of color are absent. …
This year, however, it was decided that on Day of Absence, white students, staff and faculty will be invited to leave the campus for the day’s activities. This decision was reached through discussion with POC [persons of color] Greeners who voiced concern over feeling as if they are unwelcome on campus, following the 2016 election. …
… Some of the off-campus activities include “Know Your Fascists,” “Can White People Ever Be Woke,” and “What’s At Stake? Collective Liberation.”
[375] Correspondence Between Bret Weinstein and Rashida Love. <app.leg.wa.gov>
From: Weinstein, Bret
Sent: Wednesday, March 15, 2017 2:50 PM
To: Love, Rashida
Cc: All Staff & Faculty DL [distribution list]
Subject: Re: Invitation and schedules for Day of Absence/Day of Presence 2017
Dear Rashida,
When you first described the new structure for Day of Absence / Day of Presence at a past faculty meeting (where no room was left for questions), I thought I must have misunderstood what you said. Later emails seemed to muddy the waters further, while inviting commitments to participate. I now see from the boldfaced text in this email that I had indeed understood your words correctly.
There is a huge difference between a group or coalition deciding to voluntarily absent themselves from a shared space in order to highlight their vital and under-appreciated roles … and a group or coalition encouraging another group to go away. The first is a forceful call to consciousness which is, of course, crippling to the logic of oppression. The second is a show of force, and an act of oppression in and of itself.
You may take this letter as a formal protest of this year’s structure, and you may assume I will be on campus on the Day of Absence. I would encourage others to put phenotype aside and reject this new formulation, whether they have “registered” for it already or not. On a college campus, one’s right to speak—or to be—must never be based on skin color. …
From: Love, Rashida…
Date: Tue, Mar 14, 2017 at 5:37 PM
Subject: Invitation and schedules for Day of Absence/Day of Presence 2017
To: All Staff & Faculty DL…
Dear Colleagues …
Day of Absence/ Day of Presence [DOA/DOP] is an annual two-day event for Evergreen students, staff, and faculty to explore issues of race, equity, allyship, inclusion and privilege. Day of Absence is a day for community building around identity and conversations about issues of difference. …
The theme this year is “Revolution is not a one-time event; your silence will not protect you,” inspired by Audre Lorde. …
Please notice that in 2017, for the first time, we are reversing the pattern of previous years; our Day of Absence program especially designed for faculty, staff, and students of color will happen on campus this year, while our concurrent program for allies will take place off campus. …
Sincerely,
Rashida Love on behalf of the 2017 DOA/DOP Planning Committee …
Rashida N. Love
She/Her Pronouns
Director First Peoples Multicultural Advising Services
The Evergreen State College
[376] Commentary: “The Campus Mob Came for Me—and You, Professor, Could Be Next.” By Bret Weinstein. Wall Street Journal, May 31, 2017. <www.wsj.com>
I was not expecting to hold my biology class in a public park last week. But then the chief of our college police department told me she could not protect me on campus. Protestors were searching cars for an unspecified individual—likely me—and her officers had been told to stand down, against her judgment, by the college president.
Racially charged, anarchic protests have engulfed Evergreen State College, a small, public liberal-arts institution where I have taught since 2003. … Specifically, I had objected to a planned “Day of Absence” in which white people were asked to leave campus on April 12.
[377] Article: “Evergreen Professor at Center of Protests Resigns; College Will Pay $500,000.” By Abby Spegman. Seattle Times, September 16, 2017. Updated 10/5/17. <www.seattletimes.com>
The Evergreen State College professor at the center of campus protests this spring will receive $500,000 in a settlement that was announced Friday.
Bret Weinstein and his wife, Heather Heying, resigned from their faculty positions effective Friday. The couple filed a $3.85 million tort claim in July alleging the college failed to “protect its employees from repeated provocative and corrosive verbal and written hostility based on race, as well as threats of physical violence,” according to the claim.
Weinstein had criticized changes to the school’s annual Day of Absence after white students who chose to participate were asked to go off campus to talk about race issues. …
The incident led to protests and threats over allegations of racism and intolerance, pulling Evergreen into a national debate over free speech on college campuses.
[378] Video: “Bret Weinstein Testifies to Congress on the Evergreen State College Riots, Free Speech & Safe Spaces.” <www.youtube.com>
[379] Article: “American University Blocks Whites From Cafe Designated as ‘Sanctuary’ for Nonwhites.” College Fix, May 15, 2017. <www.thecollegefix.com>
After black student activists issued a demand list to American University in response to the racist-banana incident two weeks ago, the administration agreed to three demands.
One of them is a ban on whites using a new “student lounge” for the rest of the spring semester. …
The activists said they would take over the space as their own “sanctuary,” and Provost Scott Bass put the university’s imprimatur on the threat, according to The Blackprint, a publication of the university’s chapter of the National Association of Black Journalists:
“This is just the minimum,” Bass told protestors in regards to their demands. He encouraged them that more can be done in terms of the issue of race on campus. “These are reasonable demands. We are interested in building the kind of community which will we are all proud of.”
The specific demands the university has agreed to honor:
For the remaining of the semester, the Bridge will become a sanctuary for people of color.
All POC [persons of color] students get extensions, and should not be penalized for already scheduled finals after the incident.
A separate investigation team based out of the university (composed of a group of non-biased expert contractors) that can investigate cases of racism and discrimination brought against the institution of American University. …
They [faculty and staff] asked incoming President Sylvia Burwell, the former secretary of health and human services, to show how she will enforce “no tolerance for anyone creating a hostile environment for students of color” and punish such people.
[380] Commentary: “American University Faculty and Staff Sign Solidarity Statement in Response to Racist Hate Crime.” By American University Faculty and Staff. American University Eagle, May 11, 2017. Updated 5/22/17. <www.theeagleonline.com>
As faculty, we commit to continuing to engage the systemic roots and current effects of racism on campus. We expect the administration to do the same. The administration’s agreeing to the three demands at the Black student organized demonstration on May 5 is a positive step, but it is only a small step. …
The three demands agreed upon were: (1) For the remainder of the semester, the Bridge will become a sanctuary for people of color. (2) All POC [persons of color] students get extensions and should not be penalized for already scheduled finals after the incident. (3) A separate investigation team based out of the university (composed of a group of non-biased expert contractors) that can investigate cases of racism and discrimination brought against the institution of American University.
[381] Webpage: “New Voices in Science & Technology Studies: A C3 Symposium.” Williams College. Accessed October 5, 2020 at <apply.interfolio.com>
Deadline
Sep 8, 2019 at 11:59 PM Eastern Time
The Science & Technology Studies Program at Williams College invites papers on any topic concerned with science and technology and their relationship to society for a day-long symposium showcasing the work of early-career scholars (ABD or recent PhD) from historically underrepresented groups.
Invited speakers will receive a $500 honorarium and will be guests of Williams College from the evening of Nov. 1 through breakfast on Nov. 3, with all paper presentations to occur on Nov. 2. …
Qualifications
Individuals from underrepresented groups in the professoriate are specifically defined here as African Americans, Alaska Natives, Arab Americans, Asian Americans, Latinx, Native Americans, Native Hawaiians, and other Pacific Islanders. …
Application Instructions …
• A brief statement, no more than a sentence or two, confirming your self-identification as a member of a historically underrepresented….
Equal Employment Opportunity Statement
Beyond meeting fully its legal obligations for non-discrimination, Williams College is committed to building a diverse and inclusive community where members from all backgrounds can live, learn, and thrive.
[382] Statement: “Virtual Cafes.” University of Michigan–Dearborn, September 9, 2020. <umdearborn.edu>
UM–Dearborn sincerely regrets the terms used to describe the “cafe” events held on September 8. The terms used to describe these virtual events and the descriptions themselves were not clear and not reflective of the university’s commitment to diversity, equity and inclusion.
University of Michigan–Dearborn is committed to fostering and maintaining an inclusive campus environment and encourages ongoing dialogue amongst our students, faculty and staff on challenging issues. As campus activities continue to operate in a predominantly remote capacity due to COVID-19, our Center for Social Justice and Inclusion has looked to develop virtual spaces that allow for these important conversations to continue.
The “cafes” were virtual open conversations developed to allow students the opportunity to connect to process current events, share their experiences related to race, share knowledge and resources and brainstorm solutions. The original intent was to provide students from marginalized communities a space that allowed for them to exist freely without having to normalize their lives and experiences, while also providing students that do not identify as persons of color the opportunity to deepen their understanding of race and racism without harming or relying on students of color to educate them.
To ensure that these spaces were kept safe and respectful, the “cafes” had a faculty/staff member as a facilitator.
The events were never intended to be exclusive or exclusionary for individuals of a certain race. Both events were open to all members of the UM–Dearborn campus community.
[383] Webpage: “Non-POC Café.” University of Michigan–Dearborn. Accessed October 5, 2020 at <web.archive.org>
Non-POC Café
Tuesday, September 8, 2020
2 p.m.–3 p.m.
Online/Virtual
The Non-POC (People Of Color) Cafe is a space for students that do not identify as persons of color to gather and to discuss their experience as students on campus and as non-POC in the world. Feel free to drop in and discuss your experiences as non-persons of color and hopefully brainstorm solutions to common issues within the non-POC community.
The Cafe will be facilitated by a non-POC faculty/staff member to ensure that discussions are kept safe and respectful.
The cafe will be held bi-monthly, generally to occur on the 1st Tuesday of every month at 2:00pm and the 3rd Wednesday of every month at 7:00pm. Dates and times are subject to change depending on feedback and demand.
Hosted by: The Center for Social Justice & Inclusion
[384] Report: “Neo-Segregation at Yale.” By Dion J. Pierre and Peter W. Wood. National Association of Scholars, April 2019. <www.nas.org>
Page 16:
About 46 percent (80 colleges out of 173 surveyed) segregate student orientation programs; 43 percent (75 colleges out of the total) offer segregated residential arrangements; and 72 percent (125 colleges out of the total) segregate graduation ceremonies. Though these arrangements are ostensibly voluntary, students can’t easily opt out. We tracked numerous indicators of neo-segregation, from “Diversity Fly-Ins,” (68 percent of the total) where colleges offer minority students an expense-paid segregated preview of the experience that awaits them should they enroll, to segregated alumni groups.
[385] Article: “Demands for Segregated Housing at Williams College Are Not New.” By Dion J. Pierre. National Review, May 8, 2019. <www.nationalreview.com>
We at the National Association of Scholars (NAS) recently launched Separate but Equal, Again: Neo-Segregation in American Higher Education, a project examining racial segregation on college campuses….
… Wesleyan also has five other racially segregated residences: Women of Color House, La Casa Cultural House, Asian/Asian-American House, South Asian House, and Ubuntu, a residence for students of African descent. Black students at Brown University have the Harambee House, and Latino students the Latinx House. … Other segregated residences in our study include MIT’s “Chocolate City,” Columbia’s “Pan African House,” Cornell’s “Ujamaa,” and Oberlin College’s “Asia House.”
These arrangements aren’t exclusive to private colleges. The American taxpayer subsidizes neo-segregation at Rutgers University in New Jersey, where Asian-American students can live in the “Asian American Identities and Images Living Learning Community.” The University of California campuses in Los Angeles and Berkeley both offer segregated dorms to black students.
We also surveyed segregated orientation programs, finding 80 colleges that host them. … Sherman Jones ’06 insisted that allowing “non-minority” students to attend Cultural Connections would “defeat the purpose of the program.” At Cultural Connections, whites are kept out.
[386] Public Law 88-352: “Civil Rights Act of 1964.” 88th U.S. Congress. Signed into law by Lyndon B. Johnson on July 2, 1964. <www.govinfo.gov>
Title VII—Equal Employment Opportunity …
Section 703: Discrimination Because of Race, Color, Religion, Sex, or National Origin
(a) It shall be an unlawful employment practice for an employer—
(1) to fail or refuse to hire or to discharge any individual, or otherwise to discriminate against any individual with respect to his compensation, terms, conditions, or privileges of employment, because of such individual’s race, color, religion, sex, or national origin; or
(2) to limit, segregate, or classify his employees in any way which would deprive or tend to deprive any individual of employment opportunities or otherwise adversely affect his status as an employee, because of such individual’s race, color, religion, sex, or national origin. …
[387] Public Law 88-352: “Civil Rights Act of 1964.” 88th U.S. Congress. Signed into law by Lyndon B. Johnson on July 2, 1964. <www.govinfo.gov>
Title VII—Equal Employment Opportunity …
Section 703: Discrimination Because of Race, Color, Religion, Sex, or National Origin …
(j) Nothing contained in this title shall be interpreted to require any employer, employment agency, labor organization, or joint labor-management committee subject to this title to grant preferential treatment to any individual or to any group because of the race, color, religion, sex, or national origin of such individual or group on account of an imbalance which may exist with respect to the total number or percentage of persons of any race, color, religion, sex, or national origin employed by any employer, referred or classified for employment by any employment agency or labor organization, admitted to membership or classified by any labor organization, or admitted to, or employed in, any apprenticeship or other training program, in comparison with the total number or percentage of persons of such race, color, religion, sex, or national origin in any community, State, section, or other area, or in the available work force in any community, State, section, or other area.
[388] U.S. Code Title 42, Chapter 21, Subchapter VI, Section 2000e-2: “The Public Health and Welfare, Civil Rights, Equal Employment Opportunities, Unlawful Employment Practices.” Accessed July 2, 2021 at <www.law.cornell.edu>
(a) Employer practices
It shall be an unlawful employment practice for an employer—
(1) to fail or refuse to hire or to discharge any individual, or otherwise to discriminate against any individual with respect to his compensation, terms, conditions, or privileges of employment, because of such individual’s race, color, religion, sex, or national origin; or
(2) to limit, segregate, or classify his employees or applicants for employment in any way which would deprive or tend to deprive any individual of employment opportunities or otherwise adversely affect his status as an employee, because of such individual’s race, color, religion, sex, or national origin. …
(j) Preferential treatment not to be granted on account of existing number or percentage imbalance
Nothing contained in this subchapter shall be interpreted to require any employer, employment agency, labor organization, or joint labor-management committee subject to this subchapter to grant preferential treatment to any individual or to any group because of the race, color, religion, sex, or national origin of such individual or group on account of an imbalance which may exist with respect to the total number or percentage of persons of any race, color, religion, sex, or national origin employed by any employer, referred or classified for employment by any employment agency or labor organization, admitted to membership or classified by any labor organization, or admitted to, or employed in, any apprenticeship or other training program, in comparison with the total number or percentage of persons of such race, color, religion, sex, or national origin in any community, State, section, or other area, or in the available work force in any community, State, section, or other area.
[389] Webpage: “The Executive Branch.” White House. Accessed July 2, 2021 at <www.whitehouse.gov>
Under Article II of the Constitution, the President is responsible for the execution and enforcement of the laws created by Congress. Fifteen executive departments—each led by an appointed member of the President’s Cabinet—carry out the day-to-day administration of the federal government. …
Department of Justice
The mission of the Department of Justice (DOJ) is to enforce the law and defend the interests of the United States according to the law; to ensure public safety against threats foreign and domestic; to provide federal leadership in preventing and controlling crime; to seek just punishment for those guilty of unlawful behavior; and to ensure fair and impartial administration of justice for all Americans.
[390] Webpage: “Past Inaugural Ceremonies.” Joint Congressional Committee on Inaugural Ceremonies. Accessed June 25, 2021 at <www.inaugural.senate.gov>
“Forty-Fifth Inaugural Ceremonies, President Lyndon Baines Johnson and Vice President Hubert Humphrey, January 20, 1965… Swearing-In of Vice President Lyndon Baines Johnson after the assassination of President John F. Kennedy, November 22, 1963”
[391] Statement of U.S. Senator Joseph S. Clark (D-PA). Congressional Record, April 8, 1964. Pages 7206–7207. <www.congress.gov>
I have also had prepared by the Department of Justice a summary statement in rebuttal to the argument made by the Senator from Alabama [Mr. Hill] to the effect that title VII would undermine the vested rights of seniority; that it would deny to unions their representation rights under the National Labor Relations Act and the Railway Labor Act; that the operation of title VI would in some way affect adversely the rights of organized labor; and that title VII would impose the requirement of racial balance.
I submit that those assertions of the able senior Senator from Alabama are untenable.
Mr. President, I ask unanimous consent that the rebuttal to the argument prepared at my request by the Department of Justice be printed in full in the Record at this point in my remarks.
There being no objection, the statement was ordered to be printed in the Record, as follows:
Reply to Arguments Made by Senator Hill. …
Finally, it has been asserted title VII would impose a requirement for “racial balance.” This is incorrect. There is no provision, either in title VII or in any other part of this bill that requires or authorizes any Federal agency or Federal court to require preferential treatment for any individual or any group for the purpose of achieving racial balance. No employer is required to hire an individual because that individual is a Negro. No employer is required to maintain any ratio of Negroes to whites, Jews to gentiles, Italians to English, or women to men. The same is true of labor organizations. On the contrary, any deliberate attempt to maintain a given balance would almost certainly run afoul of title VII because it would involve a failure or refusal to hire some individual because of his race, color, religion, sex, or national origin. What title VII seeks to accomplish, what the civil rights bill seeks to accomplish is equal treatment for all.
[392] Report: “Survey of Federal Laws Containing Goals, Set-Asides, Priorities, or Other Preferences Based on Race, Gender, or Ethnicity.” By Jody Feder, Kate M. Manuel, and Julia Taylor. Congressional Research Service, April 14, 2011. <digital.library.unt.edu>
Pages 1–2:
The purpose of this report is to provide a broad, but by no means exhaustive, survey of federal statutes that specifically refer to race, gender, or ethnicity as factors to be considered in the administration of any federal program. Such measures may include, but are not limited to, goals, timetables, set-asides, quotas, priorities, and preferences, as those terms are generally (however imperfectly) understood. Based on searches of the LEXIS/NEXIS and WESTLAW legal databases using a variety of search strategies, the compilation reflects our effort to be as comprehensive as possible.1 Because of the various ways in which such programs can be described, however, we cannot guarantee complete coverage. Moreover, given the disparate policy objectives and wording of the various provisions, some editorial judgment was called for, and the final product may be viewed as over- or under-inclusive, depending on the reader’s perspective. Nonetheless, included are any statutes found during the course of our research that appear, in any manner, to prefer or consider race, gender, or ethnicity as affirmative factors in federal employment, in the award of federal contracts, or in granting any federal benefit to individuals or institutions. Several laws directed to “socially and economically disadvantaged” individuals, groups, and institutions are included because, as explained below, that term has been defined administratively and by statute to presumptively apply to specific racial or ethnic minorities or women.2 However, despite the focus on federal laws containing goals, set-asides, priorities, or other preferences based on race, gender, or ethnicity, this report does not attempt to track whether and how “minority” status, “disadvantage,” or other relevant terms are defined by statute, regulation, or case law for purposes of these programs. Those interested in specific programs should check the statutes authorizing and regulations implementing those programs, as well as any case law pertaining to the program, to determine eligibility.
It is important to note that certain categories of federal law are purposely not included. For example, federal regulations and executive orders are generally not covered, although certain regulations and executive orders may be discussed when they apply government-wide or are otherwise significant. Also not included are various federal civil rights statutes, like Title VI of the 1964 Civil Rights Act and related laws, that place nondiscrimination requirements upon recipients of federal financial assistance without mandating racial, ethnic, or gender preferences per se. Nor are regulations of the various federal departments or agencies under Title VI included for the similar reason that, although they almost uniformly authorize “affirmative action” by recipients to “overcome the effects of prior discrimination” or otherwise, they do not explicitly define the obligation in terms of “goals” or “set-asides,” or other forms of preference for minorities or women. Also beyond the scope of this study are federal antidiscrimination laws that provide for equal opportunity, such as Title VII of the 1964 Civil Rights Act or the Fair Housing Act.4 Although many of these statutes authorize “affirmative” relief by the courts in discrimination actions and have been the basis for judicial preference orders in certain circumstances, they do not explicitly direct the imposition of timetables, goals, set-asides, quotas, or preferences on their face.
Another category of statutory preferences excluded from consideration here are federal programs focused solely upon Native Americans living on or near a reservation
1 The search included all variants of the following words or phrases: underrepresented, affirmative action, minority, woman, disadvantage, race, and gender. Title 25 of the United States Code, which focuses upon Native Americans, was deliberately excluded from this search for reasons discussed below. Included are codified statutes that have not been repealed even if the programs they authorized were of limited duration. However, this report does not include statutes that have been repealed, nor does it track appropriations or appropriations riders that could limit the applicability of any of these provisions. There have been instances where failure to appropriate funds or the terms of an appropriations rider effectively render a program inoperative. See, e.g., Strom Thurmond National Defense Authorization Act for FY1999, P.L. 105-261, § 801, 112 Stat. 1921, 2080–81 (Oct. 17, 1998) (barring the Department of Defense (DOD) from exercising its authority under 10 U.S.C. § 2323 to make price evaluation adjustments to the offers of small disadvantaged businesses (SDBs) in any fiscal year directly following a fiscal year in which DOD awarded at least 5% of its contract dollars to SDBs). This provision kept DOD from granting price evaluation adjustments in every fiscal year between 1998 and 2009. …
2 The word “disadvantaged” commonly appears in federal and federally funded contracting programs. Many programs, especially those for small businesses, include a presumption that members of certain racial or ethnic groups, or women, are socially and/or economically disadvantaged. … Such presumptions based on race have been found to constitute “explicit racial classifications” and are thus included here. …
NOTE: Pages 3–36 detail more than 275 such programs.
[393] Report: “Comparing the Compensation of Federal and Private-Sector Employees, 2011–2015.” U.S. Congressional Budget Office, April 2017. <www.cbo.gov>
Page 1: “Specifically, in its analysis, CBO [Congressional Budget Office] sought to account for differences in individuals’ level of education, years of work experience, occupation, size of employer, geographic location (region of the country and urban or rural location), veteran status, and various demographic characteristics (age, sex, race, ethnicity, marital status, immigration status, and citizenship).”
Page 3: “Overall, the federal government paid 17 percent more in total compensation than it would have if average compensation had been comparable with that in the private
sector, after accounting for certain observable characteristics of workers.”
Page 4: “CBO’s results apply to the cost of employing full-time, full-year workers. The analysis focuses on those workers—who accounted for about 94 percent of the total hours worked by federal employees from 2011 through 2015—because more-accurate data are available for them than for other workers.”
Page 5: “This analysis does not include military personnel or employees of self-financing government enterprises such as the Postal Service; federal contractors are included as private-sector workers.”
Page 11: “Table 2. Federal and Private-Sector Wages, by Level of Educational Attainment … Average Wages (2015 dollars per hour) … Percentage Difference Between Averages”
Page 14: “Table 3. Federal and Private-Sector Benefits, by Level of Educational Attainment … Average Wages (2015 dollars per hour) … Percentage Difference Between Averages”
Page 16: “Table 4. Federal and Private-Sector Total Compensation, by Level of Educational Attainment … Average Wages (2015 dollars per hour) … Percentage Difference Between Averages”
[394] Calculated with the dataset: “Annual Estimates of the Resident Population by Sex, Race, and Hispanic Origin for the United States, States: April 1, 2010 to July 1, 2019.” U.S. Census Bureau, June 2020. <www2.census.gov>
NOTE: An Excel file containing the data and calculations is available upon request.
[395] “Federal Equal Opportunity Recruitment Program (FEORP) Report to Congress, Fiscal Year 2018.” U.S. Office of Personnel Management, December 2020. <www.opm.gov>
Page 1:
FEORP Composition of Federal Workforce at a Glance
|
Representation of the Federal Workforce |
Representation in Senior Executive Service |
|||
|
FY 2017 |
FY 2018 |
FY 2017 |
FY 2018 |
|
|
Men |
56.7 |
56.5 |
66 |
66.2 |
|
Women |
43.3 |
43.4 |
34 |
33.8 |
|
Black |
18.6 |
18.7 |
10.4 |
10.6 |
|
Hispanic |
8.9 |
9.1 |
4.6 |
4.6 |
|
Asian |
5.9 |
6.1 |
3.5 |
3.7 |
|
Native Hawaiian / Pacific Islander |
0.5 |
0.5 |
0.2 |
0.2 |
|
American Indian / Alaska Native |
1.6 |
1.6 |
1.2 |
1.1 |
|
Non-Hispanic Multiracial |
1.6 |
1.7 |
0.08 |
0.9 |
|
White |
62.8 |
62.3 |
79.2 |
78.8 |
Pages 3–4:
Onboard Federal employment statistics used in this report are as of September 30, 2018. All data are produced from OPM’s [U.S. Office of Personnel Management] Enterprise Human Resources Integration-Statistical Data Mart (EHRI-SDM). The Federal Workforce referred to in this report is not the entire Federal Workforce but rather only permanent employees in non-postal Federal Executive Branch agencies participating in the EHRI. This report covers workers in all pay plans including General Schedule and Equivalently Graded pay plans (i.e. pay plans GS, GL, and GM), other white collar pay plans, the Senior Executive Service (pay plan ES), and blue collar pay plans.
All references made to the General Schedule pay plan in this report are to General Schedule and Equivalently Graded pay plans (i.e. pay plans GS, GL, and GM).
Only those agencies with 500 or more permanent employees as of September 2018 are displayed in this report.
Non-Hispanic Multiracial is defined as Non-Hispanic and of more than one race.
The Civilian Labor Force (CLF) percentages for each minority group presented in this report are derived from the Bureau of Labor Statistics’ (BLS) Current Population Survey (CPS). The CPS data, which is a monthly survey of households that is conducted by the Bureau of the Census for BLS, covers non-institutionalized individuals 16 years of age or older, employed or unemployed, U.S. citizens and non-U.S. citizens.
Underrepresentation, as defined in 5 CFR [Code of Federal Regulations] § 720.202(a), means “a situation in which the number of women or members of a minority group within a category of civil service employment constitutes a lower percentage of the total number of employees within the employment category than the percentage of women or the minority group constitutes within the CLF of the United States….”
Occupational categories discussed in this report are white collar and blue collar. The white-collar category contains Professional, Administrative, Technical, Clerical, and Other white-collar occupations. Professional occupations typically require a baccalaureate or professional degree and along with Administrative occupations, are the usual sources for selections to senior management and executive positions. Positions in Technical, Clerical, Other, and blue-collar occupations are usually limited to lower grades, with limited opportunity for promotion to management levels. Advancement in these occupations often depends on individual attainment of further education or advanced skills. Employment data in this report are presented by occupational category and pay intervals to provide a more informative profile.
Page 6: “In FY 2018, the percentage of minorities in the permanent Federal workforce increased by 0.6 percentage points from 37.1% in FY 2017 to 37.7% in FY 2018. Black employees represent 18.7 percent (364,752) of the permanent Federal workforce in FY 2018, compared to 18.6 percent in FY 2017. Black representation in the CLF [civilian labor force] was 11.8% in 2017, compared to 11.9 percent in 2018.”
[396] Report: “Comparing the Compensation of Federal and Private-Sector Employees, 2011–2015.” U.S. Congressional Budget Office, April 2017. <www.cbo.gov>
Page 7: “Highly educated workers tend to earn much higher wages than less educated workers, and federal employees have more education, on average, than employees in the private sector.”
[397] Report: “The Federal Workforce: Additional Insights Could Enhance Agency Efforts Related to Hispanic Representation.” U.S. Government Accountability Office, September 20, 2006. <www.gao.gov>
The federal workforce contains a greater percentage of occupations that require higher levels of education than the CLF [civilian labor force]. EEOC [U.S. Equal Employment Opportunity Commission] divides occupations in the federal workforce and the CLF into nine categories, including among others professionals, operatives, and laborers. For example, in 2000, the year in which EEOC data on the CLF are based, occupations in the professional category—those occupations, such as lawyers, engineers, accountants, and registered nurses, requiring either college graduation or experience of such kind and amount as to provide a comparable background—constituted 29 percent of the federal workforce versus 18 percent of the CLF. Conversely, occupations in the operatives (semiskilled workers) and laborers (unskilled workers) categories, which generally do not require high education levels, constituted 3 percent of the federal workforce compared to 16 percent of the CLF. Figure 1 shows the composition of the federal workforce and the CLF by EEOC’s occupational categories. …
Our analyses showed that the likelihood of being a federal worker increased with higher levels of education. A person with some college was 1.7 times more likely to be a federal worker than a person with only a high school diploma, a person with a bachelor’s degree was 2.2 times more likely, and a person with more than a bachelor’s degree was 2.7 times more likely. OPM [Office of Personnel Management] reported that in 2004, 42 percent of federal workers had a bachelor’s degree or higher. In addition, approximately 60 percent of new permanent hires to the federal government in 2005 had at least some college—20 percent with some college, 23 percent with a bachelor’s degree, and 17 percent with more than a bachelor’s degree.
[398] Dataset: “Table 219.46. Public High School 4-Year Adjusted Cohort Graduation Rate (ACGR), by Selected Student Characteristics and State: 2010–11 Through 2018–19.” U.S. Department Of Education, National Center for Education Statistics, February 2021. <nces.ed.gov>
United States6 … ACGR for students with selected characteristics,1 2018–2019 … White [=] 89% … Black [=] 80% … Hispanic [=] 82% …
NOTE: The adjusted cohort graduation rate (ACGR) is the percentage of public high school freshmen who graduate with a regular diploma within 4 years of starting 9th grade. Students who are entering 9th grade for the first time form a cohort for the graduating class. This cohort is “adjusted” by adding any students who subsequently transfer into the cohort and subtracting any students who subsequently transfer out, emigrate to another country, or die.
[399] Dataset: “Table 302.20. Percentage of Recent High School Completers Enrolled in College, by Race/Ethnicity: 1960 Through 2019.” U.S. Department Of Education, National Center for Education Statistics, August 2020. <nces.ed.gov>
Percent of recent high school completers1 enrolled in college2 (annual data) … 2019 … Total [=] 66.2% … White [=] 68.0.9% … Black [=] 49.8% … Hispanic [=] 63.4% … 1 Individuals ages 16 to 24 who graduated from high school or completed a GED [General Education Development] or other high school equivalency credential. 2 Enrollment in college as of October of each year for individuals ages 16 to 24 who had completed high school earlier in the calendar year.
[400] Dataset: “Table 326.20. Graduation Rate From First Institution Attended Within 150 Percent of Normal Time for First-Time, Full-Time Degree/Certificate-Seeking Students at 2-Year Postsecondary Institutions, by Race/Ethnicity, Sex, and Control of Institution: Selected Cohort Entry Years, 2000 Through 2016.” U.S. Department Of Education, National Center for Education Statistics, August 2020. <nces.ed.gov>
“Percent graduating with a certificate or associate’s degree within 150 percent of normal time … All 2-year institutions … 2016 entry cohort … Total [=] 33.5% … White [=] 36.0% … Black [=] 28.5% … Hispanic [=] 31.6%”
[401] Dataset: “Table 326.10. Graduation Rate From First Institution Attended for First-Time, Full-Time Bachelor’s Degree-Seeking Students at 4-Year Postsecondary Institutions, by Race/Ethnicity, Time to Completion, Sex, Control of Institution, and Percentage of Applications Accepted: Selected Cohort Entry Years, 1996 Through 2013.” U.S. Department Of Education, National Center for Education Statistics, August 2020. <nces.ed.gov>
“Graduating within 6 years after start, males and females … All 4-year institutions … 2013 entry cohort … Total [=] 63.4% … White [=] 66.6% … Black [=] 44.3% … Hispanic [=] 57.8%”
[402] Report: “The Literacy of America’s College Students.” By Justin D. Baer, Andrea L. Cook, and Stéphane Baldi. American Institutes for Research, January 2006. <www.air.org>
Page 4:
The NSACS [National Survey of America’s College Students], sponsored by The Pew Charitable Trusts, collected data from a sample of 1,827 graduating students at 80 randomly selected 2-year and 4-year colleges and universities (68 public and 12 private) from across the United States. The NSACS specifically targeted college and university students nearing the end of their degree program, thus providing a broader and more comprehensive picture of students’ fundamental literacy abilities than ever before.
The NSACS used the same assessment instrument as the 2003 National Assessment of Adult Literacy (NAAL), a nationally representative survey of the English-language literacy abilities of U.S. adults 16 and older residing in households or prisons. The NAAL was developed and administered by the U.S. Department of Education’s National Center for Education Statistics (NCES). Literacy levels were categorized as Below Basic, Basic, Intermediate, or Proficient on the basis of the abilities of participants.
Because literacy is not a single skill used in the same manner for all types of printed and written information, the NSACS measured literacy along three dimensions: prose literacy, document literacy, and quantitative literacy. These three literacy domains were designed to capture an ordered set of information-processing skills and strategies that adults use to accomplish a wide range of literacy tasks and make it possible to profile the various types and levels of literacy among different subgroups in society. …
Document Literacy: The knowledge and skills needed to perform document tasks, that is, to search, comprehend, and use information from noncontinuous texts in various formats. Document examples include job applications, payroll forms, transportation schedules, maps, tables, and drug or food labels.
Quantitative Literacy: The knowledge and skills required to perform quantitative literacy tasks, that is, to identify and perform computations, either alone or sequentially, using numbers embedded in printed materials. Quantitative examples include balancing a checkbook, figuring out a tip, completing an order form, or determining the amount of interest on a loan from an advertisement.
Page 22: “Table 2.3. Percentage of U.S. adults in college and the nation in each document literacy level, by selected characteristics”
Page 23: “Table 2.4. Percentage of U.S. adults in college and the nation in each quantitative literacy level, by selected characteristics”
[403] Calculated with the dataset: “Annual Estimates of the Resident Population by Sex, Race, and Hispanic Origin for the United States, States: April 1, 2010 to July 1, 2019.” U.S. Census Bureau, June 2020. <www2.census.gov>
NOTE: An Excel file containing the data and calculations is available upon request.
[404] “Federal Equal Opportunity Recruitment Program (FEORP) Report to Congress, Fiscal Year 2018.” U.S. Office of Personnel Management, December 2020. <www.opm.gov>
Page 1:
FEORP Composition of Federal Workforce at a Glance
|
Representation of the Federal Workforce |
Representation in Senior Executive Service |
|||
|
FY 2017 |
FY 2018 |
FY 2017 |
FY 2018 |
|
|
Men |
56.7 |
56.5 |
66 |
66.2 |
|
Women |
43.3 |
43.4 |
34 |
33.8 |
|
Black |
18.6 |
18.7 |
10.4 |
10.6 |
|
Hispanic |
8.9 |
9.1 |
4.6 |
4.6 |
|
Asian |
5.9 |
6.1 |
3.5 |
3.7 |
|
Native Hawaiian / Pacific Islander |
0.5 |
0.5 |
0.2 |
0.2 |
|
American Indian / Alaska Native |
1.6 |
1.6 |
1.2 |
1.1 |
|
Non-Hispanic Multiracial |
1.6 |
1.7 |
0.08 |
0.9 |
|
White |
62.8 |
62.3 |
79.2 |
78.8 |
Pages 3–4:
Onboard Federal employment statistics used in this report are as of September 30, 2018. All data are produced from OPM’s [U.S. Office of Personnel Management] Enterprise Human Resources Integration-Statistical Data Mart (EHRI-SDM). The Federal Workforce referred to in this report is not the entire Federal Workforce but rather only permanent employees in non-postal Federal Executive Branch agencies participating in the EHRI. This report covers workers in all pay plans including General Schedule and Equivalently Graded pay plans (i.e. pay plans GS, GL, and GM), other white collar pay plans, the Senior Executive Service (pay plan ES), and blue collar pay plans.
All references made to the General Schedule pay plan in this report are to General Schedule and Equivalently Graded pay plans (i.e. pay plans GS, GL, and GM).
Only those agencies with 500 or more permanent employees as of September 2018 are displayed in this report.
Non-Hispanic Multiracial is defined as Non-Hispanic and of more than one race.
The Civilian Labor Force (CLF) percentages for each minority group presented in this report are derived from the Bureau of Labor Statistics’ (BLS) Current Population Survey (CPS). The CPS data, which is a monthly survey of households that is conducted by the Bureau of the Census for BLS, covers non-institutionalized individuals 16 years of age or older, employed or unemployed, U.S. citizens and non-U.S. citizens.
Underrepresentation, as defined in 5 CFR [Code of Federal Regulations] § 720.202(a), means “a situation in which the number of women or members of a minority group within a category of civil service employment constitutes a lower percentage of the total number of employees within the employment category than the percentage of women or the minority group constitutes within the CLF of the United States….”
Occupational categories discussed in this report are white collar and blue collar. The white-collar category contains Professional, Administrative, Technical, Clerical, and Other white-collar occupations. Professional occupations typically require a baccalaureate or professional degree and along with Administrative occupations, are the usual sources for selections to senior management and executive positions. Positions in Technical, Clerical, Other, and blue-collar occupations are usually limited to lower grades, with limited opportunity for promotion to management levels. Advancement in these occupations often depends on individual attainment of further education or advanced skills. Employment data in this report are presented by occupational category and pay intervals to provide a more informative profile.
Page 6: “Hispanic employees represent 9.1 percent (178,215) of the permanent Federal workforce in FY 2018, compared to 8.9 percent in FY 2017. Hispanic representation in the CLF2 was 17.5 percent in 2018, compared to 17.1 percent in 2017.”
[405] Report: “The Federal Workforce: Additional Insights Could Enhance
Agency Efforts Related to Hispanic Representation.” U.S. Government Accountability Office, September 20, 2006. <www.gao.gov>
U.S. citizenship and educational attainment had the greatest effect, of the measurable factors we identified, on Hispanic representation in the federal workforce, relative to the nonfederal workforce. Our statistical model showed that after accounting for citizenship, Hispanics were nearly as likely as non-Hispanics to be employed in the federal workforce, relative to the nonfederal workforce (the portion of the CLF [civilian labor force] excluding federal employees). Citizenship is required for most federal employment and, in 2005, 99.7 percent of executive branch employees were U.S. citizens or nationals. In addition, a greater proportion of federal occupations require higher levels of education than in the CLF. Our statistical model showed that, as a result, when we compared citizens with similar levels of education, Hispanics were 16 percent or 1.16 times more likely than non-Hispanics to be employed in the federal workforce than in the nonfederal workforce. Other factors in our model, including age, gender, race, veteran’s status, English proficiency, and geography (state where employed), had a more limited or almost no effect on the likelihood of Hispanics being employed in the federal workforce. When all factors were considered, our analyses showed that Hispanic citizens were 24 percent or 1.24 times more likely than non-Hispanic citizens to be employed in the federal workforce than in the nonfederal workforce. Our analyses did not account for differences across and within individual agencies, by grade and pay level, occupational category, individual occupation, geographic location, or any other subset of the federal workforce. …
Our analysis showed that citizenship had the greatest effect of the factors we analyzed on Hispanics’ representation in the federal workforce. We analyzed the effect of citizenship before analyzing any other individual factor because of long-standing policy and practice to restrict federal government hiring to U.S. citizens and nationals—99.7 percent of federal executive branch employees were U.S. citizens or nationals in 2005. (See app. III for a discussion of the federal government’s policy and practice on the employment of citizens.) Before accounting for the effect of citizenship, Hispanics 18 and older were 30 percent less likely than non-Hispanics to be employed (i.e., represented) in the federal workforce, relative to the nonfederal workforce. However, when we analyzed the likelihood of only citizens 18 and older being employed in the federal workforce, we found that Hispanics were 5 percent less likely than non-Hispanics to be employed in the federal workforce compared to their representation in the nonfederal workforce.
Our analysis of 2000 Census data showed that Hispanics had lower citizenship rates than other racial/ethnic groups, with the exception of Asians who had similar rates. In 2000, of those 18 and older in the combined federal and nonfederal CLF, 65 percent of the Hispanics were U.S. citizens compared with 95 percent of blacks, 96 percent of whites, 65 percent of Asians, 87 percent of Hawaiians/Pacific Islanders, and 96 percent of American Indians/Native Alaskans. Additionally, Hispanic immigrants have lower naturalization rates than other immigrant groups. According to the Pew Hispanic Center, 27 percent of the adult foreign- born Hispanic population in the United States were naturalized citizens in 2004 compared with 54 percent of the adult foreign-born non-Hispanic population. …
After citizenship, education had the largest effect on Hispanic representation in the federal workforce. We compared Hispanic and non- Hispanic citizens with similar levels of education. We limited our examination of the effect of education to citizens because citizenship is a basic qualification for most federal employment. As discussed above, among citizens, Hispanics were 5 percent less likely to be employed in the federal government. After accounting for education, Hispanic citizens were 1.16 times or 16 percent more likely than similarly educated non-Hispanic citizens to be in the federal workforce than the nonfederal workforce.
The federal workforce contains a greater percentage of occupations that require higher levels of education than the CLF. EEOC [U.S. Equal Employment Opportunity Commission] divides occupations in the federal workforce and the CLF into nine categories, including among others professionals, operatives, and laborers. For example, in 2000, the year in which EEOC data on the CLF are based, occupations in the professional category—those occupations, such as lawyers, engineers, accountants, and registered nurses, requiring either college graduation or experience of such kind and amount as to provide a comparable background—constituted 29 percent of the federal workforce versus 18 percent of the CLF. Conversely, occupations in the operatives (semiskilled workers) and laborers (unskilled workers) categories, which generally do not require high education levels, constituted 3 percent of the federal workforce compared to 16 percent of the CLF. Figure 1 shows the composition of the federal workforce and the CLF by EEOC’s occupational categories. …
Our analyses showed that the likelihood of being a federal worker increased with higher levels of education. A person with some college was 1.7 times more likely to be a federal worker than a person with only a high school diploma, a person with a bachelor’s degree was 2.2 times more likely, and a person with more than a bachelor’s degree was 2.7 times more likely. OPM [Office of Personnel Management] reported that in 2004, 42 percent of federal workers had a bachelor’s degree or higher. In addition, approximately 60 percent of new permanent hires to the federal government in 2005 had at least some college—20 percent with some college, 23 percent with a bachelor’s degree, and 17 percent with more than a bachelor’s degree.
Our analysis of 2000 Census data showed that regardless of citizenship status, Hispanics overall have lower educational attainment than other groups, with non-U.S. citizens having the lowest levels of educational attainment. Among citizens in the CLF 18 and older, as table 1 shows, Hispanics had a higher percentage of those without a high school diploma—26.4 percent—and lower percentage of those with a bachelor’s degree or higher—15.4 percent—than most other racial/ethnic groups.
[406] Webpage: “Types of Contracts.” U.S. Small Business Administration. Accessed July 3, 2021 at <www.sba.gov>
To help provide a level playing field for small businesses, the government limits competition for certain contracts to small businesses. Those contracts are called “small business set-asides,” and they help small businesses compete for and win federal contracts. …
Some set-asides are for small businesses in certain socio-economic categories. You can bid on these set-aside contracts by participating in any of the SBA’s [U.S. Small Business Administration’s] contracting assistance programs listed below:
8(a) Business Development
The federal government tries to award at least five percent of all federal contracting dollars to small disadvantaged businesses each year.
HUBZone
The federal government tries to award at least three percent of all federal prime contracting dollars to HUBZone-certified small businesses each year.
Women-Owned Small Business
The federal government tries to award at least five percent of all federal contracting dollars to women-owned small businesses each year.
Service-Disabled Veteran-Owned
The federal government tries to award at least three percent of annual federal contracting dollars to service-disabled veteran-owned small businesses.
[407] Webpage: “8(a) Business Development Program.” U.S. Small Business Administration. Accessed July 3, 2021 at <www.sba.gov>
The federal government’s goal is to award at least 5 percent of all federal contracting dollars to small disadvantaged businesses each year….
Program Benefits
To help provide a level playing field for small businesses owned by socially and economically disadvantaged people or entities, the government limits competition for certain contracts to businesses that participate in the 8(a) Business Development program.
Disadvantaged businesses in the 8(a) program can:
• Compete for set-aside and sole-source contracts in the program …
Effective July 15, 2020, to qualify for the 8(a) program, follow this eligibility checklist: …
• Be at least 51 percent owned and controlled by U.S. citizens who are socially and economically disadvantaged
[408] Code of Federal Regulations Title 13, Part 124, Subpart A, Section 8A: “Business Development.” Accessed July 3, 2021 at <www.law.cornell.edu>
(a) General. Socially disadvantaged individuals are those who have been subjected to racial or ethnic prejudice or cultural bias within American society because of their identities as members of groups and without regard to their individual qualities. The social disadvantage must stem from circumstances beyond their control.
(b) Members of designated groups.
(1) There is a rebuttable presumption that the following individuals are socially disadvantaged: Black Americans; Hispanic Americans; Native Americans (Alaska Natives, Native Hawaiians, or enrolled members of a Federally or State recognized Indian Tribe); Asian Pacific Americans (persons with origins from Burma, Thailand, Malaysia, Indonesia, Singapore, Brunei, Japan, China (including Hong Kong), Taiwan, Laos, Cambodia (Kampuchea), Vietnam, Korea, The Philippines, U.S. Trust Territory of the Pacific Islands (Republic of Palau), Republic of the Marshall Islands, Federated States of Micronesia, the Commonwealth of the Northern Mariana Islands, Guam, Samoa, Macao, Fiji, Tonga, Kiribati, Tuvalu, or Nauru); Subcontinent Asian Americans (persons with origins from India, Pakistan, Bangladesh, Sri Lanka, Bhutan, the Maldives Islands or Nepal); and members of other groups designated from time to time by SBA according to procedures set forth at paragraph (d) of this section. Being born in a country does not, by itself, suffice to make the birth country an individual’s country of origin for purposes of being included within a designated group.
[409] Article: “Jury Throws Book at Library Board.” By Ellen Sorokin. Washington Times, February 12, 2002. <www.washingtontimes.com>
A federal jury in Georgia has ordered four members of an Atlanta library board to pay nearly $23.3 million in damages for discriminating against eight white librarians demoted after board members said that “there are too many white faces in management.” …
In court documents filed against four members of the system’s board of trustees, the eight librarians contended that they were demoted from their managerial positions at the county’s central library because they were white. Their positions were filled immediately by eight black librarians. …
The librarians’ claims of discrimination were bolstered by memos, handwritten letters and meeting minutes in which board members stated that “there are too many white faces in management” and ordered a study that broke down the management by race. …
According to interviews and court documents, the eight librarians were working as department managers at the central library in Atlanta when in May 2000 they were transferred to other library branches. Each of them was assigned to perform clerical duties such as cleaning computer screens and shelving books.
[410] Ruling: Ricci v. Destefano. U.S. Supreme Court, June 29, 2009. Decided 5–4. Majority: Kennedy, Roberts, Scalia, Thomas, Alito. Dissenting: Ginsburg, Stevens, Souter, Breyer. <www.law.cornell.edu>
Majority:
Justice Kennedy delivered the opinion of the Court. …
In 2003, 118 New Haven firefighters took examinations to qualify for promotion to the rank of lieutenant or captain. Promotion examinations in New Haven (or City) were infrequent, so the stakes were high. The results would determine which firefighters would be considered for promotions during the next two years, and the order in which they would be considered. Many firefighters studied for months, at considerable personal and financial cost.
When the examination results showed that white candidates had outperformed minority candidates, the mayor and other local politicians opened a public debate that turned rancorous. Some firefighters argued the tests should be discarded because the results showed the tests to be discriminatory. They threatened a discrimination lawsuit if the City made promotions based on the tests. Other firefighters said the exams were neutral and fair. And they, in turn, threatened a discrimination lawsuit if the City, relying on the statistical racial disparity, ignored the test results and denied promotions to the candidates who had performed well. In the end the City took the side of those who protested the test results. It threw out the examinations.
Certain white and Hispanic firefighters who likely would have been promoted based on their good test performance sued the City and some of its officials. Theirs is the suit now before us. The suit alleges that, by discarding the test results, the City and the named officials discriminated against the plaintiffs based on their race, in violation of both Title VII of the Civil Rights Act of 1964, 78 Stat. 253, as amended, 42 U. S. C. §2000e et seq., and the Equal Protection Clause of the Fourteenth Amendment. The City and the officials defended their actions, arguing that if they had certified the results, they could have faced liability under Title VII for adopting a practice that had a disparate impact on the minority firefighters. The District Court granted summary judgment for the defendants, and the Court of Appeals affirmed.
We conclude that race-based action like the City’s in this case is impermissible under Title VII unless the employer can demonstrate a strong basis in evidence that, had it not taken the action, it would have been liable under the disparate-impact statute. The respondents, we further determine, cannot meet that threshold standard. As a result, the City’s action in discarding the tests was a violation of Title VII. In light of our ruling under the statutes, we need not reach the question whether respondents’ actions may have violated the Equal Protection Clause. …
When the City of New Haven undertook to fill vacant lieutenant and captain positions in its fire department (Department), the promotion and hiring process was governed by the city charter, in addition to federal and state law. The charter establishes a merit system. That system requires the City to fill vacancies in the classified civil-service ranks with the most qualified individuals, as determined by job-related examinations. After each examination, the New Haven Civil Service Board (CSB) certifies a ranked list of applicants who passed the test. Under the charter’s “rule of three,” the relevant hiring authority must fill each vacancy by choosing one candidate from the top three scorers on the list. Certified promotional lists remain valid for two years.
The City’s contract with the New Haven firefighters’ union specifies additional requirements for the promotion process. Under the contract, applicants for lieutenant and captain positions were to be screened using written and oral examinations, with the written exam accounting for 60 percent and the oral exam 40 percent of an applicant’s total score. To sit for the examinations, candidates for lieutenant needed 30 months’ experience in the Department, a high-school diploma, and certain vocational training courses. Candidates for captain needed one year’s service as a lieutenant in the Department, a high-school diploma, and certain vocational training courses.
After reviewing bids from various consultants, the City hired Industrial/Organizational Solutions, Inc. (IOS) to develop and administer the examinations, at a cost to the City of $100,000. IOS is an Illinois company that specializes in designing entry-level and promotional examinations for fire and police departments. In order to fit the examinations to the New Haven Department, IOS began the test-design process by performing job analyses to identify the tasks, knowledge, skills, and abilities that are essential for the lieutenant and captain positions. IOS representatives interviewed incumbent captains and lieutenants and their supervisors. They rode with and observed other on-duty officers. Using information from those interviews and ride-alongs, IOS wrote job-analysis questionnaires and administered them to most of the incumbent battalion chiefs, captains, and lieutenants in the Department. At every stage of the job analyses, IOS, by deliberate choice, oversampled minority firefighters to ensure that the results—which IOS would use to develop the examinations—would not unintentionally favor white candidates.
With the job-analysis information in hand, IOS developed the written examinations to measure the candidates’ job-related knowledge. For each test, IOS compiled a list of training manuals, Department procedures, and other materials to use as sources for the test questions. IOS presented the proposed sources to the New Haven fire chief and assistant fire chief for their approval. Then, using the approved sources, IOS drafted a multiple-choice test for each position. Each test had 100 questions, as required by CSB rules, and was written below a 10th-grade reading level. After IOS prepared the tests, the City opened a 3-month study period. It gave candidates a list that identified the source material for the questions, including the specific chapters from which the questions were taken.
IOS developed the oral examinations as well. These concentrated on job skills and abilities. Using the job-analysis information, IOS wrote hypothetical situations to test incident-command skills, firefighting tactics, interpersonal skills, leadership, and management ability, among other things. Candidates would be presented with these hypotheticals and asked to respond before a panel of three assessors.
IOS assembled a pool of 30 assessors who were superior in rank to the positions being tested. At the City’s insistence (because of controversy surrounding previous examinations), all the assessors came from outside Connecticut. IOS submitted the assessors’ resumes to City officials for approval. They were battalion chiefs, assistant chiefs, and chiefs from departments of similar sizes to New Haven’s throughout the country. Sixty-six percent of the panelists were minorities, and each of the nine three-member assessment panels contained two minority members. IOS trained the panelists for several hours on the day before it administered the examinations, teaching them how to score the candidates’ responses consistently using checklists of desired criteria.
Candidates took the examinations in November and December 2003. Seventy-seven candidates completed the lieutenant examination—43 whites, 19 blacks, and 15 Hispanics. Of those, 34 candidates passed—25 whites, 6 blacks, and 3 Hispanics. … Eight lieutenant positions were vacant at the time of the examination. As the rule of three operated, this meant that the top 10 candidates were eligible for an immediate promotion to lieutenant. All 10 were white. Ibid. Subsequent vacancies would have allowed at least 3 black candidates to be considered for promotion to lieutenant.
Forty-one candidates completed the captain examination—25 whites, 8 blacks, and 8 Hispanics. Of those, 22 candidates passed—16 whites, 3 blacks, and 3 Hispanics. Ibid. Seven captain positions were vacant at the time of the examination. Under the rule of three, 9 candidates were eligible for an immediate promotion to captain—7 whites and 2 Hispanics. Ibid. …
Although they did not know whether they had passed or failed, some firefighter-candidates spoke at the first CSB meeting in favor of certifying the test results. Michael Blatchley stated that “[e]very one” of the questions on the written examination “came from the [study] material. … [I]f you read the materials and you studied the material, you would have done well on the test.” … Frank Ricci stated that the test questions were based on the Department’s own rules and procedures and on “nationally recognized” materials that represented the “accepted standard[s]” for firefighting. … Ricci stated that he had “several learning disabilities,” including dyslexia; that he had spent more than $1,000 to purchase the materials and pay his neighbor to read them on tape so he could “give it [his] best shot”; and that he had studied “8 to 13 hours a day to prepare” for the test. … “I don’t even know if I made it,” Ricci told the CSB, “[b]ut the people who passed should be promoted. When your life’s on the line, second best may not be good enough.” …
Other firefighters spoke against certifying the test results. They described the test questions as outdated or not relevant to firefighting practices in New Haven. Gary Tinney stated that source materials “came out of New York. … Their makeup of their city and everything is totally different than ours.” … And they criticized the test materials, a full set of which cost about $500, for being too expensive and too long. …
Legel explained the exam-development process to the CSB. He began by describing the job analyses IOS performed of the captain and lieutenant positions—the interviews, ride-alongs, and questionnaires IOS designed to “generate a list of tasks, knowledge, skills and abilities that are considered essential to performance” of the jobs. … He outlined how IOS prepared the written and oral examinations, based on the job-analysis results, to test most heavily those qualities that the results indicated were “critica[l]” or “essentia[l].” … And he noted that IOS took the material for each test question directly from the approved source materials. Legel told the CSB that third-party reviewers had scrutinized the examinations to ensure that the written test was drawn from the source material and that the oral test accurately tested real-world situations that captains and lieutenants would face. Legel confirmed that IOS had selected oral-examination panelists so that each three-member assessment panel included one white, one black, and one Hispanic member.
Near the end of his remarks, Legel “implor[ed] anyone that had … concerns to review the content of the exam. In my professional opinion, it’s facially neutral. There’s nothing in those examinations … that should cause somebody to think that one group would perform differently than another group.” …
At the close of witness testimony, the CSB voted on a motion to certify the examinations. With one member recused, the CSB deadlocked 2 to 2, resulting in a decision not to certify the results. Explaining his vote to certify the results, Chairman Segaloff stated that “nobody convinced me that we can feel comfortable that, in fact, there’s some likelihood that there’s going to be an exam designed that’s going to be less discriminatory.” …
The CSB’s decision not to certify the examination results led to this lawsuit. The plaintiffs—who are the petitioners here—are 17 white firefighters and 1 Hispanic firefighter who passed the examinations but were denied a chance at promotions when the CSB refused to certify the test results. They include the named plaintiff, Frank Ricci, who addressed the CSB at multiple meetings. …
Title VII of the Civil Rights Act of 1964, 42 U. S. C. §2000e et seq., as amended, prohibits employment discrimination on the basis of race, color, religion, sex, or national origin. Title VII prohibits both intentional discrimination (known as “disparate treatment”) as well as, in some cases, practices that are not intended to discriminate but in fact have a disproportionately adverse effect on minorities (known as “disparate impact”). …
Our analysis begins with this premise: The City’s actions would violate the disparate-treatment prohibition of Title VII absent some valid defense. All the evidence demonstrates that the City chose not to certify the examination results because of the statistical disparity based on race—i.e., how minority candidates had performed when compared to white candidates. As the District Court put it, the City rejected the test results because “too many whites and not enough minorities would be promoted were the lists to be certified.” … (respondents’ “own arguments … show that the City’s reasons for advocating non-certification were related to the racial distribution of the results”). Without some other justification, this express, race-based decisionmaking violates Title VII’s command that employers cannot take adverse employment actions because of an individual’s race. …
The District Court did not adhere to this principle, however. It held that respondents’ “motivation to avoid making promotions based on a test with a racially disparate impact … does not, as a matter of law, constitute discriminatory intent.” … And the Government makes a similar argument in this Court. It contends that the “structure of Title VII belies any claim that an employer’s intent to comply with Title VII’s disparate-impact provisions constitutes prohibited discrimination on the basis of race.” … But both of those statements turn upon the City’s objective—avoiding disparate-impact liability—while ignoring the City’s conduct in the name of reaching that objective. Whatever the City’s ultimate aim—however well-intentioned or benevolent it might have seemed—the City made its employment decision because of race. The City rejected the test results solely because the higher scoring candidates were white. The question is not whether that conduct was discriminatory but whether the City had a lawful justification for its race-based action. …
… Allowing employers to violate the disparate-treatment prohibition based on a mere good-faith fear of disparate-impact liability would encourage race-based action at the slightest hint of disparate impact. A minimal standard could cause employers to discard the results of lawful and beneficial promotional examinations even where there is little if any evidence of disparate-impact discrimination. That would amount to a de facto quota system, in which a “focus on statistics … could put undue pressure on employers to adopt inappropriate prophylactic measures.” Watson, 487 U. S., at 992 (plurality opinion). Even worse, an employer could discard test results (or other employment practices) with the intent of obtaining the employer’s preferred racial balance. That operational principle could not be justified, for Title VII is express in disclaiming any interpretation of its requirements as calling for outright racial balancing. §2000e–2(j). The purpose of Title VII “is to promote hiring on the basis of job qualifications, rather than on the basis of race or color.” Griggs, 401 U. S., at 434. …
The City argues that, even under the strong-basis-in-evidence standard, its decision to discard the examination results was permissible under Title VII. That is incorrect. Even if respondents were motivated as a subjective matter by a desire to avoid committing disparate-impact discrimination, the record makes clear there is no support for the conclusion that respondents had an objective, strong basis in evidence to find the tests inadequate, with some consequent disparate-impact liability in violation of Title VII. …
The racial adverse impact here was significant, and petitioners do not dispute that the City was faced with a prima facie case of disparate-impact liability. On the captain exam, the pass rate for white candidates was 64 percent but was 37.5 percent for both black and Hispanic candidates. On the lieutenant exam, the pass rate for white candidates was 58.1 percent; for black candidates, 31.6 percent; and for Hispanic candidates, 20 percent. The pass rates of minorities, which were approximately one-half the pass rates for white candidates, fall well below the 80-percent standard set by the EEOC [U.S. Equal Employment Opportunity Commission] to implement the disparate-impact provision of Title VII. …
The City, moreover, turned a blind eye to evidence that supported the exams’ validity. Although the City’s contract with IOS contemplated that IOS would prepare a technical report consistent with EEOC guidelines for examination-validity studies, the City made no request for its report. After the January 2004 meeting between Legel and some of the city-official respondents, in which Legel defended the examinations, the City sought no further information from IOS, save its appearance at a CSB meeting to explain how it developed and administered the examinations. IOS stood ready to provide respondents with detailed information to establish the validity of the exams, but respondents did not accept that offer. …
On the record before us, there is no genuine dispute that the City lacked a strong basis in evidence to believe it would face disparate-impact liability if it certified the examination results. In other words, there is no evidence—let alone the required strong basis in evidence—that the tests were flawed because they were not job-related or because other, equally valid and less discriminatory tests were available to the City. Fear of litigation alone cannot justify an employer’s reliance on race to the detriment of individuals who passed the examinations and qualified for promotions. The City’s discarding the test results was impermissible under Title VII, and summary judgment is appropriate for petitioners on their disparate-treatment claim.
The record in this litigation documents a process that, at the outset, had the potential to produce a testing procedure that was true to the promise of Title VII: No individual should face workplace discrimination based on race. Respondents thought about promotion qualifications and relevant experience in neutral ways. They were careful to ensure broad racial participation in the design of the test itself and its administration. As we have discussed at length, the process was open and fair.
The problem, of course, is that after the tests were completed, the raw racial results became the predominant rationale for the City’s refusal to certify the results. The injury arises in part from the high, and justified, expectations of the candidates who had participated in the testing process on the terms the City had established for the promotional process. Many of the candidates had studied for months, at considerable personal and financial expense, and thus the injury caused by the City’s reliance on raw racial statistics at the end of the process was all the more severe. Confronted with arguments both for and against certifying the test results—and threats of a lawsuit either way—the City was required to make a difficult inquiry. But its hearings produced no strong evidence of a disparate-impact violation, and the City was not entitled to disregard the tests based solely on the racial disparity in the results.
Dissent:
Justice Ginsburg, with whom Justice Stevens, Justice Souter, and Justice Breyer join, dissenting. …
The white firefighters who scored high on New Haven’s promotional exams understandably attract this Court’s sympathy. But they had no vested right to promotion. Nor have other persons received promotions in preference to them. New Haven maintains that it refused to certify the test results because it believed, for good cause, that it would be vulnerable to a Title VII disparate-impact suit if it relied on those results. The Court today holds that New Haven has not demonstrated “a strong basis in evidence” for its plea. … In so holding, the Court pretends that “[t]he City rejected the test results solely because the higher scoring candidates were white.” … That pretension, essential to the Court’s disposition, ignores substantial evidence of multiple flaws in the tests New Haven used. The Court similarly fails to acknowledge the better tests used in other cities, which have yielded less racially skewed outcomes.1
By order of this Court, New Haven, a city in which African-Americans and Hispanics account for nearly 60 percent of the population, must today be served—as it was in the days of undisguised discrimination—by a fire department in which members of racial and ethnic minorities are rarely seen in command positions. …
… Pursuant to New Haven’s specifications, IOS developed and administered the oral and written exams. The results showed significant racial disparities. On the lieutenant exam, the pass rate for African-American candidates was about one-half the rate for Caucasian candidates; the pass rate for Hispanic candidates was even lower. On the captain exam, both African-American and Hispanic candidates passed at about half the rate of their Caucasian counterparts. … More striking still, although nearly half of the 77 lieutenant candidates were African-American or Hispanic, none would have been eligible for promotion to the eight positions then vacant. The highest scoring African-American candidate ranked 13th; the top Hispanic candidate was 26th. As for the seven then-vacant captain positions, two Hispanic candidates would have been eligible, but no African-Americans. The highest scoring African-American candidate ranked 15th. …
Other firefighters had a different view. A number of the exam questions, they pointed out, were not germane to New Haven’s practices and procedures. … At least two candidates opposed to certification noted unequal access to study materials. Some individuals, they asserted, had the necessary books even before the syllabus was issued. Others had to invest substantial sums to purchase the materials and “wait a month and a half for some of the books because they were on back-order.” … These disparities, it was suggested, fell at least in part along racial lines. While many Caucasian applicants could obtain materials and assistance from relatives in the fire service, the overwhelming majority of minority applicants were “first-generation firefighters” without such support networks. …
A representative of the Northeast Region of the International Association of Black Professional Firefighters, Donald Day, also spoke at the second meeting. Statistical disparities, he told the CSB, had been present in the Department’s previous promotional exams. On earlier tests, however, a few minority candidates had fared well enough to earn promotions. … Day contrasted New Haven’s experience with that of nearby Bridgeport, where minority firefighters held one-third of lieutenant and captain positions. Bridgeport, Day observed, had once used a testing process similar to New Haven’s, with a written exam accounting for 70 percent of an applicant’s score, an oral exam for 25 percent, and seniority for the remaining five percent. … Bridgeport recognized, however, that the oral component, more so than the written component, addressed the sort of “real-life scenarios” fire officers encounter on the job. … Accordingly, that city “changed the relative weights” to give primacy to the oral exam. Ibid. Since that time, Day reported, Bridgeport had seen minorities “fairly represented” in its exam results. …
Respondents were no doubt conscious of race during their decisionmaking process, the court acknowledged, but this did not mean they had engaged in racially disparate treatment. The conclusion they had reached and the action thereupon taken were race-neutral in this sense: “[A]ll the test results were discarded, no one was promoted, and firefighters of every race will have to participate in another selection process to be considered for promotion.” …
Relying heavily on written tests to select fire officers is a questionable practice, to say the least. Successful fire officers, the City’s description of the position makes clear, must have the “[a]bility to lead personnel effectively, maintain discipline, promote harmony, exercise sound judgment, and cooperate with other officials.” … These qualities are not well measured by written tests. Testifying before the CSB, Christopher Hornick, an exam-design expert with more than two decades of relevant experience, was emphatic on this point: Leadership skills, command presence, and the like “could have been identified and evaluated in a much more appropriate way.”
[411] Article: “New Haven Reverse-Bias Firefighters Win Recompense.” Associated Press, July 28, 2011. <www.washingtontimes.com>
A group of 20 firefighters who won a discrimination case before the U.S. Supreme Court in 2009 has been awarded about $2 million in damages from the city of New Haven….
The Supreme Court ruled that officials violated white firefighters’ civil rights when they threw out 2003 promotion tests results because too few minorities did well. …
Court papers indicate the firefighters—19 whites and one Hispanic—accepted offers Wednesday from the city for back pay, additional pension benefits and interest.
[412] Public Law 102-166: “Civil Rights Act of 1991.” 102nd U.S. Congress. Signed into law by George H. Bush on November 21, 1991. <www.govinfo.gov>
Title I—Federal Civil Rights Remedies …
Sec. 104. Definitions. …
“(n) The term ‘respondent’ means an employer, employment agency, labor organization, joint labor-management committee controlling apprenticeship or other training or retraining program, including an on-the-job training program, or Federal entity subject to section 717.”.
Sec. 106. Prohibition Against Discriminatory Use of Test Scores.
Section 703 of the Civil Rights Act of 1964 (42 U.S.C. 2000e-2) (as amended by section 105) is further amended by adding at the end the following new subsection:
“(l) It shall be an unlawful employment practice for a respondent, in connection with the selection or referral of applicants or candidates for employment or promotion, to adjust the scores of, use different cutoff scores for, or otherwise alter the results of, employment related tests on the basis of race, color, religion, sex, or national origin.”.
[413] U.S. Code Title 42, Chapter 21, Subchapter VI, Section 2000e-2: “The Public Health and Welfare, Civil Rights, Equal Employment Opportunities, Unlawful Employment Practices.” Accessed July 3, 2021 at <www.law.cornell.edu>
(l) Prohibition of discriminatory use of test scores
It shall be an unlawful employment practice for a respondent, in connection with the selection or referral of applicants or candidates for employment or promotion, to adjust the scores of, use different cutoff scores for, or otherwise alter the results of, employment related tests on the basis of race, color, religion, sex, or national origin.
[414] Webpage: “The Executive Branch.” White House. Accessed July 5, 2021 at <www.whitehouse.gov>
The Cabinet and independent federal agencies are responsible for the day-to-day enforcement and administration of federal laws. These departments and agencies have missions and responsibilities as widely divergent as those of the Department of Defense and the Environmental Protection Agency, the Social Security Administration and the Securities and Exchange Commission. …
Under Article II of the Constitution, the President is responsible for the execution and enforcement of the laws created by Congress. Fifteen executive departments—each led by an appointed member of the President’s Cabinet—carry out the day-to-day administration of the federal government. They are joined in this by other executive agencies such as the CIA and Environmental Protection Agency, the heads of which are not part of the Cabinet, but who are under the full authority of the President. The President also appoints the heads of more than 50 independent federal commissions, such as the Federal Reserve Board or the Securities and Exchange Commission, as well as federal judges, ambassadors, and other federal offices. The Executive Office of the President (EOP) consists of the immediate staff to the President, along with entities such as the Office of Management and Budget and the Office of the United States Trade Representative.
[415] Speech: “The Job of Ending Discrimination in This Country Is Not Over.” By Bill Clinton, July 19, 1995. <www.washingtonpost.com>
Today, I am directing all our agencies to comply with the Supreme Court’s Adarand decision, and also to apply the four standards of fairness to all our affirmative action programs that I have already articulated: No quotas in theory or practice; no illegal discrimination of any kind, including reverse discrimination; no preference for people who are not qualified for any job or other opportunity; and as soon as a program has succeeded, it must be retired. Any program that doesn’t meet these four principles must be eliminated or reformed to meet them.
[416] Webpage: “Past Inaugural Ceremonies.” Joint Congressional Committee on Inaugural Ceremonies. Accessed June 25, 2021 at <www.inaugural.senate.gov>
“Fifty-Third Inaugural Ceremonies, President William J. Clinton and Vice President Albert A. Gore Jr., January 20, 1997 … Fifty-Second Inaugural Ceremonies, President William J. Clinton and Vice President Albert A. Gore Jr., January 20, 1993”
[417] Speech: “The Job of Ending Discrimination in This Country Is Not Over.” By Bill Clinton, July 19, 1995. <www.washingtonpost.com>
Today, I am directing all our agencies to comply with the Supreme Court’s Adarand decision, and also to apply the four standards of fairness to all our affirmative action programs that I have already articulated: No quotas in theory or practice; no illegal discrimination of any kind, including reverse discrimination; no preference for people who are not qualified for any job or other opportunity; and as soon as a program has succeeded, it must be retired. Any program that doesn’t meet these four principles must be eliminated or reformed to meet them.
[418] Webpage: “Past Inaugural Ceremonies.” Joint Congressional Committee on Inaugural Ceremonies. Accessed June 25, 2021 at <www.inaugural.senate.gov>
“Fifty-Third Inaugural Ceremonies, President William J. Clinton and Vice President Albert A. Gore Jr., January 20, 1997 … Fifty-Second Inaugural Ceremonies, President William J. Clinton and Vice President Albert A. Gore Jr., January 20, 1993”
[419] Ruling: Saunders v. Caldera. United States District Court for the District of Columbia, March 19, 2001. <www.leagle.com>
Royce C. Lamberth, United States District Judge. …
Lieutenant Colonel [LTC] Raymond Saunders is a white male who served in the Army from 1974 to 1997.1 Although originally commissioned as a Second Lieutenant in the Regular Army, he transferred to the Judge Advocate General’s Corps in 1981 after graduating from law school. In 1992, he was promoted to the rank of Lieutenant Colonel and, in 1996 and 1997, he sought a promotion to Colonel. Both times, he was denied a promotion.
The Army promotes its lieutenant colonels to the rank of colonel through the use of a “selection board.” … Each year, this board reviews the experience and qualifications of several hundred officers seeking a promotion. They select the top candidates from the applicant pool and recommend them to the Secretary of the Army and ultimately the President for promotion to the positions available. … Although the President and the Secretary of the Army have the ultimate control over promotion decisions, it is understood by all involved that most, if not all, of the evaluative decisions are made by the selection board.
The selection board’s evaluation process is controlled by a memorandum of instruction (“MOI”). This document, which is issued by the Secretary of the Army, provides mandatory guidance to the selection board on issues such as the number of promotions and equal opportunity goals. In LTC Saunders’ case, the MOI issued to the selection boards considering his promotion contained the following instructions:
Goals. Equal Opportunity. Your goal is to achieve a selection rate in each minority or gender group (minority groups: Black, Hispanic, Asian/Pacific Islander, American Indian, and Other/Unknown; gender group: Female) that is not less than the selection rate for all officers in the primary zone of consideration. You are required to conduct a review of files for the effects of past discrimination in any case in which the selection rate for a minority or gender group is less than the selection rate for all first time considered officers. This review is required even if the selection of one individual in a minority or gender group would result in a selection rate equal to or greater than the equal opportunity goal for the minority gender group. … You will refer to the remainder of DA [Department of Army] Memorandum 600-2, para A-10c (3), for a description of the procedures to use for this review, as well as instructions concerning required revoting procedures where past discrimination is discovered. My commitment is to build a diverse Judge Advocate General’s Corp that is consistent with the diverse structure of the rest of the Army.
– Memorandum from Togo D. West to James N. Hatten, July 24, 1996….
[420] Ruling: Saunders v. White. United States District Court for the District of Columbia, March 5, 2002. <news.findlaw.com>
Royce C. Lamberth, United States District Judge. …
i. Racial and Gender Classifications
The initial evaluation procedure amounts to a racial and gender classification due to several factors. First and most obviously, DA [Department of Army] Memorandum 600-2 states three separate times that there is a “goal” for the number of female and minority applicants promoted. See DA Memorandum 600-2, section 10, section A-2, A-10(c)(3)(a). Most blatant are the identical instructions contained in sections A-2 and A-10(c)(3)(a):
Your goal is to achieve a selection rate in each minority and gender group (minority groups: Black, Hispanic, Asian/Pacific Islander, American Indian, and Others; gender: males for Army Nurse Corps … and females for all other … categories) that is not less than the selection rate for all officers in the promotion zone (first time considered).
DA Memorandum 600-2, section A-2. It is difficult to find a more direct statement of preference for minorities and females.34 Although the instructions elsewhere order the board not to interpret the “goal” as “guidance to meet a particular ‘quota,’ ” see DA Memorandum 600-2, section 10(b), a defendant may not cleanse a policy of an impermissible preference merely by disclaiming that preference. As this Circuit has explained in the employment context:
we do not think it matters whether a government hiring program imposes hard quotas, soft quotas, or goals. Any one of these techniques induces an employer to hire with an eye toward meeting the numerical target. As such, they can and surely will result in individuals being granted a preference because of their race [or gender].”
Lutheran Church, 141 F.3d at 354. See also Schurr v. Resorts Int’l Hotel, 196 F.3d 486, 493 (3d Cir. 1999) (stating that “[w]e are convinced, however, that in setting employment goals for women and minorities … the regulations were intended to influence employment decisions generally and may, as here, affect concrete decisions[.]”); Bras v. California Public Utilities, 59 F.3d 869, 874 (9th Cir. 1995) (finding that the government policy is “not immunized from scrutiny because they purport to establish ‘goals’ rather than ‘quotas.’ ”).
The Court’s conclusion in this regard is further strengthened by section 10(c) of the Memorandum. That section instructs the board to “identify” and “explain” “situation[s] where a particular minority-gender subgroup did not fare well in comparison to the overall population.” DA Memorandum 600-2 section 10(c) (emphasis added). By ordering board members to “explain” themselves when they fail to promote enough females or minorities, the policy clearly implies that disproportionate promotion is in some way a disfavored result, one that constitutes a failure and should be avoided. This is also communicated by the use of the phrase “fare well”; implicit in the term “fare well” is the notion that there is somehow a deficiency in disproportionately lower minority and female promotion rates. While this might be true from a strict policy perspective, the Constitution prohibits the Army from using its policy view to encourage special treatment for minorities and females. This sense of deficiency, coupled with repeated proclamations of a promotion “goal,” strongly suggests that the 1996 and 1997 selection board members felt “oblige[d] to grant some degree of preference to minorities [and females]” in the initial evaluation procedure. Lutheran Church, 141 F.3d at 351.
But the Court’s decision does not rest on these points alone; a separate portion of DA Memorandum 600-2 explicitly instructs selection board members to grant a promotion benefit to females and minorities during the initial evaluation procedure. Section 10(a) instructs board members unequivocally:
In evaluating the files of the officers you are about to consider, be alert to the possibility of past personal or institutional discrimination–either intentional or inadvertent–in the assignment patterns, evaluations, or professional development of officers in those groups for which you have an equal opportunity selection goal. Such indicators may include disproportionately lower evaluation reports, assignment of lesser importance or responsibility, or lack of opportunity to attend career-building military schools. Taking these factors into consideration, assess the degree to which an officer’s record as a whole is an accurate reflection, free from bias, of that officer’s performance and potential.
DA Memorandum 600-2, section 10(a) (emphasis added). Elsewhere in the Memorandum, the groups for which there is an “equal opportunity selection goal” are defined as “Black, Hispanic, Asian/Pacific Islander, American Indian, and … males for Army Nurse Corps … and females for all other … categories.” DA Memorandum 600-2, section A-2. Nowhere in the Memorandum are selection board officers obliged to consider the possibility of past discrimination for non-Nurse Corps males, whites, or any other group for which there is not an equal opportunity selection goal. Thus, the Memorandum instructs selection board members to, for example, account for an Hispanic applicant’s “past personal or institutional discrimination,” but not to account for a white applicant’s past discrimination. This undeniably establishes a preference in favor of one race or gender over another, and therefore is unconstitutional.35 …
[421] Webpage: “Past Inaugural Ceremonies.” Joint Congressional Committee on Inaugural Ceremonies. Accessed June 25, 2021 at <www.inaugural.senate.gov>
“Fifty-Fourth Inaugural Ceremonies, President George W. Bush and Vice President Dick Cheney, January 20, 2001 … Fifty-Third Inaugural Ceremonies, President William J. Clinton and Vice President Albert A. Gore Jr., January 20, 1997”
[422] Article: “Bias in RAFB [Robins Air Force Base] Job Reviews Alleged.” By Charlie Lanter. The Telegraph (Macon, Georgia), March 20, 2002. <www.macon.com>
Software Division supervisor Harry Jennings, the author of some of the e-mails, acknowledged to The Telegraph this week that the e-mails are legitimate, but he says the appraisal changes were his proposal rather than a final decision. He said he cannot recall the final disposition of the appraisals.
Jennings said he was “just following orders” when he proposed adjusting the employees’ appraisals.
“I was given that, statistically, we had minorities (who) were underrepresented in certain (performance) categories and nonminorities were overrepresented in certain categories, and I was told to fix it,” he said. …
Parks said all six of his clients had been downgraded, and that the alleged quota policy may not be limited to Robins.
“I cannot believe that just one base would have come up with this sophisticated a program for regulating race and gender advancement,” he said. …
Performance appraisals are conducted annually, and the results play a role in promotions and pay raises, according to Donald Thompson, president of the American Federation of Government Employees Local 987, which counts 2,400 civilian workers at Robins as its members. The appraisals also can impact how vulnerable a worker is in the event of cutbacks. …
Reached at home Monday, Jennings acknowledged writing and receiving the e-mails, though he didn’t expect them to be widely distributed. …
The e-mails contain several sets of initials, such as NMM, MM and NMF. Jennings said they stand for “non-minority male,” “minority male” and “non-minority female.” Also in the e-mails, “FS” stands for the appraisal rating “Fully Successful” and “E” stands for “Excellent,” he said.
In an e-mail dated April 19, 2001, software division chief Larry Israel instructs Jennings to adjust appraisals in the department.
“To more balance the ethnic groups here’s what I need you to do:” the April 19 e-mail reads. It continues:
MF OK
MM +2E
NMF -1E
NMM -5E
Jennings said Tuesday he understood that to mean no change for minority females, two minority males should be upgraded to receive Excellent ratings, while one white female and five white males should be downgraded to Excellent.
“If there is a case where the employee performance doesn’t warrant this, list the specifics and bring to me to discuss,” it says.
Jennings told The Telegraph his proposal to adjust the white males downward and one minority male upward was answered with objections by those workers’ immediate supervisors, who worked for Jennings. They said the original scores were what their people deserved. …
On April 23, Jennings sent an e-mail to Israel that contained an apparent explanation of an attached spreadsheet file showing Jennings’ proposed adjustments to appraisal scores in his department.
“We reduced five NMM down to FS,” the April 23 e-mail reads. “We will up the score on one MM … to E, 65. Of the four MM remaining in the branch with FS, none are performing well enough to have earned a higher score (See attachment for comments) and we cannot in good conscience give them a better rating when we are reducing the appraisals of five who are better performers.” …
Within the April 27 document is this statement: “The branch has 10 minority males. Of these, three (30%) are appraised as Superior, three (30%) as Excellent and four (40%) as Fully Successful. A completely balanced distribution would have one less Fully Successful and one more Excellent.”
[423] Speech: “The Job of Ending Discrimination in This Country Is Not Over.” By Bill Clinton, July 19, 1995. <www.washingtonpost.com>
Today, I am directing all our agencies to comply with the Supreme Court’s Adarand decision, and also to apply the four standards of fairness to all our affirmative action programs that I have already articulated: No quotas in theory or practice; no illegal discrimination of any kind, including reverse discrimination; no preference for people who are not qualified for any job or other opportunity; and as soon as a program has succeeded, it must be retired. Any program that doesn’t meet these four principles must be eliminated or reformed to meet them.
[424] Article: “Memo Worries White Men: DoD Minority ‘Quotas’ Feared in Promotion.” By Chet Bridger. Federal Times, September 26, 1994.
Bringing diversity to the top ranks of Defense Department [DoD] management may mean a ceiling at GS-14 for white men.
Defense Undersecretary for Personnel and Readiness Edwin Dorn set the tone Aug. 10 with a memorandum requiring special approval for promotion of all white men without disabilities to GS-15 and higher jobs.
“Progress in this area comes one job at a time, so every vacancy provides us an opportunity to improve the department’s record,” Dorn said in a memo to his assistant secretaries and deputy undersecretaries.
“I need to be consulted whenever you are confronting the possibility that any excepted position, or any career position at GS-15 level and higher, is likely to be filled by a candidate who will not enhance your organization’s diversity,” Dorn wrote. Dorn said if no progress is made, “we will need to employ a more formal approach involving goals, timetables and controls on hiring decisions.”
The memo covers only the personnel and readiness office of 300 employees. It does not reflect a department-wide policy, according to a Dorn spokesman.
Dorn issued a second memo Aug. 27 “to clarify and augment my earlier memo,” which he said was intended to implement Defense Secretary William Perry’s call for “a vigorous effort to improve the representation of women, minorities and persons with disabilities among the department’s civilian managers.”
The second memo revised the language on filling positions. “All tentative selections to career positions at the GS-15 level and higher … should be sent to my office for review. The purpose of the review is to ensure we have made every good faith effort” to carry out Perry’s mandate, Dorn wrote.
The newly announced formula for increasing diversity will be closely watched by employee groups and members of Congress.
“There’s a fine balance between affirmative efforts and maintaining the integrity of the merit system,” said Bruce Moyer, executive director of the Federal Managers Association.
“I certainly would be concerned if this would interfere with the hiring and promotion of any person based on their color or gender.”
Other agencies also are grappling with the difficult issue of increasing diversity while still being fair to white men. Such efforts at the State Department have sparked resignations and formal charges of reverse discrimination.
Defense officials may have to answer to allegations of quota hiring as they press to fill their highest paying jobs with applicants from certain groups.
James Sommerhauser, who co-chairs DoD’s labor-management partnership council with Dorn, said he thinks the department is stopping one step short of a quota system. The memo sends out the message that if affirmative steps are not taken to increase the percentage of female and minority employees in top management jobs, then a quota system may be needed, he said.
“As an effort towards diversity, that’s something the unions typically have supported. And that’s a tough issue for us because most of our members are white, male veteran,” said Sommerhauser, former president of the International Federation of Professional and Technical Engineers.
[425] Webpage: “Past Inaugural Ceremonies.” Joint Congressional Committee on Inaugural Ceremonies. Accessed June 25, 2021 at <www.inaugural.senate.gov>
“Fifty-Third Inaugural Ceremonies, President William J. Clinton and Vice President Albert A. Gore Jr., January 20, 1997 … Fifty-Second Inaugural Ceremonies, President William J. Clinton and Vice President Albert A. Gore Jr., January 20, 1993”
[426] Speech: “The Job of Ending Discrimination in This Country Is Not Over.” By Bill Clinton, July 19, 1995. <www.washingtonpost.com>
Today, I am directing all our agencies to comply with the Supreme Court’s Adarand decision, and also to apply the four standards of fairness to all our affirmative action programs that I have already articulated: No quotas in theory or practice; no illegal discrimination of any kind, including reverse discrimination; no preference for people who are not qualified for any job or other opportunity; and as soon as a program has succeeded, it must be retired. Any program that doesn’t meet these four principles must be eliminated or reformed to meet them.
[427] Speech: “The Job of Ending Discrimination in This Country Is Not Over.” By Bill Clinton, July 19, 1995. <www.washingtonpost.com>
Today, I am directing all our agencies to comply with the Supreme Court’s Adarand decision, and also to apply the four standards of fairness to all our affirmative action programs that I have already articulated: No quotas in theory or practice; no illegal discrimination of any kind, including reverse discrimination; no preference for people who are not qualified for any job or other opportunity; and as soon as a program has succeeded, it must be retired. Any program that doesn’t meet these four principles must be eliminated or reformed to meet them.
[428] Webpage: “Past Inaugural Ceremonies.” Joint Congressional Committee on Inaugural Ceremonies. Accessed June 25, 2021 at <www.inaugural.senate.gov>
“Fifty-Third Inaugural Ceremonies, President William J. Clinton and Vice President Albert A. Gore Jr., January 20, 1997 … Fifty-Second Inaugural Ceremonies, President William J. Clinton and Vice President Albert A. Gore Jr., January 20, 1993”
[429] “Affirmative Action Review, Report to the President.” By George Stephanopoulos (Senior Adviser to the President for Policy and Strategy) and Christopher Edley, Jr. (Special Counsel to the President), July 19, 1995. <clintonwhitehouse4.archives.gov>
Introduction:
1.1 Purposes of the Review
On March 7, 1995, President Clinton directed that a review be conducted of the Federal government’s affirmative action programs. The President asked the following questions:
Descriptions. What kinds of Federal programs and initiatives are now in place, and how are they designed?
Performance. What is known about their effects—benefits and costs, direct and indirect, intended and unintended—both to the specified beneficiaries and to others? In short, how are they run? Do they work? Are they fair?
In preparing this report, we analyzed federal programs that might be categorized as affirmative action.1 These programs range from outreach efforts that encourage grantmakers to seek out members of disadvantaged groups, to procurement regulations that set aside particular contracts for competitive bidding limited largely to minority-owned, economically disadvantaged small businesses.
The report first sets forth the framework we used to analyze these programs. It then describes the evolution of affirmative action, as policymakers sought to make real the promise of the civil rights legal breakthroughs. It then summarizes the evidence of discrimination and exclusion today, followed by a brief review of the overall effectiveness of affirmative action and anti-discrimination measures. All of this provides the context for considering current affirmative action programs in more detail. Several sections describe the government’s major affirmative action programs, and applies to those programs the policy test set forth by the President.
We conclude that these programs have worked to advance equal opportunity by helping redress problems of discrimination and by fostering the inclusion needed to strengthen critical institutions, professions and the economy. In addition, we have examined concerns about fairness. The evidence shows that, on the whole, the federal programs are fair and do not unduly burden nonbeneficiaries. Finally, we conclude that some reforms would make the programs work better and guarantee their fairness.
[430] Webpage: “George Stephanopoulos: Biography.” ABC News. Accessed July 5, 2021 at <abcnews.go.com>
“George Stephanopoulos is ABC News’ Chief Anchor. He also serves as anchor of ‘Good Morning America,’ and anchor of ‘This Week with George Stephanopoulos.’ As Chief Anchor, Stephanopoulos leads the network’s coverage on all major live events and breaking news around the world.”
[431] Webpage: “Christopher Edley Jr.” The Opportunity Institute. Accessed July 5, 2021 at <theopportunityinstitute.org>
Christopher Edley, Jr.
Co-Founder and President Emeritus
Christopher Edley, Jr. has spent 40 years influencing public policy and teaching law at Harvard and Berkeley.
He is also the Honorable William H. Orrick, Jr. Distinguished Professor of Law at UC Berkeley School of Law, after serving as dean from 2004 through 2013. His academic work is in administrative law, civil rights, and education policy. Before Berkeley, Chris was a professor at Harvard Law School for 23 years, where Professor Gary Orfield and he co-founded the Harvard Civil Rights Project.
Chris co-chaired the congressionally chartered National Commission on Education Equity and Excellence (2011-13). He served in White House policy and budget positions under presidents Jimmy Carter and Bill Clinton. Chris also held senior positions in five presidential campaigns: policy director for Michael Dukakis (1988); and senior policy adviser for Al Gore (2000), Howard Dean (2004), Barack Obama (2008), and Hillary Clinton (2016). In 1993, he was a senior economic adviser in the Clinton Presidential Transition, responsible for housing and regulation of financial institutions. In 2008, he was a board member for the Obama presidential transition, with general responsibility for healthcare, education, and immigration.
[432] Paper: “A Systemic Analysis of Affirmative Action in American Law Schools.” By Richard H. Sander. Stanford Law Review, November 2004. Pages 367–483. <www.brown.edu>
Page 369:
Nearly all aspirants to law school go through a similar application process and take a uniform exam, the Law School Admission Test (LSAT). First-year law students across the country follow similar curricula and are graded predominantly on a curve. Nearly all graduates of law school who want to practice law must take bar exams to begin their professional careers.3
Pages 414–416:
From 1991 through 1997, the LSAC [Law School Admission Council] gathered systematic data on one national cohort of law students for its Bar Passage Study (LSAC-BPS).133 The study is remarkable because the LSAC secured the cooperation of about ninety-five percent of the nation’s accredited law schools and most of the state bar examiners.134 The LSAC was thus able to track some twenty-seven thousand law students from their entry into law school in the fall of 1991 through their eventual success (or failure) in passing the bar two or three years after graduation. …
For each person in the LSAC-BPS data set, I assigned an “admissions index” value using the method outlined in Part II. The index is a linear combination of LSAT (weighted 60%) and undergraduate GPA [grade point average] (weighted 40%) that scales all students on a range from one to one thousand. Table 3.1 presents data on all the students who enrolled at Tier 1 schools (which appear to include the most elite schools in the nation), separated by race. …
The racial gap in the mean academic index is 155 points; the gap in the median index is 170 points. The standard deviation of the index is comparatively small—strikingly small, considering that the schools in this group are spread across the top twenty in rank, ranging perhaps from Yale to Vanderbilt. This means that nearly all of the whites admitted to any of the Tier 1 schools come from a fairly narrow credentials band. Collectively, only about three percent of the whites at these schools have academic indices as low as the median black matriculant.
Table 3.2 summarizes similar data for the full range of law schools that participated in the LSAC-BPS. It is hard to conclude from this data that the racial gap, or affirmative action, disappears at lower-tier schools. Except for the seven law schools that have historically served minorities—obviously a special case—the black-white gap is nearly constant.
Table 3.2: Black-White Academic Index Gap in Six Groups of
American Law Schools, 1991 Matriculants
|
Law School Group |
Median Academic Index |
Black–White Gap |
Standard Deviation in Index for Whites |
|
|
Blacks |
Whites |
|||
|
Group 1: Very Elite Schools (n = 14) |
705 |
875 |
170 |
74 |
|
Group 2: Other “National” Schools (n = 16) |
631 |
805 |
174 |
89 |
|
Group 3: Midrange Public Schools (n = 50) |
586 |
788 |
202 |
75 |
|
Group 4: Midrange Private Schools (n = 50) |
560 |
725 |
165 |
75 |
|
Group 5: Low-Range Private Law Schools (n = 18) |
493 |
665 |
172 |
73 |
|
Group 6: Historically “Minority” Schools (n = 7) |
516 |
641 |
125 |
103 |
Page 435:
Table 5.4: GPA Distribution of Black Students at the End of Their First and Third Years, For All Law Schools in the LSAC-BPS
|
Decile |
Proportion of Black Law School Graduates with Grades in Each Decile |
|
|
1st Year GPA |
3d Year (Cumulative) GPA |
|
|
1st |
41.4% |
42.5% |
|
2nd |
17.4% |
18.0% |
|
3rd |
11.3% |
11.2% |
|
4th |
8.2% |
9.0% |
|
5th |
6.5% |
5.8% |
|
6th |
4.3% |
5.0% |
|
7th |
3.3% |
2.5% |
|
8th |
3.3% |
2.5% |
|
9th |
2.3% |
1.8% |
|
10th |
2.0% |
1.7% |
|
n of Black Students in Sample: 1385 |
||
Source: LSAC-BPS Data, supra note 133.183 The universe on which the deciles are calculated is just those students who graduated from law school and had, in the LSAC-BPS data, valid first-year and cumulative third-year GPAs (a total of 22,969 students). The difference between the means of the first- and third-year grade distribution is small but highly significant (p < .001). Because dropouts are excluded from the analysis, this table somewhat overstates the performance of all blacks who complete the first year of law school.
Page 436: “In the LSAC-BPS data, 8.2% of the white students, but 19.2% of the black students, who started law school in 1991 had not graduated by the end of the study five years later.”
Page 454: “Of all the black students in the LSAC-BPS study who began law school in 1991, only 45% graduated from law school, took the bar, and passed on their first attempt. The rate for whites was over 78%.”
Page 478:
The median GPA of all black students at the end of the first year of law school lies roughly at the sixth percentile of the white grade distribution. Put differently, close to half of black students end up in the bottom tenth of their classes. …
… Blacks are nearly six times as likely as whites to not pass state bar exams after multiple attempts. …
… Blacks earn 6% to 9% more early in their careers than do whites seeking similar jobs with similar credentials, presumably because many employers (including government employers) pursue moderate racial preferences in hiring.
[433] Webpage: “About the ACLU.” American Civil Liberties Union. Accessed July 5, 2021 at <www.aclu.org>
“For nearly 100 years, the ACLU [American Civil Liberties Union] has been our nation’s guardian of liberty, working in courts, legislatures, and communities to defend and preserve the individual rights and liberties that the Constitution and the laws of the United States guarantee everyone in this country.”
[434] Webpage: “2011: Immigrants’ Rights Under Attack in State Legislatures.” American Civil Liberties Union. Accessed August 23, 2016 at <action.aclu.org>
“Arizona’s racial profiling law and its imitators threaten fundamental American values of fairness and equality for all people. The ACLU [American Civil Liberties Union] will continue to stand up for the civil liberties of all Americans, no matter what race, ethnicity, or national origin.”
[435] Position paper: “Affirmative Action.” American Civil Liberties Union. Accessed August 23, 2016 at <www.aclu.org>
Opponents of affirmative action deliberately distort the definition and goals of this legal remedy. They contend that the practice is unfair, that it leads to preferential treatment and reverse discrimination, and that it relies on quotas.
Affirmative action programs neither grant preferences based on race, nor create quotas. The law states that affirmative action programs must be flexible, using goals and timetables, but not quotas; protect seniority and not interfere with the legitimate seniority expectations of current employees; be temporary and last no longer than necessary to remedy discrimination.
[436] Ballot pamphlet: “California’s General Election on November 5, 1996.” California Secretary of State, 1996. <vigarchive.sos.ca.gov>
“Proposition 209: Text of Proposed Law.” <vigarchive.sos.ca.gov>
Proposed amendment to Article 1 (Declaration of Rights): …
(a) The State shall not discriminate against, or grant preferential treatment to, any individual or group on the basis of race, sex, color, ethnicity, or national origin in the operation of public employment, public education, or public contracting.
(b) This section shall apply only to action taken after the section’s effective date.
(c) Nothing in this section shall be interpreted as prohibiting bona fide qualifications based on sex which are reasonably necessary to the normal operation of public employment, public education, or public contracting.
(d) Nothing in this section shall be interpreted as invalidating any court order or consent decree which is in force as of the effective date of this section.
(e) Nothing in this section shall be interpreted as prohibiting action which must be taken to establish or maintain eligibility for any federal program, where ineligibility would result in a loss of federal funds to the State.
(f) For the purposes of this section, “State” shall include, but not necessarily be limited to, the State itself, any city, county, city and county, public university system, including the University of California, community college district, school district, special district, or any other political subdivision or governmental instrumentality of or within the State.
(g) The remedies available for violations of this section shall be the same, regardless of the injured party’s race, sex, color, ethnicity, or national origin, as are otherwise available for violations of then-existing California antidiscrimination law.
(h) This section shall be self-executing. If any part or parts of this section are found to be in conflict with federal law or the United States Constitution, the section shall be implemented to the maximum extent that federal law and the United States Constitution permit. Any provision held invalid shall be severable from the remaining portions of this section.
[437] Article: “White House Mulls Joining ACLU Suit Against Prop. 209.” San Francisco Examiner, December 11, 1996. <www.sfgate.com>
Prop. 209 amended the state constitution to prohibit:
“preferential treatment … on the basis of race, sex, color, ethnicity or national origin.” It also ended all non-court-ordered state affirmative action programs in public education, employment and contracting.”
The ACLU [American Civil Liberties Union] is seeking a preliminary injunction barring Gov. Wilson and state Attorney General Dan Lungren from implementing the measure pending a full court hearing on the issue.
[438] Article: “White House Joins Attack on Prop. 209.” By David G. Savage. Los Angeles Times, December 21, 1996. <www.latimes.com>
“[Presidential press secretary Mike] McCurry said that [President] Clinton did not lightly wish to go against the ‘will of the people’ of California, who approved Proposition 209 in November’s election by 54% to 46%.”
[439] Article: “White House Joins Attack on Prop. 209.” By David G. Savage. Los Angeles Times, December 21, 1996. <www.latimes.com>
Escalating the battle over affirmative action, the Clinton administration announced Friday that it will join the legal attack on the California voter initiative that bars preferential treatment based on race, ethnicity or gender in all state programs. …
[Presidential press secretary Mike] McCurry said that Clinton did not lightly wish to go against the “will of the people” of California, who approved Proposition 209 in November’s election by 54% to 46%. But the president decided that the measure presents a “significant overriding constitutional concern,” McCurry said. …
The administration’s civil rights lawyers could ask to join the lawsuit being heard in Henderson’s courtroom as a party to the case, or instead file a friend of the court brief on behalf of the plaintiffs. Lawyers for the ACLU [American Civil Liberties Union] said they were delighted by the administration’s decision to enter the legal dispute.
[440] Article: California’s Affirmative Action Ban Bolstered by Supreme Court Ruling.” By Katy Murphy. Mercury News, April 22, 2014. Updated 8/12/2016. <www.mercurynews.com>
California’s 16-year-old affirmative action ban is lodged more firmly than ever in state law after the U.S. Supreme Court on Tuesday shut off further court challenges in states that have enacted such bans.
By upholding a Michigan law nearly identical to California’s, the ruling left only a legislative—or ballot initiative—route for allowing racial and gender preferences in public college admissions, contracts and hiring. …
But the Michigan case had major implications for California, where Proposition 209 approved by voters in 1996—has forbidden consideration of race and gender in university admissions and financial aid, contracting and other public programs throughout the state. Legal challenges to Proposition 209 failed, and its critics considered the Supreme Court case out of Michigan the last, best chance to revive a challenge in the courts.
[441] Position paper: “Affirmative Action.” American Civil Liberties Union. Accessed August 23, 2016 at <www.aclu.org>
“1965 The term ‘affirmative action’ is used for the first time, by President Johnson in E.O. [Executive Order] 11246, requiring federal contractors to take ‘affirmative action’ to ensure equality of employment.”
[442] Executive order 10925: “Establishing the President’s Committee on Equal Employment Opportunity.” By John F. Kennedy, March 6, 1961. <www.presidency.ucsb.edu>
WHEREAS discrimination because of race, creed, color, or national origin is contrary to the Constitutional principles and policies of the United States; and 13 CFR 1960 Supp.
WHEREAS it is the plain and positive obligation of the United States Government to promote and ensure equal opportunity for all qualified persons, without regard to race, creed, color, or national origin, employed or seeking employment with the Federal Government and on government contracts….
Part III—Obligations Of Government Contractors And Subcontractors
Subpart A—Contractors’ Agreements
Section 301. Except in contracts exempted in accordance with section 303 of this order, all government contracting agencies shall include in every government contract hereafter entered into the following provisions:
“In connection with the performance of work under this contract, the contractor agrees as follows:
“(1) The contractor will not discriminate against any employee or applicant for employment because of race, creed, color, or national origin. The contractor will take affirmative action to ensure that applicants are employed, and that employees are treated during employment, without regard to their race, creed, color, or national origin. Such action shall include, but not be limited to, the following: employment, upgrading, demotion or transfer; recruitment or recruitment advertising; layoff or termination; rates of pay or other forms of compensation; and selection for training, including apprenticeship. The contractor agrees to post in conspicuous places, available to employees and applicants for employment, notices to be provided by the contracting officer setting forth the provisions of this nondiscrimination clause.”
[443] Executive order 10925: “Establishing the President’s Committee on Equal Employment Opportunity.” By John F. Kennedy, March 6, 1961. <www.presidency.ucsb.edu>
WHEREAS discrimination because of race, creed, color, or national origin is contrary to the Constitutional principles and policies of the United States; and 13 CFR 1960 Supp.
WHEREAS it is the plain and positive obligation of the United States Government to promote and ensure equal opportunity for all qualified persons, without regard to race, creed, color, or national origin, employed or seeking employment with the Federal Government and on government contracts….
Part III—Obligations Of Government Contractors And Subcontractors
Subpart A—Contractors’ Agreements
Section 301. Except in contracts exempted in accordance with section 303 of this order, all government contracting agencies shall include in every government contract hereafter entered into the following provisions:
“In connection with the performance of work under this contract, the contractor agrees as follows:
“(1) The contractor will not discriminate against any employee or applicant for employment because of race, creed, color, or national origin. The contractor will take affirmative action to ensure that applicants are employed, and that employees are treated during employment, without regard to their race, creed, color, or national origin. Such action shall include, but not be limited to, the following: employment, upgrading, demotion or transfer; recruitment or recruitment advertising; layoff or termination; rates of pay or other forms of compensation; and selection for training, including apprenticeship. The contractor agrees to post in conspicuous places, available to employees and applicants for employment, notices to be provided by the contracting officer setting forth the provisions of this nondiscrimination clause.
“(2) The contractor will, in all solicitations or advertisements for employees placed by or on behalf of the contractor, state that all qualified applicants will receive consideration for employment without regard to race, creed, color, or national origin.”
[444] Speech: “237 – Radio and Television Report to the American People on Civil Rights.” By John F. Kennedy, June 11, 1963. <www.jfklibrary.org>
It ought to be possible, in short, for every American to enjoy the privileges of being American without regard to his race or his color. In short, every American ought to have the right to be treated as he would wish to be treated, as one would wish his children to be treated. But this is not the case. …
Next week I shall ask the Congress of the United States to act, to make a commitment it has not fully made in this century to the proposition that race has no place in American life or law. The federal judiciary has upheld that proposition in the conduct of its affairs, including the employment of federal personnel, the use of federal facilities, and the sale of federally financed housing.
[445] “Commencement Address at Howard University: ‘To Fulfill These Rights.’ ” By President Lyndon B. Johnson, June 4, 1965. <teachingamericanhistory.org>
Thus we have seen the high court of the country declare that discrimination based on race was repugnant to the Constitution, and therefore void. We have seen in 1957, and 1960, and again in 1964, the first civil rights legislation in this Nation in almost an entire century. …
The voting rights bill will be the latest, and among the most important, in a long series of victories. But this victory—as Winston Churchill said of another triumph for freedom—“is not the end. It is not even the beginning of the end. But it is, perhaps, the end of the beginning.”
That beginning is freedom; and the barriers to that freedom are tumbling down. Freedom is the right to share, share fully and equally, in American society--to vote, to hold a job, to enter a public place, to go to school. It is the right to be treated in every part of our national life as a person equal in dignity and promise to all others.
But freedom is not enough. You do not wipe away the scars of centuries by saying: Now you are free to go where you want, and do as you desire, and choose the leaders you please.
You do not take a person who, for years, has been hobbled by chains and liberate him, bring him up to the starting line of a race and then say, “you are free to compete with all the others,” and still justly believe that you have been completely fair.
Thus it is not enough just to open the gates of opportunity. All our citizens must have the ability to walk through those gates.
This is the next and the more profound stage of the battle for civil rights. We seek not just freedom but opportunity. We seek not just legal equity but human ability, not just equality as a right and a theory but equality as a fact and equality as a result.
For the task is to give 20 million Negroes the same chance as every other American to learn and grow, to work and share in society, to develop their abilities—physical, mental and spiritual, and to pursue their individual happiness.
To this end equal opportunity is essential, but not enough, not enough. Men and women of all races are born with the same range of abilities. But ability is not just the product of birth. Ability is stretched or stunted by the family that you live with, and the neighborhood you live in—by the school you go to and the poverty or the richness of your surroundings. It is the product of a hundred unseen forces playing upon the little infant, the child, and finally the man.
[446] Article: “Most Americans Say Colleges Should Not Consider Race or Ethnicity in Admissions.” By Nikki Graf. Pew Research Center, February 25, 2019. <www.pewresearch.org>
As the debate over college admissions policies reignites, a new Pew Research Center survey finds that most Americans (73%) say colleges and universities should not consider race or ethnicity when making decisions about student admissions. Just 7% say race should be a major factor in college admissions, while 19% say it should be a minor factor. …
|
% Saying Race or Ethnicity Should Be a ____ in College Admissions Decisions |
Major Factor |
Minor Factor |
Not a Factor |
|
All adults |
7 |
19 |
73 |
|
White |
4 |
18 |
78 |
|
Black |
18 |
20 |
62 |
|
Hispanic |
11 |
22 |
65 |
|
Asian* |
13 |
29 |
58 |
|
Rep/Lean Rep |
4 |
12 |
85 |
|
Dem/Lean Dem |
10 |
26 |
63 |
* Asians were interviewed in English only.
Note: Share of respondents who didn’t offer an answer not shown. Whites, blacks and Asians include those who report being only one race and are non-Hispanic. Hispanics are of any race.
Source: Survey of U.S. adults conducted Jan. 22–Feb. 5, 2019.
[447] Webpage: “Methodology.” By Juliana Menasce Horowitz, Anna Brown, and Kiana Cox. Pew Research Center, April 9, 2019. <www.pewsocialtrends.org>
The American Trends Panel (ATP), created by Pew Research Center, is a nationally representative panel of randomly selected U.S. adults. Panelists participate via self-administered web surveys. Panelists who do not have internet access at home are provided with a tablet and wireless internet connection. The panel is managed by Ipsos.
Data in this report are drawn from the panel wave conducted Jan. 22 to Feb. 5, 2019. A total of 6,637 panelists responded out of 9,402 who were sampled, for a response rate of 71%. This included 5,599 from the ATP and oversamples of 530 non-Hispanic black and 508 Hispanic respondents sampled from Ipsos’ KnowledgePanel. The cumulative response rate accounting for nonresponse to the recruitment surveys and attrition is 4.4%. The margin of sampling error for the full sample of 6,637 respondents is plus or minus 1.7 percentage points.
[448] Article: “Most in U.S. Oppose Colleges Considering Race in Admissions.” By Frank Newport. Gallup, July 8, 2016. <news.gallup.com>
Americans’ View on Race-Based Affirmative Action in College Admissions
Which comes closer to your view about evaluating students for admission into a college or university—applicant should be admitted solely on the basis of merit, even if that results in few minority students being admitted (or) an applicant’s racial and ethnic background should be considered to help promote diversity on college campuses, even if that mean admitting some minority students who otherwise would not be admitted?
“Solely on merit … 2016 … 70”
“Racial/Ethnic background should be considered … 2016 … 26”
|
Evaluating Students for College Admissions |
Non-Hispanic Whites |
Non-Hispanic Blacks |
Hispanics |
|
Admit applicants solely on merit |
76 |
50 |
61 |
|
Take race/ethnicity into account |
22 |
44 |
29 |
…
Survey Methods
Results for this Gallup poll are based on telephone interviews conducted June 7–July 1, 2016, with a sample of 3,270 adults, aged 18 and older, living in all 50 U.S. states and the District of Columbia, who had previously been interviewed in the Gallup Daily tracking poll and agreed to be re-interviewed for a later study. The sample is weighted to be representative of U.S. adults.
[449] Article: “In U.S., Most Reject Considering Race in College Admissions.” By Jeffrey M. Jones. Gallup, July 24, 2013. <www.gallup.com>
Do you generally favor or oppose affirmative action programs for racial minorities?
|
Group |
Favor |
Oppose |
|
National Adults |
58 |
37 |
|
Whites |
51 |
44 |
|
Blacks |
76 |
20 |
|
Hispanics |
69 |
25 |
…
Results for this Gallup poll are based on telephone interviews conducted June 13–July 5, 2013, with a random sample of 4,373 adults, aged 18 and older, living in all 50 U.S. states and the District of Columbia, including oversamples of black and Hispanic adults. The total sample is weighted to represent racial and ethnic groups proportionately to their share of the population.
[450] Article: “In U.S., Most Reject Considering Race in College Admissions.” By Jeffrey M. Jones. Gallup, July 24, 2013. <www.gallup.com>
Take Race Into Account in College Admissions? …
|
Group |
Solely on Merit |
Consider Race |
|
U.S. Adults |
67 |
28 |
|
Whites |
75 |
22 |
|
Blacks |
44 |
48 |
|
Hispanics |
59 |
31 |
…
Results for this Gallup poll are based on telephone interviews conducted June 13–July 5, 2013, with a random sample of 4,373 adults, aged 18 and older, living in all 50 U.S. states and the District of Columbia, including oversamples of black and Hispanic adults. The total sample is weighted to represent racial and ethnic groups proportionately to their share of the population.
[451] Article: “In U.S., Most Reject Considering Race in College Admissions.” By Jeffrey M. Jones. Gallup, July 24, 2013. <www.gallup.com>
Americans may be less likely to support affirmative action in college admissions because the question raises a potential specific consequence of such programs—admitting some minority students who would otherwise not be admitted on their merits alone—which could in their minds outweigh the positive aspects of the policy mentioned in the question. The general question on affirmative action, asked prior to the question on college admissions, does not discuss any pros or cons of affirmative action, suggesting Americans mostly have a positive reaction to the concept or term. …
… One of the clearest examples of affirmative action in practice is colleges’ taking into account a person’s racial or ethnic background when deciding which applicants will be admitted. …
[452] “2020 Democratic Party Platform.” 2020 Platform Committee, August 17, 2020. <www.presidency.ucsb.edu>
Democrats are committed to standing up to racism and bigotry in our laws, in our culture, in our politics, and in our society, and recognize that race-neutral policies are not sufficient to rectify race-based disparities. We will take a comprehensive approach to embed racial justice in every element of our governing agenda, including in jobs and job creation, workforce and economic development, small business and entrepreneurship, eliminating poverty and closing the racial wealth gap, promoting asset building and homeownership, education, health care, criminal justice reform, environmental justice, and voting rights. Democrats will ensure federal data collection and analysis is adequately funded and designed to allow for disaggregation by race and ethnicity, among other important factors, to better design policies to address the needs of the most vulnerable communities and make informed policy choices. …
We will restore and build on the Obama-Biden Administration’s Fair Pay and Safe Workplaces policy, and use the purchasing power of the federal government to incentivize private companies to recruit and advance people of color, women, people with disabilities, and veterans.
[453] “Resolution Regarding the Republican Party Platform.” Republican National Committee, August 22, 2020. <prod-cdn-static.gop.com>
WHEREAS, All platforms are snapshots of the historical contexts in which they are born, and parties abide by their policy priorities, rather than their political rhetoric …
RESOLVED, That the 2020 Republican National Convention will adjourn without adopting a new platform until the 2024 Republican National Convention.
[454] “2016 Republican Party Platform.” Republican National Committee, July 2016. <www.presidency.ucsb.edu>
Page 9:
We reaffirm the Constitution’s fundamental principles: limited government, separation of powers, individual liberty, and the rule of law. We denounce bigotry, racism, anti-Semitism, ethnic prejudice, and religious intolerance. Therefore, we oppose discrimination based on race, sex, religion, creed, disability, or national origin and support statutes to end such discrimination. As the Party of Abraham Lincoln, we must continue to foster solutions to America’s difficult challenges when it comes to race relations today. We continue to encourage equality for all citizens and access to the American Dream. Merit and hard work should determine advancement in our society, so we reject unfair preferences, quotas, and set-asides as forms of discrimination. Our ranks include Americans from every faith and tradition, and we respect the right of each American to follow his or her deeply held beliefs.
[455] “2000 Democratic National Platform: Prosperity, Progress, and Peace.” Democratic National Committee, August 14, 2000. <www.presidency.ucsb.edu>
Page 36:
Fighting for Civil Rights and Inclusion.
Passage of the Civil Rights Act of 1964 was one of the proudest moments of our nation’s history and a sterling testament to our aspirations as a people. Yet, despite undeniable progress over the last several decades, inequality and polarization nevertheless persist in far too many American workplaces, schools, and communities. Over the last eight years, we have fought hard to end discrimination. We have increased funding for civil rights enforcement—so that the laws on our books are not just pleasant words, but pledges of justice. Al Gore has strongly opposed efforts to roll back affirmative action programs. He knows that the way to lift this nation up is not by pulling the weakest down, but by continuing to expand opportunities for everyone who wants to achieve. The Clinton-Gore Administration has appointed the most diverse administration in American history, demonstrating that pursuing excellence means including the all of the best that our nation has to offer.
[456] “2000 Republican Party Platform.” Republican National Committee, July 31, 2000. <www.presidency.ucsb.edu>
We believe rights inhere in individuals, not in groups. We will attain our nation’s goal of equal opportunity without quotas or other forms of preferential treatment. It is as simple as this: No one should be denied a job, promotion, contract, or chance at higher education because of their race or gender. Equal access, energetically offered, should guarantee every person a fair shot based on their potential and merit.
[457] Report: “Racial Disparities in Education Finance: Going Beyond Equal Revenues.” By Kim Rueben and Sheila Murray. Urban Institute, November 2008. <www.taxpolicycenter.org>
Page 1:
In the past, because public schools were funded largely by local property taxes, property-rich and -poor school districts differed greatly in expenditures per pupil. Since the early 1970s, however, state legislatures have, on their own initiative or at the behest of state courts, implemented school finance equalization programs to reduce the disparity in within-state education spending. …
Since the 1990s, many of the challenges to state finance systems have focused on ensuring that all students have equitable access to adequate educational opportunities as required by state education clauses (Minorini and Sugarman 1999). The argument is that some districts do not provide students with an adequate education and that it is the state’s responsibility to see that districts receive the funding to enable them to do so. The remedy might require some districts to spend more (perhaps significantly more) than other districts, depending on their student population. For example, in districts with many students from low-income families and families where English is not the first language, an “adequate education” may cost more money, and the state is required to ensure that these needs are met.
[458] “How Schools Work & How to Work with Schools: A Primer for Those Who Want to Serve Children and Youth in Schools.” National Association of State Boards of Education, 2014. <www.cdc.gov>
Page 13:
At the local level, most funds for K–12 public schools are raised through local taxes on private property. Although a local property tax is a fairly stable source of funding, disparities in local wealth often directly affect the funds available to schools, reflected in the disparities in per student spending within and between school districts. Even if voters choose to tax themselves at a relatively high rate, low community property values can mean inadequate resources for schools.
Many states have taken the initiative or have been forced by legal challenges to address these inequities in education funding, which compromise the guarantee found in state constitutions that all students have equal access to an adequate public education. States have adopted ballot measures, such as California’s Proposition 98 and 111, to ensure funding equity, or have raised funds from lotteries and other mechanisms, or redistributed locally raised taxes through legislative means to help ensure equity in funding.
[459] Report: “Do Districts Enrolling High Percentages of Minority Students Spend Less?” By Thomas Parrish. U.S. Department of Education, National Center for Education Statistics, December 1996. <nces.ed.gov>
Figure 1 shows expenditures for four categories of school districts by the percentage of minority students enrolled. Each of these four categories of school districts represents about 25 percent of the nation’s public school children. Figure 1 shows that on average, during the 1989–90 school year, spending was fairly equal across school districts with less than 50 percent minority enrollment. However, districts in which 50 percent or more of the students enrolled were racial minorities spent more than those districts with less than 50 percent minority enrollment. For example, the average expenditure differential between districts with the highest and the lowest percentage of minority students was $431 per student ($5,474 versus $5,043).
Figure 1. Education Expenditures in the United States in Relation to Percentage of Minority Enrollment (1989–90)
School Districts by Percentage of Minority Enrollment; Expenditures per Student
Less than 5% [=] $5,043
5% – <20% [=] $5,169
20% – <50% [=] $5,071
50% or more [=] $5,474 …
In terms of “buying power” in school year 1989–90, districts with the highest percentages of minority students spent $286 less on public education per year than did districts with the lowest percentages of minority students ($4,103 vs. $4,389 per student) (figure 2). This change in direction occurs because school districts enrolling high percentages of minority students are more likely to be located in high-cost urban centers and to serve substantial numbers of students with special needs, thereby reducing the “buying power” of the dollars received.
Figure 2. Education “buying power” in the United States in Relation to Percentage of Minority Enrollment (1989–90)
Less than 5% [=] $4,389
5% – <20% [=] $4,350
20% – <50% [=] $4,190
50% or more [=] $4,103
[460] Book: Generational Change: Closing the Test Score Gap. Edited by Paul E. Peterson. Rowman & Littlefield, 2006.
Chapter 2: “How Families and Schools Shape the Achievement Gap.” By Derek Neal (University of Chicago and National Bureau of Economic Research). Pages 26–46.
Pages 32, 44:
Under the assumption that spending per student does not vary by race within a school district, the combination of school district data on per-pupil expenditure and school-level data on the racial composition of students provides information on average per pupil spending by public schools on black and white students. Given several different definitions of average expenditure, average spending per black student in public schools ranged from roughly $100 to $500 more than the corresponding figure for white students in 2001.15 These data provide suggestive but not definitive evidence concerning racial differences in resources provided to public schools. …
15 The data come from two Common Core of Data files: the Local (School District) Education Financial Survey and the Public Elementary/Secondary School Data. I calculated averages based on just educational expenditures as well as total expenditures. I also examined the sensitivity of results to the inclusion of allocated data.
[461] Report: Racial Disparities in Education Finance: Going Beyond Equal Revenues.” By Kim Rueben and Sheila Murray. Urban Institute, November 2008. <www.taxpolicycenter.org>
Page 1:
In the past, because public schools were funded largely by local property taxes, property-rich and -poor school districts differed greatly in expenditures per pupil. Since the early 1970s, however, state legislatures have, on their own initiative or at the behest of state courts, implemented school finance equalization programs to reduce the disparity in within-state education spending. …
Since the 1990s, many of the challenges to state finance systems have focused on ensuring that all students have equitable access to adequate educational opportunities as required by state education clauses (Minorini and Sugarman 1999). The argument is that some districts do not provide students with an adequate education and that it is the state’s responsibility to see that districts receive the funding to enable them to do so. The remedy might require some districts to spend more (perhaps significantly more) than other districts, depending on their student population. For example, in districts with many students from low-income families and families where English is not the first language, an “adequate education” may cost more money, and the state is required to ensure that these needs are met.
Page 5:
To examine spending patterns across different populations of students, we compared average per pupil spending across districts weighted by the number of students in each racial or ethnic group. In general, differences in spending per pupil in districts serving nonwhite and white students are very small. In 1972, the ratio of nonwhite to white spending was .98; this trend had reversed by 1982, as spending per pupil for nonwhite students was slightly higher than for white students in most states and in the United States as a whole and has been for the past 20 years (figure 2). Table 2 presents spending per pupil figures for 2002 weighted by the number of students in each subgroup.
Page 7:
The results presented thus far need to be considered with a few caveats. These ratios do not reflect that the costs of educating students of different groups differ and that minority students are often found in urban districts that have higher cost structures. … In addition, although spending differences have lessened between districts, it is unclear whether inequities are lessened at the school level.
[462] Report: “The Myth of Racial Disparities in Public School Funding.” By Jason Richwine. Heritage Foundation, April 20, 2011. <thf_media.s3.amazonaws.com>
Page 2:
One of the more rigorous reports on funding disparities was published by the Urban Institute.11 The authors of the study combined district-level spending data with the racial and ethnic composition of schools within districts. … This paper employs a similar methodology, using 2006–2007 datasets from the U.S. Department of Education to examine school funding at both the national and regional levels.
Page 3:
Because the cost of living varies across the U.S., school expenditures are not always directly comparable. In areas with a lower cost of living, the same amount of money can buy more resources than in high-cost areas. To account for this difference, the NCES [U.S. Department of Education, National Center for Education Statistics] calculates a Comparable Wage Index (CWI) for each school district based on the average non-teacher wage in the district’s labor market. …
Cost adjustments should be regarded cautiously. Living expenses can still vary within markets, sometimes considerably. The District of Columbia, for example, is a high-expense city overall, but its poorest (and mostly black and Hispanic) sections have a lower cost of living than the white sections. While the raw data are likely to overstate the minority school funding advantage, the adjusted data probably understate it.
Page 4:
Public Education Spending by Race and Ethnic Group
Per-Pupil Spending; % of White Per-Pupil Spending; Adjusted
for Cost of Living
White; $10,816; 100%, 100%
Black; $11,387; 105%; 101%
Hispanic; $10,951; 101%; 96%
Asian; $11,535; 107%; 97%
[463] “How Schools Work & How to Work With Schools: A Primer For Those Who Want To Serve Children and Youth In Schools.” National Association of State Boards of Education, 2014. <www.cdc.gov>
Page 2:
Educators often say, “to know one school is to know one school.” Indeed, the education system is widely variable and causes confusion at many levels. This guide is intended to assist anyone who would like to work more closely with various facets of the education system—with policymakers, school administrators, teachers, and other school staff—to improve the health, safety, and well-being of children and youth in schools.
Page 12: “Because schools are decentralized, there are very few generalities that exist for characterizing all school districts or schools. Distinct state, territorial, and tribal school systems differ in substantive ways, but often work in parallel, with different and overlapping laws and authorities.”
Page 21:
Most states delegate their authority for school control to the local level. The school district, also known as the local education agency (LEA), is the public school system’s primary unit of administration for a designated geographic area. There are more than 13,000 school districts across the United States, which sometimes overlap the boundaries of municipal governments. Furthermore, school district boundaries do not always correspond with those of other agencies and government jurisdictions. The size of districts varies considerably, both in terms of their geographical size and the number of students they serve. As shown in the chart below, the vast majority of school districts are small—more than 60 percent of districts have fewer than 5,000 students. However, more than half of America’s students are enrolled in fewer than 1,000 districts.26
Page 24:
All schools have a personality and character that is largely determined by and reflective of leadership, faculty and staff, and the community’s values. Ideally, schools are designed and operated to bring out the best in all students, helping them to develop and learn in an optimal environment.
The number of school districts in a given state also varies considerably across the country. Several states, such as Maryland and Florida, have districts that match the states’ counties, giving Maryland a total of 24 school districts. Next door in Pennsylvania there are 514 districts and nearby New Jersey has nearly 600. The trend throughout the 20th century was to consolidate small or remote school districts into larger units—in 1952 there were 69,725 school districts, more than five times as many as today. This trend continues, but at a much slower pace. The arguments in favor of consolidation (cost savings combined with capacity to provide additional courses and other services) are countered by fears of losing a community’s identity, loss of local control, and longer bus rides for some students if nearby schools are closed.27
In most districts, primary governing authority lies with the local school board. The school board generally establishes and implements the district’s guiding vision, makes budget decisions, chooses curriculum, and determines many policies that guide the daily decisions of the LEA and its schools. A few of the issues local school boards routinely address include:
• Local academic and graduation standards (if higher than the state);
• Equitable access to education for all students in the district;
• Resources for promoting academic achievement;
• Budget planning;
• Contract negotiations;
• Personnel decisions;
• School closures;
• School area redistricting;
• Transportation policies;
• Wellness policies or practices;
• Facilities construction;
• Codes of conduct; and
• Emergency management procedures.
Local school boards can also serve as a body to mediate or arbitrate issues that cannot be resolved at the school level or that cut across several schools. Local districts are subject to state laws and policies that may direct, limit, or otherwise influence local policymaking and implementation. Local school boards have full fiscal authority, often with the ability to levy taxes.
Page 24:
No single, uniform model exists for a school’s organization by grade or age. The most commonly used model arranges schools by clusters of grades, for example elementary schools (comprised of grades K–5), middle schools (grades 6–8), and high schools (grades 9–12). However, several variations within this arrangement exist, clustering different grades together in different levels or even within a school. Schools, even within the same school district, may vary greatly in their arrangement of students, schedules, and teaching models; in one school in a district, students may get new teachers every year while in a neighboring school, teachers may “loop” with students through several or all grades. Some schools in a district may use a “year round” schedule, while the rest of the schools are on a traditional nine-month calendar. The district administrator and the school board typically make decisions regarding school structure. Schools in a district can also vary in quality and character. Characteristics of an effective school include:
• Strong administrative leadership;
• A clear school vision and mission;
• A safe and orderly climate that is conducive to learning;
• A welcoming staff and faculty that connect with students and make them feel valued;
• School-wide emphasis and commitment to learning for all;
• High teacher expectations for student achievement;
• Regular, periodic assessment;
• Active parent/family involvement;
• A commitment to addressing barriers to student learning; and
• Policies that are fair and equitable and are enforced consistently.28
All schools have a personality and character that is largely determined by and reflective of leadership, faculty and staff, and the community’s values. Ideally, schools are designed and operated to bring out the best in all students, helping them to develop and learn in an optimal environment. The principal is the key decision-maker at every school.
[464] Book: Comparative Public Policy and Citizen Participation: Energy, Education, Health and Urban Issues in the U.S. and Germany. Edited by Charles R. Foster. Pergamon Press, 1980.
Chapter 7: “Education As Loosely Coupled Systems in West Germany and the United States.” By Maurice A Garnier. Pages 87–98.
Page 93:
The concept of local control of schools is an old one in the United States and in England. While, in the United States, the legal authority for education is vested in the state, most states (with the exception of Hawaii) have delegated that responsibility to local authorities. Over the years, states have increased their role, particularly in matters of finance and teacher certification. Nevertheless, the American assumption is that communities constitute the unit most capable of running the schools. While the state may mandate that districts’ boundaries be redrawn, the notion that a particular state might be capable of running all schools within its boundaries is unthinkable in the American context. We will later examine the shortcomings of such a system, but in theory as well as in practice, American schools are locally run and the formal connections between school districts within the same state are virtually nonexistent (Wayland, 1973).
[465] Despite the fact that K–12 schools have been primarily run by local governments, the U.S. education system has become increasingly centralized over the past decades. For facts about his trend, visit Just Facts’ research on education centralization and decentralization.
[466] Webpage: “QuickFacts.” U.S. Census Bureau. Accessed August 17, 2020 at <www.census.gov>
Population estimates, July 1, 2019, (V2019) …
Race and Hispanic Origin
• White alone, percent (a) [=] 76.3%
• Black or African American alone, percent (a) [=] 13.4% …
• Hispanic or Latino, percent (b) [=] 18.5%
Value Notes …
Estimates are not comparable to other geographic levels due to methodology differences that may exist between different data sources. …
The vintage year (e.g., V2019) refers to the final year of the series (2010 thru 2019). Different vintage years of estimates are not comparable.
Fact Notes
(a) Includes persons reporting only one race
(b) Hispanics may be of any race, so also are included in applicable race categories
[467] Calculated with data from the report: “In Changing U.S. Electorate, Race and Education Remain Stark Dividing Lines.” Pew Research Center, June 2, 2020. <www.pewresearch.org>
“Party Identification Detailed Tables.” <docs.google.com>
NOTE: An Excel file containing the data and calculations is available upon request.
[468] Constructed with data from the report: “In Changing U.S. Electorate, Race and Education Remain Stark Dividing Lines.” Pew Research Center, June 2, 2020. <www.pewresearch.org>
Page 3: “Due to smaller sample sizes in 2018 and 2019, the data from those years has been combined in Chapter 1.”
“Party Identification Detailed Tables.” <docs.google.com>
NOTE: An Excel file containing the data is available upon request.
[469] Dataset: “Table 219.46. Public High School 4-Year Adjusted Cohort Graduation Rate (ACGR), by Selected Student Characteristics and State: 2010–11 Through 2018–19.” U.S. Department Of Education, National Center for Education Statistics, February 2021. <nces.ed.gov>
United States … Total, ACGR for all students … 2018–19 [=] 86 … ACGR for students with selected characteristics,1 2018–19 … White [=] 89 … Black [=] 80 … Hispanic [=] 82 … Asian/Pacific Islander5 … Total [=] 93 … American Indian/Alaska Native [=] 748 …
NOTE: The adjusted cohort graduation rate (ACGR) is the percentage of public high school freshmen who graduate with a regular diploma within 4 years of starting 9th grade. Students who are entering 9th grade for the first time form a cohort for the graduating class. This cohort is “adjusted” by adding any students who subsequently transfer into the cohort and subtracting any students who subsequently transfer out, emigrate to another country, or die. Values preceded by the “>=” symbol have been “blurred” (rounded) to protect student privacy. Race categories exclude persons of Hispanic ethnicity.
[470] “ACT Profile Report – National: Graduating Class 2020.” ACT, October 6, 2020. <www.act.org>
Page 20: “Table 3.3. Percent of Students Who Met College Readiness Benchmark Scores by Race/Ethnicity … All Four % … All Students [=] 26 … Black/African [=] 6 … American Indian/Alaska Native [=] 7 … White [=] 33 … Hispanic/Latino [=] 14 … Asian [=] 52 … Native Hawaiian/Other Pacific Islander [=] 12”
[471] Dataset: “Table 302.20. Percentage of Recent High School Completers Enrolled in College, by Race/Ethnicity: 1960 Through 2019.” U.S. Department Of Education, National Center for Education Statistics, August 2020. <nces.ed.gov>
“Percent of recent high school completers1 enrolled in college2 (annual data) … 20196 … Total [=] 66.2% … White [=] 68.0% … Black [=] 49.8% … Hispanic [=] 63.4% … Asian [=] 89.8”
[472] Dataset: “Table 326.20. Graduation Rate From First Institution Attended Within 150 Percent of Normal Time for First-Time, Full-Time Degree/Certificate-Seeking Students at 2-Year Postsecondary Institutions, by Race/Ethnicity, Sex, and Control of Institution: Selected Cohort Entry Years, 2000 Through 2000 Through 2016.” U.S. Department Of Education, National Center for Education Statistics, August 2020. <nces.ed.gov>
“Percent graduating with a certificate or associate’s degree within 150 percent of normal time … All 2-year institutions … 2016 entry cohort … Total [=] 33.5% … White [=] 36.0% … Black [=] 28.5% … Hispanic [=] 31.6% … Asian [=] 40.1 … American Indian/Alaska Native [=] 27.1 … Two or more races [=] 28.1”
[473] Dataset: “Table 326.10. Graduation Rate From First Institution Attended for First-Time, Full-Time Bachelor’s Degree- Seeking Students at 4-Year Postsecondary Institutions, by Race/Ethnicity, Time to Completion, Sex, Control of Institution, and Acceptance Rate: Selected Cohort Entry Years, 1996 Through 1996 Through 2013.” U.S. Department Of Education, National Center for Education Statistics, August 2020. <nces.ed.gov>
“Graduating within 6 years after start, males and females … All 4-year institutions … 2013 entry cohort … Total [=] 63.4% … White [=] 66.6% … Black [=] 44.3% … Hispanic [=] 57.8% … Asian [=] 76.1 … American Indian/Alaska Native [=] 40.8 … Two or more races [=] 59.3”
[474] Report: “The Literacy of America’s College Students.” By Justin D. Baer, Andrea L. Cook, and Stéphane Baldi. American Institutes for Research, January 2006. <www.air.org>
Page 4:
The NSACS [National Survey of America’s College Students], sponsored by The Pew Charitable Trusts, collected data from a sample of 1,827 graduating students at 80 randomly selected 2-year and 4-year colleges and universities (68 public and 12 private) from across the United States. The NSACS specifically targeted college and university students nearing the end of their degree program, thus providing a broader and more comprehensive picture of students’ fundamental literacy abilities than ever before.
The NSACS used the same assessment instrument as the 2003 National Assessment of Adult Literacy (NAAL), a nationally representative survey of the English-language literacy abilities of U.S. adults 16 and older residing in households or prisons. The NAAL was developed and administered by the U.S. Department of Education’s National Center for Education Statistics (NCES). Literacy levels were categorized as Below Basic, Basic, Intermediate, or Proficient on the basis of the abilities of participants.
Because literacy is not a single skill used in the same manner for all types of printed and written information, the NSACS measured literacy along three dimensions: prose literacy, document literacy, and quantitative literacy. These three literacy domains were designed to capture an ordered set of information-processing skills and strategies that adults use to accomplish a wide range of literacy tasks and make it possible to profile the various types and levels of literacy among different subgroups in society.
[475] Report: “The Literacy of America’s College Students.” By Justin D. Baer, Andrea L. Cook, and Stéphane Baldi. American Institutes for Research, January 2006. <www.air.org>
Page 4: “Prose Literacy: The knowledge and skills needed to perform prose tasks, that is, to search, comprehend, and use information from continuous texts. Prose examples include editorials, news stories, brochures, and instructional materials.”
Page 21: “Table 2.2. Percentage of U.S. adults in college and the nation in each prose literacy level, by selected characteristics”
[476] Report: “The Literacy of America’s College Students.” By Justin D. Baer, Andrea L. Cook, and Stéphane Baldi. American Institutes for Research, January 2006. <www.air.org>
Page 4: “Document Literacy: The knowledge and skills needed to perform document tasks, that is, to search, comprehend, and use information from noncontinuous texts in various formats. Document examples include job applications, payroll forms, transportation schedules, maps, tables, and drug or food labels.”
Page 22: “Table 2.3. Percentage of U.S. adults in college and the nation in each document literacy level, by selected characteristics”
[477] Report: “The Literacy of America’s College Students.” By Justin D. Baer, Andrea L. Cook, and Stéphane Baldi. American Institutes for Research, January 2006. <www.air.org>
Page 4: “Quantitative Literacy: The knowledge and skills required to perform quantitative literacy tasks, that is, to identify and perform computations, either alone or sequentially, using numbers embedded in printed materials. Quantitative examples include balancing a checkbook, figuring out a tip, completing an order form, or determining the amount of interest on a loan from an advertisement.”
Page 23: “Table 2.4. Percentage of U.S. adults in college and the nation in each quantitative literacy level, by selected characteristics”
[478] Report: “The Literacy of America’s College Students.” By Justin D. Baer, Andrea L. Cook, and Stéphane Baldi. American Institutes for Research, January 2006. <www.air.org>
Page 5: “The literacy of students in 4-year public institutions was comparable to the literacy of students in 4-year private institutions.”
Page 30: “Prose literacy was higher for students in selective 4-year colleges, though differences between selective and nonselective 4-year colleges for document and quantitative literacy could not be determined because of the sample size.”
Page 34:
College students come from a variety of economic backgrounds, with some students supporting themselves and others relying on their families to pay for tuition and other necessities.1 Despite variations in income, most differences in the literacy of students across income groups were not significant (Table 4.1).
1 Students were asked whether they were financially independent or whether they were financially dependent on their parents. Depending on their answer, they were asked to report either their parents’ household income or their personal income. The financial information was combined to create a single measure of personal or parents’ household income.
[479] Report: “The Literacy of America’s College Students.” By Justin D. Baer, Andrea L. Cook, and Stéphane Baldi. American Institutes for Research, January 2006. <www.air.org>
Page 35: “Table 4.1. Average prose, document, and quantitative literacy scores for U.S. adults in 2- and 4-year colleges, by income.”
[480] Article: “Brooklyn School Scores High Despite Poverty.” By Sharon Otterman. New York Times, April 25, 2010. <www.nytimes.com>
… 80 percent of its students are poor enough to qualify for free lunch, nearly a quarter receive special education services, and many among its predominately Hispanic population do not speak English at home.
In 2009, the 580-student primary school … topped the city with its fourth-grade math scores, with all students passing, all but one with a mark of “advanced,” or Level 4. In English, all but one of 75 fourth graders passed, earning a Level 3 or 4, placing it among the city’s top dozen schools.
On average, at schools with the same poverty rate, only 66 percent of the students pass the English test, and 29 percent score at an advanced level in math….
… [T]he school’s cost per pupil, in fact, is lower than the city’s average. … While about one-third of the students are still learning English, there are no bilingual classes.
[481] Article: “Brooklyn School Scores High Despite Poverty.” By Sharon Otterman. New York Times, April 25, 2010. <www.nytimes.com>
“The school’s approach, while impressive in its attention to detail, starts with a simple formula: ‘Teach, assess, teach, assess,’ said Jack Spatola, its principal since 1984.”
[482] Report: “Time To Move On: African-American and White Parents Set an Agenda for Public Schools.” By Steve Farkas and Jean Johnson. Public Agenda, 1998. <www.publicagenda.org>
Page 7:
Time to Move On gives voice to the aspirations and concerns of African-American and white parents who hope to secure a good education for their children in today’s schools. It reports the results of in-depth telephone surveys of 800 black parents and 800 white parents, as well as findings from focus groups and individual interviews with parents and public education professionals. (See Methodology for additional details.)
Pages 15–16:
If African-American parents believe black students sometimes pay a price when taught by whites, why are they reluctant to support an effort to improve the odds of hiring black educators? For one thing, black parents believe—and white parents concur—that when race becomes a prevailing consideration in education, the public schools’ attention is diverted from what ought to be their top priority: academics.
And both groups cite integration efforts as an example: 73% of blacks and 77% of whites agree that “too often, the schools work so hard to achieve integration that they end up neglecting their most important goal—teaching kids,” with half of both groups strongly agreeing. “We’ve spent a lot of time on the race issues, and we need to redirect some of those energies to getting our children better educated,” said an African-American parent in Pennsylvania. A Cleveland parent recalled the recent past when her district made serious commitments to integration: “The books and the materials weren’t getting to the classrooms; the money wasn’t being spent on the kids.”
Page 44:
Telephone interviews were conducted among randomly selected households with parents or guardians of children in kindergarten through 12th grade, in either public or private school, from March 26 to April 17, 1998. Interviews were approximately 30 minutes in length. The 800 white parents were selected through a standard random-digit dialing (RDD) technique whereby every household in the continental United States, including those with unlisted numbers, had an equal chance of being contacted.
The sample of 800 African-American parents was gathered in the following way: 745 calls were completed by dialing numbers in targeted exchanges. Census data were used to identify telephone exchanges in areas with a 12% or higher density of black households. These exchanges cover 77% of the black households estimated in the U.S.; households were contacted randomly within these exchanges and only black parents were accepted for the survey.
The remaining 55 interviews were completed from the RDD sample.
The margin of error for both black and white parents surveyed is plus or minus 3%.
[483] Report: “Documentation to the NCES Common Core of Data Public Elementary/Secondary School Universe Survey: School Year 2010–11, Version Provisional 2a.” U.S. Department Of Education, National Center for Education Statistics, September 2012. <nces.ed.gov>
Page C-3: “Charter School A school providing free public elementary and/or secondary education to eligible students under a specific charter granted by the state legislature or other appropriate authority, and designated by such authority to be a charter school.”
[484] Ruling: Zelman v. Simmons-Harris. U.S. Supreme Court, June 27, 2002. Decided 5–4. Majority: Rehnquist, O’Connor, Scalia, Kennedy, Thomas. Dissenting: Stevens, Souter, Ginsburg, and Breyer. <caselaw.findlaw.com>
Majority: “Magnet schools are public schools operated by a local school board that emphasize a particular subject area, teaching method, or service to students.”
[485] Handbook of Research on School Choice. Edited by Mark Berends and others. Routledge, 2009.
Page xvii:
In the lower-right quadrant are charter schools. They are government-funded but governed and operated by private boards. The aim of charter-enabling state legislation is to promote educational diversity, effectiveness, and accountability. Charter boards may appoint their own staff or hire nonprofit or for-profit management organizations.
The extent to which charter schools are freed from conventional public school regulations and oversight varies substantially from state to state, but in all cases charter schools are accountable to their chartering authority for student achievement and progress. From their beginnings, charter schools were subject to closure for poor achievement performance, but now, if traditional public schools repeatedly fail to improve student achievement, they are also subject to NCLB [No Child Left Behind Act] sanctions and eventual closure or other means of restructuring.
[486] Book: The Education Gap: Vouchers and Urban Schools (Revised edition). By William G. Howell and Paul E. Peterson with Patrick J. Wolf and David E. Campbell. Brookings Institution Press, 2006 (first published in 2002). <www.brookings.edu>
Page 11:
The first major choice initiative emerged from the conflicts surrounding desegregation in the 1960s. So unpopular was compulsory busing with many Americans that the magnet school was developed as an alternative way of increasing racial and ethnic integration. According to magnet school theory, families could be enticed into choosing integrated schools by offering them distinctive, improved education programs. Although the magnet idea was initially broached in the 1960s, it was not until after 1984 that the magnet school concept, supported by federal funding under the Magnet Schools Assistance program, began to have a national impact.
[487] Handbook of Research on School Choice. Edited by Mark Berends and others. Routledge, 2009.
Page xvi:
The questions raised here are simplified in that they group several distinctive forms of school choice into a single category of chosen schools. Consider some fundamental distinctions among the major forms of school choice represented in Table 1.1. The four-fold classification categorizes schools according to the possible combinations of school governance and operation on one hand and school funding on the other. As in the case of universities, these distinctions are hardly crisp. Public universities, for example, receive private tuition and donations. Sizable fractions of private universities’ research budgets come from the federal government. Still, these terms are common and offer useful starting points for discussion before turning to more precise operational definitions in the following sections and chapters.
In the lower-left cell of Table 1.1 are traditional public schools, which are government-funded and government-operated. Students within their boundaries are normally assigned to them, and they represent by far the largest number of American schools. In school choice research and policy deliberations, such traditional public schools, also called “neighborhood schools,” are often compared to choice schools such as charter and private schools, which may be near to or far from a student’s home. …
Page xvii:
Perhaps surprisingly, an estimated one million youngsters (see the homeschooling chapter in this book) are now schooled at home. (Again, such categorization isn’t precise since some primarily homeschooled students take supplementary classes and play sports in local public schools and colleges.)
Also in the upper-right quadrant are for-profit tutoring and schooling. When families believe they lack the knowledge, skills, time, or desire to provide homeschooling, yet want things that they think the public schools do not adequately provide, they may voluntarily choose to pay for private tutoring. At least in part, East Asia’s thriving private tutoring sector is often credited for that region’s top scores on international achievement tests. Private tutoring is also popular with East Asian immigrants to the United States, whose children tend to be highly successful students. ….
The NCLB [No Child Left Behind] legislation has also accelerated the growth of for-profit companies, called educational management organizations, which operate schools for school districts and charter boards. They contract with local school districts to take over repeatedly failing public schools.
Non-profit private schools, both independent and sectarian, are a long-standing form of privately-funded and privately-operated choice. Parents place such value on the education and circumstances private schools offer that they pay the tuition to send their children to them. “Public vouchers” provide full or partial tuition at public expense to enable families, often poor and urban, to send their children to these schools. In more than 50 cities, “private vouchers” support such families with contributions from firms and wealthy individuals.
In the lower-right quadrant are charter schools. They are government-funded but governed and operated by private boards. The aim of charter-enabling state legislation is to promote educational diversity, effectiveness, and accountability. Charter boards may appoint their own staff or hire nonprofit or for-profit management organizations. …
Magnet schools arose in response to court-ordered racial desegregation plans that required involuntary bussing of students away from their racially isolated schools to maintain school racial percentages close to their overall district’s percentages. …
The upper left quadrant refers to rare schools that are privately operated with the partial or complete financial support of government, either for the school or for individual student tuition. An example is the provision made for autistic, severely physically handicapped, and other types of students with low-incidence, very special needs. Small districts that have insufficient numbers of such students to justify special schools may pay private schools within or outside their boundaries to educate them.
[488] Paper: “Better Schools, Less Crime?” By David J. Deming. Quarterly Journal of Economics, November 2011. Pages 2063–2115. <scholar.harvard.edu>
Page 2064:
In this article, I link a long and detailed panel of administrative data from Charlotte-Mecklenburg school district (CMS) to arrest and incarceration records from Mecklenburg County and the North Carolina Department of Corrections (NCDOC). In 2002, CMS implemented a district-wide open enrollment school choice plan. Slots at oversubscribed schools were allocated by random lottery. School choice in CMS was exceptionally broad-based.
Page 2065:
Across various schools and for both middle and high school students, I find consistent evidence that winning the lottery reduces adult crime.4 The effect is concentrated among African American males and youth who are at highest risk for criminal involvement. Across several different outcome measures and scalings of crime by severity, high-risk youth who win the lottery commit about 50% less crime. They are also more likely to remain enrolled and “on track” in school, and they show modest improvements on school-based behavioral outcomes such as absences and suspensions. However, there is no detectable impact on test scores for any youth in the sample.
Page 2070: “With over 150,000 students enrolled in the 2008–2009 school year, CMS is the 20th largest school district in the nation.”
Pages 2089–2090:
In Figure II, we see that winning the lottery leads to fewer felony arrests overall (p = .078), and the effect is concentrated among the highest risk youth (0.77 felony arrests for lottery losers, 0.43 for winners, p = .013). Similarly, the trimmed social cost of crime is lower overall for lottery winners (p = .040), but the effect is concentrated among the top risk quintile youth ($11,000 for losers, $6,389 for winners, p=.036). The concentration of effects in the top risk quintile is even more pronounced for the middle school sample. The social cost of arrested crimes is $12,500 for middle school lottery losers and $4,643 for winners (p = .020), and the effect for days incarcerated is similarly large and concentrated among high-risk youth (55.5 days for losers, 17.2 for winners, p = .003).
NOTE: Credit for bringing this paper to the attention of Just Facts belongs to Alex Adrianson of the Heritage Foundation. [Commentary: “School Choice a Crime Fighter.” By Alex Adrianson. InsiderOnline, March 2012. <www.insideronline.org>]
[489] “WWC Review of the Report ‘Better Schools, Less Crime?’ ” U.S. Department Of Education, Institute of Education Sciences, What Works Clearinghouse, July 2013. <ies.ed.gov>
Page 2:
The research described in this report meets WWC [What Works Clearinghouse] evidence standards without reservations.
Strengths: The intervention and comparison groups were formed by a well-implemented random process.
Cautions: The study had high levels of attrition for one outcome, the 2004 reading score. The study author demonstrated that students in the intervention and comparison groups were equivalent at baseline on reading achievement. Therefore, the analysis for this outcome meets WWC standards with reservations.
[490] For facts about the importance of using experimental studies to determine the effects of public policies, see the introductory notes of Just Facts’ research on education.
[491] For facts about the importance of using experimental studies to determine the effects of public policies, see the introductory notes of Just Facts’ research on education.
[492] The following footnotes contain the primary sources of all experimental (or quasi-experimental) school choice studies known to Just Facts. The studies are arranged from newest to oldest. To locate and sort through these studies, Just Facts:
Obviously no literature review can ever be totally sure that it hasn’t overlooked something. That is why we lay out in the report the procedure we use to check our knowledge. We start with what we know of, then we use the procedure (which is described in the report) to search for any studies we don’t know about. However, that having been said, the amount of empirical scientific research on school choice programs is not very great, and the world of people who publish and discuss this research professionally is small, so it is unlikely that something as important as a random-assignment study could come out and not be noticed by the entire field.§
NOTES:
[493] Paper: “School Vouchers and Student Outcomes: Experimental Evidence from Washington, DC.” By Patrick J. Wolf and others. Journal of Policy Analysis and Management, Spring 2013. Pages 246–270. <onlinelibrary.wiley.com>
Abstract:
Here we examine the empirical question of whether or not a school voucher program in Washington, DC, affected achievement or the rate of high school graduation for participating students. The District of Columbia Opportunity Scholarship Program (OSP) has operated in the nation’s capital since 2004, funded by a federal government appropriation. Because the program was oversubscribed in its early years of operation, and vouchers were awarded by lottery, we were able to use the “gold standard” evaluation method of a randomized experiment to determine what impacts the OSP had on student outcomes. Our analysis revealed compelling evidence that the DC voucher program had a positive impact on high school graduation rates, suggestive evidence that the program increased reading achievement, and no evidence that it affected math achievement.
Page 258: “Results are described as statistically significant or highly statistically significant if they reach the 95 percent or 99 percent confidence level, respectively.”
Page 260:
The attainment impact analysis revealed that the offer of an OSP scholarship raised students’ probability of graduating from high school by 12 percentage points (Table 3). The graduation rate was 82 percent for the treatment group compared to 70 percent for the control group. The impact of using a scholarship was an increase of 21 percentage points in the likelihood of graduating. The positive impact of the program on this important student outcome was highly statistically significant.
Page 261:
We observed no statistically significant evidence of impacts on graduation rates at the subgroup level for students who applied to the program from non-SINI [schools in need of improvement] schools, with relatively lower levels of academic performance, and male students. For all subgroups, the graduation rates were higher among the treatment group compared with the control group, but the differences did not reach the level of at least marginal statistical significance for these three student subgroups. …
Our analysis indicated a marginally statistically significant positive overall impact of the program on reading achievement after at least four years. No significant impacts were observed in math. The reading test scores of the treatment group as a whole averaged 3.9 scale score points higher than the scores of students in the control group, equivalent to a gain of about 2.8 months of additional learning. The calculated impact of using a scholarship was a reading gain of 4.8 scale score points or 3.4 months of additional learning (Table 4).
Page 262:
Reading … Adjusted impact estimate [=] 4.75 … p-value of estimates [=] .06 …
The reading impacts appeared to cumulate over the first three years of the evaluation, reaching the marginal level of statistical significance after two years and the standard level after three years. By that third-year impact evaluation, only 85 of the 2,308 students in the evaluation (3.7 percent) had graded-out of the impact sample, having exceeded 12th grade. Between the third-year and final-year evaluation, an additional 211 students (12.2 percent) graded-out of the sample, reducing the final test score analytic sample to a subgroup of the original analytic sample. Due to this loss of cases for the final test score analysis, the confidence interval around the final point estimates is larger than it was after three years, and the positive impact of the program on reading achievement was only statistically significant at the marginal level.
Page 266: “Here, in the form of the DC school voucher program, Congress and the Obama administration uncovered what appears to be one of the most effective urban dropout prevention programs yet witnessed.”
Page 267: “We did find evidence to suggest that scholarship use boosted student reading scores by the equivalent of about one month of additional learning per year. Most parents, especially in the inner city, would welcome such an improvement in their child’s performance.”
[494] Paper: “Private School Vouchers and Student Achievement: A Fixed Effects Quantile Regression Evaluation.” By Carlos Lamarche. Labour Economics, August 2008. Pages 575–590. <doi.org>
Page 575:
Fundamental to the recent debate over school choice is the issue of whether voucher programs actually improve students’ academic achievement. Using newly developed quantile regression approaches, this paper investigates the distribution of achievement gains in the first school voucher program implemented in the US. We find that while high-performing students selected for the Milwaukee Parental Choice program had a positive, convexly increasing gain in mathematics, low-performing students had a nearly linear loss. However, the program seems to prevent low-performing students from having an even bigger loss experienced by students in the public schools.
[495] Book: Learning From School Choice. Edited by Paul E. Peterson and Bryan C. Hassel. Brookings Institution, 1998.
Chapter 13: “School Choice in Milwaukee: A Randomized Experiment.” By Jay P. Greene, Paul E. Peterson, and Jiangtao Du. Pages 342–363. <www.brookings.edu>
Page 354: “The results from the Milwaukee choice program reported here are, to the best of our knowledge, the first to estimate from a randomized experiment the comparative achievement effects of public and private schools.”
Pages 346–347:
The Milwaukee choice program, initiated in 1990, provided vouchers to a limited number of students from low-income families to be used to pay tuition at their choice of secular private schools in Milwaukee. …
The number of producers was restricted by the requirement that no more than half of a school’s enrollment could receive vouchers. …
Consumer choice was further limited by excluding the participation of religious schools (thereby precluding use of approximately 90 percent of the private school capacity within the city of Milwaukee). Co-production was also discouraged by prohibiting families from supplementing the vouchers with tuition payments of their own. (But schools did ask families to pay school fees and make voluntary contributions.) Other restrictions also limited program size. Only 1 percent of the Milwaukee public schools could participate, and students could not receive a voucher unless they had been attending public schools or were not of school age at the time of application.
These restrictions significantly limited the amount of school choice that was made available. Most choice students attended fiscally constrained institutions with limited facilities and poorly paid teachers.
Page 352:
The estimated effects of choice schools on mathematics achievement were slight for the first two years students were in the program. But after three years of enrollment students scored 5 percentile points higher than the control group; after four years they scored 10.7 points higher. These differences between the two groups three and four years after their application to choice schools are .24 and .51 standard deviation of the national distribution of math test scores, respectively. They are statistically significant at accepted confidence levels.51 Differences on the reading test were between 2 and 3 percentile points for the first three years and increased to 5.8 percentile points in the fourth. The results for the third and fourth years are statistically significant when the two are jointly estimated.52
Page 356:
The consistency of the results is noteworthy. Positive results were found for all years and for all comparisons except one. The results reported in the main analysis for both math and reading are statistically significant for students remaining in the program for three to four years when these are jointly estimated.
These results after three and four years are moderately large, ranging from . 1 of a standard deviation to as much as .5 of a standard deviation. Studies of educational effects interpret effects of .1 standard deviation as slight, effects of .2 and .3 standard deviation as moderate, and effects of .5 standard deviation as large.54 Even effects of .1 standard deviation are potentially large if they accumulate over time.” The average difference in test performances of whites and minorities in the United States is one standard deviation.56
[496] Paper: “Private School Vouchers and Student Achievement: An Evaluation of the Milwaukee Parental Choice Program.” By Cecilia Elena Rouse. Quarterly Journal of Economics, May 1998. Pages 553–602. <faculty.smu.edu>
Page 553:
In 1990 Wisconsin began providing vouchers to a small number of low-income students to attend nonsectarian private schools. Controlling for individual fixed-effects, I compare the test scores of students selected to attend a participating private school with those of unsuccessful applicants and other students from the Milwaukee public schools. I find that students in the Milwaukee Parental Choice Program had faster math score gains than, but similar reading score gains to, the comparison groups. The results appear robust to data imputations and sample attrition, although these deficiencies of the data should be kept in mind when interpreting the results.
Page 554:
In 1990 Wisconsin became the first state in the country to implement a school choice program that provides vouchers to low-income students to attend nonsectarian private schools.2 The number of students in any year was originally limited to 1 percent of the Milwaukee public schools membership, but was expanded to 1.5 percent in 1994. Only students whose family income was at or below 1.75 times the national poverty line were eligible to apply.
Page 558:
I find that students selected for the choice program scored approximately 1.5–2.3 extra percentile points per year in math compared with unsuccessful applicants and the sample of other students in the Milwaukee public schools. The achievement gains of those actually enrolled in the choice schools were quite similar. Given a (within-sample) standard deviation of about nineteen percentile points on the math test, this suggests effect sizes on the order of 0.080–0.120σ per year, or 0.320–0.480σ over four years, which are quite large for education production functions. I do not estimate statistically significant differences between sectors in reading scores.
Page 561:
Table II. Numbers of Applicants, Selections, And Enrollments
|
Year of “First” Application |
||||
|
1990 |
1991 |
1992 |
1993 |
|
|
Number of applicants |
583 |
558 |
558 |
559 |
|
Number selected |
376 |
452 |
321 |
395 |
[497] Paper: “A Modified General Location Model for Noncompliance With Missing Data: Revisiting the New York City School Choice Scholarship Program Using Principal Stratification.” By Hui Jin and others. Journal of Educational and Behavioral Statistics, April 2010. Pages 154–173. <jeb.sagepub.com>
Page 156:
In February 1997, the School Choice Scholarship Foundation (SCSF) launched the New York City School Choice Scholarship Program and invited applications from eligible low-income families interested in scholarships toward private school expenses; these scholarships offered up to $1,400 for the academic year 1997–1998. Eligibility requirements included that the children were attending public school in Grades K through 4 in the New York City at the time of application and that their families were poor enough to qualify for free school lunch. The SCSF received applications from over 20,000 students. In a mandatory information session before the lottery to assign the scholarships, each family provided background information, and the children in Grades 1 through 4 took the Iowa Test of Basic Skills (ITBS), the pretest in reading and math. In the final lottery held in May 1997, about 1,000 students were randomly selected to the treatment group and were awarded offers of scholarships; about another 1,000 were selected to the control group without the scholarship. Both groups were followed up and strongly encouraged to take a posttest, again the ITBS, at the end of the 1997–1998 academic year.
Pages 168–170:
[B]oth models find that for compliers [students who moved to private schools] originally from schools with low average scores, attendance in private school will unambiguously improve their overall math performance … as compared to attendance in public school. Such an improvement is especially evident for children in Grade 1…. However, results from the two models differ in some other groups…. Using our model, we find that reading score was likely improved for children from Grade 4 of low average … and children from Grade 1 of high average schools … [T]he estimates of Barnard and others (2003) of the two groups … respectively, were much smaller.
[498] Paper: “School Choice as a Latent Variable: Estimating the ‘Complier Average Causal Effect’ of Vouchers in Charlotte.” By Joshua M. Cowen. Policy Studies Journal, May 2008. Pages 301–315. <onlinelibrary.wiley.com>
Page 307:
Incoming second- through eighth-grade students from low-income families in Charlotte were offered the opportunity to apply for a $1,700 scholarship to attend a private school for the 1999–2000 school year. Of the original applicants, 347 (30%) agreed to participate in a program evaluation the following spring. At the end of the school year, Iowa Tests of Basic Skills (ITBS) were administered to all students, while their parents completed surveys designed to obtain background information. There was no pretest Families who had either lost the lottery or had chosen not to accept the voucher were offered $20 and a chance to win a new scholarship to attend the testing sessions.
Page 309:
I begin the analysis of a voucher impact by estimating a typical “Intention-to-Treat” (ITT) model. In this model, students are considered to receive the treatment regardless of whether they use the voucher….
The ITT results indicate a positive voucher impact of 5 points on math scores and roughly 6 points on reading scores, all else equal. …
Next, I … [estimate] the mean effect of voucher treatment using an IV analysis, where the instrument for treatment is the random voucher offer itself….The results are similar to the ITT estimates in their statistical significance: A positive voucher effect appears evident at the p ≤ 0.10 for math achievement and p ≤ 0.05 for reading. The point estimates of the voucher effect increase from 5 to nearly 7 points in math, and from 6 to 8 points in reading.
[499] Paper: “Principal Stratification Approach to Broken Randomized Experiments: A Case Study of School Choice Vouchers in New York City.” By John Barnard and others. Journal of the American Statistical Association, June 2003. Pages 299–323. <biosun01.biostat.jhsph.edu>
Abstract:
Although this study benefits immensely from a randomized design, it suffers from complications common to such research with human subjects: noncompliance with assigned “treatments” and missing data. Recent work has revealed threats to valid estimates of experimental effects that exist in the presence of noncompliance and missing data, even when the goal is to estimate simple intention-to-treat effects. Our goal was to create a better solution when faced with both noncompliance and missing data. This article presents a model that accommodates these complications that is based on the general framework of “principal stratification” and thus relies on more plausible assumptions than standard methodology. Our analyses revealed positive effects on math scores for children who applied to the program from certain types of schools—those with average test scores below the citywide median. Among these children, the effects are stronger for children who applied in the first grade and for African-American children.
[500] NOTE: The following source conducted three different random-assignment school choice studies:
Book: The Education Gap: Vouchers and Urban Schools (Revised edition). By William G. Howell and Paul E. Peterson with Patrick J. Wolf and David E. Campbell. Brookings Institution Press, 2006 (first published in 2002). <www.brookings.edu>
Page 39: “We evaluated the privately funded voucher programs in New York City, Dayton, Ohio, and Washington, D.C., and the nationwide CSF [Children’s Scholarship Fund] program by means of randomized field trials (RFTs), a research design that is well known in the medical field. … In an RFT, subjects are randomly assigned to a treatment or control group.”
Page 44: “A total of 1,500 vouchers were offered to public school students in New York City, 811 in Washington, and 515 in Dayton.46 Because vouchers were allocated randomly, the characteristics of those offered vouchers did not differ significantly from members of the control group.”
Pages 145–146:
All impacts are calculated in terms of national percentile ranking (NPR) points, which vary between 0 and 100, with a national median of 50. … As mentioned, to produce more stable estimates, we provide estimates that combine reading and math scores. (However, impacts did not differ significantly by subject matter.) …
Table 6-1 … reveals no overall private school impact of switching to a private school on student test scores in the three cities. Nor does it reveal any private school impact on the test scores of students from other than African American backgrounds (mainly Hispanic students in New York and white students in Dayton). However, the table shows that the switch to a private school had significantly positive impacts on the test scores of African American students.
Table 6-1 shows that African Americans in all three cities gained, on average, roughly 3.9 NPR points after Year I, 6.3 points after Year II, and 6.6 points after Year III.21 Results for African American students varied by city. In Year I, the only significant gains were observed in New York City, where African Americans attending a private school scored, on average, 5.4 percentile points higher than members of the control group.22 In Year II, significant impacts on African American test scores were evident in all three cities, ranging from 4.3 percentile points in New York City, to 6.5 points in Dayton, to 9.2 points in Washington, D.C. The Year III impact of 9.2 points on African American students’ test scores in New York City is statistically significant. The –1.9 point impact in Year III in Washington, however, is not.
[501] Paper: “Vouchers in Charlotte.” By Jay P. Greene. Education Matters, Summer 2001. Pages 55–60. <www.educationnext.org>
Page 55:
During the 1999–2000 school year, the private Children’s Scholarship Fund (CSF) offered partial scholarships to low-income students in Charlotte, North Carolina. The partial scholarships defrayed up to $1,700 in tuition expenses at the private elementary or secondary school of a family’s choosing. Scholarships were awarded by lottery to families who went through an application process, because not enough funds were available to provide them to all the interested families.
The awarding of scholarships by lottery created a rare opportunity in educational research: a field experiment in which students were assigned randomly to both public and private schools, thus allowing me to test the effects of receiving a voucher and, more generally, to compare the performance of public and private schools. The study used both standardized test scores and surveys of parents and students to evaluate the effect of the scholarship program on both academic performance and student and parental satisfaction.
Pages 56–57:
A lottery was used to select which students would be offered scholarships, creating, as the statistical analysis has confirmed, two groups that were nearly identical. While noncompliance and nonparticipation have created differences between the two groups, they are similar enough that adjusting for observed characteristics is likely to produce highly reliable results.
Results
After one year, the results show that students who used a scholarship to attend a private school scored 5.9 percentile points higher on the math section of the ITBS [Iowa Test of Basic Skills] than comparable students who remained in public schools. Choice students scored 6.5 percentile points higher than their public school counterparts in reading after one year (see Figure 1).
Using a statistical technique known as instrumental analysis to adjust for the potential bias of noncompliance yields results that remain strong and positive. The results of this analysis show that, after only one year’s time, attending a private-school improved student performance on standardized tests in math and reading by between 5.4 and 7.7 percentile points.
On average, a scholarship raised students from the 30th percentile to the 37th percentile. This is a fairly large gain—approximately 0.25 standard deviation in math and reading. To put this gain in perspective, the difference nationwide between minority and white students is approximately 1.0 standard deviation. The benefits of the Charlotte CSF program are roughly one-quarter as large at the end of only one year.
[502] Report: “Evaluation of the DC Opportunity Scholarship Program: Impacts Three Years After Students Applied.” By Ann Webber and others. U.S. Department of Education, Institute of Education Sciences, May 2019. <ies.ed.gov>
Pages 1–2:
The District of Columbia (DC) Opportunity Scholarship Program (OSP) is the only federally funded program that provides vouchers to low-income families to send their children to private schools. Congress created the OSP in 2004 and reauthorized it in 2011 under the Scholarships for Opportunity and Results (SOAR) Act.1 As part of the 2011 SOAR Act, Congress required an independent evaluation of the OSP. This is the sixth2 and final report from that evaluation, describing how the OSP affected students and their parents three years after they applied to the program. Specifically, the report examines impacts on student achievement, student and parent satisfaction with schools, student and parent perceptions of school safety, and parent involvement with education.
Overview of the Program
The SOAR Act establishes criteria for student eligibility, the groups of students who receive priority for scholarships, and scholarship dollar amounts (exhibit 1). A program operator administers the OSP through a grant awarded by the U.S. Department of Education. Program operators establish protocols for families applying to the program, recruit applicants and schools, award scholarships, and place and monitor scholarship awardees in participating private schools (see appendix A-1 for more information). Participating private schools must agree to requirements regarding nondiscrimination in admissions, fiscal accountability, having teachers with at least a bachelor’s degree, and cooperation with an evaluation of the program.
Overview of the Evaluation
Congress required the evaluation to use “the strongest possible research design” to measure the impacts of being offered and using an OSP scholarship on key outcomes (exhibit 2).3 To determine the OSP’s effectiveness, an experiment—considered the “gold standard” of evaluation methodology—was conducted that compared outcomes for two groups. The treatment group was comprised of students who applied for a scholarship and were offered one. The control group was comprised of students who applied for a scholarship but were not offered one. Lotteries were used to randomly award scholarships to applicants. Randomization helped to ensure that the two groups being compared were truly similar at the time of OSP application, and that—other than by chance—the only difference that could influence outcomes was whether applicants received a scholarship offer or not.
Pages 4–5:
There were no statistically significant impacts on either reading or mathematics achievement three years after students applied to the program. Students in the group that received a scholarship offer scored 0.1 percentile points higher on the mathematics test, and 1.6 percentile points lower on the reading test, than students in the control group (figure 2) after three years. Students using a scholarship scored 0.2 percentile points higher on the mathematics test, and 2.1 percentile points lower on the reading test, than students in the control group. None of the differences were statistically significant. …
There were no statistically significant impacts on either reading or mathematics achievement for students in any of the study’s eight subgroups.In each case, those offered or using a scholarship had test scores that were similar to those not offered a scholarship (appendix tables C-1 and C-2). This included (1) students attending schools in need of improvement when they applied to the OSP and students not attending schools in need of improvement, (2) students entering elementary and secondary grades when they applied, (3) students scoring above or below the median11 in reading at the time of application, and (4) students scoring above or below the median in mathematics at the time of application.
[503] Paper: “The Effect of the Louisiana Scholarship Program on College Entrance.” By Heidi H. Erickson, Jonathon N. Mills, and Patrick J. Wolf. University of Arkansas, April 2019. <www.uaedreform.org>
Page 3 (of PDF):
The Louisiana Scholarship Program (LSP) is a private school voucher program available to families who have incomes no greater than 250 percent of the federal poverty line and whose children attend a low performing public school. It began as a pilot program in New Orleans in 2008 and was expanded statewide in 2012. Previous evaluations of the LSP generally found negative impacts of the program on math and English language arts test scores. In this study, we evaluate the effects of the program on college enrollment for the first cohort of students eligible to enter college by 2017–18. Using lottery assignment for a student’s first choice private school, we are able to identify the causal effect of being awarded a scholarship on student attainment for just over 1,000 randomized students who were in the seventh through twelfth grades during the first year of the program. We find that 60% of treatment students who won a lottery and enrolled in their first choice private schools enter college, compared to 59.5% of control students. This difference in not statistically significant. We find no differential treatment effects when considering student enrollment in two- or four-year post-secondary institutions.
Page 2:
In this paper we seek to understand how the LSP impacted college enrollment for students who applied to the program in its first year, 2012–13. Using detailed data from the National Student Clearinghouse (NSC) Student Tracker Service, we find that 60% of students who were awarded a scholarship through a lottery and enrolled in their first-choice private school enter college, compared to 59.5% of their control student counterparts. We find that treatment students are two percentage points more likely to enroll in a four-year institutions than a twoyear; however, this difference is not statistically distinguishable from zero.
Page 3:
The LSP is a school voucher program providing students a scholarship to attend a private school of their choice. The program piloted in New Orleans in 2008 and expanded statewide in 2012. Students are eligible for the LSP if their family incomes are below 250% of the federal poverty line and if they are currently attending a public school rated C, D, or F on the statewide school grading system. Students entering kindergarten or currently enrolled in the Recovery School District, which is the state government takeover mechanism for Louisiana schools, are also eligible to apply for a scholarship.
Scholarship funding comes from the state and is the lesser amount of 90% of state and local funding or the tuition of the private school of the student’s choice. In order to participate in the program, private schools are required to administer the state standardized test and cannot have selective admission policies. They also must comply with state financial and safety regulations.
In the first year of the statewide program, 2012–13, over 9,500 students applied for and 5,296 were awarded a scholarship (Mills & Wolf, 2017a). The majority of student applications in the first year were for kindergarten through third grade, with 19% of applications for seventh through twelfth grades.
Page 12:
Experimental designs are considered the gold standard for evaluation because they hold the greatest potential to identify causal effects (Mosteller & Boruch, 2002; Pirog et al., 2009; Rossi, Lipsey, & Freeman, 2004). In this paper, we exploit lotteries in oversubscribed private schools to estimate the causal effect of the LSP on students’ likelihood of entering college. To participate in the LSP, students apply through a centralized enrollment process administered by the Louisiana Department of Education (LDOE). Families are able to rank in order their top five preferred private schools. This enrollment system is similar to the New York City Department of Education’s public high school choice system (Abdulkadiroglu, Pathak, & Roth, 2005). The LSP enrollment system awards scholarships based on available seats in students’ preferred private schools and their priority status. Students with disabilities as well as multiple birth siblings (twins, triplets, etc.) are automatically awarded a scholarship if space is available in their desired private schools.
Page 20:
We find that the LSP has no statistically significant effect on college entrance for students who enroll in their first-choice private school. … Students who receive a scholarship and enroll in their first-choice private school are more likely to enter college by 0.5 percentage points compared to students who did not win a lottery to attend their first-choice school. The estimated effect is small and statistically insignificant. The estimates are also imprecise as the standard errors are relatively large. The lack of precision is likely due to the demands placed on the data by estimating a two-stage analytic model with fixed effects.
[504] Paper: “Distributional Analysis in Educational Evaluation: A Case Study from the New York City Voucher Program.” By Marianne P. Bitler and others. Journal of Research on Educational Effectiveness, July–September, 2015. Pages 419–450. <www.ncbi.nlm.nih.gov>
Page 1:
We use quantile treatment effects estimation to examine the consequences of the random-assignment New York City School Choice Scholarship Program (NYCSCSP) across the distribution of student achievement. Our analyses suggest that the program had negligible and statistically insignificant effects across the skill distribution.
Pages 19–20:
In the first model of Panel 1 (column 1), we replicate Howell & Peterson’s estimates of the treatment effect for African-Americans (point estimates are identical, SEs [standard error] nearly so, differing due to our use of bootstrapping by family within strata for SEs). This analysis indicates that the voucher offer significantly improved black student math achievement in the study’s first and third years. (This analysis yields a positive, but not statistically significant, treatment effect for black students in Year 2.) Similarly, in the first model of Panel 2 (column 1), we attempt to replicate Krueger and Zhu’s racial categorization scheme to estimate of the effects of the voucher offer for African-Americans. While this replication is not perfect (our sample sizes are 1 observation off from their reported sample sizes),12 it returns an estimate of the African-American treatment effect that is very close to Krueger and Zhu’s published findings. Using the Krueger and Zhu definition of African-American and also treating the 99s as valid percentile scores of 0, we find a positive and significant treatment effect on Math scores in Year 1, but no effects in subsequent years.
[505] Paper: “Using Experimental Economics to Measure the Effects of a Natural Educational Experiment on Altruism.” By Eric Bettinger and Robert Slonim. Journal of Public Economics, September 2006. Pages 1625–1648. <www.sciencedirect.com>
Abstract:
Economic research examining how educational intervention programs affect primary and secondary schooling focuses largely on test scores although the interventions can affect many other outcomes. This paper examines how an educational intervention, a voucher program, affected students’ altruism. The voucher program used a lottery to allocate scholarships among low-income applicant families with children in K–8th grade. By exploiting the lottery to identify the voucher effects, and using experimental economic methods, we measure the effects of the intervention on children’s altruism. We also measure the voucher program’s effects on parents’ altruism and several academic outcomes including test scores. We find that the educational intervention positively affects students’ altruism towards charitable organizations but not towards their peers. We fail to find statistically significant effects of the vouchers on parents’ altruism or [students’ math] test scores.
[506] Paper: “Another Look at the New York City School Voucher Experiment.” By Alan B. Krueger and Pei Zhu. American Behavioral Scientist, January 2004. Pages 658–698. <abs.sagepub.com>
Abstract:
This article reexamines data from the New York City school choice program, the largest and best-implemented private school scholarship experiment yet conducted. In the experiment, low-income public school students in kindergarten to Grade 4 were eligible to participate in a series of lotteries for a private school scholarship in May 1997. Data were collected from students and their parents at baseline and in the spring of each of the next 3 years.
Page 693:
Our reanalysis of the New York City school voucher experiment suggests that the positive effect of vouchers on the achievement of African American students emphasized by previous researchers is less robust than commonly acknowledged. Most important, if the cohort of students who were enrolled in kindergarten when the experiment began is included in the sample, the effect of vouchers is greatly attenuated. As the results in Table 5 indicate, treating mother’s and father’s race symmetrically further attenuates the effect of school vouchers for African American children. The evidence is stronger that the availability of private school vouchers raised achievement on math than on reading exams after 3 years, but both effects are relatively small if the sample includes students with missing baseline test scores and students who have at least one Black parent.
[507] Report: “The Effects of Means-Tested Private School Choice Programs on College Enrollment and Graduation.” By Matthew M. Chingos and others. Urban Institute, July 2019. <www.urban.org>
Pages 17–18:
The DC Opportunity Scholarship Program (OSP), created by an act of Congress in January 2004, provides scholarships to low-income families (defined as those making no more than 185 percent of the federal poverty level) to attend private schools. Scholarships are available only to DC residents attending participating DC private schools. Participating schools must agree to such requirements as nondiscrimination in admissions, fiscal accountability, and the provision of data and information for evaluation purposes (Wolf and others 2005).
The program has enrolled between 1,000 and 2,000 students each year since its inception in 2004–05, with a peak of 1,930 in 2007–08 (Chingos 2018), and 1,653 enrolled in the most recent year for which data are available (2017–18).10 Scholarship amounts were initially capped at $7,500 (about $9,700 in 2017 dollars) (Wolf and others 2005); the maximum is now $9,022 for elementary and middle school and $13,534 for high school.11
Enrollment in the program is small relative to public school enrollment in DC. OSP enrollment has never exceeded 3 percent of total enrollment (district, public charter, and OSP) and is currently closer to 2 percent.12 This largely reflects the fact that program funding can accommodate only a limited number of students (roughly 1,200 scholarships per year in recent years).13
Data and Methods
The present study builds on existing work on the OSP by using administrative records to measure the college enrollment patterns of participants in the first two lotteries. We track the college enrollment outcomes of a subset of 1,776 students who applied for a scholarship in 2004 or 2005 and are now old enough to have potentially graduated from high school and enrolled in college.
Urban Institute researchers worked with the current OSP administrator, Serving Our Children (SOC), to reconstruct baseline files from the original lottery applications that the Washington Scholarship Fund (the original OSP administrator) used in 2004 and 2005 and matched them to college enrollment records from the National Student Clearinghouse. …
… The results in the present study are updated to include an additional 182 students who are now old enough to be observed for at least two years following expected high school graduation, for a total of 1,776 students. Descriptive statistics for this sample of students are provided in appendix table A.6. All results are weighted to reflect applicants’ likelihood of winning the lottery, as described in Chingos (2018).
These estimates are “intent to treat” (ITT) in that they capture the effects of being offered a scholarship, when in fact many students who were offered a scholarship did not use one. Among all students who won the lottery, 70 percent used a scholarship for at least one year.14 We report only ITT estimates throughout this study, but the effects of using a scholarship for at least one year can be calculated by dividing the ITT estimates by 0.7.15 …
… Overall, students offered a scholarship were somewhat less likely to enroll in college within two years of expected graduation from high school: 43 percent did compared with 46 percent of applicants who lost the lottery. None of these differences are statistically distinguishable from zero at conventional levels.
This pattern holds for both two- and four-year colleges and for four-year public and four-year private colleges (appendix table A.7). Adding control variables has little impact on the results, as would be expected given random assignment.
[508] Working paper: “The Effects of the Louisiana Scholarship Program on Student Achievement After Four Years.” By Jonathan N. Mills and Patrick J. Wolf. University of Arkansas, May 2019. <papers.ssrn.com>
Page 3:
The Louisiana Scholarship Program (LSP) is a statewide school voucher initiative providing public funds for low-income students in underperforming public schools to attend participating private schools. …
Our analysis uses oversubscription lotteries for nearly 10,000 eligible applicants to estimate the achievement impacts of LSP as a randomized control trial (RCT). Admission lotteries are used as instrumental variables to estimate the effect of using an LSP scholarship to enroll in one’s first choice, or top-ranked2, private school for applicants induced to attend a private school as a result of winning the lottery. Our analysis uses student-level data obtained via a data-sharing agreement with the state of Louisiana. Achievement is measured by student performance on the criterion-referenced tests mandated by the state for public school accountability purposes.
Pages 4–6:
In this study, we estimate how achievement of the 2012–13 LSP application cohort was impacted by using an LSP voucher at any point over the four year period spanning from 2012–13 through 2015–16. In general, our study indicates the trend of improvement in LSP scholarship usage effects observed in our prior reports (Mills & Wolf, 2017a; Mills & Wolf, 2017b) did not continue into the fourth year of the program. After four years, students using LSP vouchers to enroll in LSP participating private schools performed noticeably worse on state assessments than their control group counterparts. These estimates are statistically significant in the majority of models and are consistently negative in both math and science. Similar to previous studies, we observe little evidence of differentiation in general effects by gender. However, in contrast to findings presented in our previous studies, African American students are reported to have significantly less negative impacts of voucher usage relative to other students.
There are two important caveats to note regarding our analysis. First, this study deviates from our previous evaluations by estimating the effect of ever using an LSP voucher to attend a private school between 2012–13 and 2015–16. In contrast, our prior studies estimated the achievement impacts of using an LSP voucher to attend a private school in a specific year: 2012–13 (Mills, 2015), 2013–14 (Mills & Wolf, 2017a), and 2014–15 (Mills & Wolf, 2017b). There are benefits and drawbacks to estimating the effect of usage in a specific year. A benefit, for example, is that this specification allows us to identify effect for students who have continued to comply with assignment over time, since almost all the students using LSP vouchers in a given year also used in all previous years. In a sense, this approach captures the impacts of persistent voucher use. On the other hand, this particular Local Average Treatment Effect (LATE) estimator effectively ignores the experience of students who left the program during the four-year time period, as it treats all lottery winners who are no longer enrolled in private schools as treatment group non-compliers. This feature of our prior analytic method is problematic in our current research setting, as the percentage of LSP lottery winners continually using vouchers to attend participating private schools has noticeably declined over time (Sude & Wolf, 2019). Indeed, by Year 4 (2015–16), we observe more LSP lottery winners attending public schools than private schools. By estimating the impact of ever using an LSP voucher instead of focusing on enrollment in a specific year, we are able to recapture those initial LSP scholarship users who have switched back to public schools over time. This approach provides a more general – and potentially more policy relevant – picture of the effect of LSP scholarship usage on student achievement as it allows for the identification of impacts even for those scholarship users who find themselves dissatisfied with their private school experience.3
Second, while our prior research has generally emphasized findings from models requiring baseline achievement (Mills, 2015, Mills & Wolf, 2017a; Mills & Wolf, 2017b), this requirement dramatically reduces the potential analytical sample by Year 4. Specifically, only LSP applicants with achievement in grades 3 or 4 at baseline meet this sample inclusion standard when examining scholarship usage effects four years after initial assignment. This reduction in sample both limits our analysis’s statistical power as well as our ability to distinguish true voucher usage impacts from cohort effects. Therefore, we also present results for an analytical sample generated by waiving the baseline achievement requirement. Fortunately, if we have correctly identified first-choice school lotteries in our data, these results represent causal estimates of LSP scholarship usage on student achievement. In general, estimated effects for this alternative sample largely correspond with primary analytical sample estimates, with statistically significant negative impacts observed on math and science test scores. In addition, estimated effects are negative and statistically significant in ELA for this sample.
Pages 44–45:
Conclusion
Unfortunately, our study is only designed to identify if LSP voucher use impacted student achievement over time. It cannot identify the causes behind the observed effects. All we can say is that, after four years, students receiving LSP vouchers in the first cohort of applicants to the statewide program via lottery who used them to enroll in private schools were performing behind their control-group counterparts on Louisiana state assessments of math, science, and in some specifications also ELA.
The purpose of this work is to provide the most rigorous assessment of the effect of the Louisiana Scholarship Program on the student achievement of participants. In this regard, it is clear the LSP had initial negative effects on the achievement of the subset of eligible participating LSP students examined here, as measured by the official state achievement test. While the early negative effects dissipated somewhat over time, we continue to observe negative test score effects of LSP voucher usage that are especially large in math, four years after initial assignment.
[509] Paper: “Free to Choose: Can School Choice Reduce Student Achievement?” By Atila Abdulkadiroglu and others. American Economic Journal: Applied Economics, January 2018. <pubs.aeaweb.org>
Page 176:
This paper provides a striking contrast to the literature on lottery-based studies of school choice. We evaluate the Louisiana Scholarship Program (LSP), a school choice program that provides private school vouchers for disadvantaged Louisiana students attending low-performing public schools. Income-eligible students enrolled in public schools graded “C” or below on an achievement-based rating system may apply for an LSP voucher to cover tuition at an eligible private school. Private schools gain eligibility by applying to the Louisiana Board of Elementary and Secondary Education to host LSP students (Louisiana Department of Education 2015a). If the number of eligible applicants to a private school exceeds the available seats, LSP vouchers are distributed via stratified random lottery. We estimate causal effects of LSP vouchers by comparing outcomes for lottery winners and losers in 2013, the first year after the LSP expanded throughout Louisiana. Lottery-based estimates show that LSP vouchers dramatically reduce academic achievement. Attending an LSP-eligible private school lowers math scores by an average of 0.41 standard deviations (σ) and reduces reading, science, and social studies scores by 0.08σ, 0.26σ, and 0.33σ one year after the lottery. LSP participation shifts the distribution of scores downward in all four subjects, increasing the likelihood of a failing score by between 24 and 50 percent. These impacts are similar across family income levels and geographic locations. LSP voucher effects are more negative in earlier grades, though vouchers reduce achievement in later grades as well.
[510] Paper: “Private School Vouchers and Student Achievement: A Fixed Effects Quantile Regression Evaluation.” By Carlos Lamarche. Labour Economics, August 2008. Pages 575–590. <doi.org>
Page 575:
Fundamental to the recent debate over school choice is the issue of whether voucher programs actually improve students’ academic achievement. Using newly developed quantile regression approaches, this paper investigates the distribution of achievement gains in the first school voucher program implemented in the US. We find that while high-performing students selected for the Milwaukee Parental Choice program had a positive, convexly increasing gain in mathematics, low-performing students had a nearly linear loss. However, the program seems to prevent low-performing students from having an even bigger loss experienced by students in the public schools.
[511] Transcript: “Full Interview Between President Obama and Bill O’Reilly.” Fox News, February 3, 2014. <www.foxnews.com>
O’Reilly: The secret to getting a je—good job is education. And in these chaotic families, the children aren’t well-educated because it isn’t—it isn’t, um, encouraged at home as much as it is in other precincts. Now, school vouchers is a way to level the playing field. Why do you oppose school vouchers when it would give poor people a chance to go to better schools?
Obama: Actually—every study that’s been done on school vouchers, Bill, says that it has very limited impact if any—
O’Reilly: Try it.
OBAMA: On—it has been tried, it’s been tried in Milwaukee, it’s been tried right here in DC—
O’Reilly: And it worked here.
Obama: No, actually it didn’t. When you end up taking a look at it, it didn’t actually make that much of a difference. So what we have been supportive of is, uh, something called charters. Which, within the public school system gives the opportunity for creative experiments by teachers, by principals to-to start schools that have a different approach. And—
O’Reilly: [OVERLAP] You would revisit that? I-I just think—I used be, teach in a Catholic school, a-and I just know—
Obama: [OVERLAP] Bill—you know, I—I’ve taken, I’ve taken—I’ve taken a look at it. As a general proposition, vouchers has not significantly improved the performance of kids that are in these poorest communities—
O’Reilly: [OVERLAP] [INAUDIBLE]
Obama: Some charters—some charters are doing great. Some Catholic schools do a great job, but what we have to do is make sure every child—
[512] Report: “Evaluation of the DC Opportunity Scholarship Program.” By Patrick Wolf and others. U.S. Department of Education, Institute of Education Sciences, June 2010. <ies.ed.gov>
Page xvii:
Guided by language in the statute, the evaluation of the OSP [Opportunity Scholarship Program] relied on lotteries of eligible applicants—random chance—to create two statistically equivalent groups who were followed over time and whose outcomes were compared to estimate Program impacts. A total of 2,308 eligible applicants in the first two years of Program implementation were entered into scholarship lotteries (492 in year one, called “cohort 1,” and 1,816 in year two, called “cohort 2”). Across the cohorts, 1,387 students were randomly assigned to the impact sample’s treatment group (offered a scholarship), while the remaining 921 were assigned to the control group (not offered a scholarship).
Pages xix–xxi:
Student Achievement
• Overall reading and math test scores were not significantly affected by the Program, based on our main analysis approach. On average over the 40-plus months of potential participation, the treatment group scored 3.90 points higher in reading and .70 points higher in math than the control group, but these differences were not statistically significant (figure ES-2).
• No significant impacts on achievement were detected for students who applied from SINI [Schools in Need of Improvement] 2003–05 schools, the subgroup of students for whom the statute gave top priority, or for male students, or those who were lower performing academically when they applied.
• The Program may have improved the reading but not math achievement of the other three of six student subgroups. These include students who came from not SINI 2003¬05 schools (by 5.80 scale score points), who were initially higher performing academically (by 5.18 points), or who were female (5.27 points). However, the impact estimates for these groups may be due to chance after applying a statistical test to adjust for multiple comparisons.
High School Graduation (Educational Attainment)
• The offer of an OSP scholarship raised students’ probability of completing high school by 12 percentage points overall. The graduation rate based on parent-provided information was 82 percent for the treatment group compared to 70 percent for the control group (figure ES-3). There was a 21 percent difference (impact) for using a scholarship to attend a participating private school.
• The offer of a scholarship improved the graduation prospects by 13 percentage points for the high-priority group of students from schools designated SINI in 2003–05 (79 percent for the treatment group versus 66 percent for the control group) (figure ES-3). The impact of using a scholarship on this group was 20 percentage points.
• Two other subgroups had statistically higher graduation rates as a result of the Program. Those who entered the Program with relatively higher levels of academic performance had a positive impact of 14 percentage points from the offer of a scholarship and 25 percentage points from the use of a scholarship. Female students had a positive impact of 20 percentage points from the offer of a scholarship and 28 percentage points from the use of a scholarship.
• The graduation rates of students from the other subgroups were also higher if they were offered a scholarship, but these differences were not statistically significant.
[513] Webpage: “The Executive Branch.” White House. Accessed July 5, 2021 at <www.whitehouse.gov>
Under Article II of the Constitution, the President is responsible for the execution and enforcement of the laws created by Congress. Fifteen executive departments—each led by an appointed member of the President’s Cabinet—carry out the day-to-day administration of the federal government. …
Department of Education
The mission of the Department of Education is to promote student learning and preparation for college, careers, and citizenship in a global economy by fostering educational excellence and ensuring equal access to educational opportunity.
The Department administers federal financial aid for higher education, oversees educational programs and civil rights laws that promote equity in student learning opportunities, collects data and sponsors research on America’s schools to guide improvements in education quality, and works to complement the efforts of state and local governments, parents, and students.
The U.S. Secretary of Education oversees the Department’s 4,200 employees and $68.6 billion budget.
[514] Report: “Losing Our Future: How Minority Youth are Being Left Behind by the Graduation Rate Crisis.” By Gary Orfield and others. Civil Rights Project at Harvard University, Urban Institute, Advocates for Children of New York,
and Civil Society Institute, February 25, 2004. <cloudfront.escholarship.org>
Page 2:
In an increasingly competitive global economy, the consequences of dropping out of high school are devastating to individuals, communities and our national economy. At an absolute minimum, adults need a high school diploma if they are to have any reasonable opportunities to earn a living wage. A community where many parents are dropouts is unlikely to have stable families or social structures. Most businesses need workers with technical skills that require at least a high school diploma. Yet, with little notice, the United States is allowing a dangerously high percentage of students to disappear from the educational pipeline before graduating from high school.
[515] Paper: “The Importance of the Ninth Grade on High School Graduation Rates and Student Success in High School.” By Kyle M. McCallumore and Ervin F.Sparapani. Education, March 2010. Pages 447–456. <eric.ed.gov>
Abstract: “[T]here is really not much appealing about the reality of the problems in the American education system that permeate beyond kindergarten. Graduation rates are one of the most troubling concerns.”
[516] Book: High School Dropout, Graduation, and Completion Rates: Better Data, Better Measures, Better Decisions. Edited by Robert M. Hauser and Judith Anderson Koenig. National Academies Press, 2011. <www.nap.edu>
Page 1: “High school graduation and dropout rates have long been used as indicators of educational system productivity and effectiveness and of social and economic well-being.”
[517] “2012 Democratic Party Platform.” Democratic National Committee, September 2012. <www.presidency.ucsb.edu>
Too many students, particularly students of color and disadvantaged students, drop out of our schools, and Democrats know we must address the dropout crisis with the urgency it deserves. The Democratic Party understands the importance of turning around struggling public schools. We will continue to strengthen all our schools and work to expand public school options for low-income youth, including magnet schools, charter schools, teacher-led schools, and career academies.
[518] Paper: “School Vouchers and Student Outcomes: Experimental Evidence from Washington, DC.” By Patrick J. Wolf and others. Journal of Policy Analysis and Management, Spring 2013. Pages 246–270. <onlinelibrary.wiley.com>
Abstract:
Here we examine the empirical question of whether or not a school voucher program in Washington, DC, affected achievement or the rate of high school graduation for participating students. The District of Columbia Opportunity Scholarship Program (OSP) has operated in the nation’s capital since 2004, funded by a federal government appropriation. Because the program was oversubscribed in its early years of operation, and vouchers were awarded by lottery, we were able to use the “gold standard” evaluation method of a randomized experiment to determine what impacts the OSP had on student outcomes. Our analysis revealed compelling evidence that the DC voucher program had a positive impact on high school graduation rates, suggestive evidence that the program increased reading achievement, and no evidence that it affected math achievement.
Page 258: “Results are described as statistically significant or highly statistically significant if they reach the 95 percent or 99 percent confidence level, respectively.”
Page 260:
The attainment impact analysis revealed that the offer of an OSP scholarship raised students’ probability of graduating from high school by 12 percentage points (Table 3). The graduation rate was 82 percent for the treatment group compared to 70 percent for the control group. The impact of using a scholarship was an increase of 21 percentage points in the likelihood of graduating. The positive impact of the program on this important student outcome was highly statistically significant.
Page 261:
We observed no statistically significant evidence of impacts on graduation rates at the subgroup level for students who applied to the program from non-SINI [Schools in Need of Improvement] schools, with relatively lower levels of academic performance, and male students. For all subgroups, the graduation rates were higher among the treatment group compared with the control group, but the differences did not reach the level of at least marginal statistical significance for these three student subgroups. …
Our analysis indicated a marginally statistically significant positive overall impact of the program on reading achievement after at least four years. No significant impacts were observed in math. The reading test scores of the treatment group as a whole averaged 3.9 scale score points higher than the scores of students in the control group, equivalent to a gain of about 2.8 months of additional learning. The calculated impact of using a scholarship was a reading gain of 4.8 scale score points or 3.4 months of additional learning (Table 4).
Page 262:
Reading … Adjusted impact estimate [=] 4.75 … p-value of estimates [=] .06 …
The reading impacts appeared to cumulate over the first three years of the evaluation, reaching the marginal level of statistical significance after two years and the standard level after three years. By that third-year impact evaluation, only 85 of the 2,308 students in the evaluation (3.7 percent) had graded-out of the impact sample, having exceeded 12th grade. Between the third-year and final-year evaluation, an additional 211 students (12.2 percent) graded-out of the sample, reducing the final test score analytic sample to a subgroup of the original analytic sample. Due to this loss of cases for the final test score analysis, the confidence interval around the final point estimates is larger than it was after three years, and the positive impact of the program on reading achievement was only statistically significant at the marginal level.
Page 266: “Here, in the form of the DC school voucher program, Congress and the Obama administration uncovered what appears to be one of the most effective urban dropout prevention programs yet witnessed.”
Page 267: “We did find evidence to suggest that scholarship use boosted student reading scores by the equivalent of about one month of additional learning per year. Most parents, especially in the inner city, would welcome such an improvement in their child’s performance.”
[519] Article: “Biden Woos Teachers Union, Slams GOP.” By Brian Slodysko. Chicago Tribune, July 3, 2011. <articles.chicagotribune.com>
Biden tied current battles over public workers’ collective bargaining rights to teacher-specific issues such as smaller classes, private school voucher programs, and reduced benefits and wages.
Throughout the speech the message was clear, intent on boosting solidarity between Democrats and their traditional allies.
[520] Webpage: “Joe Biden.” Office of the President-Elect. Accessed September 18, 2015 at <change.gov>
“Joseph Robinette Biden Jr., age 66, was born in Scranton, Pennsylvania, on November 20, 1942, to Joseph Sr. and Jean Biden, the oldest of four. In 1953, the Biden family moved from Pennsylvania to Claymont, Delaware. Biden attended parochial school at St. Helena’s School in Wilmington and the Archmere Academy in Claymont*.”
* NOTE: “Archmere Academy is a private, independent and Catholic college preparatory school, grade 9–12, located on the Pennsylvania-Delaware border.” [Webpage: “About Us.” Archmere Academy. Accessed September 18, 2015 at <www.archmereacademy.com>]
[521] “Biden, Joseph Robinette (Joe), Jr. 1942–” Biographical Directory of the United States Congress. Accessed July 7, 2021 at <bioguide.congress.gov>
“Biden, Joseph Robinette (Joe), Jr., a Senator from Delaware and a Vice President of the United States; born in Scranton, Lackawanna County, Pa., November 20, 1942; educated at St. Helena’s School, Wilmington, Del., and Archmere Academy, Claymont, Del.”
[522] Transcript: “Part I: CNN/YouTube Democratic Presidential Debate.” CNN, July 24, 2007. <www.cnn.com>
BIDEN: My kids did go to private schools, because right after I got elected, my wife and daughter were killed. I had two sons who survived. My sister was the head of the history department. She was helping me raise my children at Wilmington Friends School.
BIDEN: When it came time to go to high school when they had come through their difficulties—I’m a practicing Catholic—it was very important to me they go to a Catholic school, and they went to a Catholic school.
My kids would not have gone to that school were it not for the fact that my wife and daughter were killed and my two children were under the care of my sister who drove them to school every morning.
[523] Article: “Obama Girls to Go to Sidwell.” Seattle Times, November 22, 2008. <www.seattletimes.com>
“President-elect Obama and his wife have chosen Sidwell Friends School for their daughters…. She also said that Sasha and Malia had become good friends with Vice President-elect Joseph Biden’s grandchildren, who go to the school.”
[524] Transcript: “Full Interview Between President Obama and Bill O’Reilly.” Fox News, February 3, 2014. <www.foxnews.com>
O’Reilly: The secret to getting a je – good job is education. And in these chaotic families, the children aren’t well-educated because it isn’t – it isn’t, um, encouraged at home as much as it is in other precincts. Now, school vouchers is a way to level the playing field. Why do you oppose school vouchers when it would give poor people a chance to go to better schools?
Obama: Actually – every study that’s been done on school vouchers, Bill, says that it has very limited impact if any –
O’Reilly: Try it.
Obama: On – it has been tried, it’s been tried in Milwaukee, it’s been tried right here in DC –
O’Reilly: [OVERLAP] And it worked here.
Obama: No, actually it didn’t. When you end up taking a look at it, it didn’t actually make that much of a difference. So what we have been supportive of is, uh, something called charters. Which, within the public school system gives the opportunity for creative experiments by teachers, by principals to-to start schools that have a different approach. And –
O’Reilly: [OVERLAP] You would revisit that? I-I just think – I used be, teach in a Catholic school, a-and I just know –
Obama: [OVERLAP] Bill – you know, I – I’ve taken, I’ve taken – I’ve taken a look at it. As a general proposition, vouchers has not significantly improved the performance of kids that are in these poorest communities –
O’Reilly: [OVERLAP] [INAUDIBLE]
Obama: Some charters – some charters are doing great. Some Catholic schools do a great job, but what we have to do is make sure every child –
[525] Article: “Hawaii Prep School Gave Obama Window to Success.” By Martin Kaste. National Public Radio, October 12, 2012. <www.npr.org>
“Punahou School was founded by missionaries in 1841…. Punahou occupies a privileged position, not just on the hillside, but in Hawaii society. In his memoir, Dreams From My Father, Barack Obama recalled how his grandfather pulled strings to get him in.”
[526] Commentary: “Education Secretary Duncan’s Children to Go to Chicago Private School He Attended.” By Valerie Strauss. Washington Post, July 9, 2015. <www.washingtonpost.com>
“President Obama’s two daughters attended the [private, prestigious University of Chicago Laboratory] school before moving to Washington in 2009.”
[527] Article: “Obama Girls to Go to Sidwell.” Seattle Times, November 22, 2008. <www.seattletimes.com>
“President-elect Obama and his wife have chosen Sidwell Friends School for their daughters, opting for a private institution that another White House child, Chelsea Clinton, attended.”
[528] Article: “Obama: D.C. Schools Don’t Measure Up to His Daughters’ Private School.” By Nick Anderson. Washington Post, September 27, 2010. <www.washingtonpost.com>
Obama made his comments on NBC’s “Today” show in response to a woman who asked whether Malia and Sasha Obama “would get the same kind of education at a D.C. public school” that they would get at the D.C. private school that has educated generations of the city’s elite.
“I’ll be blunt with you: The answer is no, right now,” Obama said. D.C. public schools “are struggling,” he said, but they “have made some important strides over the last several years to move in the direction of reform. There are some terrific individual schools in the D.C. system.”
[529] Article: “Clinton Urges ‘No’ Vote on School Voucher Initiative: Election: He Says the Plan Would Seriously Hurt Public Education. Backers of Prop. 174 Note That the President’s Daughter Attends a Private School.” By David Lauter. Los Angeles Times, October 5, 1993. <www.latimes.com>
President Clinton waded into the midst of one of the state’s most controversial political issues Monday, urging Californians to defeat Proposition 174—the school voucher initiative on the November ballot. …
“Wouldn’t it be ironic if, at the very moment we’re finally trying to raise standards” for public schools, the government would “turn around and start sending tax money to private schools that didn’t have to meet any standards at all?” Clinton said in a speech to the AFL-CIO [American Federation of Labor–Congress of Industrial Organizations] convention here.
“The people will regret this if they pass it,” Clinton said. “If I were a citizen of the state of California, I would not vote for Proposition 174.”
[530] Article: “School House to White House: The Education of the Presidents.” Prologue Magazine, Spring 2007. <www.archives.gov>
“William J. Clinton attended both private and public schools growing up in Arkansas and graduated from Hot Springs High School in 1964.”
[531] Article: “Obama Girls to Go to Sidwell.” Seattle Times, November 22, 2008. <www.seattletimes.com>
“President-elect Obama and his wife have chosen Sidwell Friends School for their daughters, opting for a private institution that another White House child, Chelsea Clinton, attended.”
[532] Article: “Secretary Duncan Wants D.C. Kids to Keep Vouchers.” USA Today, Mach 4, 2009. <usatoday30.usatoday.com>
Duncan opposes vouchers, he said in an interview with The Associated Press. But he said Washington is a special case, and kids already in private schools on the public dime should be allowed to continue. … “I don’t think vouchers ultimately are the answer,” Duncan said.
[533] Commentary: “Education Secretary Duncan’s Children to Go to Chicago Private School He Attended.” By Valerie Strauss. Washington Post, July 9, 2015. <www.washingtonpost.com>
“Education Secretary Arne Duncan grew up in Chicago and attended the private, prestigious University of Chicago Laboratory Schools. … And in the fall, Duncan’s children will be attending Lab, too, while his wife works there.”
[534] Interview: Rahm Emanuel on Public Affairs, January 10, 2002. <www.youtube.com>
Time marker 25:40:
Jeff Berkowitz: You know the State Board of Education has said that one out of every two schools in the city of Chicago is still a failing school. … Why not say to those people who’ve got kids in a failing school district: “We want to give you some choice. We’re spending about $7,000 per person in grade school. Here, we’ll make it simple for you.” And take that money … just like your parents at one point made a choice [and allow them to use it at a] private school … The main thing is that it gives people a way out of failing public schools. I want to know, because I see you have the endorsement of the National Education Association—they don’t believe in the kind of choice I just said—does Rahm Emanuel believe in that choice?
Rahm Emanuel: I don’t believe in vouchers. I don’t think they’re the right solution. I don’t believe in abandoning public education. … My parents never asked for state-sponsorship of our private education, which is religious education as well.
[535] Article: “Rahm Emanuel, Obama’s Pick for Chief of Staff, Is Tough, Direct and Wedded to His Jewish Roots.” Jewish Journal, November 6, 2008. <jewishjournal.com>
“When his family lived in Chicago, he attended Bernard Zell Anshe Emet Day School, a Jewish day school. After his family moved to Wilmette, he attended public school: Romona School, Wilmette Junior High School, and New Trier High School.”
[536] Webpage: “About Us.” Bernard Zell Anshe Emet Day School. Accessed October 2, 2018 at <www.bernardzell.org>
Bernard Zell Anshe Emet Day School is an independent Jewish day school for the 21st century. From Early Childhood through Middle School, we inspire our students to love learning through innovative teaching, hands-on exploration and discovery. Plus the individualized attention your children will receive is unrivaled; we offer a 5:1 student-teacher ratio—the very lowest in the city.
[537] Article: “Emanuel Sending Kids to Private School.” By Kristen Mack. Chicago Tribune, July 22, 2011. <articles.chicagotribune.com>
Mayor Rahm Emanuel will bypass Chicago Public Schools, like many high-profile politicians before him, and send his children to the University of Chicago Laboratory Schools in Hyde Park this fall. …
Emanuel’s children previously attended a private religious school in Chicago before moving to Washington while he served as President Obama’s White House chief of staff. They attended private schools in Washington and finished the school year there.
[538] Article: “The 2015 Ednext Poll on School Reform: Public Thinking on Testing, Opt Out, Common Core, Unions, and More.” By Michael B. Henderson, Paul E. Peterson, and Martin R. West. Education Next, Winter 2016. <educationnext.org>
These are among the many findings to emerge from the ninth annual Education Next survey, administered in May and June 2015 to a nationally representative sample of some 4,000 respondents, including oversamples of roughly 700 teachers, 700 African Americans, and 700 Hispanics (see methodology sidebar). …
The results presented here are based upon a nationally representative, stratified sample of adults (age 18 years and older) and representative oversamples of the following subgroups: teachers (693), African Americans (661). and Hispanics (734). Total sample size is 4,083. Respondents could elect to complete the survey in English or Spanish. Survey weights were employed to account for nonresponse and the oversampling of specific groups. …
The survey was conducted from May 21 to June 8, 2015, by the polling firm Knowledge Networks (KN), a GfK company. KN maintains a nationally representative panel of adults, obtained via address-based sampling techniques, who agree to participate in a limited number of online surveys.
[539] Poll: “Policy and Governance Survey 2015.” Commissioned by Education Next and the Program on Education Policy and Governance at the Harvard Kennedy School of Government. Conducted by Knowledge Networks during May-June 2015. <www.educationnext.org>
Page 18:
21d. A proposal has been made that would use government funds to pay the tuition of all students who choose to attend private schools. Would you favor or oppose this proposal?
|
Public |
Parents |
Teachers |
Blacks |
Hispanics |
Whites |
|
|
Completely Support |
11% |
13% |
8% |
28% |
14% |
6% |
|
Somewhat Support |
16 |
21 |
11 |
17 |
20 |
16 |
|
Somewhat Oppose |
20 |
18 |
14 |
20 |
19 |
21 |
|
Completely Oppose |
38 |
36 |
59 |
16 |
26 |
45 |
|
Neither Support nor Oppose |
15 |
12 |
8 |
19 |
22 |
12 |
…
23. Thinking about the school-age children who currently live with you, what kinds of schools have they attended?
|
Public |
Parents |
Teachers |
Blacks |
Hispanics |
Whites |
|
|
Traditional public school |
85% |
85% |
84% |
91% |
85% |
83% |
|
Charter school |
9 |
9 |
10 |
10 |
11 |
8 |
|
Private school |
14 |
14 |
22 |
14 |
8 |
18 |
|
Home school |
6 |
6 |
8 |
7 |
4 |
7 |
[540] Press release: “Public Accountability & Private-School Choice.” By Adam Emerson. Thomas B. Fordham Institute, January 08, 2014. <edexcellence.net>
The Fordham Institute supports school choice, done right. That means designing voucher and tax-credit policies that provide an array of high-quality education options for kids that are also accountable to parents and taxpayers. In that vein, Fordham has created the Public accountability & private-school choice toolkit to help with the design of strong outcomes-based accountability in private-school-choice programs.
[541] Report: “Where Do Public School Teachers Send Their Kids to School?” By Denis P. Doyle, Brian Diepold, and David A. DeSchryver. Thomas B. Fordham Institute, September 7, 2004. <edex.s3-us-west-2.amazonaws.com>
Page 2:
Across the states, 12.2 percent of all families (urban, rural, and suburban) send their children to private schools—a figure that roughly corresponds to perennial and well-known data on the proportion of U.S. children enrolled in private schools. But urban public school teachers send their children to private schools at a rate of 21.5 percent, nearly double the national rate of private-school attendance. Urban public school teachers are also more likely to send their children to private school than are urban families in general (21.5 vs. 17.5 percent).
Page 6:
As commanded by the Constitution, every 10 years, the U.S. government undertakes a Census of the population. The 5 percent PUMS (Public Use Microdata Sample) data set is available in two media.
Public Use Microdata Areas (PUMAs) are the smallest unit within the PUMS. The PUMS data set provides access to answers from several hundred questions asked on the Census Long Form questionnaire. Because the Census Bureau must protect the privacy of individuals in the sample, one method is publishing the PUMS data in PUMAs, which are areas no smaller than 100,000 in population. …
The cities referenced in this paper are defined in two ways. This was necessary because the PUMAs do not seem to equal the political boundaries of cities, with a few exceptions such as Washington, D.C. The Census has defined each PUMA as belonging to a Metropolitan Statistical Area (MSA). The Census has also defined each PUMA as located in the central city if the entire PUMA is within the central city boundaries; located outside the central city if the entire PUMA is outside the city boundaries; or “unknown” for PUMAs that include areas inside and outside city boundaries. Subsequently, each household within a PUMA is assigned the same MSA and the same central city status. From this information, we are able to define the cities based on the MSA and the central city status.
[542] Entry: “segregation.” American Heritage Dictionary of the English Language (5th edition). Accessed October 1, 2020 at <www.thefreedictionary.com>
Definition 2: “The policy or practice of separating people of different races, classes, or ethnic groups, as in schools, housing, and public or commercial facilities, especially as a form of discrimination.”
[543] Ruling: Brown v. Board of Education of Topeka. U.S. Supreme Court, May 16, 1954. Decided 9–0. <supreme.justia.com>
Today, education is perhaps the most important function of state and local governments. … In these days, it is doubtful that any child may reasonably be expected to succeed in life if he is denied the opportunity of an education. Such an opportunity, where the state has undertaken to provide it, is a right which must be made available to all on equal terms.
We come then to the question presented: does segregation of children in public schools solely on the basis of race, even though the physical facilities and other “tangible” factors may be equal, deprive the children of the minority group of equal educational opportunities? We believe that it does. …
We conclude that, in the field of public education, the doctrine of “separate but equal” has no place. Separate educational facilities are inherently unequal. Therefore, we hold that the plaintiffs and others similarly situated for whom the actions have been brought are, by reason of the segregation complained of, deprived of the equal protection of the laws guaranteed by the Fourteenth Amendment.
[544] Fourteenth Amendment to the Constitution of the United States. Ratified July 9, 1868. <justfacts.com>
Section 1. All persons born or naturalized in the United States, and subject to the jurisdiction thereof, are citizens of the United States and of the State wherein they reside. No State shall make or enforce any law which shall abridge the privileges or immunities of citizens of the United States; nor shall any State deprive any person of life, liberty, or property, without due process of law; nor deny to any person within its jurisdiction the equal protection of the laws.
[545] Report: “Harming Our Common Future: America’s Segregated Schools 65 Years After Brown.” By Erica Frankenberg and others. UCLA [University of California at Los Angeles] Civil Rights Project and Center for Education and Civil Rights, May 10, 2019. <www.civilrightsproject.ucla.edu>
Page 4:
The publication of this report marks the 65th anniversary of Brown v. Board of Education, the landmark U.S. Supreme Court case declaring racial segregation in public schools unconstitutional. …
[T]here have been many changes since the ruling, but intense levels of segregation—which had decreased markedly after 1954 for black students—are on the rise once again. In the 1990s, a series of Supreme Court decisions led to the end of hundreds of desegregation orders and plans across the nation. This report shows that the growth of racial and economic segregation that began then has now continued unchecked for nearly three decades, placing the promise of Brown at grave risk.
[546] Report: “Harming Our Common Future: America’s Segregated Schools 65 Years After Brown.” By Erica Frankenberg and others. UCLA [University of California at Los Angeles] Civil Rights Project and Center for Education and Civil Rights, May 10, 2019. <www.civilrightsproject.ucla.edu>
Page 21:
Figure 3 shows the percentage of intensely segregated schools, that is schools that enroll 90–100% non-white students or 90–100% white students. Since the peak of desegregation for black students in 1988, the share of intensely segregated minority schools, that is, schools that enroll 90–100% non-white students, has more than tripled from 5.7% in 1988 to 18.2% in 2016. During the same time period, the share of intensely segregated white schools, that is, schools that enroll 90–100% white students, has declined from 38.9% in 1988 to 16% in 2016. The percentage of white students enrolled in intensely segregated white schools has also decreased from 36.1% in 2006 to 26% in 2011 and 19.6% in 2016 according to our analysis of CCD [U.S. Department of Education’s Common Core of Data] data.
Page 22: “Also noteworthy in these trends is that the share of intensely segregated minority schools (18.2%) is now greater than the share of intensely segregated white schools (16%).”
Page 43:
This report uses exposure statistics to measure segregation and to capture student experiences of segregation. Exposure of certain racial groups to one another or to majority groups shows the distribution of racial groups among organizational units and describes the average contact between different groups. It is calculated by employing the percentage of a particular group of students of interest in a small unit (e.g., school) with a certain group of students in a larger geographic or organizational unit (e.g., state or district) to show a weighted average of the composition of a particular racial group.
[547] Webpage: “A Thurgood Marshall Plan for Public Education.” By Bernie Sanders. Bernie 2020. Accessed May 21, 2019 at <berniesanders.com>
“Every human being has the fundamental right to a good education. On this 65th anniversary of the Brown v. Board of Education decision, we are committed to creating an education system that works for all people, not just the wealthy and powerful.” …
65 years after Brown v. Board of Education, many U.S. schools remain unacceptably segregated.1 …
As president, Bernie Sanders will: …
• Execute desegregation orders and appoint federal judges who will enforce the 1964 Civil Rights Act in school systems. …
1 <www.nytimes.com>
[548] Article: “ ‘Threatening the Future’: The High Stakes of Deepening School Segregation.” By Dana Goldstein. New York Times, May 10, 2019. <www.nytimes.com>
A new report from U.C.L.A. and Penn State outlines the changes in school segregation since the landmark Supreme Court ruling named after Oliver Brown [Brown v. Board of Education].…
The percentage of intensely segregated schools, defined as those where less than 10 percent of the student body is white, tripled between 1988 and 2016, from 6 to 18 percent. …
Because so few suburbs, especially outside the South, have a history of purposeful policymaking around school integration, “Doing nothing means accepting resegregation,” the report notes.
[549] Article: “Segregation Has Soared in America’s Schools as Federal Leaders Largely Looked Away.” By Seema Mehta and Michael Finnegan. Los Angeles Times, July 8, 2019. <www.latimes.com>
Progress toward school integration stalled in the late 1980s. In the three decades since then, racial and economic segregation has steadily increased. In some parts of the country, including the South, it has returned to levels last seen in the 1960s. …
Between 1969 and 2016, enrollment of white students in the U.S. dropped by 11 million as that of Latinos increased by the same amount, according to a May report by UCLA [University of California at Los Angeles] and Penn State. Whites remain the largest racial group in public schools, but are no longer the majority.
Now, many black and Latino students attend schools segregated by both race and poverty, the report found. Black children are again increasingly isolated from white and middle-class students, but are also often a minority in majority-Latino schools.
[550] Article: “The Promise of Historic Brown v. Board School Desegregation Ruling Is ‘At Grave Risk,’ Report Says.” By Valerie Strauss. Washington Post, May 10, 2019. <www.washingtonpost.com>
After all these years, a new report says that while Brown vs. Board may have led to desegregation in other parts of American society, it has been unsuccessful in its stated mission: to integrate public schools.
Now, the promise of the ruling is “at grave risk,” according to the report titled “Harming our Common Future: America’s Segregated Schools 65 Years after Brown.” …
It says that while intense levels of segregation markedly decreased for black students after the 1954 court ruling, they have been rising again since Supreme Court decisions in the 1990s led to the end of hundreds of desegregation orders and plans across the country. It says:
The growth of racial and economic segregation that began then has now continued unchecked for nearly three decades, placing the promise of Brown at grave risk. …
Despite the increase in diversity, segregation has intensified and expanded. Over the last three decades, black students have been increasingly segregated in intensely segregated schools (which are defined as being 90 to 100 percent nonwhite). By 2016, 40 percent of all black students were in schools with 90 percent or more students of color.
[551] Article: “On Brown v Board of Education’s 65th Anniversary, School Segregation Remains: Report.” By Sophie Tatum. ABC News, May 17, 2019. <abcnews.go.com>
The study by the University of California, Los Angeles’ [UCLA] The Civil Rights Project and Penn State University’s Center for Education and Civil Rights highlights that while the nation’s student population has grown more diverse, in the past 30 years, segregation for black students has gotten worse.
“There’s powerful research that shows that the Supreme Court was right, segregated schools are unequal for many reasons and we’re not making progress,” Gary Orfield, a professor at UCLA and the co-director of the Civil Rights Project, told ABC News. …
“We’ve been going backward ever since the early 1990’s when the Supreme Court changed directions and allowed the disillusion of desegregation plans. We really don’t have a strategy in place to deal with this issue even though we’re now a country with no racial majority in our public schools,” he said. …
According to the study, the high point for desegregation for black students was in 1988.
[552] Article: “Bernie Sanders’ Education Plan to Take Aim at Segregation in Public Schools.” By Cara Korte and LaCrai Mitchell. CBS News, May 18, 2019. <www.cbsnews.com>
[R]esearch shows that over the last several decades, public schools across the country have become increasingly segregated.
A 2019 study by UCLA [University of California at Los Angeles] and Penn State reported that three years ago 18 percent of U.S. public schools were “intensely segregated,” meaning that their student population was less than 10 percent white. According to the study, in 1988 only 6 percent of public schools met this definition.
[553] Report: “Harming Our Common Future: America’s Segregated Schools 65 Years After Brown.” By Erica Frankenberg and others. UCLA [University of California at Los Angeles] Civil Rights Project and Center for Education and Civil Rights, May 10, 2019. <www.civilrightsproject.ucla.edu>
Page 21:
Figure 3 shows the percentage of intensely segregated schools, that is schools that enroll 90–100% non-white students or 90–100% white students. Since the peak of desegregation for black students in 1988, the share of intensely segregated minority schools, that is, schools that enroll 90–100% non-white students, has more than tripled from 5.7% in 1988 to 18.2% in 2016. During the same time period, the share of intensely segregated white schools, that is, schools that enroll 90–100% white students, has declined from 38.9% in 1988 to 16% in 2016. The percentage of white students enrolled in intensely segregated white schools has also decreased from 36.1% in 2006 to 26% in 2011 and 19.6% in 2016 according to our analysis of CCD [U.S. Department of Education’s Common Core of Data] data.
Page 22: “Also noteworthy in these trends is that the share of intensely segregated minority schools (18.2%) is now greater than the share of intensely segregated white schools (16%).”
Page 43:
This report uses exposure statistics to measure segregation and to capture student experiences of segregation. Exposure of certain racial groups to one another or to majority groups shows the distribution of racial groups among organizational units and describes the average contact between different groups. It is calculated by employing the percentage of a particular group of students of interest in a small unit (e.g., school) with a certain group of students in a larger geographic or organizational unit (e.g., state or district) to show a weighted average of the composition of a particular racial group.
[554] Report: “Harming Our Common Future: America’s Segregated Schools 65 Years After Brown.” By Erica Frankenberg and others. UCLA [University of California at Los Angeles] Civil Rights Project and Center for Education and Civil Rights, May 10, 2019. <www.civilrightsproject.ucla.edu>
Page 6:
The driving force of our social change since 1970 has been an enormous increase in the Latino population….
… In the West today there are already more Latino than white students in the public schools, and in California only about a fourth of all students are white. In the South, the white minority in the region continues to decline as a share of total enrollment.
Page 10:
In 2019 … our nation’s public school enrollment no longer has a majority racial group. Although white students still comprise the largest racial group in our nation’s schools (23.9 million white students), after nearly a half-century of decline in the percentage of the overall enrollment, it is notable that white students no longer account for the majority of public school students (48.4%) in the United States. This is not because of a significant growth of the share of private schools but an impact of birth rates and immigration changes. The Latino share of enrollment has been growing tremendously such that more than half of the students of color in the United States identify as Latino (13 million students). Black students account for the third largest racial group (7.5 million) followed by Asian students, multiracial students, and American Indian students. This is a multiracial reality quite different from those existing at the time of the Brown decision.
Patterns of declining white enrollment and Latino growth are not new to the West, an area where white students have not been the majority for a while; in fact, there are more Latino students than white students in the West. However, the spread of Latino students across the United States is noteworthy. In the South, the region in which de jure segregation legally separated black and white students prior to Brown, the student enrollment has been transformed such that white students are no longer the majority and Latino students are the second largest racial group, followed by black students.
Our country’s public school enrollment is substantially more diverse than it was in 1954 when it was comprised of two main racial groups—black and white.
Page 16: “Figure 1: Percentage of Student Population in Public Schools, by Race, 1970 to 2016–17 … White … 1970 [=] 79.1% … 2016 [=] 48.4% … Latino … 1970 [=] 5.1 … 2016 [=] 26.3”
[555] Report: “Harming Our Common Future: America’s Segregated Schools 65 Years After Brown.” By Erica Frankenberg and others. UCLA [University of California at Los Angeles] Civil Rights Project and Center for Education and Civil Rights, May 10, 2019. <www.civilrightsproject.ucla.edu>
Page 6:
The driving force of our social change since 1970 has been an enormous increase in the Latino population….
… In the West today there are already more Latino than white students in the public schools, and in California only about a fourth of all students are white. In the South, the white minority in the region continues to decline as a share of total enrollment.
Page 10:
In 2019 … our nation’s public school enrollment no longer has a majority racial group. Although white students still comprise the largest racial group in our nation’s schools (23.9 million white students), after nearly a half-century of decline in the percentage of the overall enrollment, it is notable that white students no longer account for the majority of public school students (48.4%) in the United States. This is not because of a significant growth of the share of private schools but an impact of birth rates and immigration changes. The Latino share of enrollment has been growing tremendously such that more than half of the students of color in the United States identify as Latino (13 million students). Black students account for the third largest racial group (7.5 million) followed by Asian students, multiracial students, and American Indian students. This is a multiracial reality quite different from those existing at the time of the Brown decision.
Patterns of declining white enrollment and Latino growth are not new to the West, an area where white students have not been the majority for a while; in fact, there are more Latino students than white students in the West. However, the spread of Latino students across the United States is noteworthy. In the South, the region in which de jure segregation legally separated black and white students prior to Brown, the student enrollment has been transformed such that white students are no longer the majority and Latino students are the second largest racial group, followed by black students.
Our country’s public school enrollment is substantially more diverse than it was in 1954 when it was comprised of two main racial groups—black and white.
Page 16: “Figure 1: Percentage of Student Population in Public Schools, by Race, 1970 to 2016–17 … White … 1970 [=] 79.1% … 2016 [=] 48.4% … Latino … 1970 [=] 5.1 … 2016 [=] 26.3”
[556] Webpage: “Fighting for Racial Justice.” Kamala Harris. Accessed June 28, 2019 at <kamalaharris.org>
“Truly addressing racial inequality also requires that we finally provide every child access to opportunity. Yet, 65 years after Brown v. Board, opportunity is still denied and educational segregation is getting worse. Kamala was a part of only the second class to integrate at Berkeley public schools after Brown, and she knows there is so much more work to do.”
[557] Article: “Kamala Harris Doubles Down on Calls to Desegregate Schools.” By Sanjana Karanth. Huffington Post, June 30, 2019. <www.yahoo.com>
Sen. Kamala Harris (D-Calif.) is standing by her support for busing as an effective tool the federal government should use to help desegregate schools. …
“I support busing,” she told reporters outside city hall. “Listen, the schools of America are as segregated, if not more segregated today than when I was in elementary school. And we need to put every effort, including busing, into play to desegregate the schools.”
[558] Dataset: “Table H-5. Race and Hispanic Origin of Householder – Households by Median and Mean Income: 1967 to 2019.” U.S. Census Bureau. Last revised September 8, 2020. <www.census.gov>
“Median income … Current dollars … 2019 … White Alone [=] $72,204 … Black Alone [=] $45,438 … Asian Alone [=] $98,174 … Hispanic (any race) [=] $56,113”
NOTE: Like all Census Bureau measures of “money” income, this dataset doesn’t include noncash benefits like subsidized housing, food stamps, charitable services, and government or employer-provided health benefits. Also, the data is collected via government surveys, and low-income households substantially underreport their income on such surveys.
[559] Webpage: “Current Population Survey (CPS) Respondents.” Bureau of Labor Statistics. Last modified September 23, 2011. <www.bls.gov>
General Questions
1. What is the Current Population Survey?
The Current Population Survey (CPS) is a monthly survey of households conducted by the Census Bureau for the Bureau of Labor Statistics. In addition to the national unemployment rate, it provides a comprehensive body of data on the labor force, employment, unemployment, the unemployment rate, persons not in the labor force, hours of work, earnings, and other demographic and labor force characteristics. …
7. How will I complete the interview?
You will be interviewed at your home or over the telephone by a Census Bureau employee. The survey is not conducted by mail, e-mail, or online. …
10. I’m not available right now. Can someone else in my household respond instead?
Yes. Any household member 15 years of age or older can respond for the household. However, we would like to talk to someone who is knowledgeable about people in the household.
[560] “Basic CPS Items Booklet, Labor Force Items.” U.S. Census Bureau. Accessed December 1, 2017 at <www2.census.gov>
Pages 44–45 (of PDF):
Which category represents (your/name of reference person/the total combined income) (total combined income during the past 12 months?/ of all members of your FAMILY during the past 12 months?/ of all members of (name of reference person)’s FAMILY during the past 12 months?)
This includes money from jobs, net income from business, farm or rent, pensions, dividends, interest, social security payments and any other money income received (. / by members of (your/ name of reference person) FAMILY who are 15 years of age or older.)
[561] Report: “Income and Poverty in the United States: 2019.” By Jessica Semega and others. U.S. Census Bureau, September 2020. <www.census.gov>
Page 20: “The income and poverty estimates shown in this report are based solely on money income before taxes and do not include the value of noncash benefits such as those provided by the Supplemental Nutrition Assistance Program, Medicare, Medicaid, public housing, or employer-provided fringe benefits.”
Page 23:
Data on income collected in the ASEC [Current Population Survey Annual Social and Economic Supplements] by the U.S. Census Bureau cover money income received (exclusive of certain money receipts such as capital gains) before payments for personal income taxes, social security, union dues, Medicare deductions, etc. Therefore, money income does not reflect the fact that some families receive noncash benefits such as Supplemental Nutrition Assistance/food stamps, health benefits, and subsidized housing. In addition, money income does not reflect the fact that noncash benefits often take the form of the use of business transportation and facilities, full or partial payments by business for retirement programs, medical and educational expenses, etc. Data users should consider these elements when comparing income levels. Moreover, readers should be aware that for many different reasons there is a tendency in household surveys for respondents to underreport their income. Based on an analysis of independently derived income estimates, the Census Bureau determined that respondents report income earned from wages or salaries more accurately than other sources of income, and that the reported wage and salary income is nearly equal to independent estimates of aggregate income.
[562] Calculated with the dataset: “Table 3. Median Usual Weekly Earnings of Full-Time Wage and Salary Workers by Age, Race, Hispanic or Latino Ethnicity, and Sex, Not Seasonally Adjusted.” U.S. Department of Labor, Bureau of Labor Statistics. Accessed July 8, 2021 at <www.bls.gov>
“Labor Force Statistics (CPS) [Current Population Survey] … Median weekly earnings … White 25 to 54 years… 2020 … Annual [=] $1,037 … Black or African American 25 to 54 years … 2020 … Annual [=] $819 … Asian 25 to 54 years … 2020 … Annual [=] $1,398 … Hispanic or Latino ethnicity 25 to 54 years … 2019 … Annual [=] $799”
CALCULATIONS:
NOTE: Like all Census Bureau measures of “money” income, this dataset doesn’t include noncash benefits like subsidized housing, food stamps, charitable services, and government or employer-provided health benefits. Also, the data is collected via government surveys, and low-income households substantially underreport their income on such surveys.
[563] Webpage: “Current Population Survey (CPS) Respondents.” U.S. Census Bureau. Last updated September 23, 2011. <www.bls.gov>
General Questions
1. What is the Current Population Survey?
The Current Population Survey (CPS) is a monthly survey of households conducted by the Census Bureau for the Bureau of Labor Statistics. In addition to the national unemployment rate, it provides a comprehensive body of data on the labor force, employment, unemployment, the unemployment rate, persons not in the labor force, hours of work, earnings, and other demographic and labor force characteristics. …
7. How will I complete the interview?
You will be interviewed at your home or over the telephone by a Census Bureau employee. The survey is not conducted by mail, e-mail, or online. …
10. I’m not available right now. Can someone else in my household respond instead?
Yes. Any household member 15 years of age or older can respond for the household. However, we would like to talk to someone who is knowledgeable about people in the household.
[564] “Basic CPS Items Booklet, Labor Force Items.” U.S. Census Bureau. Accessed December 1, 2017 at <www2.census.gov>
Pages 44–45 (of PDF):
Which category represents (your/name of reference person/the total combined income) (total combined income during the past 12 months?/ of all members of your FAMILY during the past 12 months?/ of all members of (name of reference person)’s FAMILY during the past 12 months?)
This includes money from jobs, net income from business, farm or rent, pensions, dividends, interest, social security payments and any other money income received (. / by members of (your/ name of reference person) FAMILY who are 15 years of age or older.)
[565] Report: “Income and Poverty in the United States: 2019.” By Jessica Semega and others. U.S. Census Bureau, September 2020. <www.census.gov>
Page 20: “The income and poverty estimates shown in this report are based solely on money income before taxes and do not include the value of noncash benefits such as those provided by the Supplemental Nutrition Assistance Program, Medicare, Medicaid, public housing, or employer-provided fringe benefits.”
Page 23:
Data on income collected in the ASEC [Current Population Survey Annual Social and Economic Supplements] by the U.S. Census Bureau cover money income received (exclusive of certain money receipts such as capital gains) before payments for personal income taxes, social security, union dues, Medicare deductions, etc. Therefore, money income does not reflect the fact that some families receive noncash benefits such as Supplemental Nutrition Assistance/food stamps, health benefits, and subsidized housing. In addition, money income does not reflect the fact that noncash benefits often take the form of the use of business transportation and facilities, full or partial payments by business for retirement programs, medical and educational expenses, etc. Data users should consider these elements when comparing income levels. Moreover, readers should be aware that for many different reasons there is a tendency in household surveys for respondents to underreport their income. Based on an analysis of independently derived income estimates, the Census Bureau determined that respondents report income earned from wages or salaries more accurately than other sources of income, and that the reported wage and salary income is nearly equal to independent estimates of aggregate income.
[566] Calculated with the dataset: “HH-1. Households by Type: 1940 to Present.” U.S. Census Bureau, Current Population Survey, December 2020. <www.census.gov>
NOTE: An Excel file containing the data and calculations is available upon request.
[567] Dataset: “HINC-01. Selected Characteristics of Households by Total Money Income 2019: All Races.” U.S. Census Bureau, Current Population Survey, Annual Social and Economic Supplement, March 2020. <www.census.gov>
NOTES:
[568] Webpage: “Current Population Survey (CPS) Respondents.” U.S. Census Bureau. Last updated September 23, 2011. <www.bls.gov>
General Questions
1. What is the Current Population Survey?
The Current Population Survey (CPS) is a monthly survey of households conducted by the Census Bureau for the Bureau of Labor Statistics. In addition to the national unemployment rate, it provides a comprehensive body of data on the labor force, employment, unemployment, the unemployment rate, persons not in the labor force, hours of work, earnings, and other demographic and labor force characteristics. …
7. How will I complete the interview?
You will be interviewed at your home or over the telephone by a Census Bureau employee. The survey is not conducted by mail, e-mail, or online. …
10. I’m not available right now. Can someone else in my household respond instead?
Yes. Any household member 15 years of age or older can respond for the household. However, we would like to talk to someone who is knowledgeable about people in the household.
[569] “Basic CPS Items Booklet, Labor Force Items.” U.S. Census Bureau. Accessed December 1, 2017 at <www2.census.gov>
Pages 44–45 (of PDF):
Which category represents (your/name of reference person/the total combined income) (total combined income during the past 12 months?/ of all members of your FAMILY during the past 12 months?/ of all members of (name of reference person)’s FAMILY during the past 12 months?)
This includes money from jobs, net income from business, farm or rent, pensions, dividends, interest, social security payments and any other money income received (. / by members of (your/ name of reference person) FAMILY who are 15 years of age or older.)
[570] Report: “Income and Poverty in the United States: 2019.” By Jessica Semega and others. U.S. Census Bureau, September 2020. <www.census.gov>
Page 20: “The income and poverty estimates shown in this report are based solely on money income before taxes and do not include the value of noncash benefits such as those provided by the Supplemental Nutrition Assistance Program, Medicare, Medicaid, public housing, or employer-provided fringe benefits.”
Page 23:
Data on income collected in the ASEC [Current Population Survey Annual Social and Economic Supplements] by the U.S. Census Bureau cover money income received (exclusive of certain money receipts such as capital gains) before payments for personal income taxes, social security, union dues, Medicare deductions, etc. Therefore, money income does not reflect the fact that some families receive noncash benefits such as Supplemental Nutrition Assistance/food stamps, health benefits, and subsidized housing. In addition, money income does not reflect the fact that noncash benefits often take the form of the use of business transportation and facilities, full or partial payments by business for retirement programs, medical and educational expenses, etc. Data users should consider these elements when comparing income levels. Moreover, readers should be aware that for many different reasons there is a tendency in household surveys for respondents to underreport their income. Based on an analysis of independently derived income estimates, the Census Bureau determined that respondents report income earned from wages or salaries more accurately than other sources of income, and that the reported wage and salary income is nearly equal to independent estimates of aggregate income.
[571] Calculated with the dataset: “Persons by Kind of Family, Race, and Hispanic Origin, 2020.” U.S. Census Bureau, Current Population Survey, Annual Social and Economic Supplement, March 2020. <data.census.gov>
NOTE: An Excel file containing the data and calculations is available upon request.
[572] Dataset: “HINC-01. Selected Characteristics of Households by Total Money Income 2019.” U.S. Census Bureau, Current Population Survey, Annual Social and Economic Supplement, March 2020. <www.census.gov>
NOTE: Like all Census Bureau measures of “money” income, this dataset doesn’t include noncash benefits like subsidized housing, food stamps, charitable services, and government or employer-provided health benefits. Also, the data is collected via government surveys, and low-income households substantially underreport their income on such surveys.
[573] Webpage: “Current Population Survey (CPS) Respondents.” U.S. Census Bureau. Last updated September 23, 2011. <www.bls.gov>
General Questions
1. What is the Current Population Survey?
The Current Population Survey (CPS) is a monthly survey of households conducted by the Census Bureau for the Bureau of Labor Statistics. In addition to the national unemployment rate, it provides a comprehensive body of data on the labor force, employment, unemployment, the unemployment rate, persons not in the labor force, hours of work, earnings, and other demographic and labor force characteristics. …
7. How will I complete the interview?
You will be interviewed at your home or over the telephone by a Census Bureau employee. The survey is not conducted by mail, e-mail, or online. …
10. I’m not available right now. Can someone else in my household respond instead?
Yes. Any household member 15 years of age or older can respond for the household. However, we would like to talk to someone who is knowledgeable about people in the household.
[574] “Basic CPS Items Booklet, Labor Force Items.” U.S. Census Bureau. Accessed December 1, 2017 at <www2.census.gov>
Pages 44–45 (of PDF):
Which category represents (your/name of reference person/the total combined income) (total combined income during the past 12 months?/ of all members of your FAMILY during the past 12 months?/ of all members of (name of reference person)’s FAMILY during the past 12 months?)
This includes money from jobs, net income from business, farm or rent, pensions, dividends, interest, social security payments and any other money income received (. / by members of (your/ name of reference person) FAMILY who are 15 years of age or older.)
[575] Report: “Income and Poverty in the United States: 2019.” By Jessica Semega and others. U.S. Census Bureau, September 2020. <www.census.gov>
Page 20: “The income and poverty estimates shown in this report are based solely on money income before taxes and do not include the value of noncash benefits such as those provided by the Supplemental Nutrition Assistance Program, Medicare, Medicaid, public housing, or employer-provided fringe benefits.”
Page 23:
Data on income collected in the ASEC [Current Population Survey Annual Social and Economic Supplements] by the U.S. Census Bureau cover money income received (exclusive of certain money receipts such as capital gains) before payments for personal income taxes, social security, union dues, Medicare deductions, etc. Therefore, money income does not reflect the fact that some families receive noncash benefits such as Supplemental Nutrition Assistance/food stamps, health benefits, and subsidized housing. In addition, money income does not reflect the fact that noncash benefits often take the form of the use of business transportation and facilities, full or partial payments by business for retirement programs, medical and educational expenses, etc. Data users should consider these elements when comparing income levels. Moreover, readers should be aware that for many different reasons there is a tendency in household surveys for respondents to underreport their income. Based on an analysis of independently derived income estimates, the Census Bureau determined that respondents report income earned from wages or salaries more accurately than other sources of income, and that the reported wage and salary income is nearly equal to independent estimates of aggregate income.
[576] Calculated with data from:
a) Dataset: “2019 Poverty Status of Persons in the Poverty Universe by Marital Status and Race.” U.S. Census Bureau, Current Population Survey Annual Social and Economic Supplement, March 2020. <data.census.gov>
b) Dataset: “2019 Poverty Status of Persons in the Poverty Universe by Marital Status and Hispanic Origin.” U.S. Census Bureau, Current Population Survey Annual Social and Economic Supplement, March 2020. <data.census.gov>
NOTE: An Excel file containing the data and calculations is available upon request.
[577] Webpage: “Current Population Survey (CPS) Respondents.” U.S. Census Bureau. Last updated September 23, 2011. <www.bls.gov>
General Questions
1. What is the Current Population Survey?
The Current Population Survey (CPS) is a monthly survey of households conducted by the Census Bureau for the Bureau of Labor Statistics. In addition to the national unemployment rate, it provides a comprehensive body of data on the labor force, employment, unemployment, the unemployment rate, persons not in the labor force, hours of work, earnings, and other demographic and labor force characteristics. …
7. How will I complete the interview?
You will be interviewed at your home or over the telephone by a Census Bureau employee. The survey is not conducted by mail, e-mail, or online. …
10. I’m not available right now. Can someone else in my household respond instead?
Yes. Any household member 15 years of age or older can respond for the household. However, we would like to talk to someone who is knowledgeable about people in the household.
[578] Webpage: “Universe Definitions.” U.S. Census Bureau. Last revised August 16, 2018. <www.census.gov>
“Persons in Poverty Universe (excludes unrelated individuals under 15) – Includes everyone in the civilian non-institutionalized population living in the United States, EXCEPT unrelated individuals under the age of 15. Members of the Armed Forces living off post, or with their families on post, are included if at least one civilian adult lives in the household.”
[579] Dataset: “Table F-10. Presence of Children Under 18 Years Old – All Families by Median and Mean Income: 1974 to 2019.” U.S. Census Bureau. Last revised September 15, 2020. <www2.census.gov>
“Median income … Current dollars … Married-Couple Families … One or More Children Under 18 Years Old … 2019 [=] $111,281 … Female Householder, No Spouse Present … One or More Children Under 18 Years Old … 2019 [=] $36,061 … Male Householder, No Spouse Present … One or More Children Under 18 Years Old … 2019 [=] $52,676”
NOTE: Like all Census Bureau measures of “money” income, this datasets doesn’t include noncash benefits like subsidized housing, food stamps, charitable services, and government or employer-provided health benefits. Also, the data is collected via government surveys, and low-income households substantially underreport their income on such surveys.
[580] Report: “Income and Poverty in the United States: 2019.” By Jessica Semega and others. U.S. Census Bureau, September 2020. <www.census.gov>
Page 20: “The income and poverty estimates shown in this report are based solely on money income before taxes and do not include the value of noncash benefits such as those provided by the Supplemental Nutrition Assistance Program, Medicare, Medicaid, public housing, or employer-provided fringe benefits.”
Page 23:
Data on income collected in the ASEC [Current Population Survey Annual Social and Economic Supplements] by the U.S. Census Bureau cover money income received (exclusive of certain money receipts such as capital gains) before payments for personal income taxes, social security, union dues, Medicare deductions, etc. Therefore, money income does not reflect the fact that some families receive noncash benefits such as Supplemental Nutrition Assistance/food stamps, health benefits, and subsidized housing. In addition, money income does not reflect the fact that noncash benefits often take the form of the use of business transportation and facilities, full or partial payments by business for retirement programs, medical and educational expenses, etc. Data users should consider these elements when comparing income levels. Moreover, readers should be aware that for many different reasons there is a tendency in household surveys for respondents to underreport their income. Based on an analysis of independently derived income estimates, the Census Bureau determined that respondents report income earned from wages or salaries more accurately than other sources of income, and that the reported wage and salary income is nearly equal to independent estimates of aggregate income.
[581] Calculated with the dataset: “Table CH-2. Living Arrangements of White Children Under 18 Years Old: 1960 to Present.” U.S. Census Bureau, December 2020. <www.census.gov>
NOTE: An Excel file containing the data and calculations is available upon request.
[582] Calculated with the dataset: “Table CH-3. Living Arrangements of Black Children Under 18 Years Old: 1960 to Present.” U.S. Census Bureau, December 2020. <www.census.gov>
NOTE: An Excel file containing the data and calculations is available upon request.
[583] Report: “Breadwinner Moms.” By Wendy Wang, Kim Parker, and Paul Taylor. Pew Research Center, May 29, 2013. <www.pewsocialtrends.org>
Pages 8–9:
In the current survey, whites are more likely than non-whites to see this trend as a problem. Some 67% of whites compared with 56% of non-whites say the growing number of children born to unmarried mothers is a big problem.11
Young adults have much different views on this issue than do middle-aged and older adults. Only 42% of those ages 18–29 view the rising share of unmarried mothers as a big problem. By contrast, 65% of those ages 30–49 say this is a big problem, as do 74% of those ages 50 and older.
Page 25:
The survey findings presented in this report are based on an omnibus survey, conducted April 25 to 28, 2013, with a nationally representative sample of 1,003 adults living in the continental United States. Telephone interviews were conducted by landline (500) and cell phone (503, including 237 without a landline phone). … Statistical results are weighted to correct known demographic discrepancies. The margin of sampling error for the complete set of weighted data is plus or minus 3.5 percentage points at the 95% confidence level.
Page 28: “The number of children born to unmarried mothers in this country has been growing steadily. Would you say this is a big problem, a small problem or not a problem at all?”
[584] Document: “Gallup Poll Social Series: Values and Beliefs.” By Jeff Jones and Lydia Saad. Gallup, May 29, 2014. <www.gallup.com>
Page 5:
Q.18 (Moral Acceptability) Continued
F. Sex between an unmarried man and woman
2014 May 8–11 … Morally acceptable [=] 66% …
2001 May 10–14 … Morally acceptable [=] 53%
Page 6:
Q.18 (Moral Acceptability) Continued
H. Divorce
2014 May 8–11 … Morally acceptable [=] 69% …
2001 May 10–14 … Morally acceptable [=] 59%
Page 8:
Q.18 (Moral Acceptability) Continued
M. Having a baby outside of marriage
2014 May 8–11 … Morally acceptable [=] 58% …
2001 May 10–14 … Morally acceptable [=] 45%
[585] Report: “Gallup Poll Social Series: Values and Beliefs, Final Topline.” Gallup, May 2021. <news.gallup.com>
Page 1 (of PDF): “Results are based on telephone interviews conducted May 3–18, 2021 with a random sample of —1,016—adults, ages 18+, living in all 50 U.S. states and the District of Columbia. For results based on this sample of national adults, the margin of sampling error is ±4 percentage points at the 95% confidence level.”
Page 2 (of PDF):
Next, I’m going to read you a list of issues. Regardless of whether or not you think it should be legal, for each one, please tell me whether you personally believe that in general it is morally acceptable or morally wrong. … Divorce … Morally acceptable [=] 79% … Sex between an unmarried man and woman … Morally acceptable [=] 73% … Having a baby outside of marriage … Morally acceptable [=] 67%
[586] Report: “Gallup Poll Social Series: Values and Beliefs, Final Topline.” Gallup, May 2021. <news.gallup.com>
Page 23 (of PDF): “QN19F: Morally Acceptable Sex Between Unmarried Adults BY Total + Gender + Race I + Age + Education + Party I.D. + Ideology … Party I.D. … Republican [=] 61% … Independent [=] 75% … Democrat [=] 81%”
Page 24 (of PDF): “QN19H: Morally Acceptable Divorce BY Total + Gender + Race I + Age + Education + Party I.D. + Ideology … Party I.D. … Republican [=] 72% … Independent [=] 78% … Democrat [=] 85%”
Page 27 (of PDF): “QN19M: Morally Acceptable Having a Baby Outside of Marriage BY Total + Gender + Race I + Age + Education + Party I.D. + Ideology … Party I.D. … Republican [=] 56% … Independent [=] 73% … Democrat [=] 70%”
[587] Dataset: “People 25 Years Old and Over, by Total Money Earnings in 2019.” U.S. Census Bureau. Accessed November 10, 2020 at <www2.census.gov>
“Both Sexes, 25 to 64 Years, Total Work Experience, All Races”
NOTES:
[588] Webpage: “Academic Degree and Certificate Definitions.” Arkansas Department of Higher Education, Research and Planning Division. Accessed July 17, 2015 at <www.adhe.edu>
Associate degree (two years or more): a degree granted upon completion of a program that requires at least two, but fewer than four, academic years of postsecondary education. It includes a level of general education necessary for growth as a lifelong learner and is comprised of 60–72 semester credit hours. There are four types of associate degrees: …
Baccalaureate (bachelor’s) degree: a degree granted upon completion of a program that requires four to five years of full-time college work and carries the title of bachelor. …
Master’s degree: a degree which requires at least one, but no more than two, full-time equivalent years of study beyond the bachelor’s degree.
Doctoral degree: a degree awarded upon completion of an educational program at the graduate level which terminates in a doctor’s degree. …
First professional degree: a degree awarded upon completion of a program which meets all of these criteria: a) completion of academic requirements to begin practice in the profession; b) at least two years of college work before entering the program; and c) at least six academic years of college work to complete the degree program, including the prior required college work. First professional degrees are awarded in these fields:
• Chiropractic (DC)
• Dentistry (DDS or DMD)
• Law (LLB or JD)
• Medicine (MD)
• Optometry (OD)
• Osteopathic Medicine (DO)
• Pharmacy (Pharm.D.)
• Podiatry (Pod D or DP)
• Theology (M Div or MHL)
• Veterinary Medicine (DVM)
[589] Calculated with data from:
a) Dataset: “2020 Educational Attainment of Persons Aged 25–64 by Race.” U.S. Census Bureau. Accessed July 9, 2021 at <data.census.gov>
b) Dataset: “2020 Educational Attainment of Persons Aged 25–64 by Hispanic Origin.” U.S. Census Bureau. Accessed July 9, 2021 at <data.census.gov>
NOTE: An Excel file containing the data and calculations is available upon request.
[590] Webpage: “Current Population Survey (CPS) Respondents.” U.S. Census Bureau. Last updated September 23, 2011. <www.bls.gov>
General Questions
1. What is the Current Population Survey?
The Current Population Survey (CPS) is a monthly survey of households conducted by the Census Bureau for the Bureau of Labor Statistics. In addition to the national unemployment rate, it provides a comprehensive body of data on the labor force, employment, unemployment, the unemployment rate, persons not in the labor force, hours of work, earnings, and other demographic and labor force characteristics. …
7. How will I complete the interview?
You will be interviewed at your home or over the telephone by a Census Bureau employee. The survey is not conducted by mail, e-mail, or online. …
10. I’m not available right now. Can someone else in my household respond instead?
Yes. Any household member 15 years of age or older can respond for the household. However, we would like to talk to someone who is knowledgeable about people in the household.
[591] Calculated with data from:
a) Dataset: “Median Usual Weekly Earnings (Second Quartile), Employed Full Time, Wage and Salary Workers, High School Graduates, No College, 25 Years and Over, White.” U.S. Department of Labor, Bureau of Labor Statistics. Accessed July 9, 2021 at <beta.bls.gov>
“Annual 2020 [=] $811”
b) Dataset: “Median Usual Weekly Earnings (Second Quartile), Employed Full Time, Wage and Salary Workers, High School Graduates, No College, 25 Years and Over, Black or African American.” U.S. Department of Labor, Bureau of Labor Statistics. Accessed July 9, 2021 at <beta.bls.gov>
“Annual 2020 [=] $685”
c) Dataset: “Median Usual Weekly Earnings (Second Quartile), Employed Full Time, Wage and Salary Workers, High School Graduates, No College, 25 Years and Over, Asian.” U.S. Department of Labor, Bureau of Labor Statistics. Accessed July 9, 2021 at <beta.bls.gov>
“Annual 2020 [=] $702”
d) Dataset: “Median Usual Weekly Earnings (Second Quartile), Employed Full Time, Wage and Salary Workers, High School Graduates, No College, 25 Years and Over, Hispanic or Latino.” U.S. Department of Labor, Bureau of Labor Statistics. Accessed July 9, 2021 at <beta.bls.gov>
“Annual 2020 [=] $721”
CALCULATIONS:
NOTE: Like all Census Bureau measures of “money” income, this dataset doesn’t include noncash benefits like subsidized housing, food stamps, charitable services, and government or employer-provided health benefits. Also, the data is collected via government surveys, and low-income households substantially underreport their income on such surveys.
[592] Calculated with data from:
a) Dataset: “Median Usual Weekly Earnings (Second Quartile), Employed Full Time, Wage and Salary Workers, Bachelor’s Degree or Higher, 25 Years and Over, White.” U.S. Department of Labor, Bureau of Labor Statistics. Accessed July 9, 2021 at <beta.bls.gov>
“Annual 2020 [=] 1,433”
b) Dataset: “Median Usual Weekly Earnings (Second Quartile), Employed Full Time, Wage and Salary Workers, Bachelor’s Degree or Higher, 25 Years and Over, Black or African American.” U.S. Department of Labor, Bureau of Labor Statistics. Accessed July 9, 2021 at <beta.bls.gov>
“Annual 2020 [=] 1,166”
c) Dataset: “Median Usual Weekly Earnings (Second Quartile), Employed Full Time, Wage and Salary Workers, Bachelor’s Degree or Higher, 25 Years and Over, Asian.” U.S. Department of Labor, Bureau of Labor Statistics. Accessed July 9, 2021 at <beta.bls.gov>
“Annual 2020 [=] 1,650”
d) Dataset: “Median Usual Weekly Earnings (Second Quartile), Employed Full Time, Wage and Salary Workers, Bachelor’s Degree or Higher, 25 Years and Over, Hispanic or Latino.” U.S. Department of Labor, Bureau of Labor Statistics. Accessed July 9, 2021 at <beta.bls.gov>
“Annual 2020 [=] 1,230”
CALCULATIONS:
NOTE: Like all Census Bureau measures of “money” income, this dataset doesn’t include noncash benefits like subsidized housing, food stamps, charitable services, and government or employer-provided health benefits. Also, the data is collected via government surveys, and low-income households substantially underreport their income on such surveys.
[593] Webpage: “Current Population Survey (CPS) Respondents.” U.S. Census Bureau. Last updated September 23, 2011. <www.bls.gov>
General Questions
1. What is the Current Population Survey?
The Current Population Survey (CPS) is a monthly survey of households conducted by the Census Bureau for the Bureau of Labor Statistics. In addition to the national unemployment rate, it provides a comprehensive body of data on the labor force, employment, unemployment, the unemployment rate, persons not in the labor force, hours of work, earnings, and other demographic and labor force characteristics. …
7. How will I complete the interview?
You will be interviewed at your home or over the telephone by a Census Bureau employee. The survey is not conducted by mail, e-mail, or online. …
10. I’m not available right now. Can someone else in my household respond instead?
Yes. Any household member 15 years of age or older can respond for the household. However, we would like to talk to someone who is knowledgeable about people in the household.
[594] “Basic CPS Items Booklet, Labor Force Items.” U.S. Census Bureau. Accessed December 1, 2017 at <www2.census.gov>
Pages 44–45 (of PDF):
Which category represents (your/name of reference person/the total combined income) (total combined income during the past 12 months?/ of all members of your FAMILY during the past 12 months?/ of all members of (name of reference person)’s FAMILY during the past 12 months?)
This includes money from jobs, net income from business, farm or rent, pensions, dividends, interest, social security payments and any other money income received (. / by members of (your/ name of reference person) FAMILY who are 15 years of age or older.)
[595] Report: “Income and Poverty in the United States: 2019.” By Jessica Semega and others. U.S. Census Bureau, September 2020. <www.census.gov>
Page 20: “The income and poverty estimates shown in this report are based solely on money income before taxes and do not include the value of noncash benefits such as those provided by the Supplemental Nutrition Assistance Program, Medicare, Medicaid, public housing, or employer-provided fringe benefits.”
Page 23:
Data on income collected in the ASEC [Current Population Survey Annual Social and Economic Supplements] by the U.S. Census Bureau cover money income received (exclusive of certain money receipts such as capital gains) before payments for personal income taxes, social security, union dues, Medicare deductions, etc. Therefore, money income does not reflect the fact that some families receive noncash benefits such as Supplemental Nutrition Assistance/food stamps, health benefits, and subsidized housing. In addition, money income does not reflect the fact that noncash benefits often take the form of the use of business transportation and facilities, full or partial payments by business for retirement programs, medical and educational expenses, etc. Data users should consider these elements when comparing income levels. Moreover, readers should be aware that for many different reasons there is a tendency in household surveys for respondents to underreport their income. Based on an analysis of independently derived income estimates, the Census Bureau determined that respondents report income earned from wages or salaries more accurately than other sources of income, and that the reported wage and salary income is nearly equal to independent estimates of aggregate income.
[596] Report: “Investing in English Skills: The Limited English Proficient Workforce in U.S. Metropolitan Areas.” By Jill H. Wilson. Brookings Institution, September 2014. <www.brookings.edu>
Page 1:
Nearly one in 10 working-age U.S. adults—19.2 million persons aged 16 to 64—is considered limited English proficient. Two-thirds of this population speaks Spanish, but speakers of Asian and Pacific Island languages are most likely to be LEP [limited English proficient]. The vast majority of working-age LEP adults are immigrants, and those who entered the United States more recently are more likely to be LEP.
Working-age LEP adults earn 25 to 40 percent less than their English proficient counterparts. While less educated overall than English proficient adults, most LEP adults have a high school diploma, and 15 percent hold a college degree. LEP workers concentrate in low-paying jobs and different industries than other workers.
Page 2:
English proficiency is a strong predictor of economic standing among immigrants regardless of educational attainment. Numerous studies have shown that immigrants who are proficient in English earn more than those who lack proficiency, with higher skilled immigrants reaping the greatest advantage.2 Conversely, high-skilled immigrants who are not proficient in English are twice as likely to work in “unskilled” jobs (i.e. those requiring low levels of education or training) as those who are proficient in English.3 This underemployment represents a loss of productivity that yields lower wages for individuals and families and lower tax revenues and consumer spending for local areas. LEP immigrants also have higher rates of unemployment and poverty than their English proficient counterparts.4 Moreover, higher proficiency in English among immigrants is associated with the greater academic and economic success of their children.5 English skills also contribute to immigrants’ civic involvement and social connection to their new home.6
[597] Dataset: “2019 Average Earnings of People 25 to 64 Years Old by Nativity, Race, and Educational Attainment.” U.S. Census Bureau, Current Population Survey Annual Social and Economic Supplement, March 2020. <data.census.gov>
NOTE: Like all Census Bureau measures of “money” income, this dataset doesn’t include noncash benefits like subsidized housing, food stamps, charitable services, and government or employer-provided health benefits. Also, the data is collected via government surveys, and low-income households substantially underreport their income on such surveys.
[598] Dataset: “2019 Average Earnings of People 25 to 64 Years Old by Nativity, Hispanic Origin, and Educational Attainment.” U.S. Census Bureau, Current Population Survey Annual Social and Economic Supplement, March 2020. <data.census.gov>
NOTE: Like all Census Bureau measures of “money” income, this dataset doesn’t include noncash benefits like subsidized housing, food stamps, charitable services, and government or employer-provided health benefits. Also, the data is collected via government surveys, and low-income households substantially underreport their income on such surveys.
[599] Webpage: “Current Population Survey (CPS) Respondents.” U.S. Census Bureau. Last updated September 23, 2011. <www.bls.gov>
General Questions
1. What is the Current Population Survey?
The Current Population Survey (CPS) is a monthly survey of households conducted by the Census Bureau for the Bureau of Labor Statistics. In addition to the national unemployment rate, it provides a comprehensive body of data on the labor force, employment, unemployment, the unemployment rate, persons not in the labor force, hours of work, earnings, and other demographic and labor force characteristics. …
7. How will I complete the interview?
You will be interviewed at your home or over the telephone by a Census Bureau employee. The survey is not conducted by mail, e-mail, or online. …
10. I’m not available right now. Can someone else in my household respond instead?
Yes. Any household member 15 years of age or older can respond for the household. However, we would like to talk to someone who is knowledgeable about people in the household.
[600] “Basic CPS Items Booklet, Labor Force Items.” U.S. Census Bureau. Accessed December 1, 2017 at <www2.census.gov>
Pages 44–45 (of PDF):
Which category represents (your/name of reference person/the total combined income) (total combined income during the past 12 months?/ of all members of your FAMILY during the past 12 months?/ of all members of (name of reference person)’s FAMILY during the past 12 months?)
This includes money from jobs, net income from business, farm or rent, pensions, dividends, interest, social security payments and any other money income received (. / by members of (your/ name of reference person) FAMILY who are 15 years of age or older.)
[601] Report: “Income and Poverty in the United States: 2019.” By Jessica Semega and others. U.S. Census Bureau, September 2020. <www.census.gov>
Page 20: “The income and poverty estimates shown in this report are based solely on money income before taxes and do not include the value of noncash benefits such as those provided by the Supplemental Nutrition Assistance Program, Medicare, Medicaid, public housing, or employer-provided fringe benefits.”
Page 23:
Data on income collected in the ASEC [Current Population Survey Annual Social and Economic Supplements] by the U.S. Census Bureau cover money income received (exclusive of certain money receipts such as capital gains) before payments for personal income taxes, social security, union dues, Medicare deductions, etc. Therefore, money income does not reflect the fact that some families receive noncash benefits such as Supplemental Nutrition Assistance/food stamps, health benefits, and subsidized housing. In addition, money income does not reflect the fact that noncash benefits often take the form of the use of business transportation and facilities, full or partial payments by business for retirement programs, medical and educational expenses, etc. Data users should consider these elements when comparing income levels. Moreover, readers should be aware that for many different reasons there is a tendency in household surveys for respondents to underreport their income. Based on an analysis of independently derived income estimates, the Census Bureau determined that respondents report income earned from wages or salaries more accurately than other sources of income, and that the reported wage and salary income is nearly equal to independent estimates of aggregate income.
[602] Dataset: “2019 Average Earnings of People Aged 25 to 65 by Educational Attainment, Race, Marital Status, and Nativity.” U.S. Census Bureau, Current Population Survey Annual Social and Economic Supplement, March 2020. <data.census.gov>
NOTE: Like all Census Bureau measures of “money” income, this dataset doesn’t include noncash benefits like subsidized housing, food stamps, charitable services, and government or employer-provided health benefits. Also, the data is collected via government surveys, and low-income households substantially underreport their income on such surveys.
[603] Dataset: “2019 Average Earnings of People Aged 25 to 65 by Educational Attainment, Race, Hispanic Origin, and Nativity.” U.S. Census Bureau, Current Population Survey Annual Social and Economic Supplement, March 2020. <data.census.gov>
NOTE: Like all Census Bureau measures of “money” income, this dataset doesn’t include noncash benefits like subsidized housing, food stamps, charitable services, and government or employer-provided health benefits. Also, the data is collected via government surveys, and low-income households substantially underreport their income on such surveys.
[604] Webpage: “Current Population Survey (CPS) Respondents.” U.S. Census Bureau. Last updated September 23, 2011. <www.bls.gov>
General Questions
1. What is the Current Population Survey?
The Current Population Survey (CPS) is a monthly survey of households conducted by the Census Bureau for the Bureau of Labor Statistics. In addition to the national unemployment rate, it provides a comprehensive body of data on the labor force, employment, unemployment, the unemployment rate, persons not in the labor force, hours of work, earnings, and other demographic and labor force characteristics. …
7. How will I complete the interview?
You will be interviewed at your home or over the telephone by a Census Bureau employee. The survey is not conducted by mail, e-mail, or online. …
10. I’m not available right now. Can someone else in my household respond instead?
Yes. Any household member 15 years of age or older can respond for the household. However, we would like to talk to someone who is knowledgeable about people in the household.
[605] “Basic CPS Items Booklet, Labor Force Items.” U.S. Census Bureau. Accessed December 1, 2017 at <www2.census.gov>
Pages 44–45 (of PDF):
Which category represents (your/name of reference person/the total combined income) (total combined income during the past 12 months?/ of all members of your FAMILY during the past 12 months?/ of all members of (name of reference person)’s FAMILY during the past 12 months?)
This includes money from jobs, net income from business, farm or rent, pensions, dividends, interest, social security payments and any other money income received (. / by members of (your/ name of reference person) FAMILY who are 15 years of age or older.)
[606] Report: “Income and Poverty in the United States: 2019.” By Jessica Semega and others. U.S. Census Bureau, September 2020. <www.census.gov>
Page 20: “The income and poverty estimates shown in this report are based solely on money income before taxes and do not include the value of noncash benefits such as those provided by the Supplemental Nutrition Assistance Program, Medicare, Medicaid, public housing, or employer-provided fringe benefits.”
Page 23:
Data on income collected in the ASEC [Current Population Survey Annual Social and Economic Supplements] by the U.S. Census Bureau cover money income received (exclusive of certain money receipts such as capital gains) before payments for personal income taxes, social security, union dues, Medicare deductions, etc. Therefore, money income does not reflect the fact that some families receive noncash benefits such as Supplemental Nutrition Assistance/food stamps, health benefits, and subsidized housing. In addition, money income does not reflect the fact that noncash benefits often take the form of the use of business transportation and facilities, full or partial payments by business for retirement programs, medical and educational expenses, etc. Data users should consider these elements when comparing income levels. Moreover, readers should be aware that for many different reasons there is a tendency in household surveys for respondents to underreport their income. Based on an analysis of independently derived income estimates, the Census Bureau determined that respondents report income earned from wages or salaries more accurately than other sources of income, and that the reported wage and salary income is nearly equal to independent estimates of aggregate income.
[607] Report: “African Americans: College Majors and Earnings.” By Anthony P. Carnevale and others. Georgetown University, Center on Education and the Workforce, 2016. <cew.georgetown.edu>
Page 2:
Access to college for African Americans has increased, but African Americans are highly concentrated in lower-paying majors. The college major, which has critical economic consequences throughout life, reflects personal choices but also reflects the fact that African-American students are concentrated in open-access four-year institutions that limited choices of majors offered. African Americans represent 12 percent of the US population, but are underrepresented in the number of degree holders in college majors associated with the fastest-growing, highest-paying occupations—STEM [science, technology, engineering, and math], health, and business.
African Americans account for only 8 percent of general engineering majors, 7 percent of mathematics majors, and only 5 percent of computer engineering majors.1 They are similarly under-represented in business: only 7 percent of finance and marketing majors are African-American. In health majors, they account for 10 percent but are clustered in the lowest-earning detailed major: 21 percent are in health and medical administrative services, compared to only 6 percent in the higher-earning detailed major of pharmacy, pharmaceutical sciences, and administration. African Americans are also highly represented in majors associated with serving the community, which tend to be low-earning—human services and community organization (20%) and social work (19%). …
Earnings vary greatly among various college majors. African Americans who earned a Bachelor’s degree in a STEM-related major, such as architecture or engineering, can earn as much as 50 percent more than African Americans who earned a Bachelor’s degree in art or psychology and social work (Figure 1).
[608] Report: “The Literacy of America’s College Students.” By Justin D. Baer, Andrea L. Cook, and Stéphane Baldi. American Institutes for Research, January 2006. <www.air.org>
Page 4:
The NSACS [National Survey of America’s College Students], sponsored by The Pew Charitable Trusts, collected data from a sample of 1,827 graduating students at 80 randomly selected 2-year and 4-year colleges and universities (68 public and 12 private) from across the United States. The NSACS specifically targeted college and university students nearing the end of their degree program, thus providing a broader and more comprehensive picture of students’ fundamental literacy abilities than ever before.
The NSACS used the same assessment instrument as the 2003 National Assessment of Adult Literacy (NAAL), a nationally representative survey of the English-language literacy abilities of U.S. adults 16 and older residing in households or prisons. The NAAL was developed and administered by the U.S. Department of Education’s National Center for Education Statistics (NCES). Literacy levels were categorized as Below Basic, Basic, Intermediate, or Proficient on the basis of the abilities of participants.
Because literacy is not a single skill used in the same manner for all types of printed and written information, the NSACS measured literacy along three dimensions: prose literacy, document literacy, and quantitative literacy. These three literacy domains were designed to capture an ordered set of information-processing skills and strategies that adults use to accomplish a wide range of literacy tasks and make it possible to profile the various types and levels of literacy among different subgroups in society.
[609] Report: “The Literacy of America’s College Students.” By Justin D. Baer, Andrea L. Cook, and Stéphane Baldi. American Institutes for Research, January 2006. <www.air.org>
Page 4: “Prose Literacy: The knowledge and skills needed to perform prose tasks, that is, to search, comprehend, and use information from continuous texts. Prose examples include editorials, news stories, brochures, and instructional materials.”
Page 21: “Table 2.2. Percentage of U.S. adults in college and the nation in each prose literacy level, by selected characteristics”
[610] Report: “The Literacy of America’s College Students.” By Justin D. Baer, Andrea L. Cook, and Stéphane Baldi. American Institutes for Research, January 2006. <www.air.org>
Page 4: “Document Literacy: The knowledge and skills needed to perform document tasks, that is, to search, comprehend, and use information from noncontinuous texts in various formats. Document examples include job applications, payroll forms, transportation schedules, maps, tables, and drug or food labels.”
Page 22: “Table 2.3. Percentage of U.S. adults in college and the nation in each document literacy level, by selected characteristics”
[611] Report: “The Literacy of America’s College Students.” By Justin D. Baer, Andrea L. Cook, and Stéphane Baldi. American Institutes for Research, January 2006. <www.air.org>
Page 4: “Quantitative Literacy: The knowledge and skills required to perform quantitative literacy tasks, that is, to identify and perform computations, either alone or sequentially, using numbers embedded in printed materials. Quantitative examples include balancing a checkbook, figuring out a tip, completing an order form, or determining the amount of interest on a loan from an advertisement.”
Page 23: “Table 2.4. Percentage of U.S. adults in college and the nation in each quantitative literacy level, by selected characteristics”
[612] Paper: “A Systemic Analysis of Affirmative Action in American Law Schools.” By Richard H. Sander. Stanford Law Review, November 2004. Pages 367–483. <www.brown.edu>
Page 369:
The vast majority of states have fairly uniform educational requirements for lawyers, and the vast majority of law schools are licensed by the same national organizations. Nearly all aspirants to law school go through a similar application process and take a uniform exam, the Law School Admission Test (LSAT). First-year law students across the country follow similar curricula and are graded predominantly on a curve. Nearly all graduates of law school who want to practice law must take bar exams to begin their professional careers. These uniformities make comparisons within the legal education system much easier.
Page 420: “Bar exams are taken by a broad cross-section of law graduates of many different schools, which greatly reduces the restriction-of-range and biased-selection problems.”
Page 478: “Blacks earn 6% to 9% more early in their careers than do whites seeking similar jobs with similar credentials, presumably because many employers (including government employers) pursue moderate racial preferences in hiring.”
[613] Commentary: “What Racial Injustice Looks Like in America’s Economy.” By Jared Bernstein. Washington Post, July 11, 2016. <www.washingtonpost.com>
Jared Bernstein, a former chief economist to Vice President Biden, is a senior fellow at the Center on Budget and Policy Priorities and author of the new book The Reconnection Agenda: Reuniting Growth and Prosperity. …
Another option, one I pursue below, is to briefly document some of the systemic racial injustice embedded in the economy. It would be ridiculously reductionist to argue that these data are the same problem that we’ve seen highlighted so vividly in recent years. But these persistent, unequal trends are very much in the mix and, at a time when we need to think deeply about institutional prejudices in all corners of society, they are worth a look.
– Black unemployment; white unemployment: For as far back as we have the data, the black unemployment rate has been twice that of the white rate (see first figure). Moreover, as the second figure shows, you can’t dismiss that fact by citing lower levels of education among blacks. Not only does the 2-to-1 ratio roughly hold for each education level, the education explanation for racial differences in unemployment rates ignores the reality of racial educational barriers erected by systemic racism. Also, note that the black/white unemployment ratio is biased down by the disproportionate imprisonment of blacks, as the prison population is left out of the numbers.
[614] Article: “Racial Differences in Unemployment in the United States, 1890–1990.” By Richard K. Vedder and Lowell Gallaway. The Journal of Economic History, September 1992. Pages 696–702. <www.jstor.org>
Pages 696–697:
Although the ratio of nonwhite to white unemployment rates in the United States has approximated two to one for most of the postwar era, such large racial differences did not exist 60 to 100 years ago. In the era from 1890 to 1930, the nonwhite unemployment rate seemed not to be materially different than the white rate. …
According to the census data, the 1890 unemployment rate for nonwhites was 15.8 percent, only 0.8 percentage points above the reported rate for whites; the nonwhite rate for 1900, 28.8 percent, exceeded the white rate of 21.2 percent by over seven points.3 The racial differences are small by historical standards and exaggerated. Even the 1900 difference is dramatically lower than that reported in any year since the CPS [Current Population Survey] race-specific data became available. Moreover, if converted to stock estimates the differences would be smaller, because nonwhite workers had a materially smaller average duration of unemployment than did whites in both 1890 and 1900.
Pages 698–699:
This comprehensive evidence on individual unemployment experiences in 1890, 1900, and 1930 leads us to believe that racial differences in unemployment rates were virtually nonexistent. The mean rate of unemployment at the three dates differed by only 0.08 percentage points between whites and nonwhites. The similarities between the rates were more striking than their differences.
The era of discernable race differentials in unemployment thus must have begun after 1930, and it was not entirely obvious until more than a decade later…. Although CPS was begun in 1940, race-specific data were not available until 1948, so for 1940 we must rely again on the census.9 Data for later years are the standard Bureau of Labor Statistics estimates. The combined series reveals clearly that the race differentials widened over time in both an absolute and relative sense, particularly from 1930 to 1950.
[615] “Commencement Address at Howard University: ‘To Fulfill These Rights.’ ” By President Lyndon B. Johnson, June 4, 1965. <teachingamericanhistory.org>
“Thirty-five years ago the rate of unemployment for Negroes and whites was about the same. Tonight the Negro rate is twice as high.”
[616] Commencement Address at Howard University: ‘To Fulfill These Rights.’ ” By President Lyndon B. Johnson, June 4, 1965. <teachingamericanhistory.org>
“In 1948 the 8 percent unemployment rate for Negro teenage boys was actually less than that of whites. By last year that rate had grown to 23 percent, as against 13 percent for whites unemployed.”
[617] “Speech Before the NAACP [National Association for the Advancement of Colored People] Detroit Metro Chapter.” By Al Gore, April 25, 1999. <votesmart.org>
“At a time when African-Americans earn just 62 cents on each dollar that white Americans earn, don’t you think it’s time for an equal day’s pay for an equal day’s work?”
[618] Calculated with data from the report: “Money Income in the United States, 1998.” U.S. Census Bureau, September 1999. <www.census.gov>
Page vii: “The official income estimates in this report are based solely on money income before taxes and do not include the value of noncash benefits, such as food stamps, medicare, medicaid, public or subsidized housing, and employment-based fringe benefits.”
Page vi: “Table A. Comparison of Summary Measures of Income by Selected Characteristics: 1989, 1997, and 1998 … Households … Median income … White [=] $40,912 … Black [=] $25,351”
CALCULATION: $25,351 / $40,912 = 62%
[619] Calculated with data from:
a) Dataset: “Median Usual Weekly Earnings (Second Quartile), Employed Full Time, Wage and Salary Workers, White.” U.S. Bureau of Labor Statistics, September 1, 2016. <data.bls.gov>
“1998 [=] $545”
b) Dataset: “Median Usual Weekly Earnings (Second Quartile), Employed Full Time, Wage and Salary Workers, Black or African.” U.S. Bureau of Labor Statistics, September 1, 2016. <data.bls.gov>
“1998 [=] $426”
CALCULATION: $426 / $545 = 81%
[620] Dataset: “Table 104.10. Rates of High School Completion and Bachelor’s Degree Attainment Among Persons Age 25 and Over, by Race/Ethnicity and Sex: Selected Years, 1910 Through 2015.” U.S. Department Of Education, National Center for Education Statistics, November 2015. <nces.ed.gov>
|
High School Completion or Higher |
|
|
Race/Ethnicity |
Rate |
|
White |
87.1% |
|
Black |
76.4% |
|
Hispanic |
55.5% |
[621] Report: “Highlights of Women’s Earnings in 1998.” U.S. Bureau of Labor Statistics, April 1999. <www.bls.gov>
Page 3:
Table 1. Median usual weekly earnings of full-time wage and salary workers by selected characteristics, 1998 annual averages
|
Educational Attainment |
Median Weekly Earnings |
|
Total, 25 years and over |
$572 |
|
Less than a high school diploma |
$337 |
|
High school graduates, no college |
$479 |
|
Some college or associate degree |
$558 |
|
College graduates, total |
$821 |
CALCULATION: ($572 – $337) / $572 = 41%
[622] Dataset: “Table 104.10. Rates of High School Completion and Bachelor’s Degree Attainment Among Persons Age 25 and Over, by Race/Ethnicity and Sex: Selected Years, 1910 Through 2015.” U.S. Department Of Education, National Center for Education Statistics, November 2015. <nces.ed.gov>
|
Bachelor’s or Higher Degree |
|
|
Race/Ethnicity |
Rate |
|
White |
26.6% |
|
Black |
14.8% |
|
Hispanic |
11.0% |
[623] Report: “Highlights of Women’s Earnings in 1998.” U.S. Bureau of Labor Statistics, April 1999. <www.bls.gov>
Page 3:
Table 1. Median usual weekly earnings of full-time wage and salary workers by selected characteristics, 1998 annual averages
|
Educational Attainment |
Median Weekly Earnings |
|
Total, 25 years and over |
$572 |
|
Less than a high school diploma |
$337 |
|
High school graduates, no college |
$479 |
|
Some college or associate degree |
$558 |
|
College graduates, total |
$821 |
CALCULATION: ($821 – $572) / $821 = 30%
[624] Webpage: “Equal Opportunity and Women—Fact Sheet.” Leadership Conference, Americans for a Fair Chance, January 1, 2004. <archives.civilrights.org>
Although progress has been made over the last 30 years, ensuring equal opportunity for women remains an elusive goal. Continued use of equal opportunity is necessary to help break down barriers to opportunity and ensure that all Americans have a fair chance to demonstrate their talents and abilities. Consider the following facts:
Pay Inequity
• Women earn approximately 77 cents for every dollar men earn. Minority women fare significantly worse—black women earn 66 cents, while Hispanic women earn 56 cents for every dollar men earn. (“Highlights of Women’s Earnings in 1999,” Bureau of Labor Statistics, U.S. Department of Labor, May 2000)
• In 2001, the median annual earnings of white males with a four-year college degree was $55,307, while white women with the same educational attainment earned $40,192. Black women and Hispanic women with the same education credentials suffered from an even larger gap. Black women with equal college credentials earned $36,253, while Hispanic women with equal college credentials earned only $34,060. Also, on average, a woman with a master’s degree makes $4,765 less than a man with a college degree. (“The Wage Gap by Education,” National Committee on Pay Equity: 2001”)
[625] Press release: “New Public Awareness Campaign Launched to Promote Affirmative Action.” Leadership Conference, June 18, 2003. <civilrights.org>
Americans for a Fair Chance is a project of the Leadership Conference on Civil Rights Education Fund, in partnership with the Lawyers’ Committee for Civil Rights Under Law, Mexican American Legal Defense and Educational Fund, NAACP [National Association for the Advancement of Colored People] Legal Defense Fund, Inc., National Asian Pacific American Legal Consortium, National Women’s Law Center, and the National Partnership for Women and Families, created to educate the public and the media on the ways that affirmative action benefits the nation. Founded in 1969 as the education and research arm of the civil rights coalition, the Leadership Conference on Civil Rights Education Fund, <www.civilrights.org, promotes an understanding of the need for national policies that support civil rights and social and economic justice, and encourages an appreciation of the nation’s diversity.>
[626] Webpage: “About Us.” Leadership Conference. Accessed December 1, 2017 at <civilrights.org>
The Leadership Conference on Civil and Human Rights is a coalition charged by its diverse membership of more than 200 national organizations to promote and protect the civil and human rights of all persons in the United States. Through advocacy and outreach to targeted constituencies, The Leadership Conference works toward the goal of a more open and just society—an America as good as its ideals.
The Leadership Conference is a 501(c)(4) organization that engages in legislative advocacy. It was founded in 1950 and has coordinated national lobbying efforts on behalf of every major civil rights law since 1957.
The Leadership Conference Education Fund builds public will for federal policies that promote and protect the civil and human rights of all persons in the United States. The Education Fund’s campaigns empower and mobilize advocates around the country to push for progressive change in the United States.
The Education Fund is a 501(c)(3) organization and contributions are tax-deductible. It was founded in 1969 as the education and research arm of The Leadership Conference.
[627] Webpage: “Coalition Members of The Leadership Conference on Civil and Human Rights.” Leadership Conference. Accessed December 1, 2017 at <civilrights.org>
“… American Civil Liberties Union (ACLU) … NAACP [National Association for the Advancement of Colored People] Legal Defense and Educational Fund, Inc. … UnidosUS (formerly National Council of La Raza)”
[628] Report: “African Americans College Majors and Earnings.” By Anthony P. Carnevale and others. Georgetown University, Center on Education and the Workforce, 2016. <cew.georgetown.edu>
Page 2:
Access to college for African Americans has increased, but African Americans are highly concentrated in lower-paying majors. The college major, which has critical economic consequences throughout life, reflects personal choices but also reflects the fact that African-American students are concentrated in open-access four-year institutions that limited choices of majors offered. African Americans represent 12 percent of the US population, but are underrepresented in the number of degree holders in college majors associated with the fastest-growing, highest-paying occupations—a STEM [science, technology, engineering, and math], health, and business.
African Americans account for only 8 percent of general engineering majors, 7 percent of mathematics majors, and only 5 percent of computer engineering majors.1 They are similarly under-represented in business: only 7 percent of finance and marketing majors are African-American. In health majors, they account for 10 percent but are clustered in the lowest-earning detailed major: 21 percent are in health and medical administrative services, compared to only 6 percent in the higher-earning detailed major of pharmacy, pharmaceutical sciences, and administration. African Americans are also highly represented in majors associated with serving the community, which tend to be low-earning—human services and community organization (20%) and social work (19%). …
Earnings vary greatly among various college majors. African Americans who earned a Bachelor’s degree in a STEM-related major, such as architecture or engineering, can earn as much as 50 percent more than African Americans who earned a Bachelor’s degree in art or psychology and social work (Figure 1).
[629] Report: “The Literacy of America’s College Students.” By Justin D. Baer, Andrea L. Cook, and Stéphane Baldi. American Institutes for Research, January 2006. <www.air.org>
Page 4:
The NSACS [National Survey of America’s College Students], sponsored by The Pew Charitable Trusts, collected data from a sample of 1,827 graduating students at 80 randomly selected 2-year and 4-year colleges and universities (68 public and 12 private) from across the United States. The NSACS specifically targeted college and university students nearing the end of their degree program, thus providing a broader and more comprehensive picture of students’ fundamental literacy abilities than ever before.
The NSACS used the same assessment instrument as the 2003 National Assessment of Adult Literacy (NAAL), a nationally representative survey of the English-language literacy abilities of U.S. adults 16 and older residing in households or prisons. The NAAL was developed and administered by the U.S. Department of Education’s National Center for Education Statistics (NCES). Literacy levels were categorized as Below Basic, Basic, Intermediate, or Proficient on the basis of the abilities of participants.
Because literacy is not a single skill used in the same manner for all types of printed and written information, the NSACS measured literacy along three dimensions: prose literacy, document literacy, and quantitative literacy. These three literacy domains were designed to capture an ordered set of information-processing skills and strategies that adults use to accomplish a wide range of literacy tasks and make it possible to profile the various types and levels of literacy among different subgroups in society.
[630] Report: “The Literacy of America’s College Students.” By Justin D. Baer, Andrea L. Cook, and Stéphane Baldi. American Institutes for Research, January 2006. <www.air.org>
Page 4: “Prose Literacy: The knowledge and skills needed to perform prose tasks, that is, to search, comprehend, and use information from continuous texts. Prose examples include editorials, news stories, brochures, and instructional materials.”
Page 21: “Table 2.2. Percentage of U.S. adults in college and the nation in each prose literacy level, by selected characteristics”
[631] Report: “The Literacy of America’s College Students.” By Justin D. Baer, Andrea L. Cook, and Stéphane Baldi. American Institutes for Research, January 2006. <www.air.org>
Page 4: “Document Literacy: The knowledge and skills needed to perform document tasks, that is, to search, comprehend, and use information from noncontinuous texts in various formats. Document examples include job applications, payroll forms, transportation schedules, maps, tables, and drug or food labels.”
Page 22: “Table 2.3. Percentage of U.S. adults in college and the nation in each document literacy level, by selected characteristics”
[632] Report: “The Literacy of America’s College Students.” By Justin D. Baer, Andrea L. Cook, and Stéphane Baldi. American Institutes for Research, January 2006. <www.air.org>
Page 4: “Quantitative Literacy: The knowledge and skills required to perform quantitative literacy tasks, that is, to identify and perform computations, either alone or sequentially, using numbers embedded in printed materials. Quantitative examples include balancing a checkbook, figuring out a tip, completing an order form, or determining the amount of interest on a loan from an advertisement.”
Page 23: “Table 2.4. Percentage of U.S. adults in college and the nation in each quantitative literacy level, by selected characteristics”
[633] Report: “2019 Crime in the United States.” Federal Bureau of Investigation, Criminal Justice Information Services, September 2020. <ucr.fbi.gov>
Topic: “Murder.” <ucr.fbi.gov>
The FBI’s Uniform Crime Reporting (UCR) Program defines murder and nonnegligent manslaughter as the willful (nonnegligent) killing of one human being by another.
The classification of this offense is based solely on police investigation as opposed to the determination of a court, medical examiner, coroner, jury, or other judicial body. The UCR Program does not include the following situations in this offense classification: deaths caused by negligence, suicide, or accident; justifiable homicides; and attempts to murder or assaults to murder, which are classified as aggravated assaults. …
In 2019, the estimated number of murders in the nation was 16,425. This was a 0.3 percent increase from the 2018 estimate, a 3.4 percent increase from the 2015 figure, and an 11.6 percent increase from the number in 2010.
[634] Report: “2019 Crime in the United States.” Federal Bureau of Investigation, Criminal Justice Information Services, September 2020. <ucr.fbi.gov>
Topic: “Murder.” <ucr.fbi.gov>
“In 2019, the estimated number of murders in the nation was 16,425. This was a 0.3 percent increase from the 2018 estimate, a 3.4 percent increase from the 2015 figure, and an 11.6 percent increase from the number in 2010.”
[635] Dataset: “Intentional Homicides (Per 100,000 People).” World Bank, June 30, 2021. Accessed July 14, 2021 at <data.worldbank.org>
“The intentional killing of a human being by another is the ultimate crime. Its indisputable physical consequences manifested in the form of a dead body also make it the most categorical and calculable.”
[636] Calculated with data from: “Annual Estimates of the Resident Population by Sex, Race, and Hispanic Origin for the United States: April 1, 2010 to July 1, July 1, 2019.” U.S. Census Bureau, June 2020. <www2.census.gov>
NOTE: An Excel file containing the data and calculations is available upon request.
[637] Calculated with data from:
a) Report: “Crime in the United States 2019.” Federal Bureau of Investigation, Fall 2020. <ucr.fbi.gov>
“Expanded Homicide Data Table 1: Murder Victims by Race, Ethnicity, and Sex, 2019.” <ucr.fbi.gov>
b) Report: “2019 Crime in the United States.” Federal Bureau of Investigation, Criminal Justice Information Services, September 2020. <ucr.fbi.gov>
Topic: “Murder.” <ucr.fbi.gov>
“In 2019, the estimated number of murders in the nation was 16,425.
NOTES:
[638] Calculated with data from:
a) Report: “Crime in the United States 2019.” Federal Bureau of Investigation, Fall 2020. <ucr.fbi.gov>
“Expanded Homicide Data Table 2: Murder Offenders by Age, Sex, Race, and Ethnicity, 2019.” <ucr.fbi.gov>
b) Report: “2019 Crime in the United States.” Federal Bureau of Investigation, Criminal Justice Information Services, September 2020. <ucr.fbi.gov>
Topic: “Murder.” <ucr.fbi.gov>
“In 2019, the estimated number of murders in the nation was 16,425.
NOTES:
[639] Calculated with data from:
a) Report: “Crime in the United States 2019.” Federal Bureau of Investigation, Fall 2020. <ucr.fbi.gov>
“Expanded Homicide Data Table 1: Murder Victims by Race, Ethnicity, and Sex, 2019.” <ucr.fbi.gov>
b) Report: “Crime in the United States 2019.” Federal Bureau of Investigation, Fall 2020. <ucr.fbi.gov>
“Expanded Homicide Data Table 2: Murder Offenders by Age, Sex, Race, and Ethnicity, 2019.” <ucr.fbi.gov>
c) Report: “2019 Crime in the United States.” Federal Bureau of Investigation, Criminal Justice Information Services, September 2020. <ucr.fbi.gov>
Topic: “Murder.” <ucr.fbi.gov>
“In 2019, the estimated number of murders in the nation was 16,425.
d) “Annual Estimates of the Resident Population by Sex, Race, and Hispanic Origin for the United States: April 1, 2010 to July 1, July 1, 2019.” U.S. Census Bureau, June 2020. <www2.census.gov>
NOTES:
[640] Dataset: “Intentional Homicides (Per 100,000 People).” World Bank, June 30, 2021. Accessed July 14, 2021 at <data.worldbank.org>
“The intentional killing of a human being by another is the ultimate crime. Its indisputable physical consequences manifested in the form of a dead body also make it the most categorical and calculable.”
[641] Calculated with data from:
a) Dataset: “Resident Population Estimates of the United States by Sex, Race, and Hispanic Origin: April 1, 1990 to July 1, 1999, with Short-Term Projection to November 1, 2000.” U.S. Census Bureau, January 2, 2001. <www2.census.gov>
b) “Annual Estimates of the Resident Population by Sex, Race, and Hispanic Origin for the United States: April 1, 2010 to July 1, 2019.” U.S. Census Bureau, June 2020. <www.census.gov>
c) Report: “Crime in the United States.” Federal Bureau of Investigation.
1995, 1996: Page 16: “Table 2.6: Age, Sex, and Race of Murder Offenders.”
1997: Page 18: “Table 2.6: Age, Sex, and Race of Murder Offenders.”
1998: Page 16: “Table 2.6: Murder Offenders by Age, Sex, and Race, 1998.”
1999: “Table 2.6: Offenders by Age, Sex, and Race, 1999.”
2000: Page 17: “Table 2.6: Murder Offenders by Age, Sex, and Race, 2000.”
2001, 2002: “Table 2.6: Murder Offenders by Age, Sex, and Race.”
2003, 2004: “Table 2.5: Murder Offenders by Age, Sex, and Race.”
2005, 2006, 2007, 2008, 2009, 2010, 2011, 2012: “Expanded Homicide Data Table 3: Murder Offenders by Age, Sex, and Race.”
2013, 2014, 2015: “Expanded Homicide Data Table 3: Murder Offenders by Age, Sex, Race, and Ethnicity.”
2016: “Expanded Homicide Data Table 2: Murder Offenders by Age, Sex, Race, and Ethnicity, 2016.”
2017, 2018, 2019: “Expanded Homicide Data Table 3: Murder Offenders by Age, Sex, Race, and Ethnicity.”
d) Report: “Capital Punishment, 2019 – Selected Findings.” By Tracy L. Snell. U.S. Department of Justice, Bureau of Justice Statistics, June 2021. <bjs.ojp.gov>
Page 20: “Table 13. Number of Prisoners Executed, by Race or Ethnicity, 1977–2019.”
Page 26: “Appendix Table 5. Number of Prisoners Under Sentence of Death, By Race, 1968–2019.”
NOTE: An Excel file containing the data and calculations is available upon request.
[642] Dataset: “Intentional Homicides (Per 100,000 People).” World Bank, June 30, 2021. Accessed July 14, 2021 at <data.worldbank.org>
“The intentional killing of a human being by another is the ultimate crime. Its indisputable physical consequences manifested in the form of a dead body also make it the most categorical and calculable.”
[643] Calculated with data from the webpage: “Clearance Rates: Uniform Crime Report for Homicides: 1965–2019.” Murder Accountability Project. Accessed July 15, 2021 at <www.murderdata.org>
“Clearance Rates … Uniform Crime Report for Homicides: 1965–2019 … Homicides [=] 947,521 … Clearances [=] 626,427”
CALCULATION: 947,521 Homicides – 626,427 Clearances = 321,094 Unsolved Murders
[644] “Uniform Crime Report, Crime in the United States, 2019: Offenses Cleared.” Federal Bureau of Investigation, Fall 2020. <ucr.fbi.gov>
Pages 1–3:
In the FBI’s Uniform Crime Reporting (UCR) Program, law enforcement agencies can clear, or “close,” offenses in one of two ways: by arrest or by exceptional means. Although an agency may administratively close a case, that does not necessarily mean that the agency can clear the offense for UCR purposes. To clear an offense within the UCR Program’s guidelines, the reporting agency must adhere to certain criteria, which are outlined in the following text. (Note: The UCR Program does not distinguish between offenses cleared by arrest and those cleared by exceptional means in collecting or publishing data via the traditional Summary Reporting System.)
Cleared by Arrest
In the UCR Program, a law enforcement agency reports that an offense is cleared by arrest, or solved for crime reporting purposes, when three specific conditions have been met. The three conditions are that at least one person has been:
• Arrested.
• Charged with the commission of the offense.
• Turned over to the court for prosecution (whether following arrest, court summons, or police notice).
In its clearance calculations, the UCR Program counts the number of offenses that are cleared, not the number of persons arrested. The arrest of one person may clear several crimes, and the arrest of many persons may clear only one offense. In addition, some clearances that an agency records in a particular calendar year, such as 2019, may pertain to offenses that occurred in previous years.
Cleared by Exceptional Means
In certain situations, elements beyond law enforcement’s control prevent the agency from arresting and formally charging the offender. When this occurs, the agency can clear the offense exceptionally. Law enforcement agencies must meet the following four conditions in order to clear an offense by exceptional means. The agency must have:
• Identified the offender.
• Gathered enough evidence to support an arrest, make a charge, and turn over the offender to the court for prosecution.
• Identified the offender’s exact location so that the suspect could be taken into custody immediately.
• Encountered a circumstance outside the control of law enforcement that prohibits the agency from arresting, charging, and prosecuting the offender.
Examples of exceptional clearances include, but are not limited to, the death of the offender (e.g., suicide or justifiably killed by police or citizen); the victim’s refusal to cooperate with the prosecution after the offender has been identified; or the denial of extradition because the offender committed a crime in another jurisdiction and is being prosecuted for that offense. In the UCR Program, the recovery of property alone does not clear an offense.
[645] Calculated with data from:
a) Report: “Homicide Trends in the United States, 1980–2008.” By Alexia Cooper and Erica L. Smith. U.S. Department of Justice, Bureau of Justice Statistics, November 2011. <www.bjs.gov>
Page 13: “Figure 19. Homicides, by race of offender and victim, 1980–2008.”
Pages 34–35:
While many agencies report supplemental data on homicides, much of the data concerning offenders may not be reported because no suspects were identified or the agency chose not to report the information. The most significant problem in using SHR [FBI’s Supplemental Homicide Report] data to analyze offender characteristics is the sizable and growing number of homicides in the data file for which no offender information is reported. Ignoring these homicides with no offender information would understate calculated rates of offending by particular subgroups of the population, distort trends over time among these same subgroups, and bias observed patterns of offending to the extent that the rate of missing offender data is associated with offender characteristics.
To adjust for homicides with no offender information, a method for offender imputation was devised that uses available information about murder victims for which corresponding offender information was provided as well as those with missing offender information. Through this imputation algorithm, the demographic characteristics of unidentified offenders were inferred on the basis of similar homicide cases—similar in terms of the victim’s demographic profile, circumstances of the homicide such as felony or argument, location of the homicide (region and urban), gun involvement, and year of the offense—for which offender data were provided. In other words, unknown offender profiles were estimated based on the offender profiles in offender-known cases, matched on victim age, sex, and race; circumstances of the homicide; location of the homicide; gun involvement; and year. †
b) Report: “Crime in the United States.” Federal Bureau of Investigation.
2005–2007: Expanded Homicide Data Table 5: “Race and Sex of Victim by Race and Sex of Offender [Single victim/single offender].”
2008–2014: Expanded Homicide Data Table 6: “Murder: Race, Ethnicity, and Sex of Victim by Race, Ethnicity, and Sex of Offender [Single victim/single offender].”
2008, 2009, 2010, 2011, 2012, 2013, 2014, 2015
2016: Expanded Homicide Data Table 3: “Murder: Race, Ethnicity, and Sex of Victim by Race, Ethnicity, and Sex of Offender [Single victim/single offender].” 2016
2017–2019: Expanded Homicide Data Table 6: “Murder: Race, Sex, and Ethnicity of Victim by Race, Sex, and Ethnicity of Offender [Single victim/single offender].” 2017, 2018, 2019
NOTES:
[646] Dataset: “Intentional Homicides (Per 100,000 People).” World Bank, June 30, 2021. Accessed July 14, 2021 at <data.worldbank.org>
“The intentional killing of a human being by another is the ultimate crime. Its indisputable physical consequences manifested in the form of a dead body also make it the most categorical and calculable.”
[647] Article: “Victim’s Sex, Race Affect Homicide Clearance Rates.” By Thomas Hargrove (University of Maryland criminologist). Scripps Howard News Service, 2010.
The deliberate killings of men, members of racial and ethnic minorities and young adults are much less likely to be solved than other kinds of homicides, according to a Scripps Howard News Service analysis of detailed FBI computer files of more than half a million homicides committed from 1980 to 2008. …
The killer is identified by police about 67 percent of the time when the victim is black or Hispanic, and only 64 percent for black victims between 20 and 24 years old. But when the victim is a non-Hispanic white person of any age, a suspect is identified 78 percent of the time.
[648] “Uniform Crime Report, Crime in the United States, 2019: Offenses Cleared.” Federal Bureau of Investigation, Fall 2020. <ucr.fbi.gov>
Pages 1–3:
In the FBI’s Uniform Crime Reporting (UCR) Program, law enforcement agencies can clear, or “close,” offenses in one of two ways: by arrest or by exceptional means. Although an agency may administratively close a case, that does not necessarily mean that the agency can clear the offense for UCR purposes. To clear an offense within the UCR Program’s guidelines, the reporting agency must adhere to certain criteria, which are outlined in the following text. (Note: The UCR Program does not distinguish between offenses cleared by arrest and those cleared by exceptional means in collecting or publishing data via the traditional Summary Reporting System.)
Cleared by Arrest
In the UCR Program, a law enforcement agency reports that an offense is cleared by arrest, or solved for crime reporting purposes, when three specific conditions have been met. The three conditions are that at least one person has been:
• Arrested.
• Charged with the commission of the offense.
• Turned over to the court for prosecution (whether following arrest, court summons, or police notice).
In its clearance calculations, the UCR Program counts the number of offenses that are cleared, not the number of persons arrested. The arrest of one person may clear several crimes, and the arrest of many persons may clear only one offense. In addition, some clearances that an agency records in a particular calendar year, such as 2019, may pertain to offenses that occurred in previous years.
Cleared by Exceptional Means
In certain situations, elements beyond law enforcement’s control prevent the agency from arresting and formally charging the offender. When this occurs, the agency can clear the offense exceptionally. Law enforcement agencies must meet the following four conditions in order to clear an offense by exceptional means. The agency must have:
• Identified the offender.
• Gathered enough evidence to support an arrest, make a charge, and turn over the offender to the court for prosecution.
• Identified the offender’s exact location so that the suspect could be taken into custody immediately.
• Encountered a circumstance outside the control of law enforcement that prohibits the agency from arresting, charging, and prosecuting the offender.
Examples of exceptional clearances include, but are not limited to, the death of the offender (e.g., suicide or justifiably killed by police or citizen); the victim’s refusal to cooperate with the prosecution after the offender has been identified; or the denial of extradition because the offender committed a crime in another jurisdiction and is being prosecuted for that offense. In the UCR Program, the recovery of property alone does not clear an offense.
[649] Report: “Analysis of Variables Affecting the Clearance of Homicides: A Multistate Study.” By Charles Wellford and James Cronin. Justice Research and Statistics Association, October 1999. <jrsa.org>
Page 2:
The arrest of a suspect is one of the most important events in the criminal justice system, for without an arrest, none of the accepted forms of punishment can be applied. According to deterrence theory (Beccaria, 1764/1963) a punishment must be applied with certainty, severity, and celerity to prevent an offender from committing future offenses (specific deterrence), as well as to prevent others who witness the results of the punishment from engaging in criminal behavior (general deterrence). Although traditionally most of the emphasis has been placed on severity, criminologists have long considered certainty and celerity to be the more important aspects of deterrence (Beccaria, 1764/1963). Therefore, a decrease in clearance rates (low certainty) signals an inability of the criminal justice system to achieve one of its primary goals—the reduction of future crime, both specific and general. Similarly, incapacitation, rehabilitation, retribution, or any other aim of punishment cannot be achieved without an arrest. Clearance rates can also affect citizens’ perception and fear of crime, in addition to reflecting the criminal justice system’s ability to impose punishments on offenders.
[650] Article: “Deadliest Year in Baltimore History Ends With 344 Homicides.” By Kevin Rector. Baltimore Sun, January 1, 2016. <www.baltimoresun.com>
State’s Attorney Marilyn J. Mosby called Baltimore the “home of witness intimidation,” suggesting residents were too scared to assist police in tackling crime. Police have identified hundreds of shooting suspects but say they have struggled to pin charges on most without community tips.
Data show that the rate at which police cleared—or closed—homicide cases plummeted this year to about 30 percent, leaving killers on the street and further diminishing the public’s confidence in law enforcement.
[651] Article: “Victim’s Sex, Race Affect Homicide Clearance Rates.” By Thomas Hargrove (University of Maryland criminologist). Scripps Howard News Service, 2010.
But these trends are also related to the reasons for killing. Homicides involving drugs and gangs are much less likely to be solved than almost any other kind of killing. Most homicide victims like their assailants—were young, racial- or ethnic-minority males.
“The stranger-on-stranger murders, the ones that seem to be motiveless, are much more difficult to solve,” said Bill Hagmaier, a former FBI homicide supervisor who heads the International Homicide Investigators Association. “The higher risk of the victim, the more difficult the case is to solve. Gang members, prostitutes, runaways, these are people who put themselves in harm’s way. They also put themselves in an environment where there is less of a chance that there will be cooperating witnesses.” …
Only about two-thirds of all robbery-based homicides are solved. About 63 percent of killings committed during an illegal drug transaction are solved, as are only 57 percent of killings over gang-related disputes.
[652] Paper: “Predictors of Homicide Clearance by Arrest: An Event History Analysis of NIBRS Incidents.” By Aki Roberts. Criminology & Penology, May 2007. Pages 82–93. <hsx.sagepub.com>
Abstract:
One perspective on homicide clearance by arrest argues that clearance is influenced by police discretion based on victim characteristics. Another suggests that immediate situational characteristics, related to physical evidence and information, are more important in clearing homicides. Using event history analysis, this study examined the effects of victim and situational characteristics on homicide clearance for 1,579 murder incidents from the 2002 National Incident-Based Reporting System (NIBRS). Unlike the logistic regression approach typically used in murder clearance research, event history analysis considers the length of time to clearance, increasing the accuracy of estimates. The current analysis found that incidents with female or younger victims were more likely to be cleared. Also, homicides with victims involved in drug- and gang-related activities were more likely to be cleared. However, the significant impact of victim characteristics disappeared after controlling for situational variables related to physical evidence, information, and witnesses. Situational characteristics such as under-the-influence offenders, non-stranger offenders, contact weapons, and concomitant serious offenses significantly increased the odds of homicide clearance.
[653] Report: “Analysis of Variables Affecting the Clearance of Homicides: A Multistate Study.” By Charles Wellford and James Cronin. Justice Research and Statistics Association, October 1999. <jrsa.org>
Page 63:
In considering the implications we think this research has for law enforcement, we would point especially to the following observations. It appears that what happens at the crime scene by the initially responding officer(s) is important. The speed with which homicide detectives, evidence technicians, and medical examiners are notified and the time it takes them to respond to the scene are associated with clearance. The activities of the first responding officers to secure the scene, to identify potential witnesses, to preserve evidence, to initiate, when appropriate, neighborhood surveys, and to participate in neighborhood surveys appears critical. We find that the assignment of 3 or 4 detectives is optimal for clearing a case, but that increasing that number is not efficient until one reaches very large numbers of detectives (i.e., 11 or more).
[654] See the sections of this research about murders and non-fatal crimes for facts about racial disparities in violent crimes.
[655] Article: “Deadliest Year in Baltimore History Ends With 344 Homicides.” By Kevin Rector. Baltimore Sun, January 1, 2016. <www.baltimoresun.com>
State’s Attorney Marilyn J. Mosby called Baltimore the “home of witness intimidation,” suggesting residents were too scared to assist police in tackling crime. Police have identified hundreds of shooting suspects but say they have struggled to pin charges on most without community tips.
Data show that the rate at which police cleared—or closed—homicide cases plummeted this year to about 30 percent, leaving killers on the street and further diminishing the public’s confidence in law enforcement.
[656] Paper: “An Exploratory Analysis of Factors Affecting Homicide Investigations: Examining the Dynamics of Murder Clearance Rates.” By Timothy G. Keel, John P. Jarvis, and Yvonne E. Muirhead. Criminology & Penology, February 2009. Pages 50–68. <hsx.sagepub.com>
Abstract:
This study seeks to examine the practices of law enforcement agencies in attempting to solve cases of homicide. Five key dimensions, as determined from the extant literature, are examined using data from a recent law enforcement agency study of homicide investigative practices and policies. These include management practices, investigative procedures, analytical methods, demographics of the population served, and the extent of political influences that might affect agency effectiveness in clearing homicides. As expected, the results show some factors that enable effective agency investigations and other factors that hinder such processes. Some results can be interpreted to support contentions of victim devaluation by the police. However, an alternative interpretation, and perhaps more viable notion, is offered suggesting that police devaluation by the community may also contribute to explanations for the variance found in homicide clearance rates.
[657] Paper: “Near-Repeat Patterns in Philadelphia Shootings.” By Jerry H Ratcliffe and George F Rengert. Security Journal, February 2008. Pages 58–76. <link.springer.com>
“The ‘code of the street’ actively discourages cooperation with, and respect for, formal law enforcement and encourages the use of violence to solve personal disputes.”
[658] Paper: “The Decline of Arrest Clearances For Criminal Homicide: Causes, Correlates, and Third Parties.” By Marc Riedel. Criminal Justice Policy Review, September 1999. Pages 279–305. <cjp.sagepub.com>
“The percent of offenders arrested for murder in the United States has declined in all reporting cities from 92% in 1960 to 66% in 1997.”
[659] Report: “Uniform Crime Report, Crime in the United States, 2019, Offenses Cleared.” Federal Bureau of Investigation, Criminal Justice Information Services Division, Fall 2020. <ucr.fbi.gov>
Pages 1–3:
In the FBI’s Uniform Crime Reporting (UCR) Program, law enforcement agencies can clear, or “close,” offenses in one of two ways: by arrest or by exceptional means. Although an agency may administratively close a case, that does not necessarily mean that the agency can clear the offense for UCR purposes. To clear an offense within the UCR Program’s guidelines, the reporting agency must adhere to certain criteria, which are outlined in the following text. (Note: The UCR Program does not distinguish between offenses cleared by arrest and those cleared by exceptional means in collecting or publishing data via the traditional Summary Reporting System.)
Cleared by Arrest
In the UCR Program, a law enforcement agency reports that an offense is cleared by arrest, or solved for crime reporting purposes, when three specific conditions have been met. The three conditions are that at least one person has been:
• Arrested.
• Charged with the commission of the offense.
• Turned over to the court for prosecution (whether following arrest, court summons, or police notice).
In its clearance calculations, the UCR Program counts the number of offenses that are cleared, not the number of persons arrested. The arrest of one person may clear several crimes, and the arrest of many persons may clear only one offense. In addition, some clearances that an agency records in a particular calendar year, such as 2019, may pertain to offenses that occurred in previous years.
Cleared by Exceptional Means
In certain situations, elements beyond law enforcement’s control prevent the agency from arresting and formally charging the offender. When this occurs, the agency can clear the offense exceptionally. Law enforcement agencies must meet the following four conditions in order to clear an offense by exceptional means. The agency must have:
• Identified the offender.
• Gathered enough evidence to support an arrest, make a charge, and turn over the offender to the court for prosecution.
• Identified the offender’s exact location so that the suspect could be taken into custody immediately.
• Encountered a circumstance outside the control of law enforcement that prohibits the agency from arresting, charging, and prosecuting the offender.
Examples of exceptional clearances include, but are not limited to, the death of the offender (e.g., suicide or justifiably killed by police or citizen); the victim’s refusal to cooperate with the prosecution after the offender has been identified; or the denial of extradition because the offender committed a crime in another jurisdiction and is being prosecuted for that offense. In the UCR Program, the recovery of property alone does not clear an offense. …
Overview
• In the nation in 2019, 45.5 percent of violent crimes and 17.2 percent of property crimes were cleared by arrest or exceptional means.
• When considering clearances of violent crimes, 61.4 percent of murder offenses, 52.3 percent of aggravated assault offenses, 32.9 percent of rape offenses, and 30.5 percent of robbery offenses were cleared.
[660] Dataset: “Intentional Homicides (Per 100,000 People).” World Bank, June 30, 2021. Accessed July 14, 2021 at <data.worldbank.org>
“The intentional killing of a human being by another is the ultimate crime. Its indisputable physical consequences manifested in the form of a dead body also make it the most categorical and calculable.”
[661] Calculated with data from:
a) Article: “2017 Homicide Data Provide Insight Into Baltimore’s Gun Wars, Police Say.” By Kevin Rector. Baltimore Sun, January 3, 2018. <www.baltimoresun.com>
“The police department did increase its homicide clearance rate in 2017 to 51.3 percent, up from 38.7 percent in 2016 and 30 percent in 2015. That included cases from previous years cleared in 2017, and cases that police closed by exception—such as cases where police belief the person responsible has died.”
b) Article: “Majority of Baltimore Homicide Victims in 2018 Were Shot in the Head, Analysis Shows.” By Jessica Anderson. Baltimore Sun, January 2, 2019. <www.baltimoresun.com>
“The homicide clearance rate in 2018 was 43.4 percent. That’s down from 51.5 percent in 2017, but up from 38.7 percent in 2016.”
c) Article: “Baltimore Ending the Year with 32% Homicide Clearance Rate.” By Jessica Anderson. Baltimore Sun, December 30, 2019. <www.baltimoresun.com>
“The department has cleared—a measure of arrests, suspects dying before trial and other factors—just 32.1% of homicides this year, one of its lowest rates in the last three decades. … In 2010, Baltimore’s rate was 56%, which was the national average for similarly sized cities, according to statistics compiled by The Sun. But the city’s clearance rate has dropped even as violence escalated. In 2015 only 30.5% of cases cleared, the data shows.”
d) Commentary: “A Data Dive on Baltimore Homicides Shows the Need to Stop Retaliatory Violence.” By Dan Rodricks. Baltimore Sun, March 9, 2021. <www.baltimoresun.com>
“Let me quickly point out that the BPD [Baltimore Police Department] reported a 2020 homicide clearance rate of 40.3%….”
CALCULATION: (30.5% + 38.7% + 51.5% + 43.4% + 32.1 % + 40.3%) / 6 years = 39.4%
[662] Dataset: “Intentional Homicides (Per 100,000 People).” World Bank, June 30, 2021. Accessed July 14, 2021 at <data.worldbank.org>
“The intentional killing of a human being by another is the ultimate crime. Its indisputable physical consequences manifested in the form of a dead body also make it the most categorical and calculable.”
[663] Calculated with data from:
a) Chicago Police Department Annual Reports, 1965–2010, 2018–2020. <portal.chicagopolice.org>
“Index Offenses and Clearances … Index Crimes Clearances”
“Clearance Rates”
“Table 1: 2020 Part I Crime Overview … Criminal Homicide (Murder)”
b) Dataset: “Homicide Clearances by Area, 2011–2017.” Sent to Just Facts by the Chicago Police Department Office of Legal Affairs on February 14, 2018.
c) “Homicide Clearance Rate Report.” Police Executive Research Forum and U.S. Department of Justice Bureau of Justice Assistance, October 2019. <home.chicagopolice.org>
Page 2: Chart: “Chicago Homicides and Cases Cleared 2014–2018”
NOTE: An Excel file containing the data and calculations is available upon request.
[664] Dataset: “Intentional Homicides (Per 100,000 People).” World Bank, December 16, 2021. Accessed December 29, 2021 at <data.worldbank.org>
“The intentional killing of a human being by another is the ultimate crime. Its indisputable physical consequences manifested in the form of a dead body also make it the most categorical and calculable.”
[665] Calculated with data from:
a) Report: “Homicide Trends in the United States, 1980–2008.” By Alexia Cooper and Erica L. Smith. U.S. Department of Justice, Bureau of Justice Statistics, November 2011. <www.bjs.gov>
Page 13: “Figure 19. Homicides, by race of offender and victim, 1980–2008.”
Pages 34–35:
While many agencies report supplemental data on homicides, much of the data concerning offenders may not be reported because no suspects were identified or the agency chose not to report the information. The most significant problem in using SHR [FBI’s Supplemental Homicide Report] data to analyze offender characteristics is the sizable and growing number of homicides in the data file for which no offender information is reported. Ignoring these homicides with no offender information would understate calculated rates of offending by particular subgroups of the population, distort trends over time among these same subgroups, and bias observed patterns of offending to the extent that the rate of missing offender data is associated with offender characteristics.
To adjust for homicides with no offender information, a method for offender imputation was devised that uses available information about murder victims for which corresponding offender information was provided as well as those with missing offender information. Through this imputation algorithm, the demographic characteristics of unidentified offenders were inferred on the basis of similar homicide cases—similar in terms of the victim’s demographic profile, circumstances of the homicide such as felony or argument, location of the homicide (region and urban), gun involvement, and year of the offense—for which offender data were provided. In other words, unknown offender profiles were estimated based on the offender profiles in offender-known cases, matched on victim age, sex, and race; circumstances of the homicide; location of the homicide; gun involvement; and year. †
b) Report: “Crime in the United States.” Federal Bureau of Investigation.
2005–2007: Expanded Homicide Data Table 5: “Race and Sex of Victim by Race and Sex of Offender [Single victim/single offender].”
2008–2014: Expanded Homicide Data Table 6: “Murder: Race, Ethnicity, and Sex of Victim by Race, Ethnicity, and Sex of Offender [Single victim/single offender].”
2008, 2009, 2010, 2011, 2012, 2013, 2014, 2015
2016: Expanded Homicide Data Table 3: “Murder: Race, Ethnicity, and Sex of Victim by Race, Ethnicity, and Sex of Offender [Single victim/single offender].” 2016
2017–2019: Expanded Homicide Data Table 6: “Murder: Race, Sex, and Ethnicity of Victim by Race, Sex, and Ethnicity of Offender [Single victim/single offender].” 2017, 2018, 2019
NOTES:
[666] Commentary: “No Sanctuary in Charleston.” By Patricia Williams Lessane. New York Times, June 18, 2015. <www.nytimes.com>
On Wednesday night, while my son watched TV, I logged on to Facebook to check my friends’ updates. Immediately I saw a post about a shooting at Emanuel A.M.E. [African Methodist Episcopal], a historic black church in downtown Charleston that is a stone’s throw from my office at the College of Charleston. …
Five years ago, my ex-husband and I jumped at the chance to leave the violence of Chicago’s South Side to forge a life in a safer, culturally rich community. In hopes of a better life, we eagerly joined the numbers of other African-Americans “returning” south in a wave of reverse migration.
And for a while things were good. But then Trayvon Martin was gunned down in Florida, and almost instantly black people seemed to be under attack. Then came the police shootings of Michael Brown, Tamir Rice and Walter Scott—just a few miles away, in North Charleston—revealing the threat of violence we face every day. And this month we saw the footage of teenagers being manhandled by the police in Texas and Ohio. …
I can’t help but think of this senseless act of terror, the largest mass shooting in the country since 2013, within the historical context of the Birmingham bombing, but also within the very current context of the increasing terror we African-Americans face on a daily basis.
The shooter’s reported words to his victims reflect a deep-seated hatred for, and fear of, black people by many Americans. These vitriolic sentiments underscore the way we are stereotyped in the media, demonized and dehumanized by right-wing pundits, policed by law enforcement and terrorized by those who use Stand Your Ground to cut us down without a second thought.
For me, last night’s events signal several visceral truths. One, that we African-Americans have no sanctuary. Charleston is a wonderful city, but in some very real ways, my children are no safer here than they were in Chicago. …
Patricia Williams Lessane is the director of the Avery Institute of Afro-American History and Culture at the College of Charleston.
[667] Calculated with data from:
a) Report: “Homicide Trends in the United States, 1980–2008.” By Alexia Cooper and Erica L. Smith. U.S. Department of Justice, Bureau of Justice Statistics, November 2011. <www.bjs.gov>
Page 13: “Figure 19. Homicides, by race of offender and victim, 1980–2008.”
Pages 34–35:
While many agencies report supplemental data on homicides, much of the data concerning offenders may not be reported because no suspects were identified or the agency chose not to report the information. The most significant problem in using SHR [FBI’s Supplemental Homicide Report] data to analyze offender characteristics is the sizable and growing number of homicides in the data file for which no offender information is reported. Ignoring these homicides with no offender information would understate calculated rates of offending by particular subgroups of the population, distort trends over time among these same subgroups, and bias observed patterns of offending to the extent that the rate of missing offender data is associated with offender characteristics.
To adjust for homicides with no offender information, a method for offender imputation was devised that uses available information about murder victims for which corresponding offender information was provided as well as those with missing offender information. Through this imputation algorithm, the demographic characteristics of unidentified offenders were inferred on the basis of similar homicide cases—similar in terms of the victim’s demographic profile, circumstances of the homicide such as felony or argument, location of the homicide (region and urban), gun involvement, and year of the offense—for which offender data were provided. In other words, unknown offender profiles were estimated based on the offender profiles in offender-known cases, matched on victim age, sex, and race; circumstances of the homicide; location of the homicide; gun involvement; and year. †
b) Report: “Crime in the United States.” Federal Bureau of Investigation.
2005–2007: Expanded Homicide Data Table 5: “Race and Sex of Victim by Race and Sex of Offender [Single victim/single offender].”
2008–2014: Expanded Homicide Data Table 6: “Murder: Race, Ethnicity, and Sex of Victim by Race, Ethnicity, and Sex of Offender [Single victim/single offender].”
2008, 2009, 2010, 2011, 2012, 2013, 2014, 2015
2016: Expanded Homicide Data Table 3: “Murder: Race, Ethnicity, and Sex of Victim by Race, Ethnicity, and Sex of Offender [Single victim/single offender].” 2016
2017–2019: Expanded Homicide Data Table 6: “Murder: Race, Sex, and Ethnicity of Victim by Race, Sex, and Ethnicity of Offender [Single victim/single offender].” 2017, 2018, 2019
NOTES:
[668] Dataset: “Intentional Homicides (Per 100,000 People).” World Bank, June 30, 2021. Accessed July 14, 2021 at <data.worldbank.org>
“The intentional killing of a human being by another is the ultimate crime. Its indisputable physical consequences manifested in the form of a dead body also make it the most categorical and calculable.”
[669] Calculated with data from:
a) Report: “Homicide Trends in the United States, 1980–2008.” By Alexia Cooper and Erica L. Smith. U.S. Department of Justice, Bureau of Justice Statistics, November 2011. <www.bjs.gov>
Page 13: “Figure 19. Homicides, by race of offender and victim, 1980–2008.”
Pages 34–35:
While many agencies report supplemental data on homicides, much of the data concerning offenders may not be reported because no suspects were identified or the agency chose not to report the information. The most significant problem in using SHR [FBI’s Supplemental Homicide Report] data to analyze offender characteristics is the sizable and growing number of homicides in the data file for which no offender information is reported. Ignoring these homicides with no offender information would understate calculated rates of offending by particular subgroups of the population, distort trends over time among these same subgroups, and bias observed patterns of offending to the extent that the rate of missing offender data is associated with offender characteristics.
To adjust for homicides with no offender information, a method for offender imputation was devised that uses available information about murder victims for which corresponding offender information was provided as well as those with missing offender information. Through this imputation algorithm, the demographic characteristics of unidentified offenders were inferred on the basis of similar homicide cases—similar in terms of the victim’s demographic profile, circumstances of the homicide such as felony or argument, location of the homicide (region and urban), gun involvement, and year of the offense—for which offender data were provided. In other words, unknown offender profiles were estimated based on the offender profiles in offender-known cases, matched on victim age, sex, and race; circumstances of the homicide; location of the homicide; gun involvement; and year. †
b) Report: “Crime in the United States.” Federal Bureau of Investigation.
2005–2007: Expanded Homicide Data Table 5: “Race and Sex of Victim by Race and Sex of Offender [Single victim/single offender].”
2008–2014: Expanded Homicide Data Table 6: “Murder: Race, Ethnicity, and Sex of Victim by Race, Ethnicity, and Sex of Offender [Single victim/single offender].”
2008, 2009, 2010, 2011, 2012, 2013, 2014, 2015
2016: Expanded Homicide Data Table 3: “Murder: Race, Ethnicity, and Sex of Victim by Race, Ethnicity, and Sex of Offender [Single victim/single offender].” 2016
2017–2019: Expanded Homicide Data Table 6: “Murder: Race, Sex, and Ethnicity of Victim by Race, Sex, and Ethnicity of Offender [Single victim/single offender].” 2017, 2018, 2019
NOTES:
[670] Dataset: “Intentional Homicides (Per 100,000 People).” World Bank, June 30, 2021. Accessed July 14, 2021 at <data.worldbank.org>
“The intentional killing of a human being by another is the ultimate crime. Its indisputable physical consequences manifested in the form of a dead body also make it the most categorical and calculable.”
[671] Book: Firearms and Violence: A Critical Review. By the Committee to Improve Research and Data on Firearms and the Committee on Law and Justice, National Research Council of the National Academies. Edited by Charles F. Wellford, John V. Pepper, and Carol V. Petrie. National Academies Press, 2005.
Page 21: “The National Crime Victimization Survey … is widely viewed as a ‘gold standard for measuring crime victimization.’ ”
Page 30: “Although the NCVS [National Crime Victimization Survey] data do many things right, they are, like any such system, beset with methodological problems of surveys in general as well as particular problems associated with measuring illicit, deviant, and deleterious activities….”
[672] Report: “The Nation’s Two Crime Measures.” By Michael Planty and Lynn Langton. U.S. Department of Justice, Bureau of Justice Statistics, September, 2014. <www.bjs.gov>
Page 1:
The U.S. Department of Justice administers two statistical programs to measure the magnitude, nature, and impact of crime in the nation: the FBI’s Uniform Crime Reporting (UCR) Program and the Bureau of Justice Statistic’s National Crime Victimization Survey (NCVS). Each of these programs produces valuable information about aspects of the nation’s crime problem. Because the UCR and NCVS programs have different purposes, use different methods, and focus on somewhat different aspects of crime, the complementary information they produce together provides a more comprehensive understanding of the nation’s crime problem than either could produce alone. …
The UCR Program currently collects information on murder and nonnegligent manslaughter, forcible rape, robbery, aggravated assault, burglary, larceny-theft, motor vehicle theft, arson, and human trafficking. …
The current NCVS collects detailed information on the frequency and nature of the crimes of rape and other sexual assault, robbery, aggravated and simple assault, personal larceny, household burglary, motor vehicle theft, and other theft. Each year, BJS interviews a nationally representative sample of approximately 169,000 persons age 12 or older living in U.S. households. Households remain in the sample for 3.5 years.
Page 2:
The NCVS includes, but the UCR excludes, sexual assault (completed, attempted, and threatened), attempted robberies, verbal threats of rape, simple assault, and crimes not reported to law enforcement. The UCR includes, but the NCVS excludes, homicide, arson, commercial crimes, and crimes against children under age 12. The UCR captures crimes reported to law enforcement, but collects only arrest data for simple assault and sex offenses other than forcible rape.
[673] Report: “Criminal Victimization, 2014.” By Jennifer L. Truman and Lynn Langton. U.S. Department of Justice. Revised September 29, 2015. <www.bjs.gov>
Page 1: “Violent crime [is] defined as rape or sexual assault, robbery, aggravated assault, and simple assault.…”
Page 2: “Violent crime … excludes homicide because the NCVS is based on interviews with victims and therefore cannot measure murder…. Table 1: Violent Victimizations, by Type of Violent Crime, 2005, 2013 and 2014 … Violent crime [=] 5,359,570”
[674] Report: “Criminal Victimization, 2019.” By Rachel E. Morgan and Jennifer L. Truman. U.S. Department of Justice, Bureau of Justice Statistics, September 2020. <www.bjs.gov>
Page 17:
Table 13. Percent and number of violent incidents, by total population and victim and offender demographic characteristics, 2019 … Race/ethnicity … Whitec … Percent of populationa [=] 61.9% … Offenderb [=] 50.2% … Blackc … Percent of population [=] 12.1% … Offenderb [=] 25.0% … Hispanic … Percent of populationa [=] 17.3% … Offenderb [=] 18.7% …
a The National Crime Victimization Survey (NCVS) population represents persons age 12 or older living in non-institutionalized residential settings in the U.S.
b Includes those incidents in which the perceived offender characteristics were reported. The sex of the offender was unknown in 7% of incidents, the race or ethnicity of the offender was unknown in 16% of incidents, and the age of the offender was unknown in 15% of incidents.
c Excludes persons of Hispanic origin (for example, “white” refers to non-Hispanic whites and “black” refers to non-Hispanic blacks).
NOTE: See the next footnote, which shows that the portion of violent crimes committed by low-income minorities is likely underestimated by the National Crime Victimization Survey.
[675] Paper: “The Lethality of Criminal Assault 1960–1999.” By Anthony R. Harris and others. Homicide Studies, May 1, 2002. Pages 128–166. <www.universitychurchchicago.org>
Page 139:
One, despite its many uses in measuring crimes unknown to the police, NCS/NCVS [National Crime Survey/National Crime Victimization Survey] has been widely recognized as having continuously undersampled high-risk-for-crime groups, ranging from the Black underclass, to families that recompose and/or move frequently, to prisoners, to the homeless, and to other hard-to- reach populations. For example, in a study of 26 U.S. cities, O’Brien (1983) found that whereas urban percentage African American is positively correlated at .47 with UCR [FBI’s Uniform Crime Reporting Program] assault rates and .43 for UCR rape rates, it is negatively correlated at –.45 with NCVS assault rates and –.26 with NCVS rape rates. Slightly weaker but parallel findings occur when percentage poor was used by O’Brien instead of percentage African American (see also Reiss and Roth’s extensive 1993 critical review for the National Research Council).
[676] Paper: “Better Schools, Less Crime?” By David J. Deming. Quarterly Journal of Economics, November 2011. Pages 2063–2115. <scholar.harvard.edu>
Page 2064:
In this article, I link a long and detailed panel of administrative data from Charlotte-Mecklenburg school district (CMS) to arrest and incarceration records from Mecklenburg County and the North Carolina Department of Corrections (NCDOC). In 2002, CMS implemented a district-wide open enrollment school choice plan. Slots at oversubscribed schools were allocated by random lottery. School choice in CMS was exceptionally broad-based.
Page 2065:
Across various schools and for both middle and high school students, I find consistent evidence that winning the lottery reduces adult crime.4 The effect is concentrated among African American males and youth who are at highest risk for criminal involvement. Across several different outcome measures and scalings of crime by severity, high-risk youth who win the lottery commit about 50% less crime. They are also more likely to remain enrolled and “on track” in school, and they show modest improvements on school-based behavioral outcomes such as absences and suspensions. However, there is no detectable impact on test scores for any youth in the sample.
Page 2070: “With over 150,000 students enrolled in the 2008–2009 school year, CMS is the 20th largest school district in the nation.”
Pages 2089–2090:
In Figure II, we see that winning the lottery leads to fewer felony arrests overall (p = .078), and the effect is concentrated among the highest risk youth (0.77 felony arrests for lottery losers, 0.43 for winners, p = .013). Similarly, the trimmed social cost of crime is lower overall for lottery winners (p = .040), but the effect is concentrated among the top risk quintile youth ($11,000 for losers, $6,389 for winners, p=.036). The concentration of effects in the top risk quintile is even more pronounced for the middle school sample. The social cost of arrested crimes is $12,500 for middle school lottery losers and $4,643 for winners (p = .020), and the effect for days incarcerated is similarly large and concentrated among high-risk youth (55.5 days for losers, 17.2 for winners, p = .003).
NOTE: Credit for bringing this paper to the attention of Just Facts belongs to Alex Adrianson of the Heritage Foundation. [Commentary: “School Choice a Crime Fighter.” By Alex Adrianson. InsiderOnline, March 2012.]
[677] “WWC Review of the Report ‘Better Schools, Less Crime?’ ” U.S. Department Of Education, Institute of Education Sciences, What Works Clearinghouse, July 2013. <ies.ed.gov>
Page 2:
The research described in this report meets WWC [What Works Clearinghouse] evidence standards without reservations.
Strengths: The intervention and comparison groups were formed by a well-implemented random process.
Cautions: The study had high levels of attrition for one outcome, the 2004 reading score. The study author demonstrated that students in the intervention and comparison groups were equivalent at baseline on reading achievement. Therefore, the analysis for this outcome meets WWC standards with reservations.
[678] Article: “Black Lives Matter Reveals a Six-Point Plan to Combat Systemic Racism.” By Colin Daileda. Mashable, August 2, 2016. <mashable.com>
Dozens of organizations associated with the Black Lives Matter movement released a uniform six-point policy platform on Monday articulating many goals they believe will combat systemic racism in America. …
We’ve listed the six demands, below.
End the War on Black People
The coalition lists 10 actionable goals they believe will accomplish this demand. They include abolishing the death penalty, ending the use of money for bail, and the demilitarization of police.
[679] Article: “Person of the Year 2015, The Short List: Black Lives Matter.” By Alex Altman. Time, 2015. <time.com>
In 2015, Black Lives Matter blossomed from a protest cry into a genuine political force. Groups that embraced the slogan hounded police chiefs from their jobs, won landmark prosecutions and turned college campuses into cauldrons of social ferment. At the University of Missouri, a hunger strike incited a boycott by the football team that drove the president out of office.
Along the way, an organic uprising morphed into organized blocs with specific demands. Activists arranged national conferences so local groups could connect and swap strategies. To skirt suspected surveillance by authorities, they learned to encrypt communication with smartphone apps like Signal and anonymized browsers like Tor. A movement rooted in the rejection of police violence diversified, launching campaigns to combat a broad sweep of perceived injustices, from gender inequality to the minimum wage to housing and education policy. The year 2014 was about “connecting the dots for people and weaving a broader story about systemic injustice so the masses could understand life as a black person in America,” says Brittany Packnett, a 31-year-old education executive from St. Louis whose role protesting the fatal shooting of Michael Brown in Ferguson, Mo., earned her a spot on President Obama’s police-reform task force. “In 2015, we know we can both tell the story and change the story.”
[680] Webpage: “About the Black Lives Matter Network.” #BlackLivesMatter. Accessed September 08, 2016 at <blacklivesmatter.com>
Rooted in the experiences of Black people in this country who actively resist our dehumanization, #BlackLivesMatter is a call to action and a response to the virulent anti-Black racism that permeates our society. …
#BlackLivesMatter is working for a world where Black lives are no longer systematically and intentionally targeted for demise. We affirm our contributions to this society, our humanity, and our resilience in the face of deadly oppression. …
This is the Official #BlackLivesMatter Organization founded by Patrisse Cullors, Opal Tometi, and Alicia Garza.
#BlackLivesMatter is an online forum intended to build connections between Black people and our allies to fight anti-Black racism, to spark dialogue among Black people, and to facilitate the types of connections necessary to encourage social action and engagement.
[681] Article: “11 Major Misconceptions About the Black Lives Matter Movement.” By Brittney Cooper. Cosmopolitan, September 08, 2016. <www.cosmopolitan.com>
5. The movement has no respect for elders. The BLM [Black Lives Matter] movement is an intergenerational movement. Certainly there have been schisms and battles between younger and older movers about tactics and strategies. There has also been criticism from prior civil rights participants. There is a clear rejection of the respectability politics ethos of the civil rights era, namely a belief in the idea that proper dress and speech will guard against harassment by the police. This is a significant point of tension within black communities, because in a system that makes one feel powerless to change it, belief in the idea that a good job, being well-behaved, and having proper dress and comportment will protect you from the evils of racism feels like there’s something you can do to protect yourself, that there’s something you can do to have a bit of control over your destiny. This movement patently rejects such thinking in the face of massive evidence of police mistreatment of black people of all classes and backgrounds. All people should be treated with dignity and respect, regardless of how one looks or speaks. If you ever have occasion to attend a protest action, you will see black people of all ages, from the very young to the very old, standing in solidarity with the work being done. …
9. The movement hates police officers. Police officers are people. Their lives have inherent value. This movement is not an anti-people movement; therefore it is not an anti-police-officer movement. Most police officers are just everyday people who want to do their jobs, make a living for their families, and come home safely at the end of their shift. This does not mean, however, that police are not implicated in a system that criminalizes black people, that demands that they view black people as unsafe and dangerous, that trains them to be more aggressive and less accommodating with black citizens, and that does not stress that we are taxpayers who deserve to be protected and served just like everyone else. Thus the Black Lives Matter movement is not trying to make the world more unsafe for police officers; it hopes to make police officers less of a threat to communities of color.
[682] Article: “Black Lives Matter Group is Pressured to Expand the Scope of Its Outrage.” By Michael A. Fletcher. Washington Post, December 11, 2015. <www.washingtonpost.com>
“Black Lives Matter and its sister groups around the country formed after the killing of Trayvon Martin in 2012. Protesters held up the acquittal of neighborhood watchman George Zimmerman as evidence of society’s passive acceptance of unjust killings of black people.”
[683] Article: “How a Death in Ferguson Sparked a Movement in America.” By Shannon Luibrand. CBS News, August 7, 2015. <www.cbsnews.com>
“Black Lives Matter was sparked by a woman who tweeted it after the acquittal of George Zimmerman in the death of Trayvon Martin and it caught on, especially after the death of Michael Brown. It was also turned into an organization under the same name, Black Lives Matter. But the movement as a whole is also referred to as the Black Lives Matter movement.”
[684] Article: “One Slogan, Many Methods: Black Lives Matter Enters Politics.” By John Eligon. New York Times, November 18, 2015. <www.nytimes.com>
“The name Black Lives Matter was born when Alicia Garza, a California-based activist, used it in a Facebook post after George Zimmerman was acquitted two years ago in the killing of Trayvon Martin, an unarmed black teenager, in Florida.”
[685] Article: “New Details Are Released in Shooting of Trayvon Martin.” By Serge F. Kovaleski and Campbell Robertson. New York Times, May 17, 2012. <www.nytimes.com>
When police officers arrived on the scene of the shooting of Trayvon Martin on the rainy night of Feb. 26, they tried frantically to revive the 17-year-old, who had been shot in the chest and was lying motionless behind a row of town houses in a gated community in Sanford, Fla. …
George Zimmerman, 28, the neighborhood watch volunteer charged last month with second-degree murder in the case, was apparently known to some members of the Sanford police, according to the documents. He had called the police frequently and had contacted them to set up the neighborhood watch in the Retreat at Twin Lakes, where he lived and where he shot Mr. Martin.
[686] Article: “George Zimmerman Ethnicity: Is He White, Latino or ‘White Hispanic?’ ” By Nicole Akoukou Thompson. Latin Post, October 24, 2013. <www.latinpost.com>
Zimmerman’s mother was born in Peru and has black ancestry, which includes her Afro-Peruvian grandfather. His father is white, and of German descent, and has had a long career in the military. Zimmerman’s voter registration lists him as Hispanic. But, contingent on who you’re speaking to, Zimmerman could be described as white, Hispanic, or “white Hispanic.” …
The general fact, however, is that Zimmerman is mixed raced, and being that Latino is a multiracial identify, he qualifies.
[687] Article: “What Race Is George Zimmerman?” By Jefferson M. Fish Ph.D. Psychology Today, August 6, 2013. <www.psychologytoday.com>
Americans assume that race is a biological entity, and use the folk term “blood” (meaning ancestry) to describe it. Since Zimmerman has some African ancestry on his Peruvian mother’s side, he would probably meet Louisiana’s former criterion, that anyone with 1/32 black blood is black. So one possible race for Zimmerman is black.
Interestingly, Zimmerman has been referred to as a white Hispanic, but not as an Hispanic white. This is because, most Americans assume that Hispanics are a race, and therefore are not white—so a white Hispanic is a kind of Hispanic. However, the census says the opposite—that whites and blacks (but not Hispanics) are a race. So according to the census categories, he is an Hispanic white—which is a kind of white person.
[688] Article: “Nothing to Dispute Sanford Shooter’s Self-Defense Claim in Miami Boy’s Death: Police Chief.” By Edward B. Colby and Gilma Avalos. NBC Miami, March 12, 2012. Updated 3/21/12. <www.nbcmiami.com>
Sanford Police Chief Bill Lee Jr. said Monday that his department has nearly completed “a thorough and fair investigation” into the fatal shooting of a Miami high school junior, but said police do not have anything at this point to dispute shooter George Zimmerman’s self-defense claim.
“Until we can establish probable cause to dispute that, we don’t have the grounds to arrest him,” Lee said of Zimmerman. According to police, Zimmerman, 26, the captain of a neighborhood crime watch group, told them that he shot Trayvon Martin, 17, in self-defense after an altercation on the night of Feb. 26.
[689] Article: “George Zimmerman Found Not Guilty.” By Yamiche Alcindor. USA Today, July 13, 2013. Updated 7/14/13. <www.usatoday.com>
“The case has gripped the nation since the shooting happened on Feb. 26, 2012. Police initially did not charge Zimmerman with a crime, citing Florida’s ‘stand-your-ground’ law, which allows someone who believes they are in imminent danger to take whatever steps are necessary to protect themselves.”
[690] Article: “Obama on Trayvon Martin: ‘If I Had a Son, He’d Look Like Trayvon.’ ” By Krissah Thompson and Scott Wilson. Washington Post, March 23, 2012. <www.washingtonpost.com>
Embedded in his remarks in the Rose Garden was a particular message about being a black parent.
“If I had a son, he’d look like Trayvon,” Obama said. “When I think about this boy, I think about my own kids.”
[691] Article: “Al Sharpton.” Encyclopædia Britannica. Last updated September 30, 2020. <www.britannica.com>
“Al Sharpton, in full Alfred Charles Sharpton, Jr., (born October 3, 1954, Brooklyn, New York, U.S.), American civil rights activist, politician, and minister who founded the National Action Network (1991) and later hosted a political talk show on MSNBC.”
[692] Article: “Al Sharpton: Civil Disobedience Will Escalate if Zimmerman Remains Free.” By Arelis R. Hernández. Orlando Sentinel, March 31, 2012. <www.orlandosentinel.com>
If George Zimmerman is not arrested in the shooting death of Trayvon Martin soon, the Rev. Al Sharpton will call for an escalation in peaceful civil disobedience and economic sanctions. …
“I will speak about how the National Action Network will move to the next level if Zimmerman isn’t arrested,” said Sharpton, who founded the Network. He added that it was the Martin family and lawyers who first asked him to get involved and nationalize this story.
[693] Transcript: “Today Show.” NBC News, March 22, 2012. <www.talkleft.com>
LUCIANO: … the teen gunned down by Neighborhood Watchman George Zimmerman last month as he walked through this gated community wearing a hoodie.
(Clip from 911 call)
Mr. GEORGE ZIMMERMAN: This guy looks like he’s up to no good. He looks black.
Unidentified 911 Operator: Did you see what he was wearing?
Mr. ZIMMERMAN: Yeah, a dark hoodie.
(End of clip)
[694] Transcript: “Today Show.” NBC News, March 27, 2012. <www.talkleft.com>
Reverend AL SHARPTON (MSNBC Host): For one man, would you risk the reputation of a whole city? Zimmerman is not worth the history of this city. You need to arrest him and redeem this city right now.
(Clip from 911 call)
Mr. GEORGE ZIMMERMAN: This guy looks like he’s up to no good. He looks black.
Unidentified 911 Operator: Did you see what he was wearing?
Mr. ZIMMERMAN: Yeah. A dark hoodie.
(End of clip)
ALLEN: This case drew national attention after 911 tapes were released from the night Zimmerman, a Neighborhood Watch volunteer, shot and killed Martin, an unarmed teenager.
[695] “Transcript of George Zimmerman’s Call to the Police.” City of Sanford, Florida, March 16, 2012. <archive.org>
Zimmerman: Hey we’ve had some break-ins in my neighborhood, and there’s a real suspicious guy uh [near] Retreat View Circle, um, the best address I can give you is 111 Retreat View Circle. This guy looks like he’s up to no good, or he’s on drugs or something. It’s raining and he’s just walking around, looking about.
Dispatcher: OK, and this guy is he white, black, Hispanic?
Zimmerman: He looks black.
[696] Article: “TV Corrects Itself, Just Not on the Air.” By David Carr. New York Times, April 22, 2012. <www.nytimes.com>
“After broadcasting an audio clip on the ‘Today’ show about George Zimmerman last month that hit the trifecta of being misleading, incendiary and dead-bang wrong, NBC News management took serious action: it fired the producer in charge and issued a statement apologizing for making it appear as if Mr. Zimmerman had made overtly racist statements.”
[697] Article: “Trayvon Martin Video Shows No Blood or Bruises on George Zimmerman.” By Matt Gutman, ABC News, March 28, 2012. <abcnews.go.com>
A police surveillance video taken the night that Trayvon Martin was shot dead shows no blood or bruises on George Zimmerman, the neighborhood watch captain who says he shot Martin after he was punched in the nose, knocked down and had his head slammed into the ground.
The surveillance video, which was obtained exclusively by ABC News, shows Zimmerman arriving in a police cruiser. As he exits the car, his hands are cuffed behind his back. Zimmerman is frisked and then led down a series of hallways, still cuffed. …
The initial police report noted that Zimmerman was bleeding from the back of the head and nose, and after medical attention it was decided that he was in good enough condition to travel in a police cruiser to the Sanford, Fla., police station for questioning.
His lawyer later insisted that Zimmerman’s nose had been broken in his scuffle with 17-year-old Martin.
In the video an officer is seen pausing to look at the back of Zimmerman’s head, but no abrasions or blood can be seen in the video and he did not check into the emergency room following the police questioning.
[698] “Documents in the Trayvon Martin Case.” Florida State Attorney’s Office, May 17, 2012. <assets.documentcloud.org>
Pages 70, 149 (of PDF): “Photograph of George Zimmerman.”
[699] Commentary: “Young, Law-Abiding, Black and Dead.” By Alvin Bessent. Newsday. Updated March 22, 2012. <www.newsday.com>
“Zimmerman told police he shot Martin in self-defense. But Zimmerman weighs 250 pounds, had a gun and was clearly the aggressor. If anyone was in imminent danger of being killed or badly injured, it was Martin, an unarmed, 140-pound kid who just wanted to go watch a basketball game.”
[700] Commentary: “ ‘Stand Your Ground’: A Killer Defense?” By John Romano. Tampa Bay Times, March 17, 2012. <www.tampabay.com>
Zimmerman, who outweighed the teenager by close to 100 pounds, had a bloody nose and an explanation of self-defense. …
So Trayvon Martin was not armed, was doing nothing wrong, and was killed by a man following him with a gun. And there is a chance no crime was committed.
[701] Commentary: “Trayvon Martin Murdered Twice, First by a Racist Criminal, Then by a Racist Criminal System.” By Michael Coard. San Francisco Bay View, March 24, 2012. <sfbayview.com>
The self-appointed block watch captain who continued to stalk Trayvon despite a police order to the contrary, who exited his vehicle despite no criminal activity by the unarmed child who was outweighed by 100 pounds, who confronted him, and who then shot him was not arrested….
Self-defense, or what lawyers properly call “justification,” can’t be reasonably claimed by aggressors, especially aggressors like Zimmerman who follow a person, confront that person, outweigh that person by 100 pounds, and outgun that person by possessing a high-powered firearm compared to Skittles and iced tea.
[702] Commentary: “A Mother’s Grace and Grieving.” By Charles M. Blow. New York Times, March 25, 2012. <www.nytimes.com>
To believe Zimmerman’s scenario, you have to believe that Trayvon, an unarmed boy, a boy so thin that people called him Slimm, a boy whose mother said that he had not had a fight since he was a preschooler, chose that night and that man to attack. You have to believe that Trayvon chose to attack a man who outweighed him by 100 pounds and who, according to the Sanford police, was wearing his gun in a holster. You have to believe that Trayvon chose to attack even though he was less than a hundred yards from the safety of the home where he was staying.
[703] Examples of media outlets using these photos of Zimmerman and Martin include:
a) Article: “Trayvon Martin Killing: Witness Says He Saw Zimmerman Walk Away Uninjured.” By Richard Luscombe. U.K. Guardian, March 29, 2012. <www.theguardian.com>
b) Video: “Trayvon Martin Case: Widespread Outrage.” ABC News, March 22, 2012. <www.youtube.com>
Time stamp 0:59
c) Article: “Video of George Zimmerman in Handcuffs Following Fatal Shooting of Trayvon Martin Adds to Debate.” Associated Press, March 29, 2012. Updated 3/24/19. <www.masslive.com>
[704] Article: “Old Photos May be Deceptive in Fla. Shooting Case.” By Matt Sedensky. Associated Press, March 30, 2012. <www.denverpost.com>
When he was shot, Trayvon Martin was not the baby-faced boy in the photo that has been on front pages across the country. And George Zimmerman wasn’t the beefy-looking figure in the widely published mugshot. …
The most widely seen picture of Martin, released by his family, was evidently taken a few years ago and shows a smiling, round-cheeked youngster in a red T-shirt. But at his death, Martin was 17 years old, around 6 feet tall and, according to his family’s attorney, about 140 pounds.
Zimmerman, 28, is best known from a 7-year-old booking photo of an apparently heavyset figure with an imposing stare, pierced ear and facial hair…. The picture, released by police following the deadly shooting, was taken after Zimmerman’s 2005 arrest on an assault-on-an-officer charge that was eventually dropped.
In a police video made public this week of Zimmerman being brought in for questioning a half-hour after the shooting, the 5-foot-9 man appears much slimmer. …
A more complex portrait of the two figures has emerged since then. A photo of a beaming Zimmerman looking sharp in a jacket and tie has come out, along with a more recent picture of Martin, with gold teeth and a white sleeveless undershirt. At the same time, it was learned that Martin had been suspended from school for marijuana residue in his backpack.
[705] Article: “The Iconic Photos of Trayvon Martin & George Zimmerman & Why You May Not See the Others.” By Alicia Shepard. Poynter, March 30, 2012. <www.poynter.org>
The dominant photo of Martin shows him 13 or 14 years old, wearing a red Hollister T-shirt. Other photos, none of them recent, depict a young Martin in a youth football uniform, holding a baby and posing with a snowboard. He is the picture of innocence.
The most common photo of Zimmerman is a 2005 police mugshot. He is 22 in the photo, which was taken after he was arrested for assaulting an officer. (The charges were dropped.) He looks unhappy, if not angry.
The contrast—the two photos are often published side by side—has led to criticism that news media have tilted the story in favor of the 17-year-old victim and against the 28-year-old man who shot him.
[706] “Documents in the Trayvon Martin Case.” Florida State Prosecutor’s Office, May 17, 2012. <assets.documentcloud.org>
Page 2: “Offense Report: Sanford Police Department … Name: Martin, Trayvon Benjamin … Hgt: 600 Wgt: 160”
Page 4: “Offense Report: Sanford Police Department … Name: Zimmerman, George Michael … Hgt: 507 Wgt: 200”
[707] Photo: “George Zimmerman at Bond Hearing.” By Gary W. Green. Orlando Sentinel Press Pool, April 20, 2012.
[708] Article: “Second Trayvon Martin Twitter Feed Identified.” By David Martosko. Daily Caller, March 29, 2012. <dailycaller.com>
“This image is the photograph the late Trayvon Martin used to represent his Twitter identity in late 2011, under the screen name ‘T33ZY_TAUGHT_M3.’ Although the Twitter account was deleted, The Daily Caller retrieved it from the social analytics website PeopleBrowsr. The upper-arm tattoo in the image matches one in a close-up photograph on Martin’s MySpace page.”
[709] Article: “Prosecutor Files Charge of 2nd-Degree Murder in Shooting of Martin.” By Lizette Alvarez and Michael Cooper. New York Times, April 11, 2012. <www.nytimes.com>
“More than six weeks after he shot and killed Trayvon Martin, an unarmed 17-year-old with no criminal record, George Zimmerman, the neighborhood watch coordinator at a small gated community in Sanford, Fla., was charged by a special prosecutor on Wednesday evening with second-degree murder and taken into custody.”
[710] Article: “In Zimmerman Case, Self-Defense Was Hard to Topple.” By Lizette Alvarez. New York Times, July 14, 2013. <www.nytimes.com>
“Toward the end of the trial, prosecutors asked the judge to include the lesser charge of manslaughter, but the jury rejected that as well.”
[711] Article: “George Zimmerman Found Not Guilty.” By Yamiche Alcindor. USA Today, July 13, 2013. Updated 7/14/13. https://<www.usatoday.com>
George Zimmerman, the man accused of murdering Trayvon Martin, was found not guilty of second-degree murder and manslaughter Saturday night. …
The not guilty verdict means the jury of six women, after deliberating for more than 15 hours over two days, found that Zimmerman justifiably used deadly force. They determined that he reasonably believed that such force was “necessary to prevent imminent death or great bodily harm” to himself—Florida’s definition of self-defense.
[712] Press release: “Federal Officials Close Investigation Into Death of Trayvon Martin.” U.S. Department of Justice, February 24, 2015. Updated 8/26/15 <www.justice.gov>
The Justice Department announced today that the independent federal investigation found insufficient evidence to pursue federal criminal civil rights charges against George Zimmerman for the fatal shooting of Trayvon Martin on Feb. 26, 2012, in Sanford, Florida. …
Following the shooting, a team of some of the department’s most experienced civil rights prosecutors and FBI agents conducted a comprehensive, independent investigation of the events of Feb. 26, 2012. …
The federal investigation sought to determine whether the evidence of the events that led to Martin’s death were sufficient to prove beyond a reasonable doubt that Zimmerman’s actions violated the federal criminal civil rights statutes, specifically Section 3631 of Title 42 of the U.S. Code or Section 249 of Title 18 of the U.S. Code, as well as other relevant federal criminal statutes. Section 3631 criminalizes willfully using force or threat of force to interfere with a person’s federally protected housing rights on account of that person’s race or color. Section 249 criminalizes willfully causing bodily injury to a person because of that person’s actual or perceived race. …
After a thorough and independent investigation into the facts surrounding the shooting, federal investigators determined that there is insufficient evidence to prove beyond a reasonable doubt a violation of these statutes. Accordingly, the investigation into this incident has been closed. This decision is limited strictly to the department’s inability to meet the high legal standard required to prosecute the case under the federal civil rights statutes; it does not reflect an assessment of any other aspect of the shooting.
[713] Report: “Social Media Conversations About Race.” By Monica Anderson and Paul Hitlin. Pew Research Center, August 2016. <www.pewinternet.org>
The phrase “black lives matter” was first used by a black community organizer in a Facebook post following the July 2013 acquittal of George Zimmerman in the shooting death of black 17-year-old Trayvon Martin.9 Despite its widespread presence today, the hashtag was slow to gain prominence: During the second half of 2013, it appeared on Twitter a total of just 5,106 times (or about 30 times a day).
Both the use of the hashtag and the influence of the broader Black Lives Matter movement accelerated greatly in August 2014 when Michael Brown, a black teenager, was fatally shot by a white police officer in Ferguson, Missouri.
The #BlackLivesMatter hashtag appeared an average of 58,747 times per day in the roughly three weeks following Brown’s death. However, the use of the hashtag increased dramatically three months later when on November 25, the day after a Ferguson grand jury decided not to indict the officer involved in Brown’s death, the #BlackLivesMatter hashtag appeared 172,772 times. During the subsequent three weeks, the hashtag was used 1.7 million times.
[714] Article: “How a Death in Ferguson Sparked a Movement in America.” By Shannon Luibrand. CBS News, August 7, 2015. <www.cbsnews.com>
One year ago, the nation watched as the city of Ferguson, Mo., erupted.
St. Louis police, dressed in riot gear, stood in a straight line, shields up and face masks down in a standoff with protestors. The media assembled on the sidelines, cameras poised to capture the latest. There was tear gas, burning buildings, chants and signs.
Protesters came armed with a message, a message that would echo through the Missouri night sky in the days and weeks after Michael Brown’s death. It was a message heard across the nation in more protests for other black Americans who died by police hands. “Black lives matter,” they chanted, wrote and tweeted. “Black lives matter,” they chanted in throngs that blocked streets and demanded America’s attention.
[715] Article: “One Slogan, Many Methods: Black Lives Matter Enters Politics.” By John Eligon. New York Times, November 18, 2015. <www.nytimes.com>
Black Lives Matter began as a hashtag and grew into a protest slogan—after prominent police killings of blacks over the past year—and became an Internet-driven civil rights movement. The phrase is as much a mantra as a particular organization, with the general public lumping numerous groups under the Black Lives Matter banner, even if they are not officially connected. …
The name Black Lives Matter was born when Alicia Garza, a California-based activist, used it in a Facebook post after George Zimmerman was acquitted two years ago in the killing of Trayvon Martin, an unarmed black teenager, in Florida. She then teamed with two fellow activists to create the Black Lives Matter hashtag and social media pages. But the movement gained prominence after a white police officer killed Michael Brown, an unarmed black 18-year-old, in Ferguson last year, and the Black Lives Matter founders arranged a national “freedom ride” to Ferguson.
[716] Article: “Black Lives Matter Injects Agenda Into U.S. Presidential Politics.” By Chris Simkins. Voice of America, January 15, 2016. <www.voanews.com>
Flames engulfed at least a dozen businesses in Ferguson late Monday and early Tuesday and gunfire kept firefighters at bay once demonstrations turned ugly, despite pleas for peace from Brown’s family and others. …
Protesters smashed windows out of police cars and buildings, several of which were later looted and set ablaze, and officers lobbed tear gas from inside armored vehicles to disperse crowds in scenes reminiscent of the early days of unrest that followed the Aug. 9 shooting. …
St. Louis County Police Chief Jon Belmar said during a news conference early Tuesday that he “personally heard about 150 shots fired” during the course of the night, but said police did not fire a shot. He said most of at least a dozen burned businesses were “total losses” and noted two police cars were “basically melted.”
[717] Article: “Policing: What Changed (and Didn’t) Since Michael Brown Died.” By Mitch Smith. New York Times, Aug. 7, 2019. <www.nytimes.com>
Christy Lopez, a former Justice Department civil rights lawyer who led federal investigations that found patterns of discriminatory policing in Ferguson and Chicago….
“Ferguson was a really important moment in time: It’s pre- and post-Ferguson, and people look back at that,” Ms. Lopez said. “Everything does still feel like it’s emanating from that event.”
[718] “Department of Justice Report Regarding the Criminal Investigation Into the Shooting Death of Michael Brown by Ferguson, Missouri Police Officer Darren Wilson.” U.S. Department of Justice, March 4, 2015. <s3.amazonaws.com>
Because Wilson did not act with the requisite criminal intent, it cannot be proven beyond reasonable doubt to a jury that he violated 18 U.S.C.§ 242 when he fired his weapon at Brown. …
Conclusion
For the reasons set forth above, this matter lacks prosecutive merit and should be closed.
[719] Article: “Fires, Vandalism, Gunfire Follow Grand Jury Decision in Ferguson.” CBS News / Associated Press, November 24, 2014. <www.cbsnews.com>
Protests quickly turned violent in the Ferguson, Missouri area Monday night after it was announced that a St. Louis County grand jury had decided not to indict Ferguson police officer Darren Wilson in the August 9 shooting death of 18-year-old Michael Brown.
The decision not to charge Wilson, who is white, in the death of Brown, who was black and unarmed, sparked the fresh demonstrations in and around Ferguson, and in cities around the nation. …
St. Louis County Prosecuting Attorney Bob McCulloch announced the grand jury’s decision Monday evening. A grand jury of nine whites and three blacks had been meeting weekly since Aug. 20 to consider evidence. The panel met for 70 hours and heard from 60 witnesses.
[720] Article: “Witnesses Told Grand Jury That Michael Brown Charged at Darren Wilson, Prosecutor Says.” By Erik Eckholm. New York Times, November 24, 2014. <www.nytimes.com>
The task facing the St. Louis County grand jury was not to determine whether Officer Darren Wilson was guilty of a crime, but whether there was evidence to justify bringing charges, which could have ranged from negligent manslaughter to intentional murder.
The fact that at least nine members of the 12-member panel could not agree to indict the officer indicates that they accepted the narrative of self-defense put forth by Officer Wilson in his voluntary, four hours of testimony before the grand jury. Mr. McCulloch, in his summary of the months of testimony, said it was supported by the most reliable eyewitness accounts—from African-Americans in the vicinity of the shooting—as well as physical evidence and the consistent results of three autopsies.
[721] Article: “Fires, Vandalism, Gunfire Follow Grand Jury Decision in Ferguson.” CBS News / Associated Press, November 24, 2014. <www.cbsnews.com>
Protests quickly turned violent in the Ferguson, Missouri area Monday night after it was announced that a St. Louis County grand jury had decided not to indict Ferguson police officer Darren Wilson in the August 9 shooting death of 18-year-old Michael Brown. …
Flames engulfed at least a dozen businesses in Ferguson late Monday and early Tuesday and gunfire kept firefighters at bay once demonstrations turned ugly, despite pleas for peace from Brown’s family and others. …
Protesters smashed windows out of police cars and buildings, several of which were later looted and set ablaze, and officers lobbed tear gas from inside armored vehicles to disperse crowds in scenes reminiscent of the early days of unrest that followed the Aug. 9 shooting.
[722] Article: “Witnesses Told Grand Jury That Michael Brown Charged at Darren Wilson, Prosecutor Says.” By Erik Eckholm. New York Times, November 24, 2014. <www.nytimes.com>
“The United States Department of Justice is conducting a separate investigation of whether Officer Wilson, who is white, intentionally acted to deprive Mr. Brown, an African-American, of his civil rights.”
[723] Webpage: “The Executive Branch.” White House. Accessed July 5, 2021 at <www.whitehouse.gov>
Under Article II of the Constitution, the President is responsible for the execution and enforcement of the laws created by Congress. Fifteen executive departments—each led by an appointed member of the President’s Cabinet—carry out the day-to-day administration of the federal government. …
Department of Justice
The mission of the Department of Justice (DOJ) is to enforce the law and defend the interests of the United States according to the law; to ensure public safety against threats foreign and domestic; to provide federal leadership in preventing and controlling crime; to seek just punishment for those guilty of unlawful behavior; and to ensure fair and impartial administration of justice for all Americans.
[724] “Department of Justice Report Regarding the Criminal Investigation Into the Shooting Death of Michael Brown by Ferguson, Missouri Police Officer Darren Wilson.” U.S. Department of Justice, March 4, 2015. <s3.amazonaws.com>
Because Wilson did not act with the requisite criminal intent, it cannot be proven beyond reasonable doubt to a jury that he violated 18 U.S.C.§ 242 when he fired his weapon at Brown. …
Conclusion
For the reasons set forth above, this matter lacks prosecutive merit and should be closed.
[725] “Department of Justice Report Regarding the Criminal Investigation Into the Shooting Death of Michael Brown by Ferguson, Missouri Police Officer Darren Wilson.” U.S. Department of Justice, March 4, 2015. <s3.amazonaws.com>
Page 8:
Although there are several individuals who have stated that Brown held his hands up in an unambiguous sign of surrender prior to Wilson shooting him dead, their accounts do not support a prosecution of Wilson. As detailed throughout this report, some of those accounts are inaccurate because they are inconsistent with the physical and forensic evidence; some of those accounts are materially inconsistent with that witness’s own prior statements with no explanation, credible for otherwise, as to why those accounts changed over time. Certain other witnesses who originally stated Brown had his hands up in surrender recanted their original accounts, admitting that they did not witness the shooting or parts of it, despite what they initially reported either to federal or local law enforcement or to the media. Prosecutors did not rely on those accounts when making a prosecutive decision.
While credible witnesses gave varying accounts of exactly what Brown was doing with his hands as he moved toward Wilson—i.e., balling them, holding them out, or pulling up his pants up—and varying accounts of how he was moving—i.e., “charging,” moving in “slow motion,” or “running”—they all establish that Brown was moving toward Wilson when Wilson shot him. Although some witnesses state that Brown held his hands up at shoulder level with his palms facing outward for a brief moment, these same witnesses describe Brown then dropping his hands and “charging” at Wilson.
[726] Department of Justice Report Regarding the Criminal Investigation Into the Shooting Death of Michael Brown by Ferguson, Missouri Police Officer Darren Wilson.” U.S. Department of Justice, March 4, 2015. <s3.amazonaws.com>
Page 5:
In order to make the proper assessment under these standards, federal prosecutors evaluated physical, forensic, and potential testimonial evidence in the form of witness accounts. As detailed below, the physical and forensic evidence provided federal prosecutors with a benchmark against which to measure the credibility of each witness account, including that of Darren Wilson. We compared individual witness accounts to the physical and forensic evidence, to other credible witness accounts, and to each witness’s own prior statements made throughout the investigations, including the proceedings before the St. Louis County grand jury (“county grand jury”). We worked with federal and local law enforcement officers to interview witnesses, to include re-interviewing certain witnesses in an effort to evaluate inconsistencies in their accounts and to obtain more detailed information.
Page 7:
Brown ran at least 180 feet away from the SUV [sports utility vehicle], as verified by the location of bloodstains on the roadway, which DNA analysis confirms was Brown’s blood. Brown then turned around and came back toward Wilson, falling to his death approximately 21.6 feet west of the blood in the roadway. Those witness accounts stating that Brown never moved back toward Wilson could not be relied upon in a prosecution because their accounts cannot be reconciled with the DNA bloodstain evidence and other credible witness accounts. …
As detailed throughout this report, several witnesses stated that Brown appeared to pose a physical threat to Wilson as he moved toward Wilson. According to these witnesses, who are corroborated by blood evidence in the roadway, as Brown continued to move toward Wilson, Wilson fired at Brown in what appeared to be self-defense and stopped firing once Brown fell to the ground. Wilson stated that he feared Brown would again assault him because of Brown’s conduct at the SUV and because as Brown moved toward him, Wilson saw Brown reach his right hand under his t-shirt into what appeared to be his waistband. There is no evidence upon which prosecutors can rely to disprove Wilson’s stated subjective belief that he feared for his safety.
Page 21:
Analysis of DNA on Wilson’s gun revealed a major mixture profile that is 2.1 octillion times more likely a mixture of DNA from Wilson and DNA from Brown than from Wilson and anyone else. This is conclusive evidence that Brown’s DNA was on Wilson’s gun.19
Brown is the source of the DNA found in two bloodstains on Canfield Drive, approximately 17 and 22 feet east of where Brown fell to his death, proving that Brown moved forward toward Wilson prior to the fatal shot to his head.
Brown’s DNA was found both on the inside and outside of the driver’s side of the SUV. Brown is the source of DNA in blood found on the exterior of the passenger door of the driver’s side of the SUV. Likewise, a piece of Brown’s skin was recovered from the exterior of the driver’s door of the SUV, consistent with Brown sustaining injury while at that door. Brown is also the source of the major contributor of a DNA mixture found on the interior driver’s door handle of the SUV. A DNA mixture obtained from the top of the exterior of the driver’s door revealed a major mixture profile that is 6.9 million times more likely a mixture of DNA from Wilson and DNA from Brown than from Wilson and anyone else.
Brown’s DNA was found on Wilson’s uniform shirt collar and pants. With respect to the left side of Wilson’s shirt and collar, it is 2.1 trillion times more likely that the recovered DNA mixture is DNA from Wilson and DNA from Brown than from Wilson and anyone else. Similarly, with respect to a DNA mixture obtained from the left side of Wilson’s pants, it is 34 sextillion times more likely that the mixture is DNA from Wilson and DNA from Brown than from Wilson and anyone else. Brown is also the source of the major male profile found in a DNA mixture found in a bloodstain on the upper left thigh of Wilson’s pants.
DNA analysis of Brown’s left palm revealed a DNA mixture with Brown as the major contributor, and Wilson being 98 times more likely the minor contributor than anyone else.
DNA analysis of Brown’s clothes, right hand, fingernails, and clothes excluded Wilson as a possible contributor.
19 While it is possible that Wilson inadvertently transferred Brown’s blood from his own hand to his gun either after the struggle or while packaging his gun (even though Wilson claimed to have already washed his hands), such a possibility is speculative. The autopsy results and bullet trajectory are consistent with Brown’s DNA being present on the gun as a result of the struggle over the gun. Regardless, the absence of Brown’s DNA on Wilson’s gun would not change the prosecutive decision.
Pages 27–36:
1. Witnesses Materially Consistent with Prior Statements, Physical Evidence, and Other Witnesses and Therefore, Give Credible Accounts
i. Witnesses Materially Consistent with Prior Statements, Physical Evidence, and Other Witnesses Who Corroborate That Wilson Acted in Self-Defense
a. Witness 102
Witness 102 is a 27-year-old bi-racial male. Witness 102 gave three statements. First, SLCPD [St. Louis County Police Department] detectives interviewed him; second, FBI agents interviewed him; third, Witness 102 testified before the county grand jury. …
b. Witness 103
Witness 103 is a 58-year-old black male who gave two statements. First, Witness 103 was reluctant to meet with SLCPD detectives, FBI agents, and federal prosecutors because he has no particular allegiance to law enforcement. Witness 103 is a convicted felon who served time in federal prison, and has a son who was shot and injured by law enforcement during the commission of a robbery. Witness 103 expressed concerns because there were signs in the neighborhood of Canfield Drive stating, “snitches get stitches.” Therefore, he agreed to be interviewed only on the condition of confidentiality. Witness 103 later testified before the county grand jury. …
c. Witness 104
Witness 104 is a 26-year-old bi-racial female. Witness 104 gave three statements. SLCPD detectives interviewed her, federal prosecutors and agents interviewed her, and she testified before the county grand jury. …
d. Witness 105
Witness 105 is a 50-year-old black female. She gave two statements. SLCPD detectives interviewed her, and federal prosecutors explained the nature of the two parallel criminal investigations to Witness 105 prior to her testimony before the county grand jury. …
e. Witness 108
Witness 108 is a 74-year-old black male who claimed to have witnessed the shooting, stated that it was justified, but repeatedly refused to give formal statements to law enforcement for fear of reprisal should the Canfield Drive neighborhood find out that his account corroborated Wilson. He was served with a county grand jury subpoena and refused to appear. …
f. Witness 109
Witness 109 is a 53 year-old black male. Like Witness 108, Witness 109 claimed to have witnessed the shooting, stated that it was justified, and repeatedly refused to give formal statements to law enforcement for fear of reprisal should the Canfield Drive neighborhood find out that his account corroborated Wilson. He was served with a county grand jury subpoena and refused to appear. Likewise, Witness 109 repeatedly refused to formally meet with SLCPD detectives, FBI agents, or federal and county prosecutors. …
g. Witness 113
Witness 113 is a 31-year-old black female. She was interviewed one time by FBI agents during their canvass on August 16, 2014, and gave an account that generally corroborated Wilson, but only after she was confronted with untruthful statements she initially made in an effort to avoid neighborhood backlash. When local authorities tried to serve Witness 113 with a subpoena to testify before the county grand jury, she blockaded her door with a couch to avoid service. …
h. Witness 134
Witness 134 is a 36-year-old white female. She was interviewed one time by federal authorities. At the time of her interview with federal agents and prosecutors, she was Wilson’s fiancée and was Wilson’s field training officer in 2011. Prosecutors considered her potential bias when interviewing Witness 134, but sought out and evaluated her account for several reasons. First, as noted below in the legal analysis, to make a determination as to whether a potential civil rights defendant has the requisite criminal intent, prosecutors must consider a subject officer’s training as part of an evaluation of his overall understanding of when the use of deadly force is permissible. Second, Witness 134 spoke to Wilson minutes after the shooting, while he was arguably still under the stress of the situation and immediately after he perceived it. It is possible that in a prosecution of Wilson, defense counsel would be permitted to introduce Wilson’s initial statements to Witness 134 through the “present sense impression” or “excited utterance” hearsay exceptions. Fed. R. Evid. 803(1); 803(2). …
ii. Witnesses Consistent with Prior Statements, Physical Evidence, and Other Witnesses Who Inculpate [Incriminate] Wilson
There are no witnesses who fall under this category.
[727] House Resolution 589: “Establishing the Select Committee on Excessive Use of Police Force.” U.S. House of Representatives, January 13, 2016. <www.congress.gov>
Mr. RUSH (for himself, Mrs. LAWRENCE, Mr. CUMMINGS, Mr. RANGEL, Mr. JOHNSON of Georgia, Mr. BISHOP of Georgia, Mr. CLAY, Mr. LEWIS, Mr.
ELLISON, and Ms. MOORE) submitted the following resolution; which was
referred to the Committee on Rules. …
This past year alone we have seen 7 different incidents of the unjustified use of lethal and excessive force by police officers against African-Americans:
The death of Michael Brown, an 18-year-old unarmed teenager, by a member of the Ferguson Police Department in Missouri on August 9, 2014.
[728] Search for “Michael Brown” Ferguson, date-delimited to January 15–18, 2016. Google News, January 18, 2016. <www.google.com>
The first three pages of results produced the following :
[729] Article: “Poll: Public Broadly Unaware that ‘Hands Up, Don’t Shoot’ was Disproved by Obama Administration.” By James D. Agresti. Just Facts, January 19, 2016. <www.justfactsdaily.com>
[A] recent poll commissioned by Just Facts has found that the vast majority of voters do not know the correct answer to the question: “Did the Obama administration’s investigation of the Ferguson shooting find merit in claims that Michael Brown held up his hands in surrender before he was shot by police officer Darren Wilson?” …
The poll results were obtained through live telephone surveys of 700 likely voters across the continental United States on December 15–20, 2015.
[730] Article: “Poll: Public Broadly Unaware that ‘Hands Up, Don’t Shoot’ was Disproved by Obama Administration.” By James D. Agresti. Just Facts, January 19, 2016. <www.justfactsdaily.com>
The poll reveals that 63% of all voters, 81% of Democratic voters, 42% of Republican voters, and 68% of undecided voters do not know the truth of this matter. These figures include voters who gave the incorrect answer and those who said they did not know the answer. People who gave the incorrect answer included 27% of all voters, 45% of Democratic voters, 12% of Republican voters, and 26% of undecided voters. …
The poll results were obtained through live telephone surveys of 700 likely voters across the continental United States on December 15–20, 2015.
[731] Webpage: “U.S. Census Bureau Current Population.” U.S. Census Bureau, July 21, 2021. <www.census.gov>
World Population
7,777,403,194
Top 10 Most Populous Countries (July 1, 2021)
|
1. China |
1,397,897,720 |
6. Nigeria |
219,463,862 |
|
2. India |
1,339,330,514 |
7. Brazil |
213,445,417 |
|
3. United States |
332,475,723 |
8. Bangladesh |
164,098,818 |
|
4. Indonesia |
275,122,131 |
9. Russia |
142,320,790 |
|
5. Pakistan |
238,181,034 |
10. Mexico |
130,207,371 |
[732] Report: “2019 Crime in the United States.” Federal Bureau of Investigation, Criminal Justice Information Services, September 2020. <ucr.fbi.gov>
Topic: “Murder.” <ucr.fbi.gov>
“In 2019, the estimated number of murders in the nation was 16,425. This was a 0.3 percent increase from the 2018 estimate, a 3.4 percent increase from the 2015 figure, and an 11.6 percent increase from the number in 2010.”
[733] Webpage: “Law Enforcement Facts.” National Law Enforcement Officers Memorial Fund. Accessed July 21, 2021 at <nleomf.org>
“There are more than 800,000 sworn law enforcement officers now serving in the United States, which is the highest figure ever.”
[734] Book: The Challenge of Developing Statistical Literacy, Reasoning and Thinking. Edited by Dani Ben-Zvi and Joan Garfield. Springer, 2004.
Chapter 3: “Statistical Literacy: Meanings, Components, Responsibilities.” By Iddo Gall. Pages 47–78.
Page 59: “Adults should also be aware that public officials, organizations, employers, advertisers, and other players in the public arena need to base claims or conclusions on credible empirical evidence, and that properly produced data can inform public debate and serve as a basis for decisions and allocation of resources, much better than anecdotal evidence (Moore, 1998).”
[735] Textbook: Exploring Psychology, In Modules (8th edition). By David G. Myers. Worth Publishers, 2010.
Pages 19–20:
But sometimes individual cases may mislead us. If the individual being studied is atypical, the unrepresentative information can lead to mistaken judgments and false conclusions. Indeed, anytime a researcher mentions a finding (“Smokers die younger: 95 percent of men over 85 are nonsmokers”) someone is sure to offer a contradictory anecdote (“Well, I have an uncle who smoked two packs a day and lived to be 89”). Dramatic stories and personal experiences (even psychological case examples) command our attention, and they are easily remembered. Which of the following do you find more memorable? (1) “In one study of 1300 dream reports concerning a kidnapped child, only 5 percent correctly envisioned the child as dead (Murray &Wheeler, 1937).” (2) “My friend dreamed his sister was in a car accident, and two days later she died in a head-on collision!” Numbers can be numbing, but the plural of anecdote is not evidence.
The point to remember: Individual cases can suggest fruitful ideas. What’s true of all of us can be glimpsed in any one of us. But to discern the general truths that cover individual cases, we must answer questions with other research methods.
[736] Book: Navigating the News: A Political Media User’s Guide. By Michael K. Baranowski. Praeger, 2013.
Pages 70–71:
People like stories—math and numbers and statistics not so much. Partly, this is because we use language all the time, and so it’s easier for us to grasp stories (at least simple stories) than it is to understand numerical data. But it’s also because numbers, by themselves, generally lack the emotional content that draws us in and helps us to remember. Our preference for stories is why both politicians and the media covering them think in terms of crafting a narrative far more often than they consider analyzing the data (at least for public consumption). …
There are often numbers behind the political stories we’re told, but very few of us bother to take a good hard look at them. One reason for this is that figuring out whether the numbers support a claim isn’t always an easy thing to do. …
What this means is that politicians and pundits can more easily mislead us because they know how difficult it can be to check the numbers. …
But outright lies are problematic because getting caught in one can lead to a lot of negative publicity. A more common way our distaste for numbers is used against us is through data manipulation. Manipulating data isn’t exactly lying—it’s more like finding ways of highlighting things that support your viewpoint. And so the worst you can usually say about someone who does it is that they’re basing their conclusions on questionable assumptions or using an inappropriate method of analysis. This isn’t exactly the sort of stirring denunciation that will grab headlines or make much of an impact on voters.
Our preference for stories over numbers means that we can often be convinced of something by a string of stories, even if they aren’t representative of the whole.
[737] Paper: “Is There Evidence of Racial Disparity in Police Use of Deadly Force? Analyses of Officer-Involved Fatal Shootings in 2015–2016.” By Joseph Cesario, David Johnson, and William Terrill. Social Psychological and Personality Science, June 13, 2018. <journals.sagepub.com>
Page 1: “The most common means of testing for racial disparity in police use of deadly force is to compare the odds of being fatally shot for Blacks to the odds of being fatally shot for Whites [4 citations].”
Page 2:
The problem with benchmarking an outcome against population proportions is that this carries with it a critical assumption: The opportunity for the event to occur is equally likely for every person within each group. …
If this assumption does not hold, then adjusting raw fatal shooting data for overall population values is in error. If different groups are more or less likely to occupy those situations in which police might use deadly force, then a more appropriate benchmark as a means of testing for bias in officer decision making is the number of citizens within each race who occupy those situations during which police are likely to use deadly force. …
… The data are clear that officers do not use deadly force equally across all police–citizen interactions. Deadly force use is strongly tied to crime-related contexts, with the modal police shooting being one in which suspects pose a potentially deadly threat [8 citations]. …
Insofar as Blacks and Whites have different police exposure rates, a more correct benchmark to calculate racial disparity in fatal police shootings is not population proportions but instead rates of police exposure…. In the context of police shootings, exposure would be reasonably approximated by rates of criminal involvement for Blacks and Whites; the more group members are involved in criminal activity, the more exposure they have to situations in which police shootings would be likely to occur. …
We ask whether Blacks or Whites are more likely to be fatally shot when benchmarking fatal police shooting data on three classes of criminal report data from 2015 to 2016: murder/nonnegligent manslaughter, violent crime, and weapons violations. These three categories of crime are the most aggressive in terms of interpersonal violence and, as such, are appropriate proxies for exposure to those situations during which police may be more likely to use deadly force. …
… We estimate criminal activity of Blacks and Whites from four sources: (1) the Federal Bureau of Investigation’s (FBI’s) Summary Report System (SRS), (2) the FBI’s National Incident-Based Reporting System (NIBRS), (3) the Bureau of Justice Statistics’ National Crime Victimization Survey (NCVS), and (4) the Centers for Disease Control’s (CDC) WONDER database.
Page 3:
In sum, in nearly every case, Whites were either more likely to be fatally shot by police or police showed no significant disparity in either direction. Although Blacks have greater odds of being fatally shot given population proportions, Whites overall were more likely to be fatally shot given each group’s involvement in those situations where the police may be more likely to use deadly force.
[738] Ruling: Tennessee v. Garner. U.S. Supreme Court, March 27, 1985. Decided 6–3. Majority: White, Brennan, Marshall, Blackmun, Powell, Stevens. Dissent: O’Connor, Burger, Rehnquist. <caselaw.findlaw.com>
Majority: “This case requires us to determine the constitutionality of the use of deadly force to prevent the escape of an apparently unarmed suspected felon. We conclude that such force may not be used unless it is necessary to prevent the escape and the officer has probable cause to believe that the suspect poses a significant threat of death or serious physical injury to the officer or others.”
[739] Calculated with the dataset: “On-Duty Shootings: Police Officers Charged with Murder or Manslaughter, 2005–2020, Stats by Year.” By Philip M. Stinson and Cloe Wentzlof. Updated September 14, 2020. Sent to Just Facts by Philip M. Stinson.
By my count, since the beginning of 2005, there have been 121 nonfederal sworn law enforcement officers with the general powers of arrest (e.g., police officers, deputy sheriffs, state troopers, etc.) who have been arrested for murder or manslaughter resulting from an on-duty shooting throughout the United States. Of those 121 officers, to date only 44 have been convicted of a crime resulting from the on-duty shooting (17 by guilty plea, 25 by jury trial, and none by convicted by a bench trial). …
Stats by Year: …
44 officers have been convicted of some crime. Here are the number of convicted officers by year (and note that again the “year” is year of arrest, not year of conviction):
2005 = 1
2006 = 5
2007 = 6
2008 = 0
2009 = 3
2010 = 4
2011 = 0
2012 = 3
2013 = 2
2014 = 1
2015 = 8
2016 = 5
2017 = 3
2018 = 2
2019 = 1
2020 = 0
CALCULATION: 44 convictions during 2005–2019 / 15 years = 3 convictions per year
NOTE: This calculation excludes 2020 because data is not yet available for the full year.
[740] Webpage: “Law Enforcement Facts.” National Law Enforcement Officers Memorial Fund. Accessed August 20, 2020 at <nleomf.org>
“There are more than 800,000 sworn law enforcement officers now serving in the United States, which is the highest figure ever.”
[741] Report: “Homicide Trends in the United States, 1980–2008.” By Alexia Cooper and Erica L. Smith. U.S. Department of Justice, Bureau of Justice Statistics, November 2011. <www.bjs.gov>
Page 3:
Blacks were disproportionately represented as both homicide victims and offenders. The victimization rate for blacks (27.8 per 100,000) was 6 times higher than the rate for whites (4.5 per 100,000). The offending rate for blacks (34.4 per 100,000) was almost 8 times higher than the rate for whites (4.5 per 100,000) (table 1). …
Table 1: Victims and offenders, by demographic group, 1980–2008 …
Percent of Offenders … Black [=] 52.5%
Percent of Population … Black [=] 12.6%
Pages 34–35:
Homicide as defined here includes murder and nonnegligent manslaughter, which is the willful killing of one human being by another. The general analyses excluded deaths caused by negligence, suicide, or accident; justifiable homicides; and attempts to murder. Justifiable homicides based on the reports of law enforcement agencies are analyzed separately. Deaths from the terrorist attacks of September 11, 2001, are not included in any of the analyses. These homicide data are based solely on police investigation, as opposed to the determination of a court, medical examiner, coroner, jury, or other judicial body.
Not all agencies that report offense information to the FBI also submit supplemental data on homicides. About 91% of homicides reported in the UCR [Uniform Crime Reports] are included in the SHR [FBI’s Supplementary Homicide Reports]. To account for the total number of homicides, this analysis weighted the total number of homicide victims included in the SHR data to match national and state estimates of the total number of homicide victims prepared by the FBI. All victim-based analyses are adjusted in this manner.
While many agencies report supplemental data on homicides, much of the data concerning offenders may not be reported because no suspects were identified or the agency chose not to report the information. The most significant problem in using SHR data to analyze offender characteristics is the sizable and growing number of homicides in the data file for which no offender information is reported. Ignoring these homicides with no offender information would understate calculated rates of offending by particular subgroups of the population, distort trends over time among these same subgroups, and bias observed patterns of offending to the extent that the rate of missing offender data is associated with offender characteristics.
To adjust for homicides with no offender information, a method for offender imputation was devised that uses available information about murder victims for which corresponding offender information was provided as well as those with missing offender information. Through this imputation algorithm, the demographic characteristics of unidentified offenders were inferred on the basis of similar homicide cases—similar in terms of the victim’s demographic profile, circumstances of the homicide such as felony or argument, location of the homicide (region and urban), gun involvement, and year of the offense—for which offender data were provided. In other words, unknown offender profiles were estimated based on the offender profiles in offender-known cases, matched on victim age, sex, and race; circumstances of the homicide; location of the homicide; gun involvement; and year. Offender-based estimates in this report were imputed using this procedure. Other estimates in this report were based on homicides with known attributes, unless otherwise indicated.
An estimated 30.8% of homicides involved an unknown number of offenders. For these homicides, the offender imputation method conservatively assumed the number of offenders to be one, likely resulting in an undercount of the number of homicides involving multiple offenders.
All rates were calculated using the estimated number of homicide victims or offenders as the numerator and dividing by the U.S. resident population estimates for the appropriate groups or subgroups. This report used bridged-race population estimates developed by the National Center for Health Statistics and the U.S. Census Bureau. All rates were per 100,000 U.S. residents unless otherwise specified.
[742] Calculated with data from the report: “Arrest-Related Deaths, 2003–2009—Statistical Tables.” By Andrea M. Burch. U.S. Department of Justice, Bureau of Justice Statistics, November 2011. <www.bjs.gov>
Page 1:
From 2003 through 2009, a total of 4,813 deaths were reported to the Bureau of Justice Statistics’ (BJS) Arrest-Related Deaths (ARD) program. Of these, about 6 in 10 deaths (2,931) were classified as homicide by law enforcement personnel, and 4 in 10 (1,882) were attributed to other manners of death. Suicide and death by intoxication each accounted for 11% of reported arrest-related deaths, accidental injury for 6%, and natural causes for 5% (figure 1). Deaths with manners classified as undetermined or those in which manners were unknown represented about 6% of reported arrest-related deaths.
During the same period, the FBI estimated nearly 98 million arrests in the United States. While men comprised about 76% of reported arrests, they represented 95% of persons who died during the process of arrest (figure 2). As a group, arrest-related decedents tended to be older than the arrest population. Those under the age of 25 accounted for 45% of reported arrests but less than a quarter (22%) of arrest-related deaths.
The ARD program is a national collection of persons who die in the custody or under the restraint of state or local law enforcement personnel. Deaths are reportable to the program without considering whether physical custody had been established or whether a formal arrest process had been initiated prior to the time of death. The ARD collection also includes the deaths of persons attempting to elude law enforcement during the course of apprehension. Data collected from January 2003 through December 2009 detail the percent and type of arrest-related deaths, as well as the demographic characteristics of decedents and the law enforcement agencies involved in the death.
Arrest-related deaths are under-reported. BJS did not attempt to estimate for partial or non-responding jurisdictions. Data are more representative of the nature of arrest-related deaths than the volume at which they occur. Due to variation in reporting, caution should be used in comparing counts from year to year.
Page 5: “Table 5. Number of reported arrest-related deaths, by manner of death and demographic characteristics, 2003–2009”
NOTE: An Excel file containing the data and calculations is available upon request.
[743] Calculated with the dataset: “On-Duty Shootings: Police Officers Charged with Murder or Manslaughter, 2005–2020, Stats by Year.” By Philip M. Stinson and Cloe Wentzlof. Updated September 14, 2020. Sent to Just Facts by Philip M. Stinson.
Stats by Year:
Here is the breakdown on the number of officers charged with murder or manslaughter resulting from an on-duty shooting. Note that I count the date from the date of arrest/charge (not the shooting date). …
2005 = 2
2006 = 7
2007 = 11
2008 = 4
2009 = 4
2010 = 5
2011 = 1
2012 = 5
2013 = 5
2014 = 6
2015 = 18
2016 = 14
2017 = 7
2018 = 10
2019 = 12
CALCULATIONS:
[744] Calculated with the dataset: “On-Duty Shootings: Police Officers Charged with Murder or Manslaughter, 2005–2020, Stats by Year.” By Philip M. Stinson and Cloe Wentzlof. Updated September 14, 2020. Sent to Just Facts by Philip M. Stinson.
Race Data for Completed Cases:
Non-Black Officers:
37 convicted (victims in these cases: 21 Black, 16 Non-Black)
44 not convicted (victims in these cases: 21 Black, 23 Non-Black)
Black Officers:
7 convicted (victims in these cases: 4 Black, 3 Non-Black)
7 not convicted (All 7 victims were also Black)
Note that there have been 44 officers convicted across these cases. The victims in 25 of those 44 cases were Black.
CALCULATION: (21 + 21 + 4 + 7) / 15 years = 3.5
[745] Calculated with the dataset: “On-Duty Shootings: Police Officers Charged with Murder or Manslaughter, 2005–2020, Stats by Year.” By Philip M. Stinson and Cloe Wentzlof. Updated September 14, 2020. Sent to Just Facts by Philip M. Stinson.
Race Data for Completed Cases:
Non-Black Officers:
37 convicted (victims in these cases: 21 Black, 16 Non-Black)
44 not convicted (victims in these cases: 21 Black, 23 Non-Black)
Black Officers:
7 convicted (victims in these cases: 4 Black, 3 Non-Black)
7 not convicted (All 7 victims were also Black)
Note that there have been 44 officers convicted across these cases. The victims in 25 of those 44 cases were Black.
CALCULATION: (16 + 23 + 3) / 15 years = 2.8
[746] Calculated with the dataset: “On-Duty Shootings: Police Officers Charged with Murder or Manslaughter, 2005–2020, Stats by Year.” By Philip M. Stinson and Cloe Wentzlof. Updated September 14, 2020. Sent to Just Facts by Philip M. Stinson.
In the cases where an officer has been convicted, it is often for a lesser offense. Only 7 officers have been convicted of murder…. As to the other officers, 12 were convicted of manslaughter, 5 were convicted of voluntary manslaughter, 6 were convicted of involuntary manslaughter, 2 were convicted of official misconduct, 2 were convicted of reckless homicide, 3 were convicted of negligent homicide, 5 were convicted of federal criminal deprivation of civil rights (including the four officers whose murder convictions were overturned), one was convicted of aggravated assault, and one was convicted of reckless discharge of a firearm. The 23 officers convicted of manslaughter and the 5 officers convicted of homicide received incarceration sentences that ranged from zero months to 480 months in prison, with an average sentence of 64.5 months in prison.
Out of the 121 officers charged since the beginning of 2005 with murder or manslaughter resulting from an on-duty shooting, the criminal cases have been concluded for 95 of the officers (44 convicted and 51 not convicted).
CALCULATION: (7 murder + 23 manslaughter convictions) / 15 years = 2
[747] Calculated with the dataset: “On-Duty Shootings: Police Officers Charged with Murder or Manslaughter, 2005–2020, Stats by Year.” By Philip M. Stinson and Cloe Wentzlof. Updated September 14, 2020. Sent to Just Facts by Philip M. Stinson.
In the cases where an officer has been convicted, it is often for a lesser offense. Only 7 officers have been convicted of murder…. As to the other officers, 12 were convicted of manslaughter, 5 were convicted of voluntary manslaughter, 6 were convicted of involuntary manslaughter, 2 were convicted of official misconduct, 2 were convicted of reckless homicide, 3 were convicted of negligent homicide, 5 were convicted of federal criminal deprivation of civil rights (including the four officers whose murder convictions were overturned), one was convicted of aggravated assault, and one was convicted of reckless discharge of a firearm. The 23 officers convicted of manslaughter and the 5 officers convicted of homicide received incarceration sentences that ranged from zero months to 480 months in prison, with an average sentence of 64.5 months in prison.
Out of the 121 officers charged since the beginning of 2005 with murder or manslaughter resulting from an on-duty shooting, the criminal cases have been concluded for 95 of the officers (44 convicted and 51 not convicted).
CALCULATION: (44 total convictions – 30 murder or manslaughter convictions) / 15 years = 0.9
[748] Editorial: “The Meaning of the Ferguson Riots.” By the Editorial Board. New York Times, November 25, 2014. <www.nytimes.com>
In this context, the police are justifiably seen as an alien, occupying force that is synonymous with state-sponsored abuse.
The case resonated across the country—in New York City, Chicago and Oakland—because the killing of young black men by police is a common feature of African-American life and a source of dread for black parents from coast to coast. This point was underscored last month in a grim report by ProPublica, showing that young black males in recent years were at a far greater risk—21 times greater—of being shot dead by police than young white men. These statistics reflect the fact that many police officers see black men as expendable figures on the urban landscape, not quite human beings.
[749] Editorial: “The Meaning of the Ferguson Riots.” By the Editorial Board. New York Times, November 25, 2014. <www.nytimes.com>
In this context, the police are justifiably seen as an alien, occupying force that is synonymous with state-sponsored abuse.
The case resonated across the country—in New York City, Chicago and Oakland—because the killing of young black men by police is a common feature of African-American life and a source of dread for black parents from coast to coast. This point was underscored last month in a grim report by ProPublica, showing that young black males in recent years were at a far greater risk—21 times greater—of being shot dead by police than young white men. These statistics reflect the fact that many police officers see black men as expendable figures on the urban landscape, not quite human beings.
[750] Article: “Answering the Critics of Our Deadly Force Story.” By Ryan Gabrielson and Ryann Grochowski Jones. ProPublica, December 24, 2014. <www.propublica.org>
ProPublica’s analysis of justified homicides by police officers, published October 10th, has been widely read and often cited in the national conversation on the use of force by law enforcement. Most often, press reports and people on social media have highlighted our finding that from 2010 to 2012, African-American teenage men age 15–19 were at 21 times as great a risk of being killed by police officers as white teenage men. …
As a final note, many have pointed to our reporting as proof of police bias. That overstates our case; ProPublica found evidence of a disparity in the risks faced by young black and white men. This does not prove that police officers target any age or racial group – the data is far too limited to point to a cause for the disparity. We hoped that our analysis would spur further inquiry into why this disparity exists, which it has done, and we stand by it.
[751] Paper: “Is There Evidence of Racial Disparity in Police Use of Deadly Force? Analyses of Officer-Involved Fatal Shootings in 2015–2016.” By Joseph Cesario, David Johnson, and William Terrill. Social Psychological and Personality Science, June 13, 2018. <journals.sagepub.com>
Page 1: “The most common means of testing for racial disparity in police use of deadly force is to compare the odds of being fatally shot for Blacks to the odds of being fatally shot for Whites [4 citations].”
Page 2:
The problem with benchmarking an outcome against population proportions is that this carries with it a critical assumption: The opportunity for the event to occur is equally likely for every person within each group. …
If this assumption does not hold, then adjusting raw fatal shooting data for overall population values is in error. If different groups are more or less likely to occupy those situations in which police might use deadly force, then a more appropriate benchmark as a means of testing for bias in officer decision making is the number of citizens within each race who occupy those situations during which police are likely to use deadly force. …
… The data are clear that officers do not use deadly force equally across all police–citizen interactions. Deadly force use is strongly tied to crime-related contexts, with the modal police shooting being one in which suspects pose a potentially deadly threat [8 citations]. …
Insofar as Blacks and Whites have different police exposure rates, a more correct benchmark to calculate racial disparity in fatal police shootings is not population proportions but instead rates of police exposure…. In the context of police shootings, exposure would be reasonably approximated by rates of criminal involvement for Blacks and Whites; the more group members are involved in criminal activity, the more exposure they have to situations in which police shootings would be likely to occur. …
We ask whether Blacks or Whites are more likely to be fatally shot when benchmarking fatal police shooting data on three classes of criminal report data from 2015 to 2016: murder/nonnegligent manslaughter, violent crime, and weapons violations. These three categories of crime are the most aggressive in terms of interpersonal violence and, as such, are appropriate proxies for exposure to those situations during which police may be more likely to use deadly force. …
… We estimate criminal activity of Blacks and Whites from four sources: (1) the Federal Bureau of Investigation’s (FBI’s) Summary Report System (SRS), (2) the FBI’s National Incident-Based Reporting System (NIBRS), (3) the Bureau of Justice Statistics’ National Crime Victimization Survey (NCVS), and (4) the Centers for Disease Control’s (CDC) WONDER database.
Page 3:
In sum, in nearly every case, Whites were either more likely to be fatally shot by police or police showed no significant disparity in either direction. Although Blacks have greater odds of being fatally shot given population proportions, Whites overall were more likely to be fatally shot given each group’s involvement in those situations where the police may be more likely to use deadly force.
[752] Report: “Homicide Trends in the United States, 1980–2008.” By Alexia Cooper and Erica L. Smith. U.S. Department of Justice, Bureau of Justice Statistics, November 2011. <www.bjs.gov>
Page 3: “Percent of [Homicide] Offenders … Black [=] 52.5%”
NOTE: Compare the 52.5% figure in this footnote (for the portion of murders committed by blacks) with the 31.7% figure in the next footnote (for the portion of people killed by police who are black).
[753] Calculated with data from the report: “Arrest-Related Deaths, 2003–2009—Statistical Tables.” By Andrea M. Burch. U.S. Department of Justice, Bureau of Justice Statistics, November 2011. <www.bjs.gov>
Page 6: “Table 6. Percent of reported arrest-related deaths, by manner of death and demographic characteristics, 2003–2009 … Homicide … Black, non-Hispanic = 31.7%”
[754] Article: “Aren’t More White People Than Black People Killed By Police? Yes, But No.” By Wesley Lowery. Washington Post, July 11, 2016. <www.washingtonpost.com>
In response to these statistics, critics of police reform—often political conservatives and police unions—typically argue that the reason more black men and women are shot and killed by police is that black Americans commit more violent crime.
Despite these arguments, police reform advocates and researchers as well at The Post’s own analysis has consistently concluded that there is no correlation between violent crime and who is killed by police officers.
[755] Article: “Aren’t More White People Than Black People Killed By Police? Yes, But No.” By Wesley Lowery. Washington Post, July 11, 2016. <www.washingtonpost.com>
In response to these statistics, critics of police reform—often political conservatives and police unions—typically argue that the reason more black men and women are shot and killed by police is that black Americans commit more violent crime.
Despite these arguments, police reform advocates and researchers as well at The Post’s own analysis has consistently concluded that there is no correlation between violent crime and who is killed by police officers.
NOTE: After the text above, Lowery lists the following four studies. Just Facts examined all of them, and none of them looked for correlations between murder, race, and police use of deadly force:
[756] Calculated with the dataset: “Annual Estimates of the Resident Population by Sex, Race, and Hispanic Origin for the United States, States: April 1, 2010 to July 1, 2019.” U.S. Census Bureau, June 2020. <www2.census.gov>
“Population Estimate (as of July 1) … 2016 … Total Population [=] 322,941,311 … Black or African American [=] 42,970,183”
CALCULATION: 42,970,183 / 322,941,311 = 13%
[757] Dataset: “Percent of Single-Offender Violent Victimizations, By Type of Crime, Race/Hispanic Origin of Victim, and Perceived Race/Hispanic Origin of Offender, 2012–2014, National Crime Victimization Survey.” U.S. Department of Justice, Bureau of Justice Statistics, July 2016.
Violent victimizations … Black [=] 23% …
Completed violence … Black [=] 21% …
Attempted/threatened violence … Black [=] 25%
NOTES:
[758] Paper: “The Lethality of Criminal Assault 1960–1999.” By Anthony R. Harris and others. Homicide Studies, May 1, 2002. Pages 128–166. <www.universitychurchchicago.org>
Page 139:
One, despite its many uses in measuring crimes unknown to the police, NCS/NCVS [National Crime Victimization Survey] has been widely recognized as having continuously undersampled high-risk-for-crime groups, ranging from the Black underclass, to families that recompose and/or move frequently, to prisoners, to the homeless, and to other hard-to- reach populations. For example, in a study of 26 U.S. cities, O’Brien (1983) found that whereas urban percentage African American is positively correlated at .47 with UCR assault rates and .43 for UCR rape rates, it is negatively correlated at –.45 with NCVS assault rates and –.26 with NCVS rape rates. Slightly weaker but parallel findings occur when percentage poor was used by O’Brien instead of percentage African American (see also Reiss and Roth’s extensive 1993 critical review for the National Research Council).
[759] Report: “Homicide Trends in the United States, 1980–2008.” By Alexia Cooper and Erica L. Smith. U.S. Department of Justice, Bureau of Justice Statistics, November 2011. <www.bjs.gov>
Page 3:
Blacks were disproportionately represented as both homicide victims and offenders. The victimization rate for blacks (27.8 per 100,000) was 6 times higher than the rate for whites (4.5 per 100,000). The offending rate for blacks (34.4 per 100,000) was almost 8 times higher than the rate for whites (4.5 per 100,000) (table 1). …
Table 1: Victims and offenders, by demographic group, 1980–2008 …
Percent of Offenders … Black [=] 52.5%
Percent of Population … Black [=] 12.6%
Pages 34–35:
Homicide as defined here includes murder and nonnegligent manslaughter, which is the willful killing of one human being by another. The general analyses excluded deaths caused by negligence, suicide, or accident; justifiable homicides; and attempts to murder. Justifiable homicides based on the reports of law enforcement agencies are analyzed separately. Deaths from the terrorist attacks of September 11, 2001, are not included in any of the analyses. These homicide data are based solely on police investigation, as opposed to the determination of a court, medical examiner, coroner, jury, or other judicial body.
Not all agencies that report offense information to the FBI also submit supplemental data on homicides. About 91% of homicides reported in the UCR [Uniform Crime Report] are included in the SHR [FBI’s Supplementary Homicide Reports]. To account for the total number of homicides, this analysis weighted the total number of homicide victims included in the SHR data to match national and state estimates of the total number of homicide victims prepared by the FBI. All victim-based analyses are adjusted in this manner.
While many agencies report supplemental data on homicides, much of the data concerning offenders may not be reported because no suspects were identified or the agency chose not to report the information. The most significant problem in using SHR data to analyze offender characteristics is the sizable and growing number of homicides in the data file for which no offender information is reported. Ignoring these homicides with no offender information would understate calculated rates of offending by particular subgroups of the population, distort trends over time among these same subgroups, and bias observed patterns of offending to the extent that the rate of missing offender data is associated with offender characteristics.
To adjust for homicides with no offender information, a method for offender imputation was devised that uses available information about murder victims for which corresponding offender information was provided as well as those with missing offender information. Through this imputation algorithm, the demographic characteristics of unidentified offenders were inferred on the basis of similar homicide cases—similar in terms of the victim’s demographic profile, circumstances of the homicide such as felony or argument, location of the homicide (region and urban), gun involvement, and year of the offense—for which offender data were provided. In other words, unknown offender profiles were estimated based on the offender profiles in offender-known cases, matched on victim age, sex, and race; circumstances of the homicide; location of the homicide; gun involvement; and year. Offender-based estimates in this report were imputed using this procedure. Other estimates in this report were based on homicides with known attributes, unless otherwise indicated.
An estimated 30.8% of homicides involved an unknown number of offenders. For these homicides, the offender imputation method conservatively assumed the number of offenders to be one, likely resulting in an undercount of the number of homicides involving multiple offenders.
All rates were calculated using the estimated number of homicide victims or offenders as the numerator and dividing by the U.S. resident population estimates for the appropriate groups or subgroups. This report used bridged-race population estimates developed by the National Center for Health Statistics and the U.S. Census Bureau. All rates were per 100,000 U.S. residents unless otherwise specified.
[760] Calculated with data from the report: “Arrest-Related Deaths, 2003–2009—Statistical Tables.” By Andrea M. Burch. U.S. Department of Justice, Bureau of Justice Statistics, November 2011. <www.bjs.gov>
Page 1:
From 2003 through 2009, a total of 4,813 deaths were reported to the Bureau of Justice Statistics’ (BJS) Arrest-Related Deaths (ARD) program. Of these, about 6 in 10 deaths (2,931) were classified as homicide by law enforcement personnel, and 4 in 10 (1,882) were attributed to other manners of death. Suicide and death by intoxication each accounted for 11% of reported arrest-related deaths, accidental injury for 6%, and natural causes for 5% (figure 1). Deaths with manners classified as undetermined or those in which manners were unknown represented about 6% of reported arrest-related deaths.
During the same period, the FBI estimated nearly 98 million arrests in the United States. While men comprised about 76% of reported arrests, they represented 95% of persons who died during the process of arrest (figure 2). As a group, arrest-related decedents tended to be older than the arrest population. Those under the age of 25 accounted for 45% of reported arrests but less than a quarter (22%) of arrest-related deaths.
The ARD program is a national collection of persons who die in the custody or under the restraint of state or local law enforcement personnel. Deaths are reportable to the program without considering whether physical custody had been established or whether a formal arrest process had been initiated prior to the time of death. The ARD collection also includes the deaths of persons attempting to elude law enforcement during the course of apprehension. Data collected from January 2003 through December 2009 detail the percent and type of arrest-related deaths, as well as the demographic characteristics of decedents and the law enforcement agencies involved in the death.
Arrest-related deaths are under-reported. BJS did not attempt to estimate for partial or non-responding jurisdictions. Data are more representative of the nature of arrest-related deaths than the volume at which they occur. Due to variation in reporting, caution should be used in comparing counts from year to year.
Page 5: “Table 5. Number of reported arrest-related deaths, by manner of death and demographic characteristics, 2003–2009”
NOTE: An Excel file containing the data and calculations is available upon request.
[761] Article: “Aren’t More White People Than Black People Killed By Police? Yes, But No.” By Wesley Lowery. Washington Post, July 11, 2016. <www.washingtonpost.com>
In response to these statistics, critics of police reform—often political conservatives and police unions—typically argue that the reason more black men and women are shot and killed by police is that black Americans commit more violent crime.
Despite these arguments, police reform advocates and researchers as well at The Post’s own analysis has consistently concluded that there is no correlation between violent crime and who is killed by police officers. …
A report released last week by the Center for Policing Equity, which reviewed arrest and use-of-force data from 12 police departments, concluded that black residents were more often targeted for use of police force than white residents, even when adjusting for whether the person was a violent criminal.†
NOTE: † Report: “The Science of Justice: Race, Arrests, and Police Use of Force.” By Phillip Atiba Goff (Ph.D.) and others. Center for Policing Equity, July 2016. <policingequity.org>
[762] Report: “The Science of Justice: Race, Arrests, and Police Use of Force.” By Phillip Atiba Goff (Ph.D.) and others. Center for Policing Equity, July 2016. <policingequity.org>
Page 20:
Table 6. Use of Force Rates per 1,000 Arrests*, by Severity and Citizen Race
Sample: 8 to 11 Department-Years
|
Black |
White |
N |
|
|
Mean |
Mean |
||
|
Lethal |
0.37 |
0.64 |
8 |
|
Less Lethal and Taser |
6.64 |
4.46 |
11 |
|
Canine |
0.67 |
0.64 |
11 |
|
Weapon |
0.34 |
0.19 |
10 |
|
OC Spray |
3.34 |
1.82 |
11 |
|
Hands and Body |
36.88 |
30.39 |
11 |
* Arrest data were obtained from BJS [Bureau of Justice Statistics] and include arrests for all offenses.
Table 7. Use of Force Rates per 1,000 Arrests for Violent Offenses*, by Severity and Citizen Race
Sample: Maximum of 11 Department-Years
|
Black |
White |
N |
|
|
Mean |
Mean |
||
|
Lethal |
6.92 |
16.70 |
8 |
|
Less Lethal and Taser |
122.71 |
133.05 |
11 |
|
Canine |
10.87 |
15.90 |
11 |
|
Weapon |
5.30 |
4.76 |
10 |
|
OC Spray |
53.47 |
41.86 |
11 |
|
Hands and Body |
564.69 |
850.27 |
11 |
* Arrest data were obtained from BJS and include arrests for Part I violent crimes only.
CALCULATIONS:
[763] “Uniform Crime Report: Crime in the United States, 2016: Offense Definitions.” Federal Bureau of Investigation, Fall 2017. <ucr.fbi.gov>
The Uniform Crime Reporting (UCR) Program divides offenses into two groups, Part I and Part II crimes, in its Summary Reporting System. Each month, participating law enforcement agencies submit information on the number of Part I offenses that become known to them; those offenses cleared by arrest or exceptional means; and the age, sex, and race of persons arrested for each of the offenses. Contributors provide only arrest data for Part II offenses.
The UCR Program collects data about Part I offenses in order to measure the level and scope of crime occurring throughout the nation. The program’s founders chose these offenses because they are serious crimes, they occur with regularity in all areas of the country, and they are likely to be reported to the police. The Part I offenses are:
Criminal homicide …
Rape …
Robbery …
Aggravated assault …
Burglary (breaking or entering) …
Larceny-theft (except motor vehicle theft) …
Motor vehicle theft …
Arson …
Human Trafficking, Commercial Sex Acts …
Human Trafficking, Involuntary Servitude
[764] Article: “Aren’t More White People Than Black People Killed By Police? Yes, But No.” By Wesley Lowery. Washington Post, July 11, 2016. <www.washingtonpost.com>
“A 2015 study by a University of California at Davis researcher concluded there was ‘no relationship’ between crime rates by race and racial bias in police killings.”†
NOTE: † Paper: “A Multi-Level Bayesian Analysis of Racial Bias in Police Shootings at the County-Level in the United States, 2011–2014.” By Cody T. Ross. PLoS ONE, November 5, 2015. <journals.plos.org>
[765] Article: “Roland Fryer Answers Reader Questions About His Police Force Study.” By Amanda Cox. New York Times, July 12, 2016. <www.nytimes.com>
Many readers asked about previous studies, in particular a paper published in PLOS ONE by Cody T. Ross. That paper, “A Multi-Level Bayesian Analysis of Racial Bias in Police Shootings at the County-Level in the United States, 2011–2014,” found that the chance of being black, unarmed and shot by the police was about 3.5 times the chance of being white, unarmed and shot by the police. It was based on a crowdsourced data set, the U.S. Police-Shooting Database [USPSD], that includes some nonfatal shootings. (About two-thirds of the shootings in Mr. Fryer’s data set were nonfatal.)
The USPSD covers the entire country, but it is not comprehensive. It has information from a variety of departments on 16 civilians shot by the police in Houston and other parts of Harris County, Tex., from 2011 to 2014. Mr. Fryer’s data shows 177 shootings by the Houston Police Department in those years.
The questions the papers asked were different, particularly in Houston. As Mr. Ross wrote, “The USPSD does not have information on encounter rates between police and subjects according to ethnicity. As such, the data cannot speak to the relative risk of being shot by a police officer conditional on being encountered by police.”
[766] Article: “Aren’t More White People Than Black People Killed By Police? Yes, But No.” By Wesley Lowery. Washington Post, July 11, 2016. <www.washingtonpost.com>
A 2015 study by a University of California at Davis researcher concluded there was “no relationship” between crime rates by race and racial bias in police killings.† A report released last week by the Center for Policing Equity, which reviewed arrest and use-of-force data from 12 police departments, concluded that black residents were more often targeted for use of police force than white residents, even when adjusting for whether the person was a violent criminal.‡ …
In a report covering 2015 data, Campaign Zero compared violent rates of 50 major cities to the rate at which police officers killed people, concluding that there was no correlation.§
Notes:
[767] Paper: “Race, Crime, and the Micro-Ecology of Deadly Force.” By David Klinger and others. Criminology and Public Policy, November 17, 2015. Pages 193–222. <thecrimereport.s3.amazonaws.com>
Pages 197–198:
Another limitation in the studies that have used states and cities as units of analysis to examine the determinants of deadly force by police officers is that these large spatial aggregations mask substantial heterogeneity within the units, especially at the state level. Sorensen and others (1993) and Jacobs and O’Brien (1998) both cited the possible aggregation bias resulting from the use of states as units of analysis as one reason they examined cities in their analyses of deadly force. But they noted that even cities are suboptimal and suggested that within-city spatial aggregates would be superior units of analysis for empirically assessing the determinants of deadly force. The only published study of this kind is Fyfe’s (1980) investigation of the link between crime levels and officer-involved shootings across 20 patrol zones of the New York City Police Department for the years 1971–1975. He included all shootings in which officers intentionally fired at suspects, regardless of whether they killed, injured, or missed suspects, thus avoiding the conceptual pitfall of restricting his analysis to fatal shootings. Fyfe found a positive relationship between crime levels and police shootings, but he looked only at the relationship between crime and shootings, ignoring the possible influence of the racial composition of the patrol areas on shootings and other possible confounds of the observed crime-shooting relationship.
In addition, with an average population of approximately 400,000 residents, the within-city spatial aggregates Fyfe (1980) used are still large and heterogeneous; they hardly qualify as “neighborhoods,” even in New York City. This is important because research has clearly established that urban neighborhoods exhibit substantial variation in crime, demographic composition, and socioeconomic status (Bursik and Grasmick, 1993; Peterson and Krivo, 2012; Sampson, 2012).
[768] Paper: “Is There Evidence of Racial Disparity in Police Use of Deadly Force? Analyses of Officer-Involved Fatal Shootings in 2015–2016.” By Joseph Cesario, David Johnson, and William Terrill. Social Psychological and Personality Science, June 13, 2018. <journals.sagepub.com>
Page 8: “In the perfect world, we would be able to benchmark police shooting data on crime data at the neighborhood or district level. Although it is possible to locate fatal police shootings at these lower levels, it is not possible to isolate criminal activity at those levels across the United States.”
[769] Paper: “Race, Crime, and the Micro-Ecology of Deadly Force.” By David Klinger and others. Criminology and Public Policy, November 17, 2015. Pages 193–222. <thecrimereport.s3.amazonaws.com>
Page 193:
Limitations in data and research on the use of firearms by police officers in the United States preclude sound understanding of the determinants of deadly force in police work. The current study addresses these limitations with detailed case attributes and a microspatial analysis of police shootings in St. Louis, MO, between 2003 and 2012. The results indicate that neither the racial composition of neighborhoods nor their level of economic disadvantage directly increase the frequency of police shootings, whereas levels of violent crime do—but only to a point. Police shootings are less frequent in areas with the highest levels of criminal violence than in those with midlevels of violence.
Pages 197–198:
Another limitation in the studies that have used states and cities as units of analysis to examine the determinants of deadly force by police officers is that these large spatial aggregations mask substantial heterogeneity within the units, especially at the state level. Sorensen and others (1993) and Jacobs and O’Brien (1998) both cited the possible aggregation bias resulting from the use of states as units of analysis as one reason they examined cities in their analyses of deadly force. But they noted that even cities are suboptimal and suggested that within-city spatial aggregates would be superior units of analysis for empirically assessing the determinants of deadly force. The only published study of this kind is Fyfe’s (1980) investigation of the link between crime levels and officer-involved shootings across 20 patrol zones of the New York City Police Department for the years 1971–1975. He included all shootings in which officers intentionally fired at suspects, regardless of whether they killed, injured, or missed suspects, thus avoiding the conceptual pitfall of restricting his analysis to fatal shootings. Fyfe found a positive relationship between crime levels and police shootings, but he looked only at the relationship between crime and shootings, ignoring the possible influence of the racial composition of the patrol areas on shootings and other possible confounds of the observed crime-shooting relationship.
In addition, with an average population of approximately 400,000 residents, the within-city spatial aggregates Fyfe (1980) used are still large and heterogeneous; they hardly qualify as “neighborhoods,” even in New York City. This is important because research has clearly established that urban neighborhoods exhibit substantial variation in crime, demographic composition, and socioeconomic status (Bursik and Grasmick, 1993; Peterson and Krivo, 2012; Sampson, 2012).
[770] Book: George Washington Carver: The Man Who Overcame. By Lawrence Elliot. Prentice-Hall, 1966.
[771] Book: George Washington Carver: In His Own Words. Edited by Gary Kremer. University of Missouri Press, 1987.
[772] Article: “Crossing the Line.” By Ben Nightengale. Delta Tau Delta Rainbow, Spring 1997.
[773] Article: “Rickey, Branch.” Microsoft Encarta Encyclopedia, 1999.
[774] Article: “Robinson, Jackie.” Microsoft Encarta Encyclopedia, 1999.
[775] Commentary by Charles W. Colson. BreakPoint Radio Show, April 15, 1999.
[776] Article: “Wilberforce, William.” Microsoft Encarta Encyclopedia, 1999.
[777] Article: “The Japanese-American Purple Heart Division.” By Daniel Ruddy. Newsmax, May 27, 2000.
[778] Article: “Civil Rights Law and History, Japanese American Internment.” U.S. Department of Justice. Accessed December 1, 2017 at <archive.li>
[779] Article: “Unlikely World War II Soldiers Awarded Nation’s Highest Honor.” By Barbara Maranzani. History.com, November 3, 2011. <www.history.com>