Please wait as we load hundreds of rigorously documented facts for you.
Please wait as we load hundreds of rigorously documented facts for you.

For example:

* “Energy,” as defined by the Oxford Dictionary of Biochemistry and Molecular Biology, is “the capacity of a system for doing work.”[1] [2] [3]
* Energy can take varying forms, such as thermal, electrical, mechanical, nuclear, chemical, gravitational, acoustic, and electromagnetic.[4]
* Two common measures of energy are British thermal units (Btu) and joules. All forms of energy can be expressed in these units. One Btu is the amount of energy needed to raise the temperature of one pound of water from 39 to 40 degrees Fahrenheit.[5] One joule is the amount of energy needed to lift one hundred grams (3.5 ounces) upward by one meter (3.3 feet) while on the surface of the earth.[6]
* As a consequence of the First Law of Thermodynamics, energy and matter cannot be created or destroyed; they can only be transformed from one form into another.[7] [8] [9] [10]
* As a consequence of the Second Law of Thermodynamics, when energy is transformed from one form to another, some of it disperses, thus making it less useful for performing work.[11] [12] [13] [14]
* Humans have learned to harness energy to accomplish tasks such as transporting people and products, heating and cooling homes, farming, cooking, manufacturing goods, communicating across vast distances, and generating light.[15]
* The average annual energy consumption in the U.S. is 293,000,000 Btu per person. To generate this amount of energy through physical human effort (like pedaling bicycles to drive generators) would require 197 people working nonstop for a year.[16]
* “Embodied energy” refers to the energy used in making materials. For example, to make a common clay brick weighing 5 pounds requires about 5,386 Btu of energy. The materials of a typical house embody about 850 million Btu, which is equivalent to the energy that would be generated by 573 people pedaling bicycles nonstop for a year.[17]
* In 2020, energy expenditures in the U.S. were $1.0 trillion ($1,007,433,000,000).[18] This amounts to:

* The costs of most products are affected by the costs of energy, even products with low embodied energies, because the costs of energy affect the costs of transporting products. Since energy costs influence the costs of products, higher energy costs tend to drive up unemployment, drive down wages, and cause other negative economic effects. Such consequences tend to be harsher in poorer nations.[23] [24] [25]
* Roughly one third of the world’s population does not have access to modern forms of energy.[26] [27] In these areas, people use biomass (primarily wood) for about 80% of their energy, and women and children spend an average of 9–12 hours a week collecting firewood. Per the Institute for Plasma Physics in the Netherlands:
* Higher energy costs drive up the costs of food.[31] This has greater impacts on poorer nations and individuals because they spend a larger portion of their income on food.[32] [33] In Haiti during 2007 and 2008, higher energy prices contributed to increased food prices, driving Haiti’s poorer people to obtain nourishment from cookies made of mud.[34]
* Per the Congressional Research Service, “The economic well-being and economic security of the nation depends on having stable energy sources.”[35]
* Per the U.S. Government Accountability Office, “Americans’ daily lives, as well as the economic productivity of the United States, depend on the availability of energy….”[36]
* Per the World Bank:
* Per the textbook Introduction to Air Pollution Science, “The availability of affordable electric power is essential for public health and economic prosperity.”[38]
* Per the U.S. Energy Information Administration:
* Per the textbook Microeconomics for Today, countries with slower economic growth “are less able to satisfy basic needs for food, shelter, clothing, education, and health.”[41]
* In order to perform useful work, energy usually must be converted from one form to another. Most energy on earth ultimately comes from the sun, and this energy typically undergoes multiple conversions before it is used to accomplish a particular task. For example, the energy that ultimately powers a light bulb may have the following history:
* With each conversion process, some amount of the energy is dispersed, thus making it less useful for performing work. Per the U.S. National Academy of Sciences:
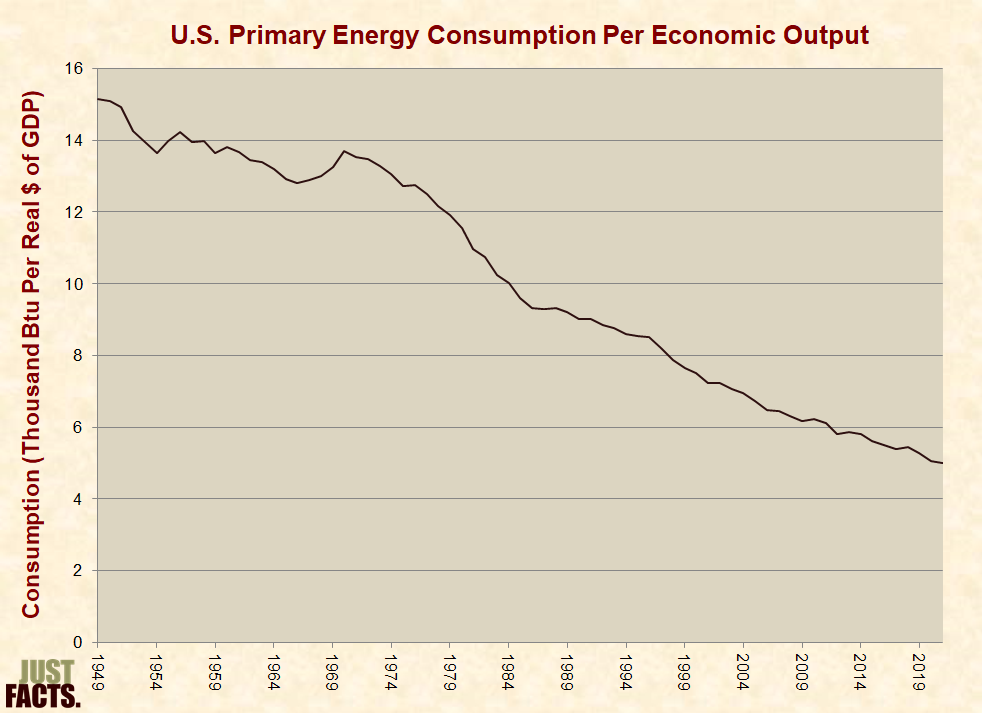
* In the U.S. from 1949 to 2021, energy consumption per inflation-adjusted dollar of economic output decreased by 67%:
* Homes built in the U.S. from 2000 to 2015 are about 25% larger than homes built prior to this period, but they use about 2% more total energy. This result is primarily due to better insulation and increased efficiencies of heating and air conditioning technologies.[49] [50]
* Homes built in the U.S. from 2000 to 2015 use about 23% more energy on appliances, electronics, and lighting than older homes. This is because newer homes are more likely to have “dishwashers, clothes washers, clothes dryers, and two or more refrigerators.” Also, because they have more square footage, newer homes tend to have more “computers, TVs, and TV peripherals such as digital video recorders (DVRs) and video game systems.”[51] [52]
* Increasing the efficiency of electronics, appliances, and lighting reduce the demand for energy and can save consumers money if the added cost of making these products more efficient does not exceed the cost of the energy saved.[53] [54]
* Energy Star is a joint program of the U.S. Environmental Protection Agency (EPA) and Department of Energy. Per the program’s website:
* In 2010, the U.S. Government Accountability Office (GAO) published an investigation of Energy Star in which GAO submitted 20 “bogus products” for approval. Fifteen of the products were approved, two were rejected, and three were unanswered at the time the report was published. Among the products certified as Energy Star compliant were:

* The U.S. Green Building Council, per its website, is a “nonprofit organization committed to a prosperous and sustainable future for our nation through cost-efficient and energy-saving green buildings.”[57] This organization provides various types of green building certifications that qualify the owners for government incentives, such as tax breaks and zoning allowances. This rating system is named LEED for “Leadership in Energy and Environmental Design.”[58]
* In 2012, USA Today conducted an investigation of schools with green building certifications (such as LEED) and found that:
* In 1989, Gus Speth, president of environmentalist organization World Resources Institute, stated:
* As of 2022, the Mitsubishi Mirage is the most fuel-efficient non-hybrid car. It travels 39 miles per gallon of gasoline, has a 78-horsepower engine, and weighs about 2,100 pounds.[61] [62]
* Per the U.S. National Academy of Sciences:
* During 2023:
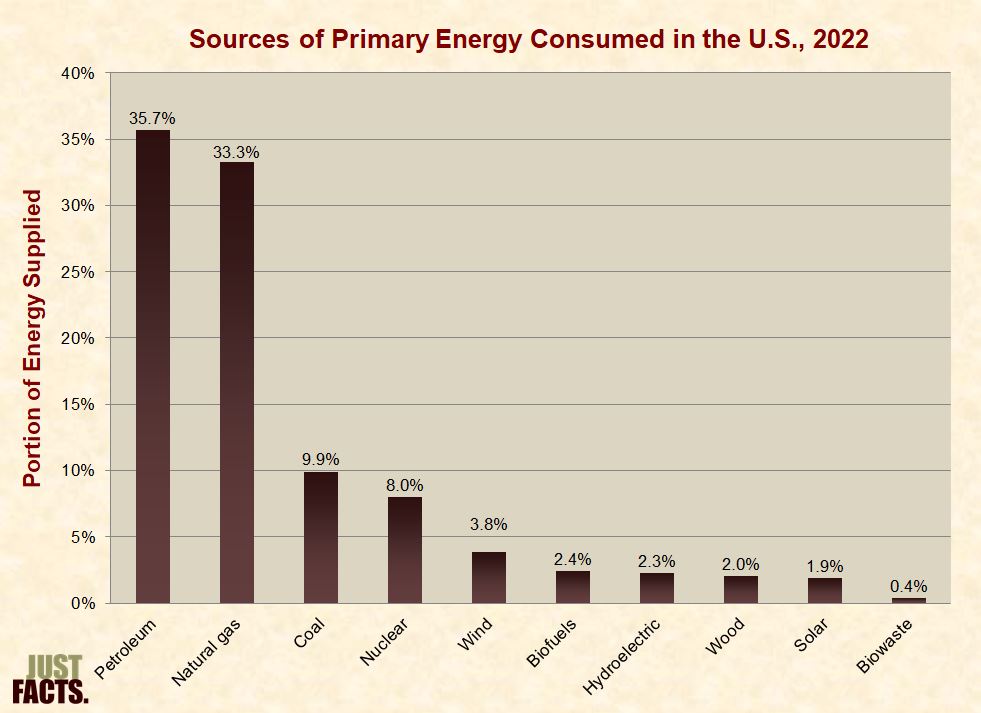
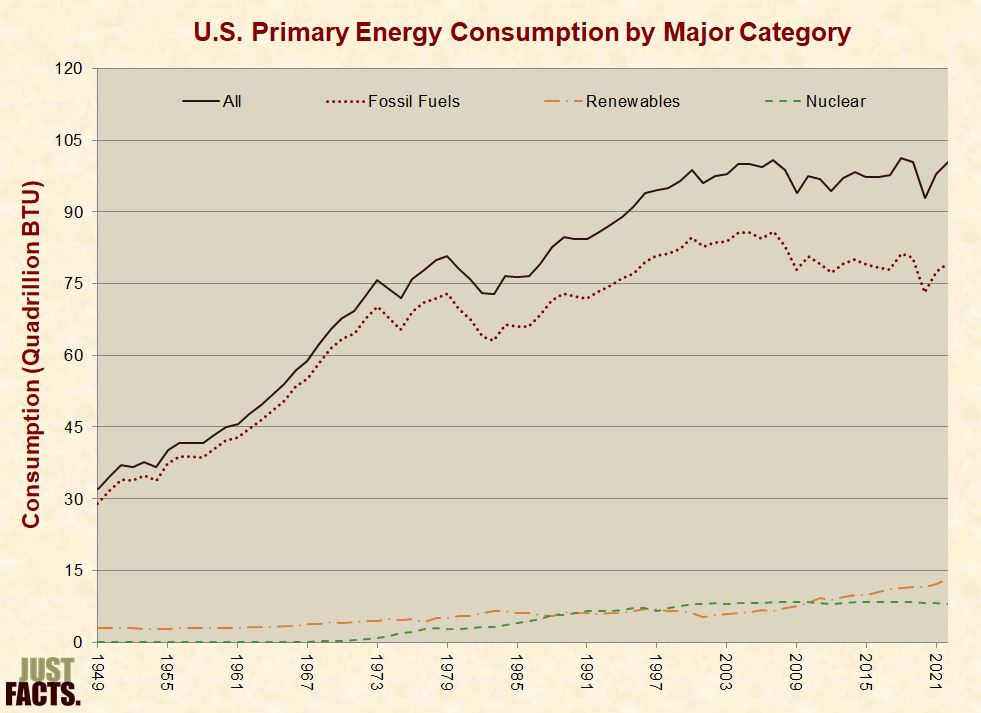
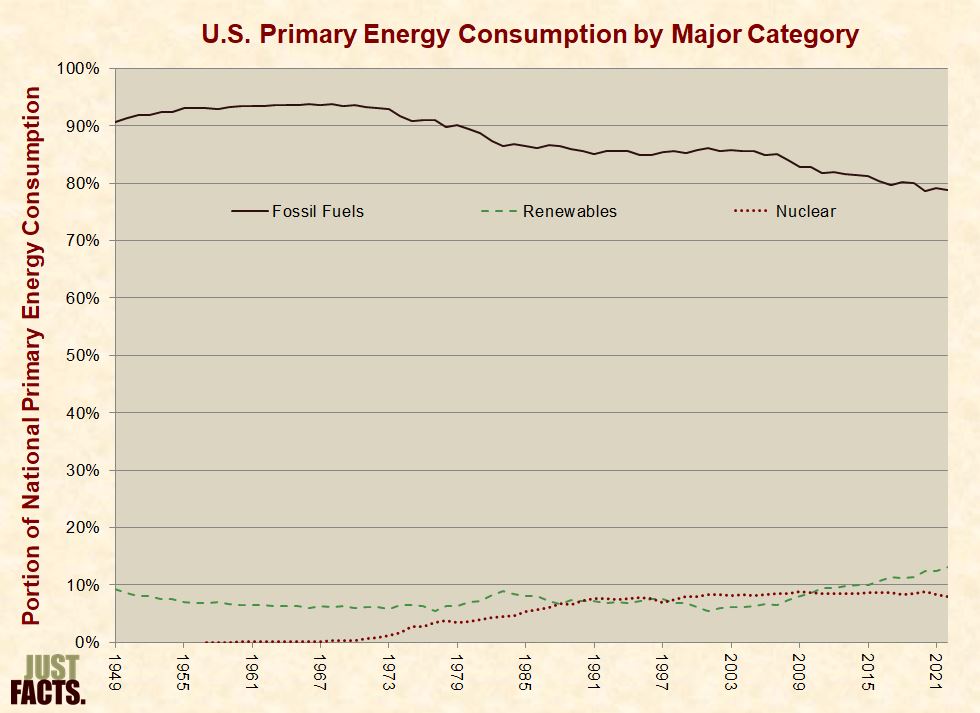
* The following charts show the components of U.S. energy consumption over time. The first shows consumption measured in Btus. The rest show consumption measured as a portion of total U.S. energy consumption. Each succeeding chart uses a smaller scale to provide increasing resolution.
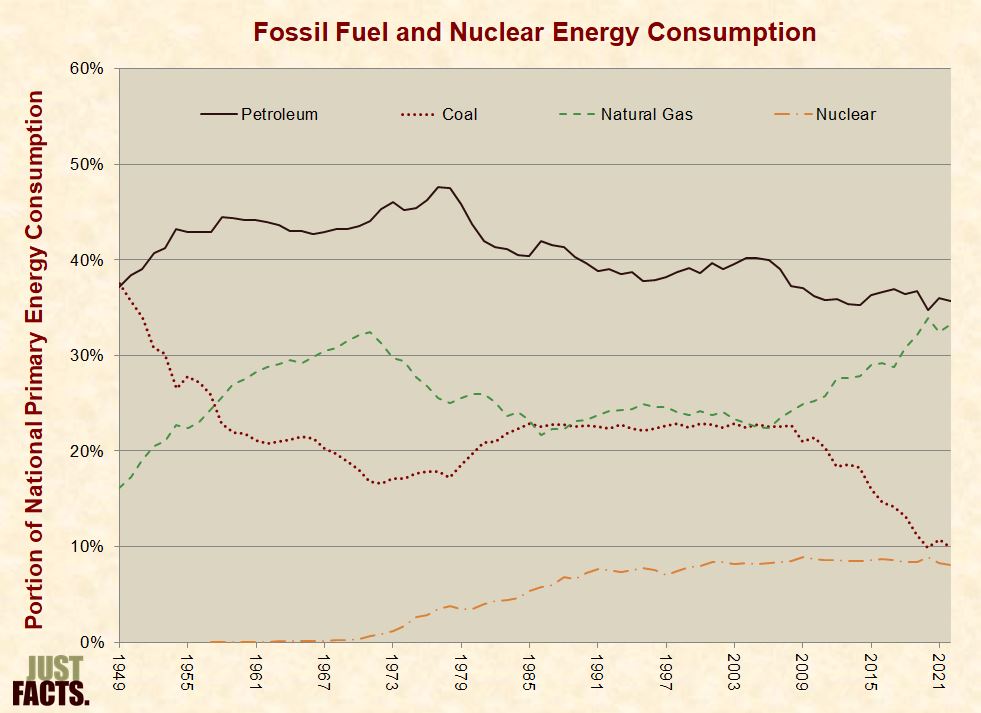
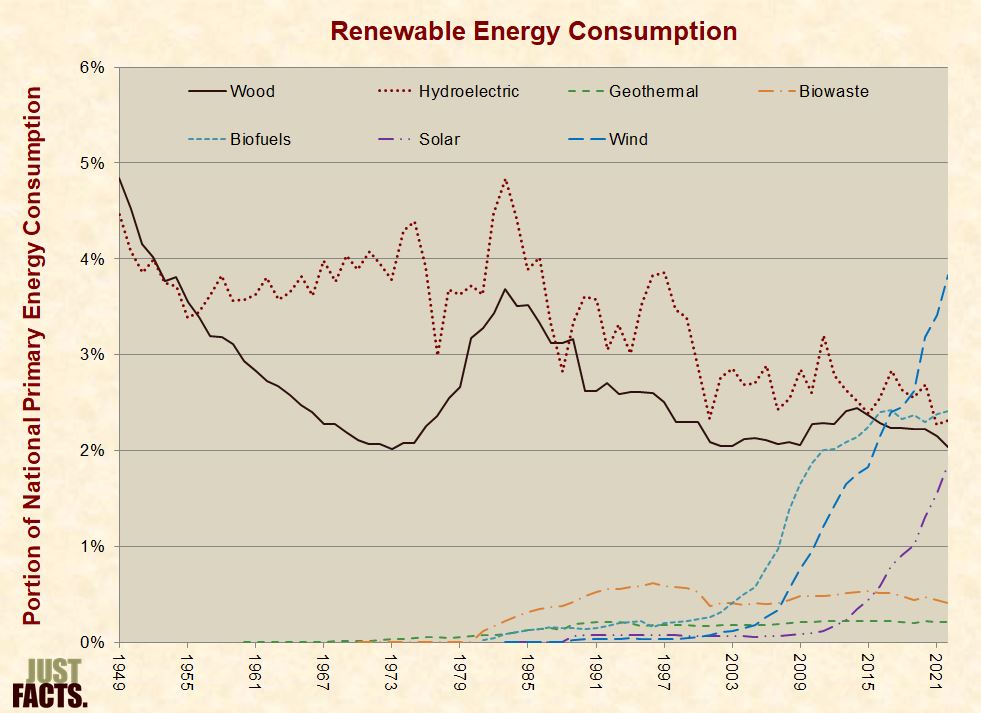
* Data from the charts above:
|
Components of U.S. Energy Consumption |
|||||||||
|
Source |
1950 |
1960 |
1970 |
1980 |
1990 |
2000 |
2010 |
2020 |
2023 |
|
Fossil Fuels |
91.4% |
93.5% |
93.6% |
89.4% |
85.6% |
85.7% |
82.8% |
78.7% |
78.3% |
|
Petroleum |
38.4% |
44.1% |
43.5% |
43.8% |
39.7% |
38.7% |
36.2% |
34.8% |
35.9% |
|
Natural Gas |
17.2% |
27.5% |
32.1% |
25.9% |
23.2% |
24.1% |
25.2% |
34.0% |
34.1% |
|
Coal |
35.7% |
21.8% |
18.1% |
19.8% |
22.7% |
22.9% |
21.4% |
9.9% |
8.3% |
|
Renewables |
8.6% |
6.5% |
6.0% |
7.0% |
7.2% |
6.2% |
8.5% |
12.3% |
13.4% |
|
Wind |
N/A |
N/A |
N/A |
N/A |
0.0% |
0.1% |
0.9% |
3.2% |
3.8% |
|
Biofuels |
N/A |
N/A |
N/A |
N/A |
0.1% |
0.2% |
1.9% |
2.3% |
2.7% |
|
Solar |
N/A |
N/A |
N/A |
N/A |
0.1% |
0.1% |
0.1% |
1.3% |
2.2% |
|
Hydroelectric |
4.1% |
3.6% |
3.9% |
3.7% |
3.6% |
2.8% |
2.6% |
2.7% |
2.1% |
|
Wood |
4.5% |
2.9% |
2.1% |
3.2% |
2.6% |
2.3% |
2.3% |
2.1% |
1.9% |
|
Biowaste |
N/A |
N/A |
0.0% |
0.0% |
0.5% |
0.5% |
0.5% |
0.5% |
0.4% |
|
Geothermal |
N/A |
0.0% |
0.0% |
0.1% |
0.2% |
0.2% |
0.2% |
0.2% |
0.2% |
|
Nuclear |
0.0% |
0.0% |
0.4% |
3.5% |
7.2% |
8.0% |
8.6% |
8.9% |
8.2% |
* The U.S. Energy Information Administration (EIA) divides the energy market into four major sectors: residential,[78] commercial,[79] transportation,[80] and industrial.[81] [82]
* In 2021, the residential sector consumed 21% of all U.S. energy, the commercial sector consumed 18%, the transportation sector consumed 28%, and the industrial sector consumed 33%.[83]
* EIA sometimes classifies “electric power” as a separate sector,[84] although the electricity produced by this sector is consumed by the four major sectors.[85]
* In 2021, the electric power sector consumed 38% of all U.S. energy.[86]
* Per the Institute for Plasma Physics in the Netherlands:
* During 2021—amid the Covid-19 pandemic and related restrictions on business and personal activities:[88] [89] [90]
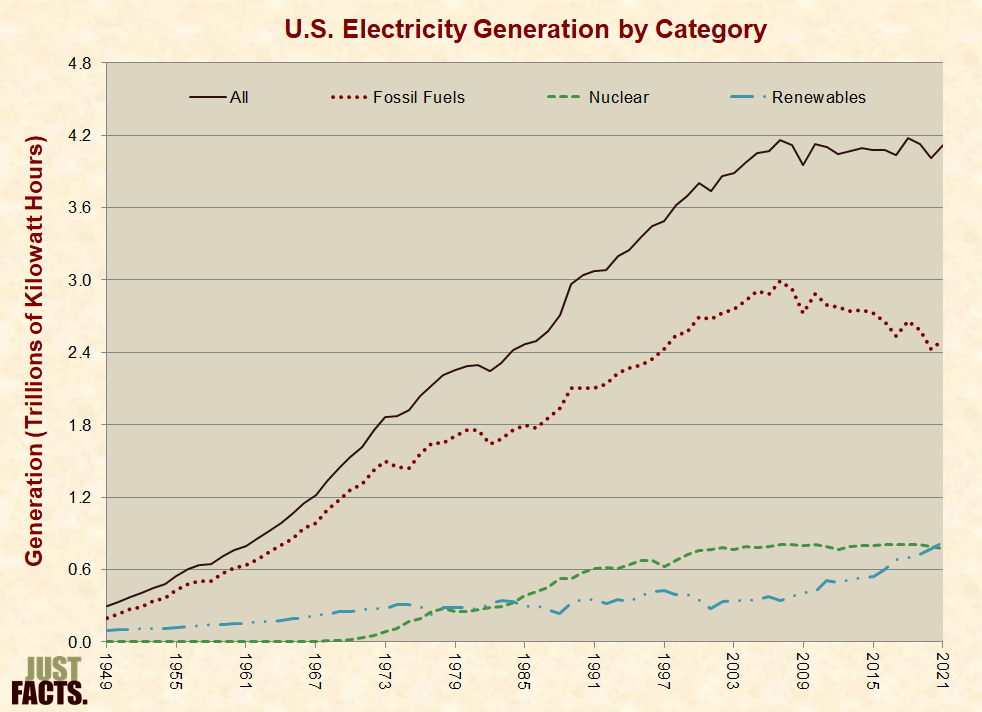
* Economic growth is a key factor in the growth of electricity generation.[93]
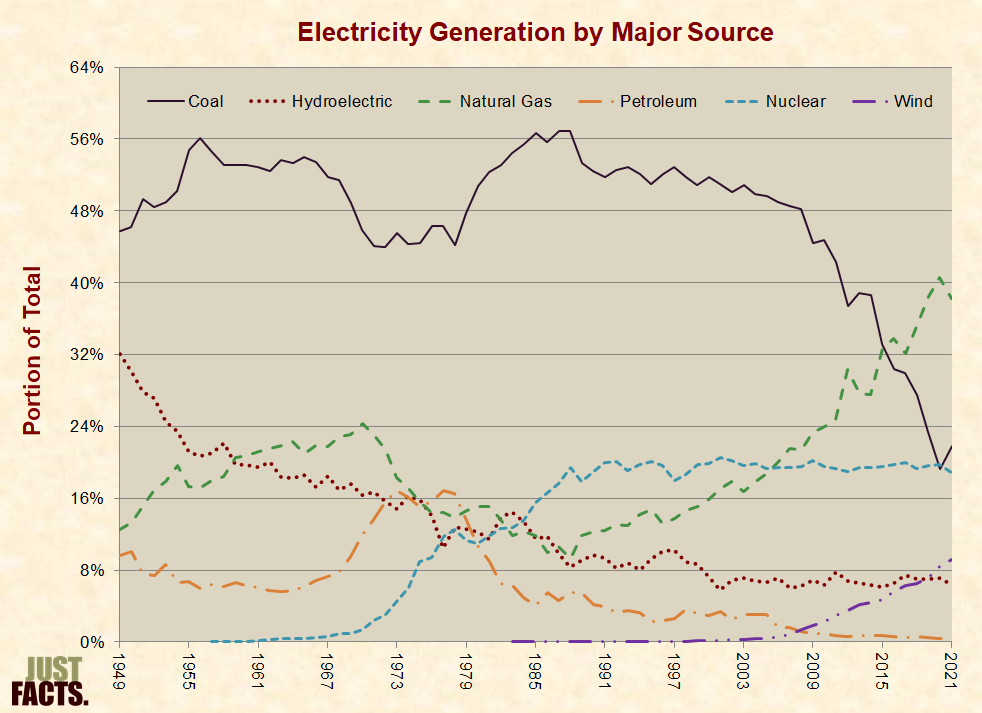
* The following graphs show the components of U.S. electricity generation over time. The first graph shows generation measured in kilowatt hours. The rest show generation measured as a portion of total U.S. electricity generation. Each succeeding graph uses a smaller scale to provide increasing resolution.

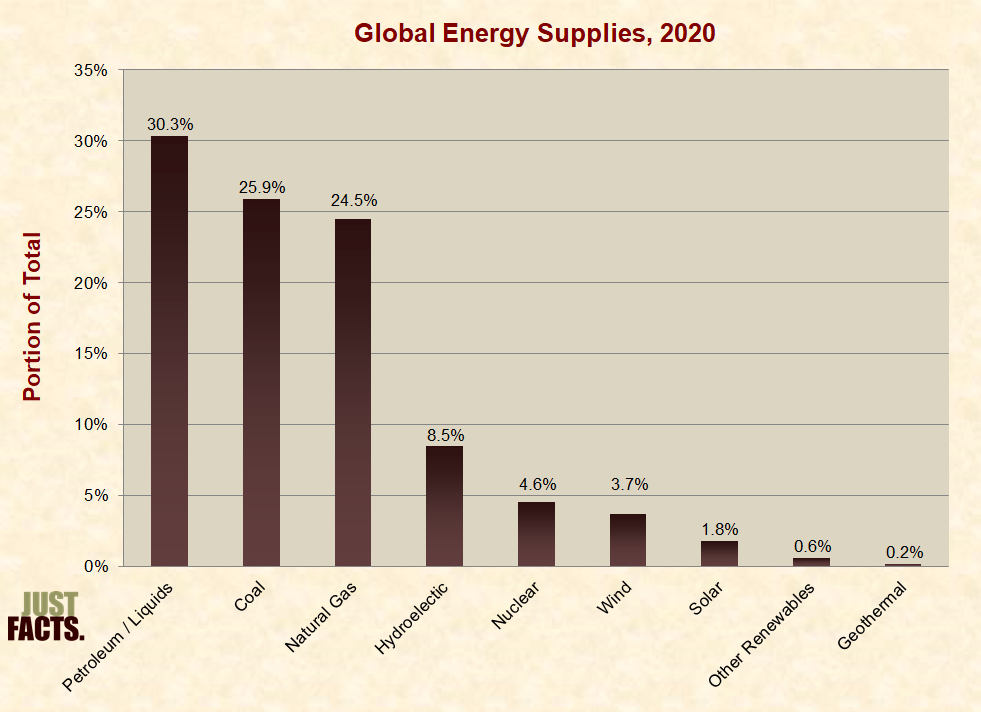
* Excluding energy sources that are not commercially sold (like self-procured firewood), during 2020:
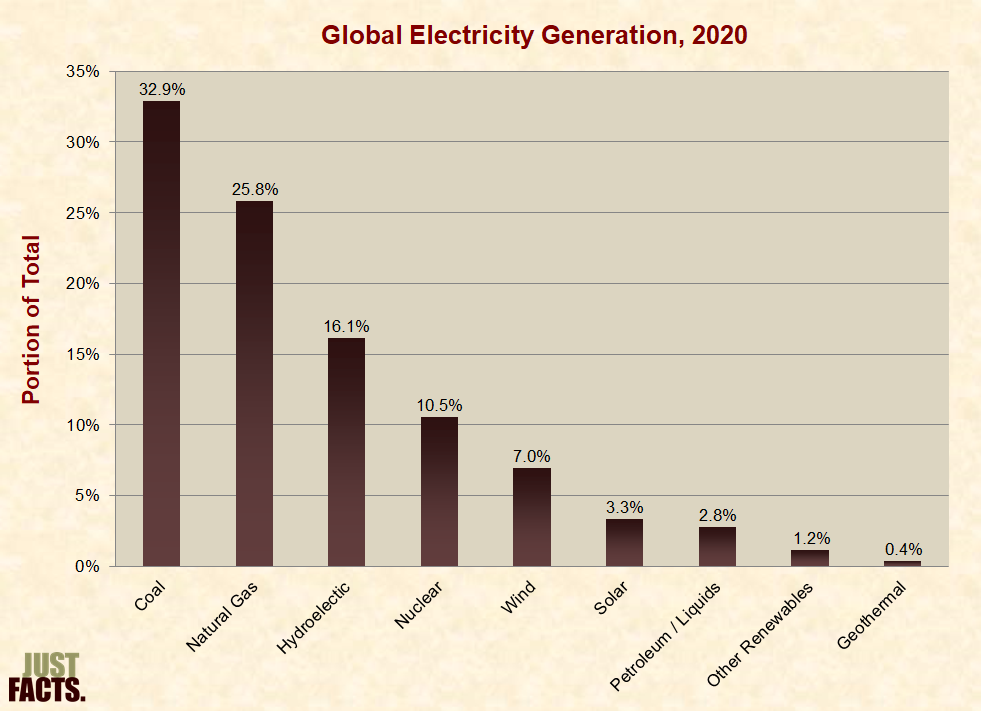
* During 2020:
* In both developing and developed countries, when modern energy is unavailable or expensive, people tend to burn more wood, crop waste, manure, and coal in open fires and simple home stoves. Open fires and home stoves do not burn fuel as efficiently as commercial energy technologies, and hence they produce elevated levels of outdoor and indoor pollutants. The added consumption of wood also causes deforestation.[105] [106] [107] [108]
* Assessing the full environmental impacts of different energy technologies requires looking beyond the effects at a single point of production, use, or disposal. To do this, researchers perform “life cycle assessments” or LCAs. Per the U.S. Environmental Protection Agency (EPA), LCAs allow for:
* Per the journal Environmental Science & Technology:
* The air pollutants generated by energy sources vary with factors such as combustion methods, manufacturing techniques, and pollution control technologies.[113] [114] For example, bituminous coal combusted in a fluidized bed boiler without pollution controls produces one tenth the sulfur dioxide of the same fuel burned in a cyclone boiler without pollution controls.[115] [116] [117]
* Environmental lifecycle analyses are subject to multiple levels of uncertainty.[118] [119] [120] [121]
* In general:
* Per the U.S. Department of Energy (2010):
* In the U.S. from 1990 through 2021, sulfur dioxide (SO2) emissions per Btu of coal-generated energy decreased by 94%, and nitrogen oxides (NOX) emissions decreased by 88%.[141]
* Since the late 1970s, new automobiles have been equipped with catalytic converters, an “anti-pollution device” that converts “exhaust pollutants … to normal atmospheric gases such as nitrogen, carbon dioxide, and water.”[142] [143] [144]
* The federal government and various states financially subsidize electric cars.[145] [146] Some states have also begun to mandate electric cars while claiming that they are “zero-emission vehicles.”[147] [148]
* Electric cars have no tailpipe emissions, but this does not mean they have no emissions. A study published by the Journal of Cleaner Production in 2021 found that electric cars emit more toxic emissions over their life cycles than gas cars. From “cradle-to-grave,” the study estimates that relative to gas cars, the manufacturing, usage, and disposal of electric cars will increase:
* Facts about air pollution levels and their effects are detailed in Just Facts’ research on pollution.
* Carbon dioxide (CO2) contributes more to the greenhouse effect than any other gas released by human activity.[150] [151] [152]
* In general:
|
Pounds of CO2 Per Million Btu |
|
|
Natural gas |
117 |
|
Propane |
139 |
|
Gasoline |
156 |
|
Diesel fuel & heating oil |
163 |
|
Coal |
205–229 |
* The federal government and various states financially subsidize electric cars.[166] [167] Some states have also begun to mandate electric cars while claiming that they are “zero-emission vehicles.”[168] [169]
* Electric cars have no tailpipe emissions, but this does not mean they have no emissions during their manufacturing, usage, and disposal. A study published by the Journal of Cleaner Production in 2021 found that from “cradle-to-grave,” electric cars emit 52% of the CO2 of gas cars.[170]
* Biofuels such as ethanol generate CO2 when burned, but the crops used to make these fuels absorb an equal amount of CO2 as they grow. However, planting, fertilizing, harvesting, processing, and distributing ethanol emits more CO2 than extracting, refining, and distributing gasoline.[171] [172] [173] [174] [175]
* Per the U.S. Congressional Budget Office, lifecycle analyses comparing CO2 emissions of corn-based ethanol and gasoline have produced varying results. The most authoritative study in the eyes of the federal government (conducted by Argonne National Laboratory) estimates that, on average, corn-based ethanol produces about 20% less CO2 than gasoline.[176]
* Another type of biofuel called cellulosic ethanol has the potential to produce 60–95% less CO2 emissions than gasoline. This fuel is more difficult to manufacture than regular ethanol, and as of 2022, producers have been unable to make enough of it to meet the mandated amounts specified in federal law.[177] [178] [179] [180] [181] [182] [183]
* Converting undeveloped land to cultivate crops for biofuels creates CO2 emissions because existing plant life is removed and the soil is disrupted. If this land is repeatedly used to produce biofuels, the net CO2 emissions will be less than using fossil fuels. The timeframe until this breakeven point occurs depends upon factors such as the type of land converted and type of biofuel produced. Per a 2008 paper in the journal Science, the CO2 breakeven time of converting:
* Per the U.S. Energy Information Administration:
* Facts about greenhouse gases and climate change are detailed in Just Facts’ research on global warming.
* Transportation fuels have different energy densities, and thus, the price per volume of each fuel does not accurately reflect the energy supplied to consumers. For example, the energy content of a gallon of ethanol is 31% less than a gallon of gasoline. Hence, a car fueled with E85 (a mixture of 70–85% ethanol and 15–30% gasoline) will get 25–30% fewer miles per gallon than the same car when it is fueled with pure gasoline.[186] [187] [188] [189] [190]
* Like ethanol, the volume of biodiesel blended with regular diesel is shown by a number that follows the first letter of the named fuel. Thus, B20 contains 20% biodiesel and 80% regular diesel.[191]
* On an energy-equivalent basis, the average subsidized retail prices (including taxes) for transportation fuels during 2021 were as follows:
|
Fuel |
Nationwide Average Price in Gasoline-Gallon Equivalents |
Price Relative to Gasoline |
|
Compressed Natural Gas |
$2.23 |
-29% |
|
Biodiesel (B20) |
$2.60 |
-17% |
|
Diesel |
$2.78 |
-11% |
|
Gasoline |
$3.13 |
0% |
|
Ethanol (E85) |
$3.18 |
2% |
|
Biodiesel (B100) |
$3.47 |
11% |
|
Propane |
$4.08 |
30% |
* A federal law known as the “Renewable Fuel Standard” requires U.S. consumers to use certain amounts of ethanol and other biofuels. This mandate uses a compliance mechanism that transfers some of the costs of producing these fuels from biofuel companies to petroleum companies. These added costs are then passed on to consumers in the form of higher gas prices.[193] [194] [195] [196] [197]
* During 2021, a federal tax credit subsidized biodiesel at a rate of $1.00 per gallon.[198]
* During 2016, federal energy “subsidies” penalized petroleum and natural gas production at an average rate of $0.002 per gasoline-gallon equivalent.[199]
* Combining the data above yields the following average prices for transportation fuels during 2021 without federal subsidies:
|
Fuel |
Unsubsidized Price in Gasoline-Gallon Equivalents |
Unsubsidized Price Relative to Gasoline |
|
Compressed Natural Gas |
$2.23 |
-29% |
|
Diesel |
$2.78 |
-11% |
|
Biodiesel (B20) |
$2.92 |
-7% |
|
Gasoline |
$3.13 |
0% |
|
Propane |
$4.08 |
30% |
|
Ethanol (E85) |
$4.22 |
35% |
|
Biodiesel (B99–B100) |
$6.21 |
98% |
* A scientific, nationally representative survey commissioned in 2019 by Just Facts found that 40% of voters believed that the unsubsidized cost of ethanol or biodiesel was lower than gasoline.[202] [203] [204] In 2019, the unsubsidized cost of:
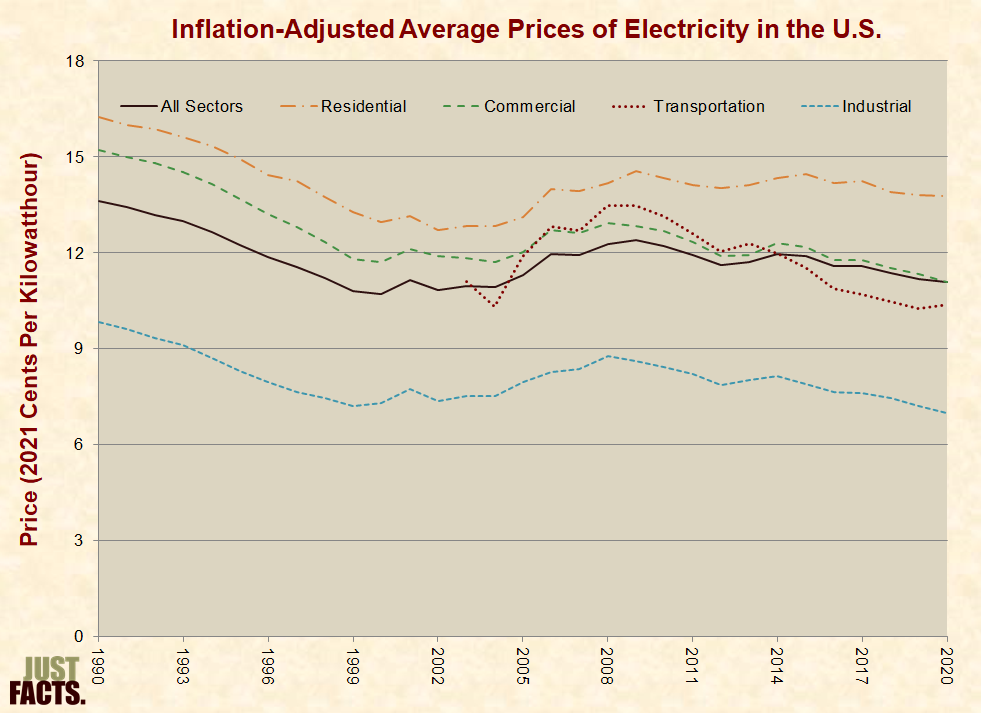
* From 1929 to 1967, the inflation-adjusted average price of electricity for U.S. residential customers declined from about 60 cents per kilowatt hour to 10 cents, and it stayed roughly around this level through 2015.[206] [207]
* Since 1990, the inflation-adjusted average prices of electricity for all U.S. consumers and the four major energy sectors have varied as follows:
* Demand for electricity varies on an hourly, daily, and seasonal basis due to factors such as:
* As shown in the following graph, the terms “baseload” and “peak load” are used to describe the minimum and maximum demands for electricity over a given time period. The term “intermediate load” is used to describe the range between them.[212] [213]
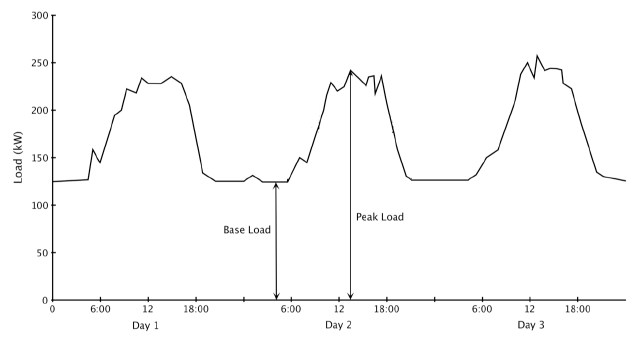
* Coal is the dominant energy source for generating baseload capacity, because low fuel costs make coal plants inexpensive to run continuously, which is ideal for generating baseload capacity. For the same reason, nuclear power is a primary source of baseload capacity. Natural gas, hydropower, geothermal, and waste-to-energy plants are also sources of baseload capacity.[215] [216] [217] [218]
* Natural gas is the dominant energy source for generating intermediate and peak load capacity because natural gas power plants can ramp up and down quickly, which is ideal for intermediate and peak load capacity.[219] [220] [221] [222]
* In 2009, natural gas became competitive with coal for generating baseload capacity in some areas of the U.S. This was primarily due to increased domestic natural gas production, which reduced prices. Other factors included increased coal prices, stricter environmental regulations, and expansion of natural gas pipelines.[223] [224] [225] [226]
* Both coal and natural gas are competitive for generating baseload capacity under differing circumstances in different regions of the U.S.[227] [228] [229] [230] [231]
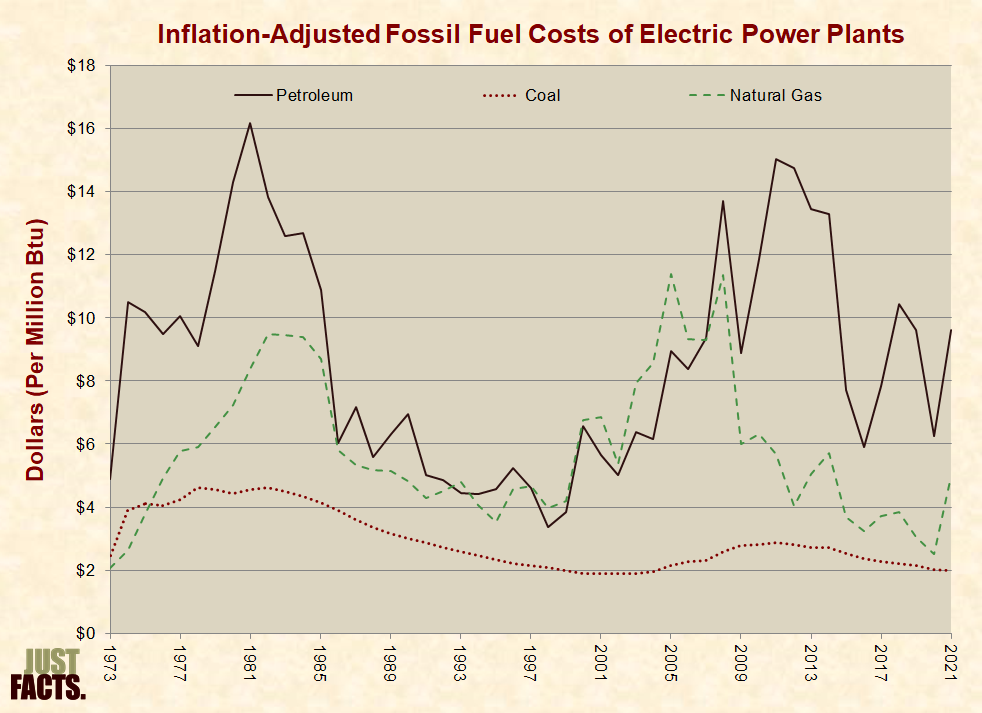
* For existing power plants, natural gas plants that employ a high efficiency technology called “combined cycle” can generate baseload power less expensively than coal plants when natural gas is about equal to or less than 1.5 times the price of coal.[232] [233] [234] In 2021, the average price paid by electric power plants for natural gas was about 2.5 times the price of coal.[235]
* Determining which electricity-generating technologies will provide the lowest cost while maintaining reliability is complicated by the following factors:
* A commonly cited measure of the costs of building and operating new power plants is the “levelized cost” data published by EIA. Levelized costs reflect “both the capital and operating costs of deploying and running new utility-scale generation capacity of any given type.”[255] [256] Per EIA:
* The following features, caveats, and limitations are inherent in EIA’s levelized costs:
* Based on the features, caveats, and limitations above, EIA’s 2022 levelized cost projections for plants beginning operation in 2027 are:
|
Plant Type (Lowest Cost Option From Each Major Category) |
Cost Per Megawatthour |
Cost Relative to Natural Gas |
|
Dispatchable Technologies |
||
|
Natural Gas Combined Cycle |
$40 |
0% |
|
Geothermal |
$40 |
0% |
|
Advanced Nuclear |
$88 |
121% |
|
Ultra-Supercritical Coal |
$83 |
107% |
|
Non-Dispatchable Technologies |
||
|
Onshore Wind |
$40 |
1% |
|
Offshore Wind |
$137 |
242% |
|
Hydropower |
$64 |
61% |
|
Photovoltaic Solar |
$36 |
–9% |
* Per EIA, “a better assessment of economic competitiveness can be gained through consideration of avoided cost, a measure of what it would cost the grid to generate the electricity that is otherwise displaced by a new generation project, as well as its levelized cost.” Calculating these costs involves a greater degree of complexity than levelized costs.[294] [295]
* In July 2013, EIA published a preliminary discussion paper using avoided costs and levelized costs to compare the projected 2018 and 2035 economic values of advanced combined cycle natural gas, onshore wind, and PV solar.[296] Because there is significant variability in factors that affect electricity costs and values in different regions of the country, the paper assessed 22 regions of the United States. It found that without subsidies for wind and with a 10% tax credit for solar:
* The following features, caveats, and limitations are inherent in this analysis:
* In 2022, EIA used levelized costs and avoided costs to estimate which type of electricity plants would be economically competitive to build and begin producing electricity in 2027. Positive values indicate an economic incentive to build, and negative values indicate a disincentive:[309]
|
Levelized Avoided Costs Minus Levelized Costs ($ Per Megawatthour) |
||
|
Plant Type (Best Value From Each Major Category) |
Incentive |
Incentive Relative to Natural Gas |
|
Dispatchable Technologies |
||
|
Natural Gas Combined Cycle |
0 |
0 |
|
Geothermal |
5 |
6 |
|
Ultra-Supercritical Coal |
–44 |
–44 |
|
Advanced Nuclear |
–50 |
–49 |
|
Non-Dispatchable Technologies |
||
|
Onshore Wind |
–6 |
–5 |
|
Offshore Wind |
–101 |
–100 |
|
Hydropower |
–26 |
–26 |
|
Photovoltaic Solar |
–4 |
–3 |
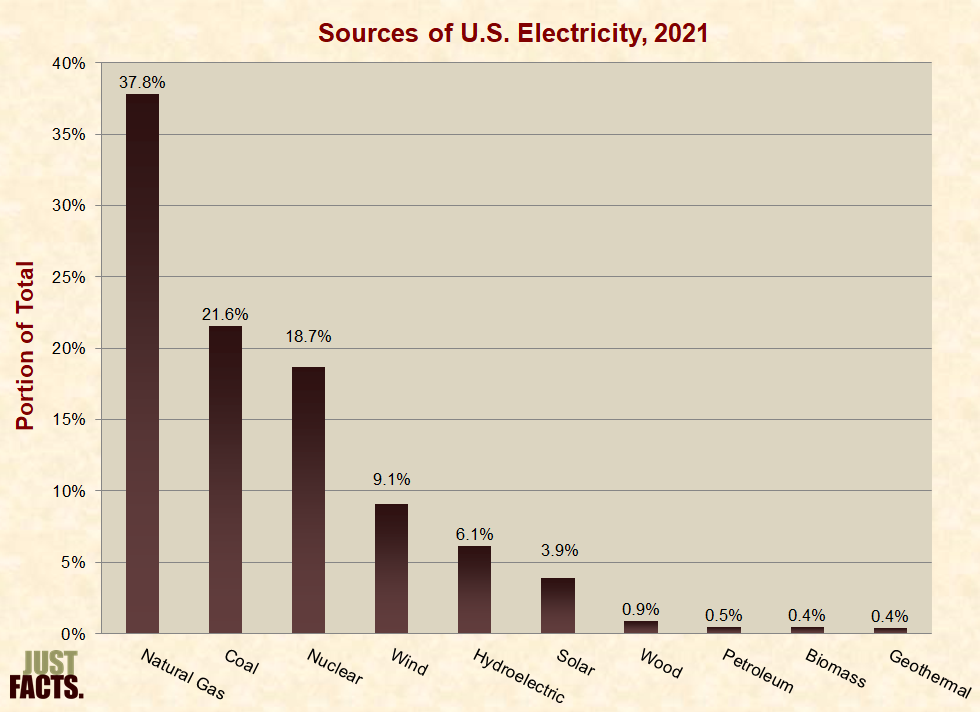
* Forest product companies often use byproducts from their operations to generate their own electricity.[311] During 2021, wood generated 0.9% of all electricity in the U.S., as compared to 4.0% for solar and 0.4% for geothermal.[312]
* Oil and biofuels are rarely used to create electricity because they are significantly more costly than the major sources of electricity.[313] [314] In 2021, the average energy-equivalent price paid by electric power plants for petroleum was about 4.8 times the price of coal.[315]
* Petroleum is a class of fossil fuels that are generally liquid at atmospheric pressure, although broader definitions of the term also include some gases and solids. The terms “petroleum” and “crude oil” are sometimes used synonymously, although petroleum is typically defined to include several other types of fossil fuels.[316] [317]
* Petroleum is primarily comprised of organic compounds called hydrocarbons, which consist of carbon and hydrogen. Other common elements of petroleum are nitrogen, oxygen, and sulfur.[318] [319] [320]
* Petroleum is mainly thought to be formed of diverse marine organisms that were buried by sediments and transformed by heat, pressure, and time.[321] [322] [323]
* The first oil well was drilled in 1857, the first intercontinental oil shipment occurred in 1861, and the first modern oil refinery commenced operations in 1862. By the 1870s, “refineries, tank cars, and pipelines had become characteristic features of the industry,” and by 1874, U.S. crude oil production had grown to 10 million barrels per year.[324]
* Today, the vast majority of crude oil is transported via pipelines and ships, and most refined petroleum fuels are transported from refineries to wholesale terminals through pipelines. Pipelines are the safest and most economical means of transporting petroleum in the U.S.[325] [326] [327] [328] [329]
* Petroleum is used to manufacture wide-ranging products, such as gasoline, diesel fuel, jet fuel, heating oil, lubricants, asphalt, propane, synthetic fabrics, plastics, paints, fertilizers, and soaps.[330] [331]
* In 2021, petroleum supplied:
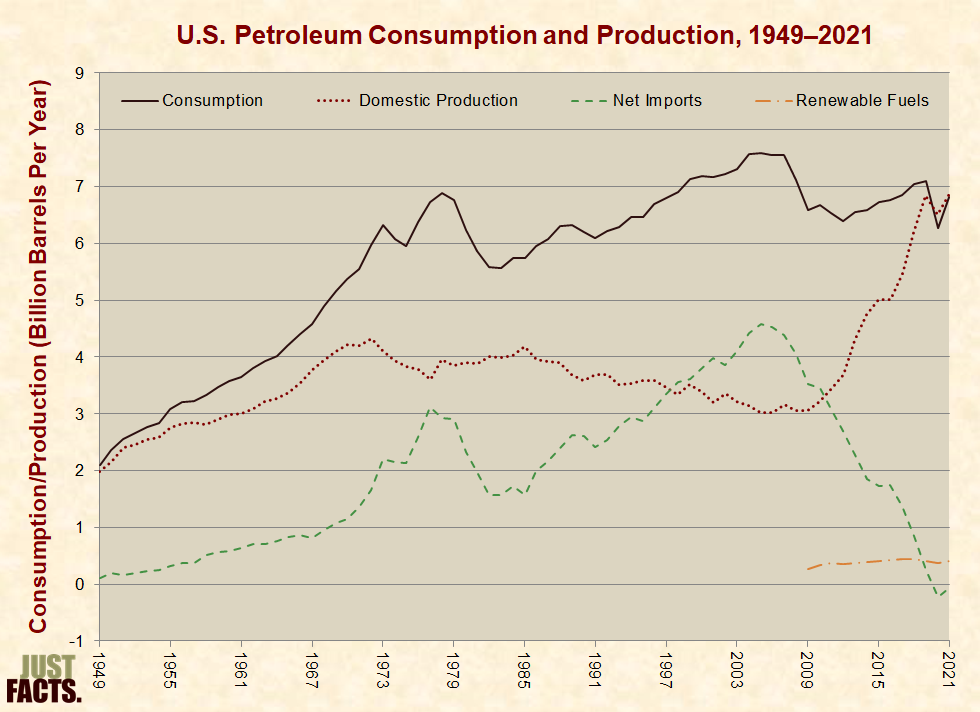
* In 2021, the U.S. produced about 6.9 billion barrels of petroleum, consumed about 6.8 billion barrels, and had net exports of about 60 million barrels.[334]
* U.S. petroleum consumption and net imports both peaked in 2005 and fell until 2012. From then until 2019, consumption rose, while net imports fell. These trends were primarily due to rising U.S. petroleum production from fracking, the Great Recession, efficiency improvements, and renewable fuel usage.[335] [336] [337] In 2020, U.S. consumption fell—primarily due to the Covid-19 pandemic—and the U.S. was a net exporter of petroleum.[338] [339] [340]
* Since 2005, U.S. petroleum production has risen by 128%, and net imports have fallen by 101%:
* In 2021, net petroleum imports from countries where the U.S. had a petroleum trading deficit were distributed as follows:
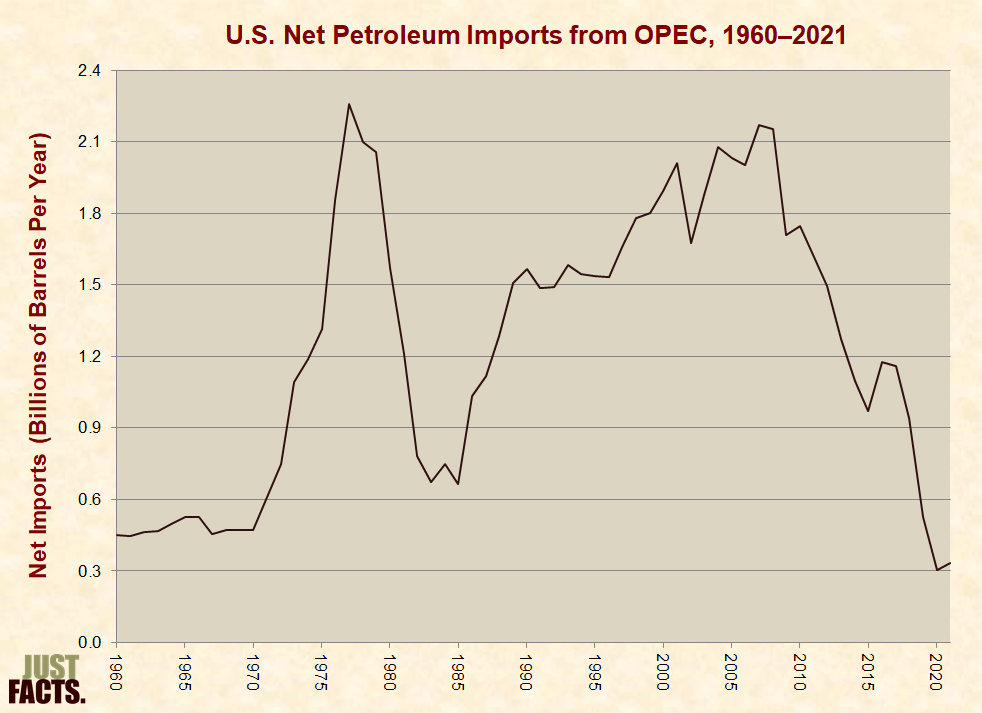
* Since OPEC’s founding in 1960, its member nations have adopted various strategies to exert control over the petroleum market. One of their more common strategies has been to limit their petroleum production in order to boost prices and increase their profits.[347] [348] [349]
* OPEC nations have also adopted the opposite strategy of maximizing their petroleum production in order to drive down prices, force their competitors out of business, and grow their market share. Some OPEC nations have recently done this in response to increased production from non-OPEC countries.[350] [351] [352] [353] [354] [355] [356] [357]
* From 1960 to 2021, the U.S. imported an average of 1.2 billion barrels of petroleum per year from OPEC nations, ranging from a low of 0.3 billion in 2020 to a high of 2.3 billion in 1977:
* Crude oil prices are affected by global and local factors that impact the supply of petroleum and the demand for petroleum products, such as:
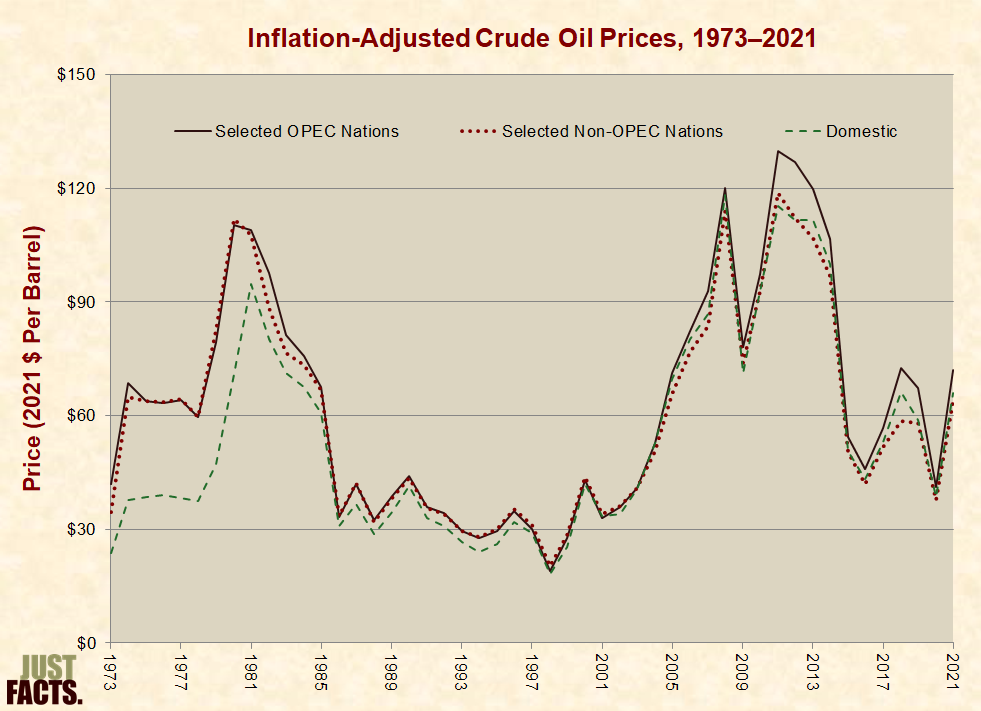
* In the U.S. during 2021, the average landed (i.e., delivered) price of crude oil from selected OPEC nations was 9% more than the average price of domestic crude, and the average landed price of crude from selected non-OPEC nations was 3% less than the average price of domestic crude.[366]
* In 2021, the average retail price of a gallon of regular-grade gasoline in the U.S. was $3.01. Broken down by its components:
* Crude oil resources can be grouped into four major categories based upon their accessibility:[368]
* Horizontal drilling involves penetrating the ground vertically (like traditional drilling) and then turning horizontally in order to drill along the layer that contains the fossil fuel resources. This method of drilling exposes more of the fossil fuel resources to the bore of each well, thus increasing yields, decreasing the surface footprint of drilling operations, and decreasing unwanted output from the wells, such as water.[383] [384]

* Horizontal drilling was first successfully employed in 1929 and has been used commercially since the late 1980s. By 1990, more than 1,000 horizontal wells were drilled worldwide, roughly 85% of which were in Texas.[386]
* Hydraulic fracturing or fracking involves injecting fluids at high pressures from the bore of the well into the layer that contains the fossil fuel resources. This process creates fractures in the rock, which allows oil to flow to the bore of the well. The fluids used for fracking typically contain sand or ceramic beads that serve to hold open the fractures after they have been created. This fluid also contains varying chemicals that are used for purposes such as reducing friction and preventing pipe corrosion.[387] [388] [389] (A detailed description of the process is shown in the video below.)
* Hydraulic fracturing was first successfully employed in 1947 and has been used commercially since the 1950s. By 1955, more than 100,000 fracking treatments were performed.[390]
* Since the mid-2000s, technological advancements and market conditions have made it economically worthwhile to extract tight oil by using a combination of horizontal drilling and hydraulic fracturing.[391] [392] [393] [394] [395] [396] The process is shown in this video:
* From 2005 to 2021, U.S. crude oil production increased by 128%, primarily due to the use of horizontal drilling coupled with hydraulic fracturing in tight oil formations.[397] [398] [399] [400] [401] [402] [403]
* In 2021, horizontal drilling coupled with hydraulic fracturing provided about 62% of total crude oil production in the U.S.[404] [405]
* As of 2021, horizontal drilling coupled with hydraulic fracturing has not been widely used to extract tight oil outside the U.S.[406] [407] [408] [409] [410] [411] [412] [413] [414] In 2013, the U.S. Energy Information Administration (EIA) estimated that 10% of worldwide technically recoverable oil resources are located in tight formations.[415]
* For facts about the environmental impacts of horizontal drilling and hydraulic fracturing, visit the fracking section of this research.
* Estimates of crude oil resources are uncertain and subject to change, particularly for tight oil formations.[416] [417] [418]
* Definitions used for estimates of fossil fuel resources include:
* Per the U.S. Energy Information Administration (EIA), it is “misleading” to make assessments about total fossil fuel resources on the basis of proved reserves. This is because:
* In 1955, America’s proved reserves of oil were equal to 11–12 years of U.S. oil consumption at that time.[429]
* In 1977, the U.S. had 31.8 billion barrels of proved crude oil reserves. If this represented all U.S. crude oil resources, the U.S. would have run out of oil in 1988.[430]
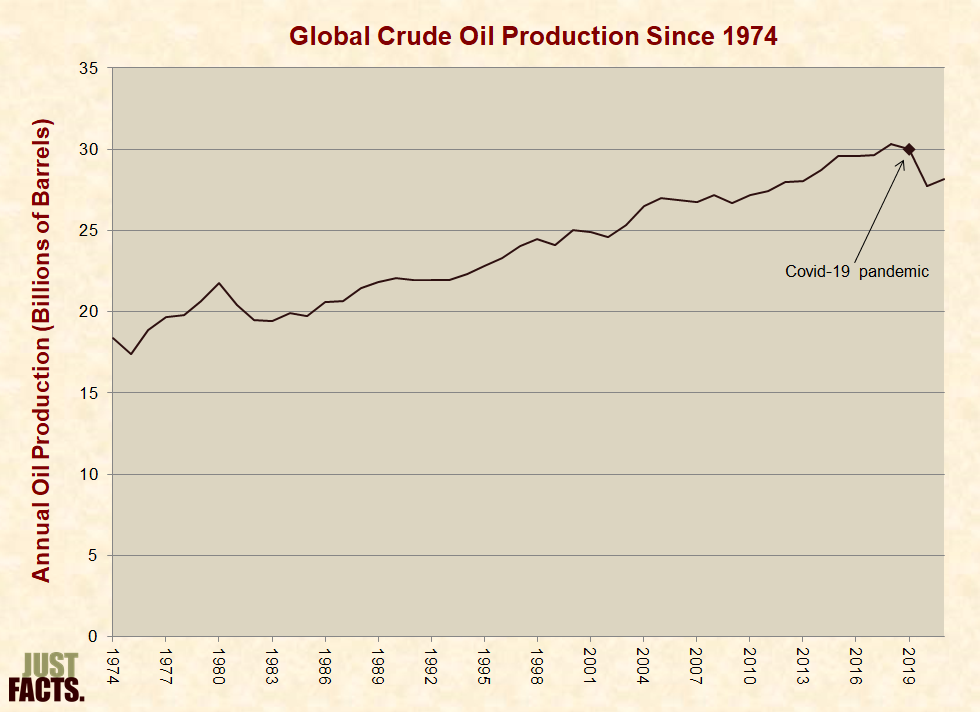
* In 1974, Stanford University professor and bestselling author Paul Ehrlich predicted that:
* From 1974 to 2021, annual global production of crude oil rose by 53%:
* As of 2020, EIA estimates that the U.S. has 373 billion barrels of technically recoverable crude oil. This figure does not include:
* 373 billion barrels of technically recoverable crude oil is roughly equivalent to:
* As of 2013, EIA estimates that the world has 3,357 billion barrels of technically recoverable crude oil. This figure does not include several crude oil resources, such as offshore shale oil, shale oil formations in the Middle East and Caspian region, tight sandstone formations, and other formations that have not yet been quantified by EIA.[439]
* 3,357 billion barrels of technically recoverable crude oil is equivalent to 121 years of worldwide petroleum production at the 2013 production rate.[440]
* According to a 2009 estimate by the U.S. Department of Energy, worldwide oil shale reserves, which are not included in the above estimates of technically recoverable crude oil, are equivalent to about 3.7 trillion barrels of crude oil. In 2009, this was roughly 40% more than all other global reserves of petroleum. About two thirds of these oil shale reserves are located in the U.S.[441]
* In 2010, the U.S. Department of the Interior reported that roughly 45% to 80% of oil shale reserves may be technically recoverable.[442]
* The largest known oil shale reserves are located in the Green River Formation, which is situated in southwestern Wyoming, northeastern Utah, and northwestern Colorado.[443] [444]
* In 2013, the U.S. Department of the Interior reported that the Green River Formation contains about 4.3 trillion barrels of oil shale and that roughly 8% to 27% of this has “a high potential for development.”[445] This amounts to:
* Per the U.S. Department of the Interior:
* Compiling the above estimates of technically recoverable crude oil and Green River oil shale with high potential for development:
* Natural gas is a mixture of fossil fuels (mostly methane) that are gaseous at atmospheric pressure and room temperature. Natural gas is sometimes defined differently because certain fossil fuels that are gases inside the earth become liquids when brought to the surface, and because certain natural gases (like propane) are commonly processed into liquids called natural gas liquids.[452] [453] [454]
* The U.S. Energy Information Administration (EIA) typically classifies natural gas liquids as petroleum. Therefore, the above data on petroleum production, consumption, etc. generally includes these natural gas liquids, and the corresponding data below on natural gas generally does not.[455]
* Natural gas is primarily comprised of organic compounds called hydrocarbons, which consist of carbon and hydrogen.[456]
* Natural gas is mainly thought to be formed of diverse marine organisms that were buried by sediments and transformed by heat, pressure, and time.[457] [458] [459]
* Natural gas and crude oil are often found in the same geological formations. In 2021, roughly 11% of all natural gas extracted from the ground in the U.S. came from crude oil wells.[460] [461]
* The first known natural gas well was drilled in China in 211 BC, and the gas was used for drying salt. The first North American natural gas well was drilled in Fredonia, N.Y. in 1821, and the gas was used for lighting and cooking.[462]
* The vast majority of natural gas is currently transported through pipelines. Prior to the early-to-mid 1900s, natural gas was not widely used because it was difficult to transport large amounts of it over long distances. Since then, advances in pipeline technology and infrastructure have made it economical to transport large volumes of natural gas under many conditions.[463] [464] [465]
* In circumstances where pipelines are not practical or cost-effective (like when shipping overseas), it is more expensive to ship natural gas than crude oil, because the density of natural gas is 942 times less than crude oil. When shipping overseas, natural gas is often liquefied by cooling it to –258ºF (–161ºC), which reduces its volume by a factor of 610. During this process, about 8–10% of the gas is consumed to generate the energy to cool the gas to these subzero temperatures.[466] [467] [468] [469]
* Before the widespread construction of pipelines, natural gas produced from oil wells was often discarded through burning it (called flaring) or releasing it into the air (called venting).[470] [471] [472]
* In 1949, 11.3% of natural gas extracted from the ground in the U.S. was vented or flared. By 1971, this figure declined to 1.2%, and since then, it has averaged 0.7%.[473]
* In 2020, 1.5% of U.S. natural gas production was vented or flared.[474] Worldwide in 2020, roughly 3.5% of natural gas production was flared (data on venting is unavailable).[475]
* Natural gas and natural gas liquids are combusted for purposes such as space heating, cooking, and electricity generation. Natural gas liquids are also used as ingredients in wide-ranging products such as plastics, fertilizers, and detergents.[476] [477] [478] [479] [480]
* In 2021, natural gas supplied:
* In 2021, the U.S. produced 34.1 trillion cubic feet of natural gas, consumed 30.3 trillion cubic feet, and had net exports of 3.8 trillion cubic feet:
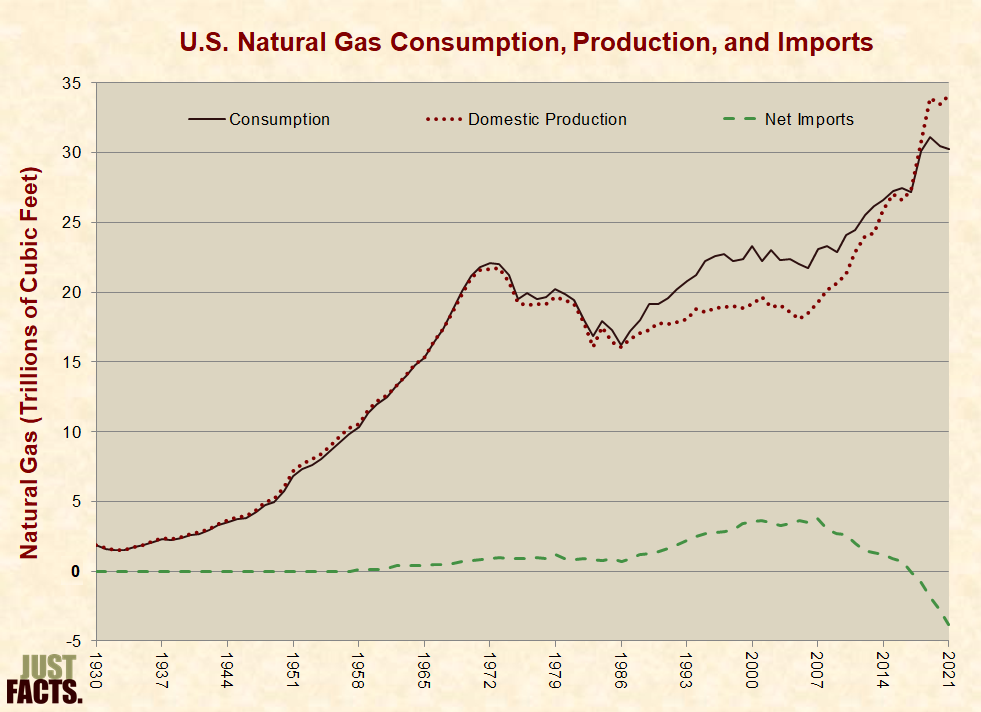
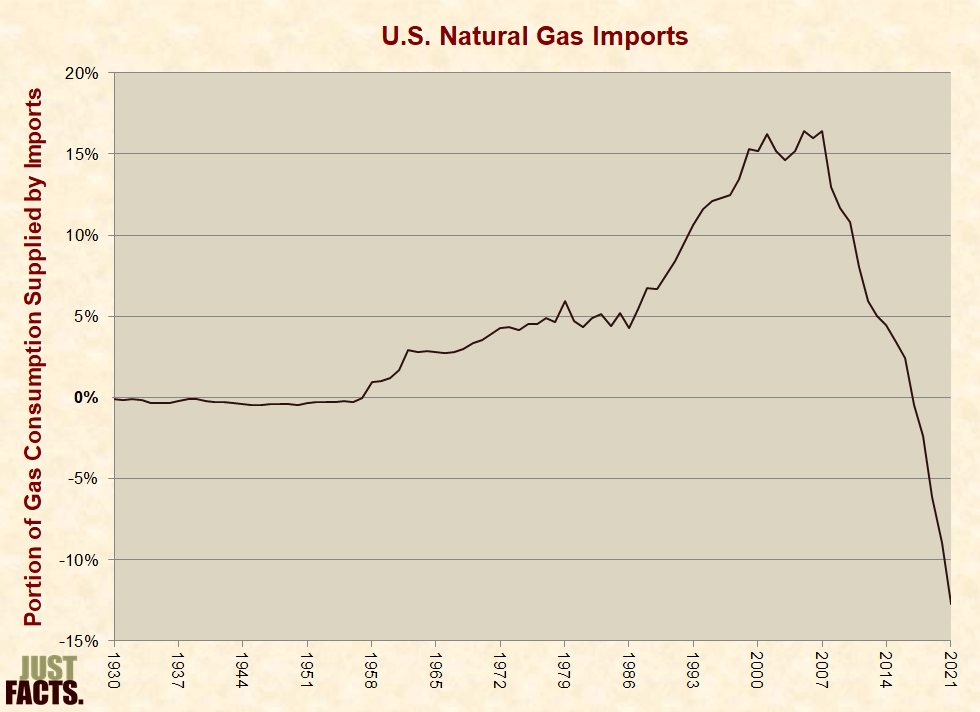
* In the U.S. from 2007 to 2021, net imports of natural gas declined from 16% of the nation’s consumption to net exports equaling 13% of consumption. This is primarily due to increased domestic production through technologies known as horizontal drilling and hydraulic fracturing (described below):
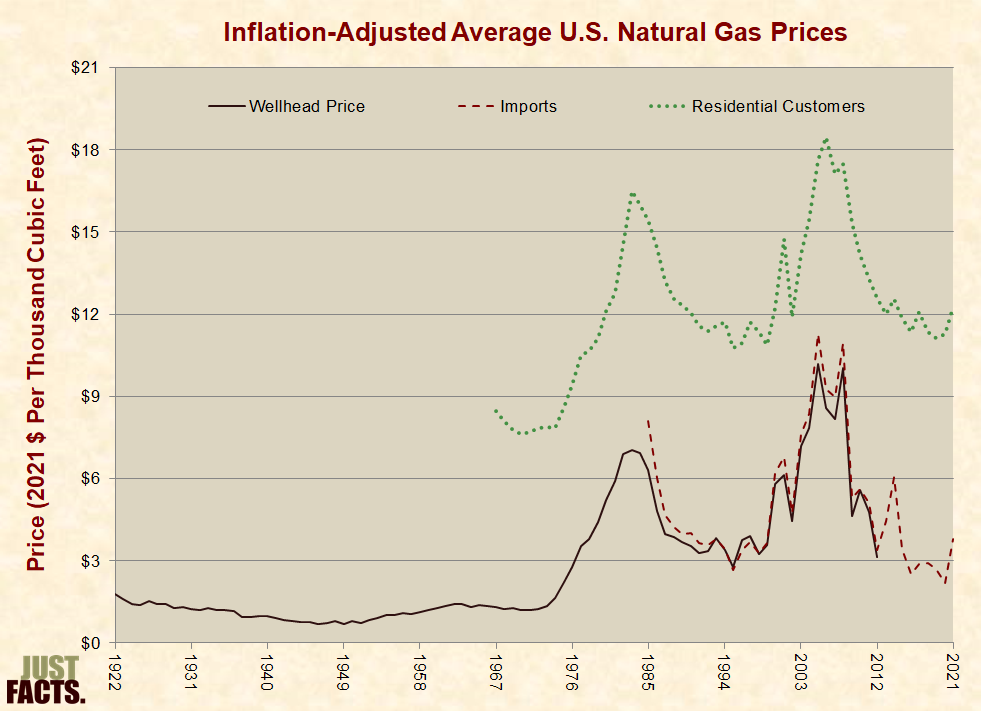
* Natural gas prices are affected by factors that impact supply and demand, such as economic growth and recessions, weather, and technological advancements.[488] [489] [490] [491] Because natural gas is more difficult to transport than petroleum, natural gas prices are more affected by local and regional factors than petroleum prices, which are primarily driven by global factors.[492] [493] [494] [495] [496]
* In 2021, the average production price for natural gas was roughly $3.78 per thousand cubic feet, and the average price for residential consumers was $12.24 per thousand cubic feet.[497]
* In 2021, natural gas supplied 32% of the primary energy consumed in the U.S. electric power sector.[500] Because certain natural gas power plants are more efficient than coal power plants,[501] [502] and because some electricity is generated outside of the electric power sector, during 2021 natural gas supplied:
* Demand for electricity varies on an hourly, daily, and seasonal basis due to factors such as:
* As shown in the following graph, the terms “baseload” and “peak load” are used to describe the minimum and maximum demands for electricity over a given time period. The term “intermediate load” is used to describe the range between them.[508] [509]
* Natural gas is the dominant energy source for generating intermediate and peak load capacity because natural gas power plants:
* Coal is the dominant energy source for generating baseload capacity because once built, low fuel costs make coal plants inexpensive to run continuously, which is ideal for generating baseload capacity.[515] [516] [517]
* In 2009, natural gas became competitive with coal for generating baseload capacity in some areas of the U.S. This was primarily due to increased domestic natural gas production, which reduced prices. Other factors included increased coal prices, stricter environmental regulations, and expansion of natural gas pipelines.[518] [519] [520] [521]
* Both coal and natural gas are competitive for generating baseload capacity under differing circumstances in different regions of the U.S.[522] [523] [524] [525] [526] [527]
* Due to their higher efficiency, natural gas power plants that employ a technology called “combined cycle” can generate baseload power less expensively than coal plants when natural gas is about equal to or less than 1.5 times the price of coal.[528] [529] [530] In 2021, the average energy-equivalent price paid by electric power plants for natural gas was about 2.5 times the price of coal.[531]
* In 2021, natural gas supplied 4% of the energy used in the U.S. transportation sector.[532]
* Between 2007 and 2013, the combination of increased oil prices, decreased natural gas prices, increased domestic natural gas production, and stricter environmental regulations created incentives to use natural gas more widely for transportation.[533] [534] [535] [536] Steep declines in oil prices since 2014 have made natural gas less competitive as a transportation fuel.[537] [538] [539]
* Other disincentives to the wider use of natural gas in transportation include:
* Per the U.S. Energy Information Administration (EIA):
* In 2012, the only factory-built compressed natural gas car available to non-fleet customers in the U.S. was the Honda Civic Natural Gas.[546] It was the “cleanest internal-combustion vehicle ever tested by the U.S. Environmental Protection Agency.”[547] Compared to a similarly equipped Honda Civic EX, the natural gas model:
* Based on the average nationwide prices of gasoline and compressed natural gas in:
* In 2015, Honda announced it was cancelling the Civic Natural Gas after 2015 due to low gasoline prices and a lack of consumer demand.[555]
* Per Vivek Chandra, a natural gas industry consultant and the author of Fundamentals of Natural Gas:[556]
* Home fueling is possible with natural gas vehicles, but Honda does not recommend this for the Civic Natural Gas because “of moisture and other contaminants inherent in some natural gas supplies, and the inability of some home refueling systems to adequately dry the gas and remove contaminants….”[558]
* Natural gas resources can be grouped into two major categories based upon their accessibility:
* Horizontal drilling involves penetrating the ground vertically (like traditional drilling) and then turning horizontally in order to drill along the layer that contains the fossil fuel resources. This method of drilling exposes more of the fossil fuel resources to the bore of each well, thus increasing yields and decreasing the surface footprint of drilling operations.[565] [566]
* Horizontal drilling was first successfully employed in 1929 and has been used commercially since the late 1980s. By 1990, more than 1,000 horizontal wells were drilled worldwide, almost all for the purpose of extracting crude oil.[568]
* Hydraulic fracturing or fracking involves injecting fluids at high pressures from the bore of the well into the layer that contains the fossil fuel resources. This process creates fractures in the rock, which allows natural gas to flow to the bore of the well. The fluids used for fracking typically contain sand or ceramic beads that serve to hold open the fractures after they have been created. This fluid also contains varying chemicals that are used for purposes such as preventing pipe corrosion.[569] [570] (A detailed description of the process is shown in the video below.)
* Hydraulic fracturing was first successfully employed to drill for oil in 1947 and has been used commercially since the 1950s. By 1955, more than 100,000 fracking treatments were performed. In the 1980s and early 1990s, Texas oilman George Mitchell refined the process of fracking to extract natural gas from shale in a cost-effective manner.[571] [572]
* In the early 2000s, horizontal drilling coupled with hydraulic fracturing became widely used to extract natural gas from shale. In the mid-2000s, the combination of these technologies also became widely used to extract oil from shale.[573] [574] [575] The process is shown in this video:
* From 2005 to 2021, U.S. natural gas production increased by 89%, primarily due to the use of horizontal drilling coupled with hydraulic fracturing in shale formations.[576] [577] [578]
* In 2021, horizontal drilling coupled with hydraulic fracturing provided about 77% of total dry natural gas production in the U.S.[579] [580]
* As of 2021, horizontal drilling coupled with hydraulic fracturing has not been widely used to extract natural gas outside the U.S.[581] [582] [583] [584] [585] [586] [587] In 2013, the U.S. Energy Information Administration (EIA) estimated that 32% of worldwide technically recoverable natural gas resources are located in shale formations.[588]
* For facts about the environmental impacts of horizontal drilling and hydraulic fracturing, visit the fracking section of this research.
* Estimates of natural gas resources are uncertain and subject to change, particularly for shale formations.[589] [590] [591]
* Definitions used for estimates of fossil fuel resources include:
* Per the U.S. Energy Information Administration (EIA), it is “misleading” to make assessments about total fossil fuel resources on the basis of proved reserves because “proved reserves are an accounting concept that is based on known projects, and it is not an appropriate measure for judging total resource availability in the long term.”[598] [599] [600] [601]
* In 1977, the U.S. had 207 trillion cubic feet of proved natural gas reserves. If this represented all U.S. natural gas resources, the U.S. would have run out of natural gas in 1989.[602]
* As of 2020, EIA estimates that the U.S. has 2,926 trillion cubic feet of technically recoverable natural gas. This figure does not include resources located in “areas where drilling is officially prohibited,” and it does not include about 33 trillion cubic feet of offshore natural gas located in areas that are not expected to be drilled.[603]
* 2,926 trillion cubic feet of technically recoverable natural gas is equivalent to:
* As of 2013, EIA estimates that the world has 22,882 trillion cubic feet of technically recoverable natural gas. This figure does not include several natural gas resources, such as offshore shale gas, shale gas formations in the Middle East and Caspian region, and other formations that have not yet been quantified by EIA.[606]
* 22,882 trillion cubic feet of technically recoverable natural gas is equivalent to 159 years of worldwide natural gas production at the 2021 production rate.[607]
* The figures above do not account for methane hydrates, which are “cage-like lattices of water molecules containing methane, the chief constituent of natural gas.” Globally as of 2012, these resources were estimated to be equivalent to 10,000–100,000 trillion cubic feet of natural gas, or 84–837 years of worldwide natural gas production at the 2012 production rate.[608] [609]
* Per EIA, methane hydrates:
* Coal is a class of combustible rocks that are at least 50% carbon by weight.[611] [612]
* Coal is categorized into different “ranks,” primarily depending upon how much of it is comprised of carbon. Coals with higher carbon content generally contain more energy and have a higher rank. The main ranks of coal (from lowest to highest) are lignite, subbituminous coal, bituminous coal, and anthracite.[613] [614] [615] [616]
* Coal is formed of plant materials that have been buried and transformed by pressure, heat, and time.[617]
* Coal may have been used as early as 3,000 years ago to smelt copper in China, and it was used in England for cooking during the era of the Roman Empire. The burning of coal to generate heat became widespread in Europe during the mid-1600s to early 1700s. Coal usage continued to expand and diversify through the 1800s, particularly as fuel for powering steam engines.[618] [619]
* Today, coal is the world’s leading fuel for generating electricity, due to attributes such as low cost and widespread availability.[620] [621]
* More than 90% of the coal produced in the U.S. is used to generate electricity.[622]
* Coal is also:
* Many nations have enacted polices to limit the use of coal in order to reduce greenhouse gases. Based upon these policies and other variables,[627] the U.S. Energy Information Administration projected in 2019 that:
* Coal accounted for 36% of global electricity production in 2021.[629] [630]
* In 2021, coal supplied:
* In 2020, the U.S. had 599 coal-fired electricity generating units located at 284 electric power plants.[633]
* Because coal power plants are less efficient than certain natural gas power plants,[634] [635] and because some electricity is generated outside of the electric power sector, during 2021 coal supplied:
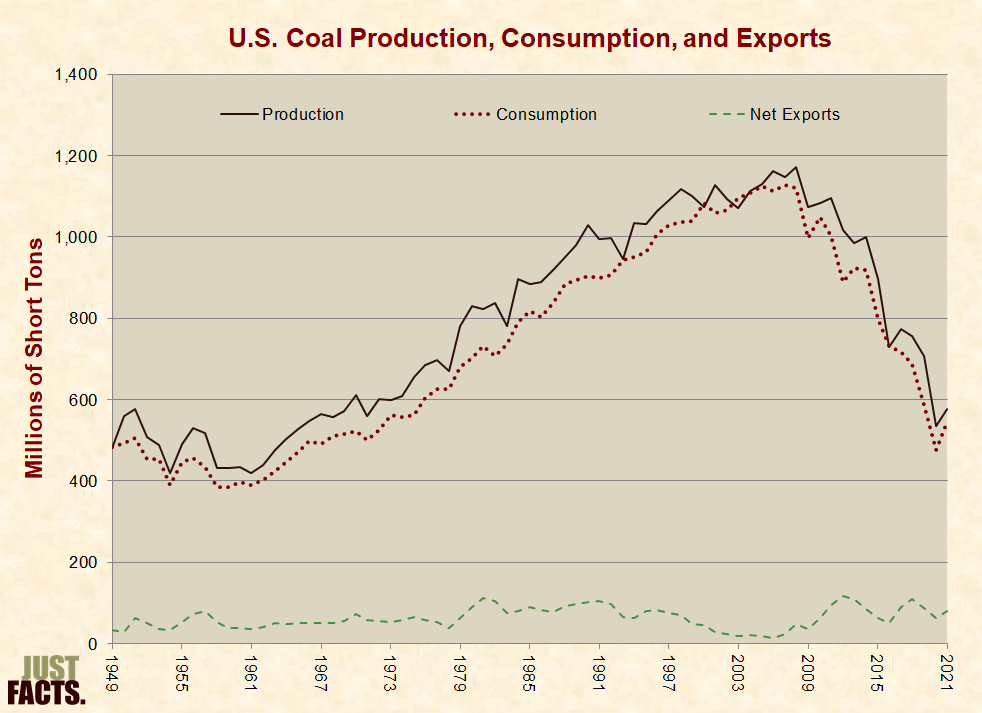
* In 2021, the U.S. produced 577 million short tons of coal, consumed 546 million short tons, and had net exports of 80 million short tons.[639] [640]
* From 2008 to 2021, U.S. coal consumption declined by 52%, primarily as a result of lower natural gas prices and stricter environmental regulations:[641] [642] [643] [644]
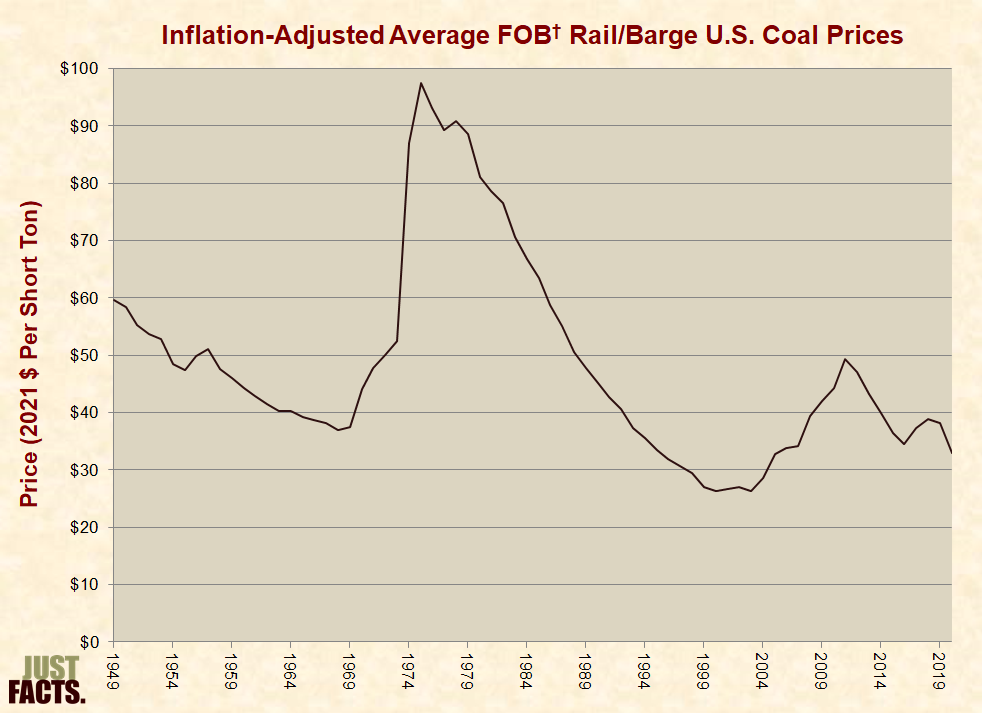
* In 2020, the average domestic price of coal was $31.41 per ton.[646]
 |
* Demand for electricity varies on an hourly, daily, and seasonal basis due to factors such as:
* As shown in the following graph, the terms “baseload” and “peak load” are used to describe the minimum and maximum demands for electricity over a given time period. The term “intermediate load” is used to describe the range between them.[652] [653]
* Coal is the dominant energy source for generating baseload capacity because once built, low fuel costs make coal plants inexpensive to run continuously, which is ideal for generating baseload capacity.[655] [656] [657]
* Natural gas is the dominant energy source for generating intermediate and peak load capacity because:
* In 2009, natural gas became competitive with coal for generating baseload capacity in some areas of the U.S. This was primarily due to increased domestic natural gas production, which reduced prices. Other factors included increased coal prices, stricter environmental regulations, and expansion of natural gas pipelines.[662] [663] [664] [665]
* Both coal and natural gas are competitive for generating baseload capacity under differing circumstances in different regions of the U.S.[666] [667] [668] [669] [670] [671]
* Due to their higher efficiency, natural gas power plants that employ a technology called “combined cycle” can generate baseload power less expensively than coal plants when natural gas is about equal to or less than 1.5 times the price of coal.[672] [673] [674] In 2021, the average energy-equivalent price paid by electric power plants for natural gas was about 2.5 times the price of coal.[675]
* In the U.S., coal is mined in two primary ways: surface mining and underground mining. Per the U.S. Department of Energy:
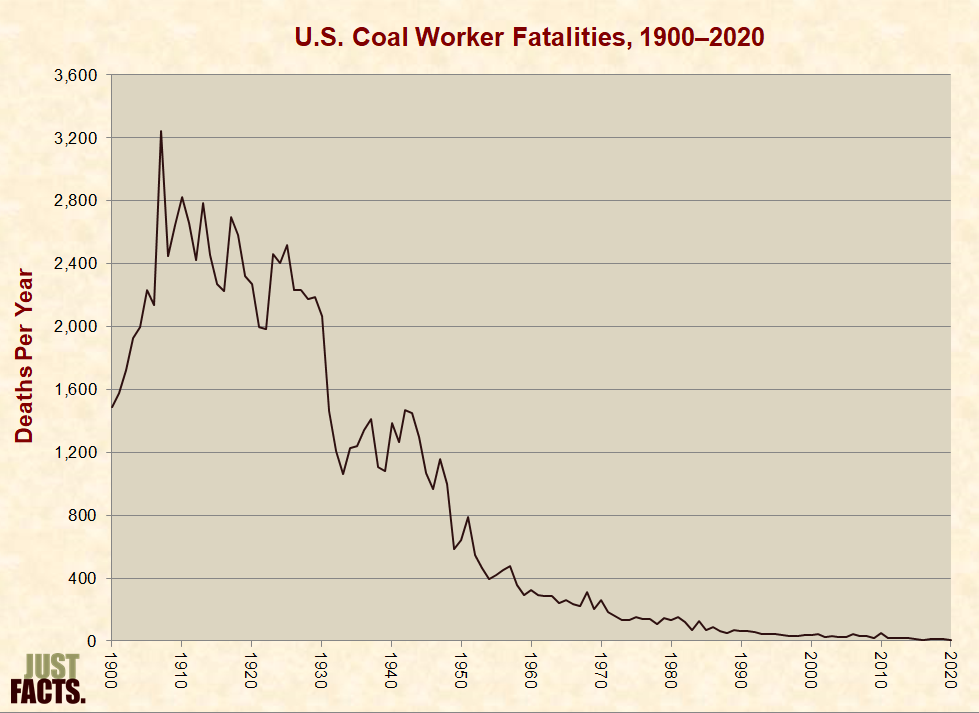
* In 2020, five U.S. coal workers were killed while working.[677] [678] In conjunction with technological advances, improved safety measures, and stricter regulations,[679] [680] coal worker fatalities have declined from a high of 3,242 people in 1907 to a low of 5 people in 2020:
* Per the Encyclopædia Britannica:
* Five countries have about 75% of the world’s coal resources, including:
* In 2020, the U.S. Energy Information Administration estimated that the U.S. has 252 billion short tons of recoverable coal reserves. These resources amount to:
* Based on U.S. Energy Information Administration estimates from 2011, the U.S. had roughly 262 billion short tons of recoverable coal reserves, comprised of 23 billion tons of lignite, 96 billion tons of subbituminous coal, 139 billion tons of bituminous coal, and 4 billion tons of anthracite. These resources amount to:
* Based on U.S. Energy Information Administration estimates from 2021, there were roughly 1.2 trillion short tons of worldwide recoverable coal reserves. These resources amount to 123 years of coal production at the 2022 production rate.[690] [691]
* Nuclear energy is so-named because it is stored in the nuclei of atoms. Through the process of fission, this energy is transformed into heat, which can be used to power steam boilers that drive electricity-generating turbines.[692] [693]
* Uranium is the primary fuel used in nuclear power plants because the process of fission is most easily achieved with elements with heavy nuclei, and uranium is the “heaviest naturally-occurring element available in large quantities.”[694] [695]
* The world’s first controlled nuclear fission reactor was built in the U.S. by Italian physicist Enrico Fermi, and it became operational in 1942.[696] The world’s first nuclear-powered electricity plant was built in the Soviet Union, and it became operational in 1954.[697]
* Through fission, a single pound of uranium can generate as much energy as burning three million pounds of coal.[698]
* In 2021, nuclear energy supplied 8.4% of all primary energy consumed in the United States:

* In 2021, nuclear energy generated 19% of all electricity produced in the U.S.[700]
* Demand for electricity varies on an hourly, daily, and seasonal basis due to factors such as:
* As shown in the following graph, the terms “baseload” and “peak load” are used to describe the minimum and maximum demands for electricity over a given time period. The term “intermediate load” is used to describe the range between them.[704] [705]
* Nuclear power is a major source of baseload capacity because once built, low fuel costs make nuclear plants inexpensive to run continuously, which is ideal for generating baseload capacity.[707] [708] [709]
* Because the products of nuclear fission emit hazardous levels of radiation, generate heat, and could be used in weapons called “dirty bombs,” they must be reprocessed and/or stored in secure locations and cooled.[710] [711] [712] [713] [714] [715]
* Waste and fuel from commercial nuclear power plants cannot accidentally or intentionally be used to produce a nuclear blast. Such explosions require different grades of materials than those used and produced by commercial power plants.[716] [717]
* Nuclear power plant operators must pay up-front fees to the federal government for the future costs of decommissioning of their plants, thus making it impossible for operators to avoid these costs through bankruptcy after the plant closes.[718] [719] [720]
* The Nuclear Waste Policy Act of 1982 required the federal government to:
* A 1987 law directed the federal government to evaluate storing the waste in the Yucca Mountain, which is located on a 230-square mile plot of federal land in the Mojave Desert of southern Nevada:[726] [727]

* Current law limits the amount of fuel that could be stored at Yucca Mountain to 70,000 metric tons, which is equal to about 79% of the nation’s current commercial nuclear waste. Per evaluations performed by the Department of Energy, at least 3–4 times this limit can be safely stored at Yucca.[729] [730] [731] [732]
* At a cost of hundreds of millions of dollars during the 1990s, the U.S. Department of Energy drilled a 5-mile long, 25-feet diameter tunnel into the Yucca Mountain, along with a 2-mile long tunnel that branches off of it.[733] [734] [735]
* A 2002 federal law approved the Yucca site for permanent nuclear waste storage.[736] [737]
* By 2006, Minnesota had banned the construction of new nuclear power plants, and 11 other states had restricted the construction of new plants until certain provisions for long-term disposal of nuclear waste are met.[738] [739] [740]
* In June 2008, the Bush administration Department of Energy (DOE) submitted an application to the Nuclear Regulatory Commission (NRC) for approval to construct a waste repository at Yucca Mountain.[741]
* In March 2009, the Obama administration DOE announced that it was going to terminate the Yucca Mountain repository. Inquiries to DOE by the U.S. Government Accountability Office and Nuclear Regulatory Commission found that the decision “was made for policy reasons, not technical or safety reasons.” Per the Obama administration DOE:
* After this announcement, the Obama administration moved to shut down the Yucca Mountain program by September 2010 by terminating leases and contracts, archiving documents, eliminating the jobs of all federal employees working on the project, and disposing or transferring federal assets used for the project.[744]
* From 1983 to 2011, the federal government spent roughly $15 billion “to evaluate potential nuclear waste repository sites, evaluate the Yucca Mountain site in more depth, and develop and submit the license application for it.”[745]
* From 1983 to 2011, nuclear power plant operators paid more than $30 billion in fees (including earned interest) to the federal government to dispose of nuclear waste. The government used $9.5 billion of these fees “to evaluate potential nuclear waste repository sites, evaluate the Yucca Mountain site in more depth, and develop and submit the license application for it.”[746] [747]
* As of 2021, the U.S. had 88,248 metric tons of commercial nuclear waste, most of which was stored at nuclear power plants.[748] [749] [750] [751] [752]
* Due to a breach of its responsibility to start taking waste from power plants starting in 1998, the federal government has paid $9.0 billion in court-ordered damages and settlements to power plant operators as of September 2021.[753] [754]
* In 2021, the Inspector General of the Department of Energy estimated that the federal government’s total liabilities for breaching this responsibility will amount to $40 billion. The nuclear power industry estimates that it will be at least $50 billion.[755]
* In 2013, a three-judge panel of the District of Columbia Court of Appeals ruled (2–1) that the NRC “was violating federal law by declining to further process the license application” for the Yucca facility. The court ordered the NRC to continue this process.[756] [757]
* After this ruling, the NRC published reports in 2014 and 2016 finding that the Yucca facility could safely store nuclear waste for a million years.[758] [759] [760]
* President Trump’s 2018–2020 budget blueprints called for funding to restart the Yucca Mountain program and provide for interim storage of nuclear waste.[761] [762] [763] [764] [765] [766] [767] [768] These provisions were not included in the budgets passed by Congress and signed by the president.[769] [770] [771]
* After Congress rejected President Trump’s calls for funding the Yucca Mountain program in the previous three years, his 2021 budget blueprint did not request funding for it.[772] [773]
* In 2021, the Biden administration announced that it is “beginning that process” to find a site for long-term nuclear waste storage and that Yucca Mountain is “off the table” as a potential site.[774]
* A commonly utilized measure of radiation dosage is millisieverts (mSv). On average, each person receives 2.4 mSv per year of natural background radiation per year, typically varying from 1 to 13 mSv. Per the United Nations Scientific Committee on the Effects of Atomic Radiation, “sizable population groups receive 10–20 mSv annually” of natural radiation. This does not include any radiation from human activities.[775] [776]
* Over the course of a lifetime, most people receive about 70–700 mSv of radiation from natural sources.[777]
* After tobacco smoke, the second leading cause of lung cancer in the U.S. is radon, a gas that arises from the decay of natural uranium, which is common in rocks and soils. The EPA estimates that 14% of lung cancer deaths in the U.S. are related to radon.[778]
* Due to hot springs that leach a radioactive element from underground, 2,000 residents in the city of Ramsar, Iran, receive up to 260 mSv of natural background radiation per year. Per a 2002 paper in journal Health Physics, preliminary studies indicate an “apparent lack of ill effects among observed populations of these high dose rate areas….”[779]
* Regarding manmade sources of radiation, on average:
* Concentrated (i.e., high-level, high-rate) radiation doses generally cause more harm than the same doses spread out over longer periods of time.[782] Concentrated radiation doses of:
* Two major studies of survivors of the 1945 atomic bombings in Hiroshima and Nagasaki have found increased rates of certain cancers among populations who received concentrated radiation doses below 100 mSv, but none of the results were statistically significant below this level.[784]
* The largest nuclear power accident in the world occurred in the city of Chernobyl in the Soviet Union in 1986.[785] A picture of the reactor after the accident is shown here:

* Per the official summary of a 2006 three-volume report by the International Atomic Energy Agency, World Health Organization, U.N. Development Programme, Food and Agriculture Organization, U.N. Environment Programme, U.N. Office for the Coordination of Humanitarian Affairs, U.N. Scientific Committee on the Effects of Atomic Radiation, World Bank, and the governments of Belarus, the Russian Federation, and Ukraine:[787]
* Per the “environment” volume of the above-cited 2006 report:
* The second-largest nuclear power accident occurred in March of 2011 at the Fukushima Daiichi nuclear power facility in Japan. A 9.0-magnitude earthquake and resulting tsunami killed roughly 18,500 people, caused $220 billion in damage, and caused explosions and radiation leaks in multiple reactors at the nuclear power facility.[799] [800]
* A 2014 report about the Fukushima nuclear accident by the United Nations Scientific Committee on the Effects of Atomic Radiation found that:
* The largest nuclear power plant accident in the U.S. occurred near Middletown, Pennsylvania at the Three Mile Island nuclear facility in March of 1979.[803]
* As a result of the Three Mile Island accident, the maximum radiation dosage to local residents was less than 1 mSv.[804] [805] [806] Per the U.S. Nuclear Regulatory Commission:
* As of 2014, the U.S. nuclear power industry had accumulated 3,500 reactor-years of operation without any known deaths or injuries to the public.[809]
* The term “biomass” refers to non-fossil organic materials that can be used as energy sources.[810]
* There are three main types of biomass:
* Biomass, particularly wood, was the first inanimate energy source that mankind learned to harness. Up through the Middle Ages, wood remained the primary fuel of civilization.[820]
* The world’s first internal combustion engine ran on a mixture of ethanol and turpentine refined from pine trees. The world’s first diesel engine ran on peanut oil.[821]
* In 2021, biomass supplied 5.0% of all primary energy consumed in the United States. Biofuels comprised 2.4 percentage points of this total, wood 2.1 percentage points, and biowaste 0.4 percentage point:
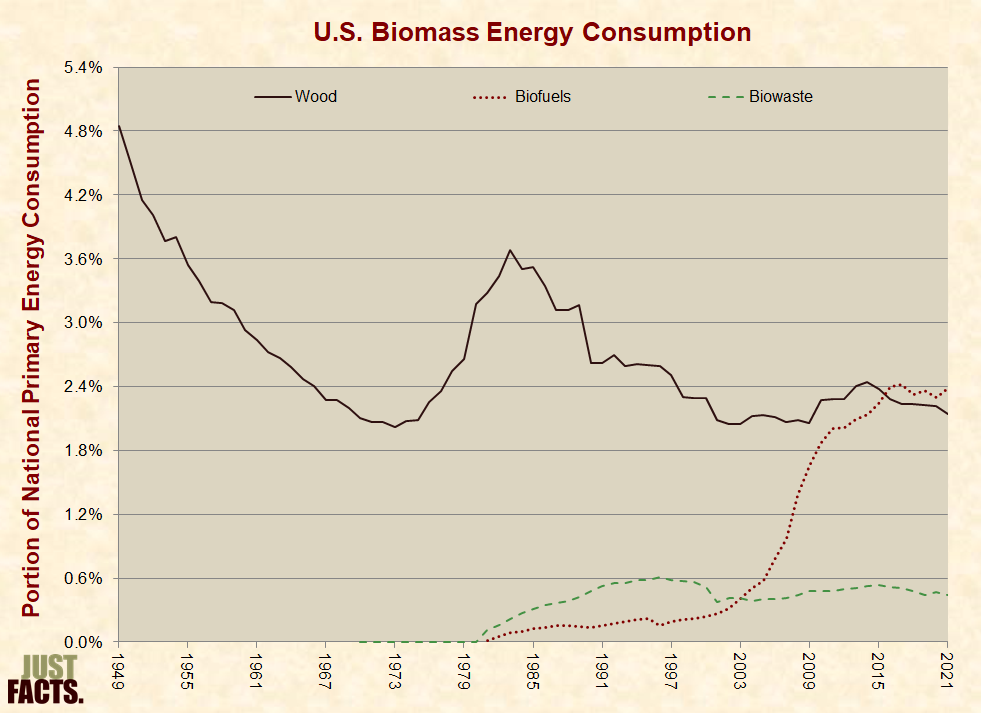
* In 2021, biomass supplied:
* Ethanol is the dominant biofuel in the U.S. and globally.[828] [829] [830] [831] [832] [833]
* In late 1970s, the federal government began promoting domestic biofuels by subsidizing the production of domestic ethanol and placing tariffs on ethanol imports.[834]
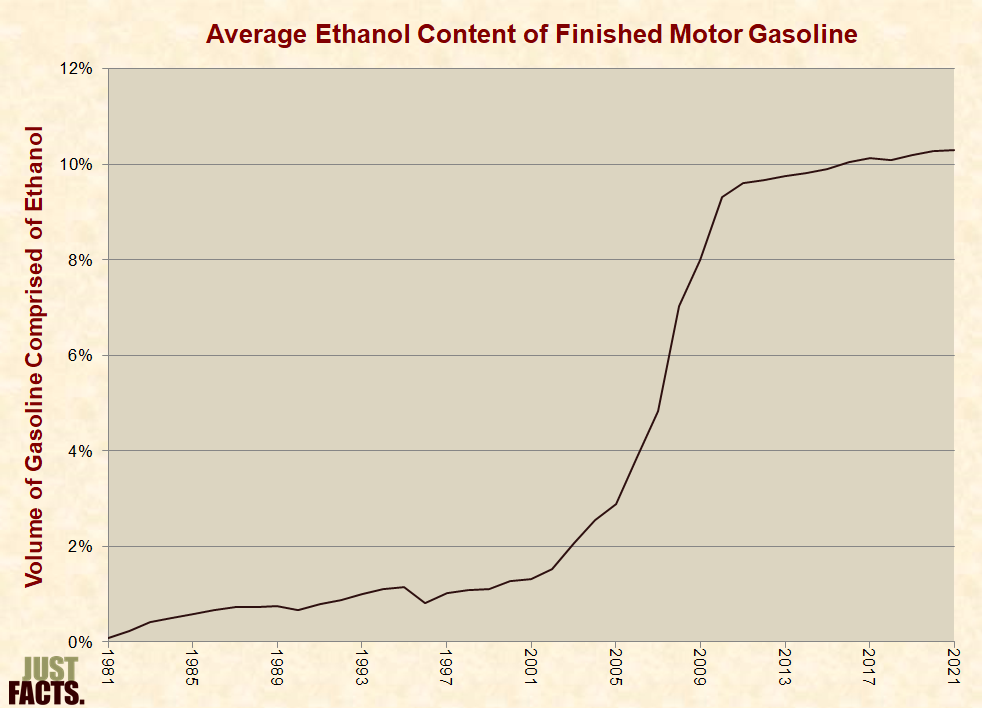
* Federal laws passed in 2005 and 2007 mandate that increasing volumes of biofuels be used in the U.S. transportation sector through 2022.[835] [836] [837] Due primarily to these laws,[838] [839] the portion of automotive fuel that is comprised of ethanol has risen from 2.9% in 2005 to 10.3% in 2021:
* Ethanol is another name for ethyl alcohol or grain alcohol, and it is chemically identical to the intoxicating ingredient in alcoholic beverages.[842] Before shipping ethanol, producers make it unfit for human consumption by adding inedible substances to it.[843]
* Ethanol has higher octane than gasoline, which increases engine power.[844] [845]
* The energy content per unit volume of ethanol is 31% below that of gasoline, which reduces fuel economy and hence vehicle range.[846] [847] [848]
* The elemental differences between ethanol and gasoline restrict the amount of ethanol that can be used in many engines and fuel systems. As compared to gasoline, ethanol:
* Whether or not the above effects occur depends upon the designs of engines and fuel systems, the concentrations of ethanol, exposure timeframes, and other variables such as pressure and temperature.[850]
* Federal law prohibits material changes to automotive fuels and additives without approval from the Environmental Protection Agency (EPA). In 1979, EPA approved the use of automotive fuel comprised of up to 10% ethanol by volume.[851] [852]
* In the late 2000s, a combination of the following factors created a situation in which almost all general-purpose gasoline sold in the U.S. contained 10% ethanol by volume:[853]
* In 2016 nearly all ethanol consumed in the U.S. was used in a fuel called E10, which is a blend of 10% ethanol and 90% gasoline.[858] [859] Per the U.S. Energy Information Administration (EIA):
* In response to the looming blend wall, in 2009 a coalition of ethanol producers petitioned the EPA to allow for general usage of E15, which is a blend of 15% ethanol and 85% gasoline.[862] [863]
* In 2010, EPA approved the use of E15 for model year 2007 and later general-purpose autos, and in 2011 EPA extended this approval to cars with models years of 2001 and later. However, EPA did not approve the use of E15 in older cars, heavy-duty vehicles, motorcycles, boats, lawnmowers, chainsaws, and other nonroad equipment.[864] [865] [866] Per EPA:
* In the wake of EPA’s rulings, the following factors have limited the usage of E15:[868]
* In 2019 the Trump administration issued regulations that allow the year-round sale of E15.[877] [878] Prior to this, E15 could not be sold during summer months due to its potential to increase smog.[879]
* Certain autos called “flex-fuel vehicles” are designed to run on wide-ranging fuel mixtures up to 85% ethanol (E85). In 2012, 4.9% of light duty automobiles could run on E85, and 1.6% of gas stations dispensed E85.[880] [881] [882]
* Due to the blend wall and other practical limitations on the usage of biofuels, the EPA has used its regulatory authority to reduce the amount of biofuels required by federal law from 2014 to 2021:
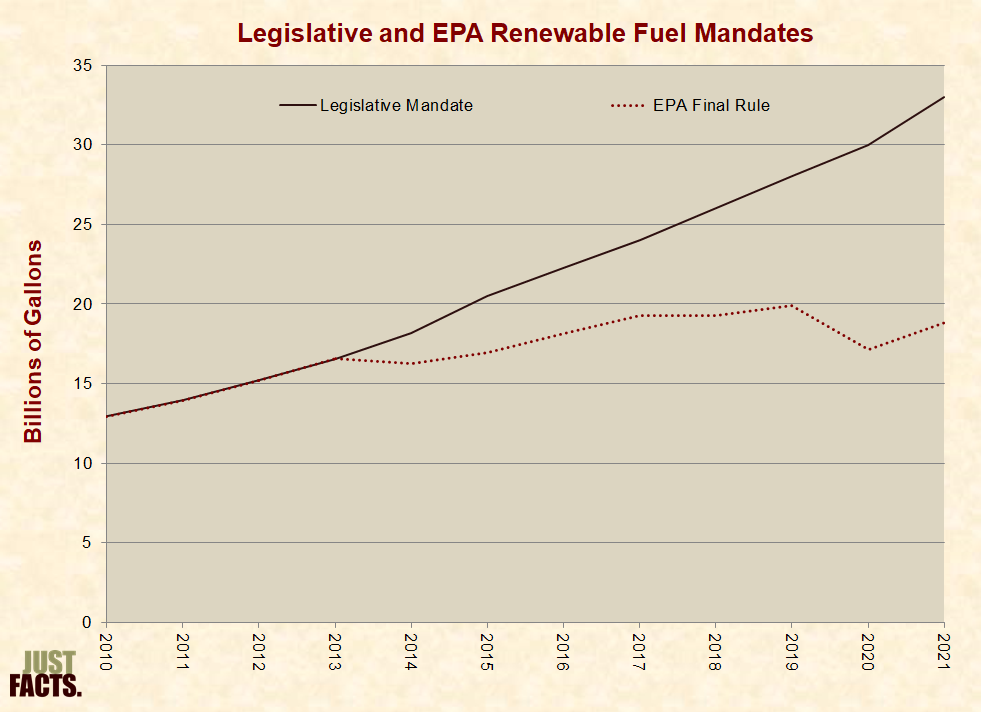
[883] [884] [885] [886] [887] [888] [889]
* As opposed to petroleum and refined petroleum fuels—which are primarily transported to wholesale terminals via pipelines—ethanol is mainly transported to wholesale terminals by rail, trucks, and barges.[890] Generally, the most economical and safest way to transport liquid fuels is through pipelines,[891] but wide-ranging technical and logistical issues currently prevent most ethanol from being transported in this manner.[892] [893]
* In 2016, EIA reported that biofuel production “often depends heavily on policies or mandates to support growth.”[894]
* In 2020, biofuels accounted for 6% of U.S. liquid fuels production (by volume) and 3% of global liquid fuels production.[895]
* In 2021, EIA projected that by 2050, biofuels will account for 3% of global liquid fuels production.[896] [897] [898]
* Federal law also mandates the usage of biofuels that produce less greenhouse gases than corn-based ethanol. One of these fuels is cellulosic biofuel, which is made from grasses, crop waste, and trees.[899] [900] [901] [902]
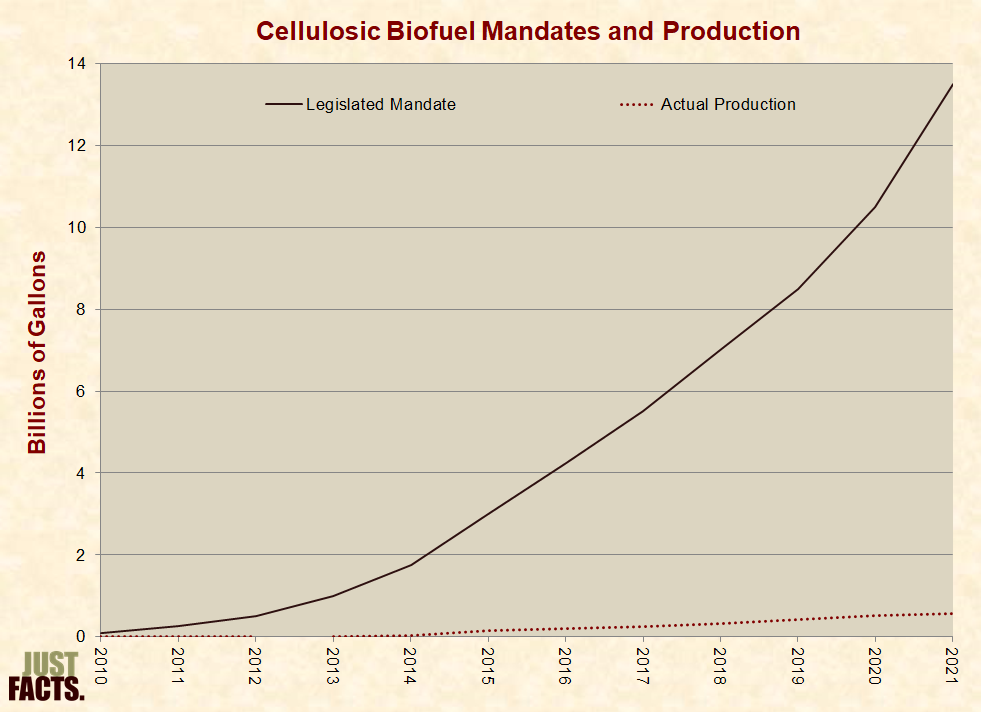
* In 2007, when the mandate for cellulosic biofuels became law, such fuels were not being produced in commercial quantities. The law specifies how much of these fuels are to be used starting in 2010, but before the outset of each year, EPA is required to project how much this fuel will actually be produced and to relax the mandate accordingly.[903] [904] [905]
* For 2010, EPA reduced the law’s cellulosic biofuel mandate by 94%, but none of the fuel was actually produced.[906] [907]
* For 2011, EPA reduced the mandate by 98% and leveled fines of $6.8 million on motor fuel suppliers for failing to use the nonexistent fuel.[908] [909] [910] [911]
* For 2012, EPA reduced the mandate, but a federal appeals court struck it down because EPA had not used a “neutral methodology” to set the mandate.[912]
* In 2007, when the mandate for cellulosic biofuels became law, such fuels were not being produced in commercial quantities. The law specifies how much of these fuels are to be used starting in 2010, but before the outset of each year, EPA is required to project how much this fuel will actually be produced and to relax the mandate accordingly.[913] [914] [915] In the year:
* From 2010 to 2021, the gaps between cellulosic biofuel production and the legislated mandate were as follows:
* In 2013, the EPA qualified a new fuel product (renewable gasoline blendstock) in the cellulosic biofuel class. This product accounted for all cellulosic biofuel production in 2013. The EPA has not published production data for renewable gasoline blendstock since 2014.[924] [925]
* In 2014, the EPA amended its cellulosic biofuel regulations to classify corn kernel fiber as a crop waste.[926]
* In 2014, the EPA amended its cellulosic biofuel regulations to include compressed and liquefied natural gas from renewable sources like landfills and wastewater treatment facilities.[927] [928] From 2014 to 2021, compressed and liquefied natural gas from renewable sources accounted for 96–99% of annual cellulosic biofuel production.[929]
* In 2015, the U.S. Department of Energy reported the results of a government-industry collaboration that produced a “cellulosic ethanol solution that meets the demands of renewable fuel and chemical producers for a cost effective, sustainable, scalable technology.”[930] [931] This technology prompted three companies (DowDuPont, POET, and Abengoa) to open commercial production facilities.[932] [933] [934] The Department of Energy called this “a huge step toward meeting the Department’s goals of”:
* As of September 2022:
* Hydropower is generated by harnessing the energy of moving water. Hydroelectric power plants typically channel water through turbines, thus causing them to spin and produce electricity.[946] [947] [948]

* More than 2,000 years ago, the ancient Greeks used hydropower to grind corn, pump water, and power other types of machinery. The world’s first hydroelectric power plant was built in Appleton, Wisconsin (U.S.A.) and became operational in 1882.[950] [951] [952] [953]
* Hydropower output typically varies from year to year because it is dependent upon rainfall and other elements of climate and weather.[954] In 2021, hydropower supplied 2.3% of all primary energy consumed in the United States:
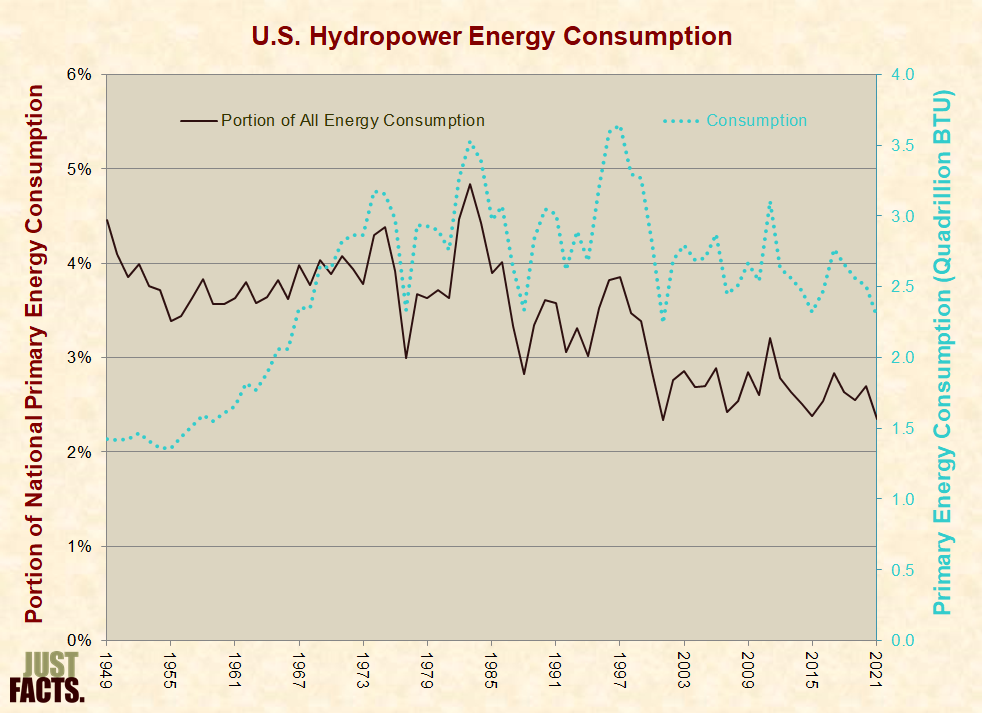
* In 2021, hydropower generated 6.3% of all electricity produced in the U.S.[956]
* Most large-scale hydroelectric power plants are built on rivers and use a dam to accumulate and release water. This allows the plant to generate varying amounts of electricity as the demand for electricity fluctuates.[957] [958] [959] [960]
* Large-scale hydroelectric power plants that use dams can displace surrounding residents, impede the migration of fish, modify water temperatures, and cause other changes to river ecosystems.[961] [962] [963] [964]
* Per the U.S. Energy Information Administration’s Office of Energy Efficiency & Renewable Energy:
* Roughly 3% of the dams in the U.S. are used to generate hydropower. The rest are primarily used for recreation (38%), flood control (18%), water storage (17%), irrigation (11%), and other purposes (13%).[966] [967] [968]
* A 2012 analysis by Oak Ridge National Laboratory estimated that the U.S. could increase its hydropower generation by 15% through adding hydroelectric generators to existing non-powered dams (NPDs). The analysis “did not consider the economic feasibility of developing each unpowered facility” but noted that:
* Hydroelectric power can also be produced without dams by “run-of-the-river” generators, which temporarily divert a portion of the river through canals or pipes that flow through turbines.[970]
* A 2006 analysis by Idaho National Laboratory estimated that U.S. rivers and streams have an average hydropower potential of 297,436 megawatts. The analysis also estimated that:
* Wind power is harnessed by converting the energy of natural air movements into mechanical energy used to drive electric power generators, pumps, and mills.[973]

* More than 2,000 years ago, the Chinese used windmills to pump water. Around 600 A.D., Persians used windmills to grind grain.[975]
* From 1998 through 2021, the portion of U.S. primary energy supplied by wind grew from 0.03% to 3.4%:

* In 2021, wind generated 9.2% of all electricity produced in the U.S.[977]
* Ideally, commercial wind turbines should be located:
* Wind speeds fluctuate on an hourly, daily, monthly, and seasonal basis. In wind-rich areas, winds are sometimes not strong enough to drive turbines for days at a time.[983] [984] [985] Per the U.S. Energy Information Administration (EIA):
* Power capacity (a commonly cited statistic for wind energy installations[988]) is the amount of electricity that wind turbines produce when operating at full capacity, which occurs when wind conditions are optimal. It is not a measure of actual production.[989] [990] In the U.S. during 2010–2020, actual production from wind turbines was 32% of their power capacity.[991]
* With the exception of pumped hydropower, current technology cannot economically store large quantities of electricity. Thus, utilities must produce enough electricity to meet their customers’ demands on a second-by-second basis.[992] [993] [994] [995] [996] [997] [998]
* Because wind power is intermittent, and utility-scale electricity cannot be easily stored, most wind power capacity must be backed up by other energy sources that can generate electricity on demand, such as natural gas power plants.[999] [1000] [1001] [1002] [1003] [1004] Per EIA:
* As the amount of wind capacity rises in a given region, so do the challenges and costs of backing up its intermittent energy output.[1007] [1008] [1009] [1010] [1011] [1012] Reliance on wind as a major energy source can contribute to electricity blackouts during dangerous weather conditions.[1013] [1014] [1015] [1016] [1017]
* Solar power is harnessed by converting electromagnetic energy from the sun into heat or electricity. The current primary solar energy technologies include:
* In the third century B.C., Greeks and Romans used mirrors to concentrate solar energy for the purpose of lighting torches. In the late 1800s, a French mathematician built the world’s first solar-powered steam engine.[1022]
* In 1953, three U.S. scientists built the world’s first silicon photovoltaic cell. This was the first photovoltaic cell that generated enough energy to power common electrical devices. One year later, Western Electric began selling commercial licenses for silicon photovoltaic technologies.[1023]
* With the exception of nuclear and geothermal power, all major current energy sources ultimately derive from solar energy. Wind energy arises from sunlight heating the atmosphere, biofuels and fossil fuels are made of organic materials that were nourished by sunlight, and hydropower is driven by the hydrological cycle, which is powered by the sun.[1024] [1025] [1026] [1027]
* From 1984 through 2021, the portion of U.S. primary energy supplied by solar power grew from 0.0001% to 1.5%:

* In 2021, solar energy produced 3.9% of all electricity generated in the U.S.[1029]
* From 1998 to 2014, the average reported installed price for residential and commercial PV systems declined by about 6–12% per year.[1030]
* From 2000 to 2020, the median installed price for residential PV systems declined yearly on average by 6%.[1031]
* From 2007 to 2020, the median installed price for utility-scale PV systems declined yearly on average by 13%.[1032]
* Over the past two decades, residential and commercial PV system price declines were due primarily to technological advancements, economies of scale, and government subsidies.[1033] [1034] [1035] [1036] [1037] [1038] [1039]
* In 2009, Jeffrey Punton of Rochester, N.Y. installed 20 solar panels at his home for a cost of $42,480. The federal government and state of New York paid for $29,504 or 69% of these costs.[1040] Per a 2012 report by Lawrence Berkeley National Laboratory:
* Power capacity (a commonly cited statistic for solar energy installations[1042]) is the amount of electricity that solar systems produce when operating at full capacity, which occurs when the sun is directly overhead, the solar panels are perpendicular to the sunlight, the sky is clear, and temperatures are low. It is not a measure of actual production.[1043] [1044] [1045] In the U.S. during 2010–2020, actual production from utility-scale solar systems was 20% of their power capacity.[1046]
* With the exception of pumped hydropower, current technology cannot economically store large quantities of electricity. Thus, utilities must produce enough electricity to meet their customers’ demands on a second-by-second basis.[1047] [1048] [1049] [1050] [1051] [1052] [1053]
* Because solar panels only generate electricity when the sun is shining, and utility-scale electricity cannot be easily stored, most solar power capacity must be backed-up by other energy sources that can generate electricity on demand, such as natural gas power plants.[1054] [1055] [1056] [1057] [1058]
* As the amount of solar capacity rises in a given region, so do the costs of backing up its intermittent energy output.[1059] [1060] [1061] Reliance on solar as a major energy source can contribute to electricity blackouts during dangerous weather conditions.[1062] [1063] [1064] [1065] [1066]
* Geothermal energy is harnessed by transferring heat from or to the earth. The current main geothermal technologies include:
* Since ancient times, people have used hot springs for bathing, cooking, and heating.[1072]
* The world’s first electricity-generating geothermal plant was built in 1904 in Tuscany, Italy.[1073]
* From 1960 through 2021, the portion of U.S. primary energy supplied by geothermal power grew from 0.001% to 0.2%:

* In 2021, geothermal generated 0.4% of all electricity produced in the U.S.[1075]
* Electricity-generating geothermal plants are typically built at sites where geothermal reservoirs are not buried too deeply. In the U.S., such resources are mostly in the western states and Hawaii.[1076] [1077]
* Choosing between different forms of energy often involves tradeoffs between competing objectives, such as affordability, environmental impacts, and energy security. These tradeoffs are sometimes impossible to objectively quantify.[1078] [1079] [1080] [1081] [1082]
* A 2019 Reuters poll of 3,281 Americans found that 78% believed the government should “invest more money to develop clean energy sources such as solar, wind and geothermal.” When asked how much of the cost they were willing to bear:
* A 2010 Rasmussen poll of 1,000 likely voters found that:
* A 2008 Harris poll of 1,020 U.S. adults found that 92% favored “a large increase in the number of wind farms.”[1086] The same poll found that among 787 U.S. adults who pay household energy bills:
* During 2021, the average cost of ethanol without federal subsidies was 35% higher than gasoline, and the average cost of biodiesel without federal subsidies was 98% higher than gasoline.[1088]
* Per a 1992 report by the U.S. Energy Information Administration:
* “Subsidies,” as defined by the U.S. Government Accountability Office, are “payments or benefits provided to encourage certain desired activities or behaviors.”[1090]
* Per the U.S. Energy Information Administration (EIA), subsidies “stimulate the production or consumption of a commodity over what it would otherwise have been.”[1091]
* EIA classifies government energy subsidies into two main categories: direct and indirect. Direct subsidies have explicit effects on government budgets, while indirect subsidies do not. For instance, tax breaks for the production of certain energy products are direct subsidies because they produce readily identifiable changes in tax revenues. In contrast, government mandates that require the use of certain energy products are indirect subsidies because the effects don’t appear as line items in government budgets, but they still impact energy consumers and producers.[1092] [1093] [1094]
* The reasons that are given for enacting energy subsidies include but are not limited to:
* Other consequences of government energy subsidies include but are not limited to:
* Forms of energy subsidies include but are not limited to:
* Examples of subsidies for:
* As of September 2022, neither EIA nor the Congressional Budget Office (CBO) has published annual historical data providing a comprehensive and consistent measure of direct federal energy subsidies.[1168] [1169] [1170] [1171] [1172] [1173] EIA has published such data for certain years, although the level of detail varies, and definitions of what constitutes direct subsidies are not always consistent.[1174] CBO has published data on federal energy-related tax preferences going back to 1977. These EIA and CBO data are reviewed below. They do not account for:
* Per EIA, energy subsidies in the range of one percent of total energy sales are “in general, too small to have a significant effect on the overall level of energy prices and consumption in the United States.”[1179] Likewise, per EIA, “market impacts are negligible” for “programs that offer small subsidies for products for which there are huge existing markets….”[1180]
|
Year |
Direct Federal Energy Subsidies as a Portion of Total Energy Sales |
|
1990[1181] |
1–2% |
|
1999[1182] |
0.7% |
|
2007[1183] |
1.4% |
|
2010[1184] |
3.1% |
|
2013[1185] |
2.1% |
|
2016[1186] |
1.4% |
* Energy tax preferences, unlike R&D subsidies, are “directly linked” to energy production, consumption or conservation, and individuals and corporations must take “specified actions” to receive these subsides.[1187] [1188]
* From 1985 through 2016, inflation-adjusted federal tax preferences for:
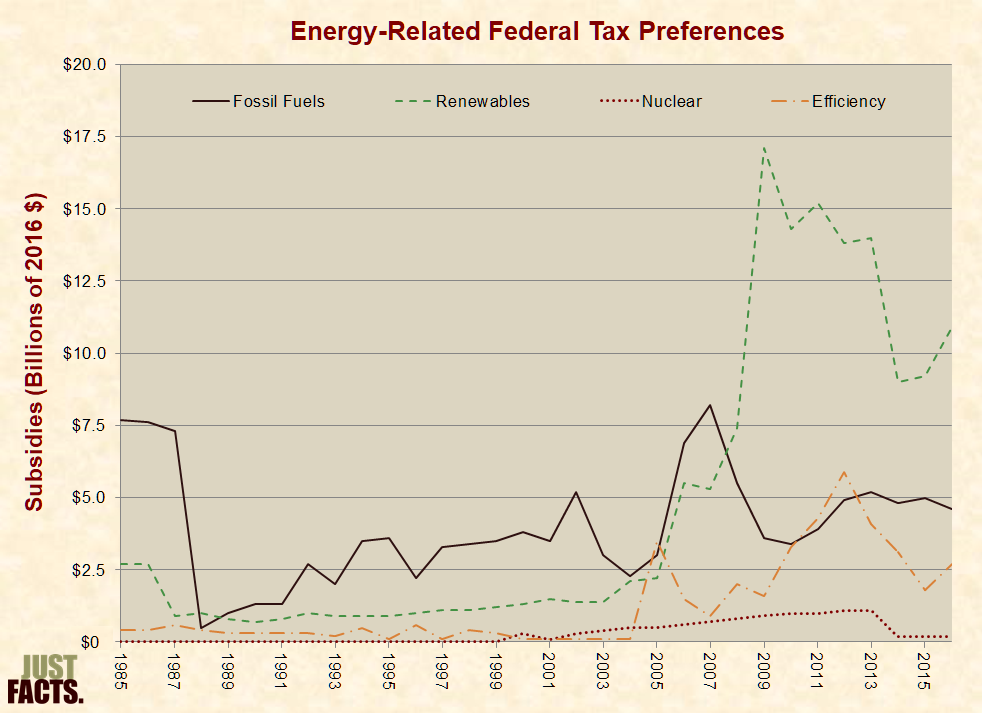
* Per EIA, “some forms of energy receive subsidies that are substantial relative to” the energy they produce, and thus, a “per-unit measure” of energy subsidies “may provide a better indicator of its market impact than an absolute measure.”[1191] [1192] For example, in 2010, coal received federal electricity production subsidies totaling $1,189 million, while solar received $968 million.[1193] However, coal produced 44.9% of the nation’s electricity, and solar produced 0.1%.[1194] [1195]
* From 1985 through 2016, inflation-adjusted federal tax preferences per unit of primary energy production for:
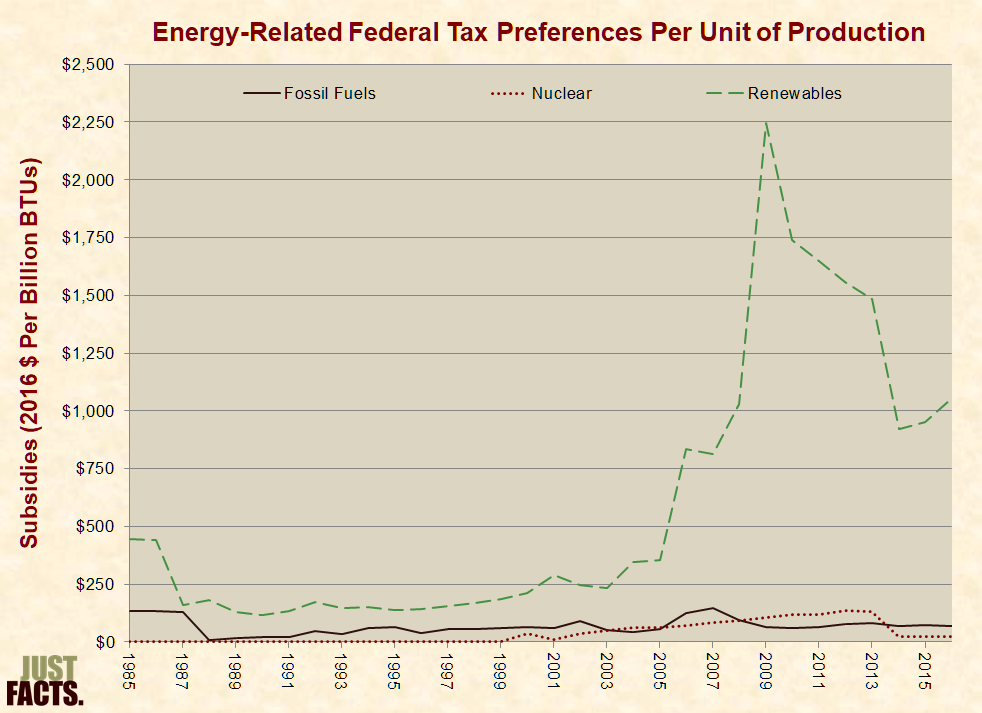
* Aggregating energy subsidies into broad categories (like fossil fuels and renewables) can obscure their nature, because specific components of these broad categories sometimes receive relatively large portions of the subsidies. Per EIA, federal energy subsidies are often “targeted at narrow segments of the energy industry” and provide “relatively large payments to producers using specific energy technologies that otherwise would be uneconomical.”[1198] [1199] For example:
* EIA has published comprehensive accountings of direct federal energy subsides for 1992, 1999, 2007, 2010, 2013, and 2016. Only the last four of these disaggregate subsidies for specific renewables, like wind, solar, and biofuels.[1210] [1211] [1212] [1213] [1214] [1215] Combining this data with EIA’s primary energy production data reveals the following levels of inflation-adjusted per-unit energy subsidies:
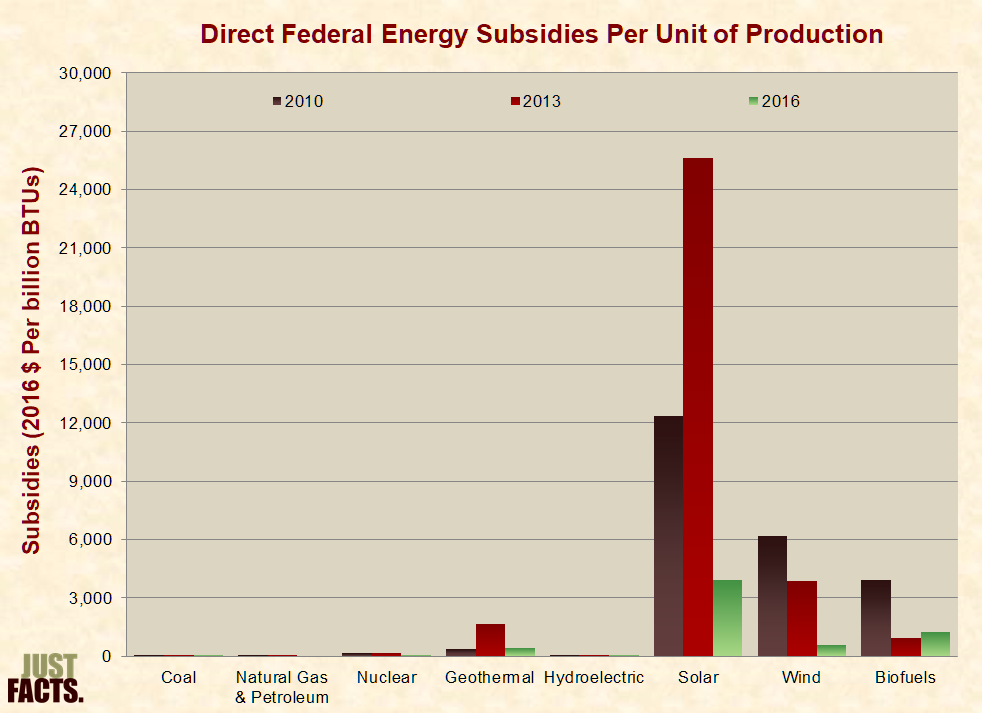
|
Direct Federal Energy Subsidies Per Billion Btu |
||||
|
2007 |
2010 |
2013 |
2016 |
|
|
Coal |
$185 |
$48 |
$55 |
$86 |
|
Natural Gas & Petroleum |
$67 |
$82 |
$63 |
-$15 |
|
Nuclear |
$221 |
$182 |
$169 |
$43 |
|
Geothermal |
$82 |
$399 |
$1,673 |
$410 |
|
Hydroelectric |
$76 |
$37 |
$91 |
$15 |
|
Solar |
$2,984 |
$12,334 |
$25,637 |
$3,923 |
|
Wind |
$1,524 |
$6,178 |
$3,864 |
$604 |
|
Biofuels |
$4,493 |
$3,930 |
$948 |
$1,237 |
* Per EIA, there can be considerable lag times between subsidies and their effects on energy production. Thus, subsidies divided by production in any given year are not always representative of the larger picture. For example, many subsidies during 2007–2010 were provided to facilities still under construction as of 2011. Also, subsidies for research and development (R&D) of new technologies can take “many years” to yield results.[1218] However, EIA has noted that the outcomes of R&D subsidies are “inherently uncertain,” and:
* To reduce greenhouse gases, government officials and scientists have proposed increasing taxes on electricity,[1228] gasoline,[1229] crude oil,[1230] steel and aluminum,[1231] flying and driving,[1232] [1233] or any activity that emits carbon dioxide.[1234]
* Excise taxes are similar to sales taxes, except that they are imposed on specific goods and services.[1235] [1236]
* In addition to raising government revenue, excise taxes are sometimes levied to discourage or penalize certain activities.[1237] [1238] [1239] Per the U.S. Energy Information Administration:
* In 2022, excise taxes on gasoline averaged 57 cents per gallon across the United States. State governments collected 39 cents per gallon, and the federal government collected 18 cents.[1241]
* In 2020, state and federal governments collected about $87 billion in motor fuel excise taxes.[1242] This equates to 9% of total U.S. energy expenditures and 21% of U.S. transportation sector energy expenses.[1243]
* The economic burden of excise taxes primarily falls on retail customers in the form of higher prices. Per the Congressional Budget Office:
* From 2007 to 2017, companies in the S&P 500 paid an average of 30% in federal, state, local, and foreign corporate income taxes. Among energy sector companies in the S&P 500, the average corporate income tax rate was 37%.[1248] [1249]
* The burden of corporate income taxes falls upon: (1) business owners in the form of decreased profits, (2) workers in the form of reduced wages, and (3) possibly consumers in the form of higher prices.[1250] [1251]
* The Congressional Budget Office (CBO) estimates that 75% of corporate income taxes are borne by owners/stockholders and 25% are borne by workers.[1252] Other creditable sources estimate that owners/stockholders bear anywhere from 33% to 100% of this tax burden.[1253] For more detail, see Just Facts’ research on tax distribution.
* Per the U.S. Energy Information Administration (EIA):
* Regulatory costs for hydroelectric power plants increased from 5% of the total costs of generating hydroelectricity in 1980 to 25–30% of the costs in 2010.[1255] [1256] [1257]
* Regulation of hydropower plants has sometimes reduced output from wind farms.[1258]
* Regulations on the sulfur content of diesel fuel have played a role in raising the price of diesel above that of gasoline.[1259]
* The German government requires that renewable energy sources such as wind and solar replace all nuclear and coal plants in the country by 2038.[1260] To achieve this goal, the government has imposed fees and taxes on consumers and forced electrical grid operators to prioritize renewables over other energy sources.[1261] [1262] In Germany during 2021:
* As a result of surging energy costs caused by Germany’s “green energy” regulations:
* During a 2008 interview with the San Francisco Chronicle, Barack Obama stated:
* In 2009, the U.S. House of Representatives passed a bill that would have capped most sources of greenhouse gas emissions in the U.S. at 17% below 2005 levels by 2020 and at 83% below 2005 levels by 2050.[1274] This bill passed the House by a vote of 219–212, with 82% of Democrats voting for it and 94% of Republicans voting against it.[1275] The bill was then forwarded to the Senate and never voted upon.[1276]
* In 2009, the Obama administration Environmental Protection Agency (EPA) issued a finding that greenhouse gases “threaten the public health and welfare of current and future generations.” This finding allows the EPA to regulate greenhouse gases under the Clean Air Act.[1277] [1278]
* In 2013, the Obama administration made a regulatory decision that a metric ton of carbon dioxide (CO2) has a “social cost” of $38. This figure is used by EPA and other agencies under the authority of the president to assess and justify regulations on greenhouse gases.[1279] [1280] [1281]
* Per EIA projections made in 2013, a CO2 tax of $25 per metric ton that begins in 2014 and grows to $37 in 2022 would increase gasoline prices by 11% and electricity prices by 30% in 2022. These increases are relative to a situation in which no government greenhouse gas reduction policies are enacted and “market investment decisions are not altered in anticipation of such a policy.”[1282]
* In 2019, the Trump administration repealed and replaced the Obama administration regulations that governed power plant CO2 emissions.[1283] [1284]
* In 2021, a federal appeals court cancelled the Trump administration regulations, but it did not clearly restore the Obama administration regulations.[1285] [1286] [1287]
* In 2022, the U.S. Supreme Court ruled that the EPA did not have “clear congressional authorization” to regulate power plant CO2 emissions.[1288]
* The U.S. Department of the Interior (DOI), which is under the authority of the president, manages 500 million acres or about one fifth of all U.S. surface land and more than three times as much acreage in offshore areas. DOI leases some of these lands for energy projects such as oil drilling and solar energy facilities.[1289] [1290] [1291] Since 2003, the energy from fossil fuels produced on federal and American Indian lands has varied as follows:
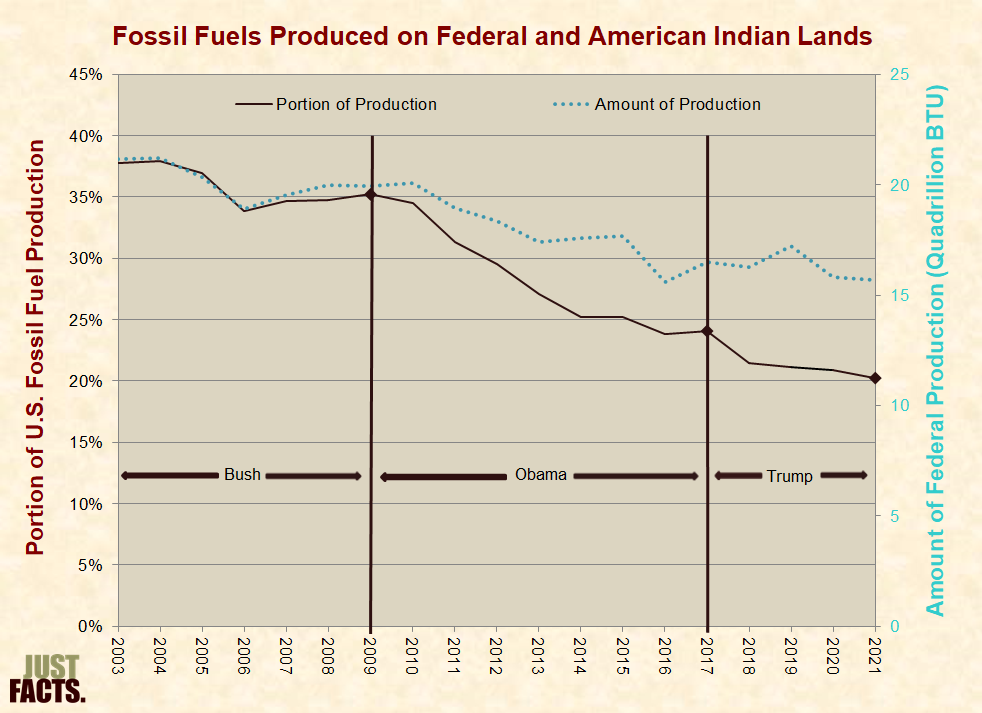
* A 2013 paper in the journal Wildlife Society Bulletin estimated that 888,000 bats and 573,000 birds are killed each year by wind turbines in the U.S. Approximately 83,000 of the bird fatalities are raptors such as hawks, eagles, owls and falcons, which are protected under federal and state laws.[1293] [1294]
* An investigation published by the Associated Press in May 2014 found that:
* In November 2013, the Associated Press reported that the Obama administration:
* In December 2013, the Obama administration issued a regulation that allows it to give permits to wind farms to accidentally kill eagles for periods of up to 30 years.[1297]
* In June 2014, the Obama administration gave a permit to a California wind farm that allows it to kill up to five golden eagles over five years.[1298]
* In December 2017, the Trump administration issued a ruling that states:
* In 2021, the Biden administration revoked the Trump administration’s ruling. The new rule will allow federal prosecution for the accidental injury or death of birds.[1302] [1303]
* Some natural gas and oil resources are located in semi-porous or non-porous rocks that don’t allow the fuel to freely flow when accessed through drilling. Such fuels are often found in shale formations and are referred to as “tight oil” and “tight gas.” These resources can be extracted by using a combination of technologies known as horizontal drilling and hydraulic fracturing.[1304] [1305] [1306] [1307]
* Horizontal drilling involves penetrating the ground vertically (like traditional drilling) and then turning horizontally in order to drill along the layer that contains the fossil fuel resources. This method of drilling exposes more of the fossil fuel resources to the bore of each well, thus increasing yields and decreasing the surface footprint of drilling operations.[1308] [1309]
* Horizontal drilling was first successfully employed in 1929 and has been used commercially since the late 1980s. By 1990, more than 1,000 horizontal wells were drilled worldwide, almost all for the purpose of extracting crude oil.[1311]
* Hydraulic fracturing or fracking involves injecting fluids at high pressures from the bore of a well into the layer that contains the fossil fuel resources. This process creates fractures in the rock, which allows the fuels to flow to the bore of the well. The fluids used for fracking typically contain sand or ceramic beads that serve to hold open the fractures after they have been created. This fluid also contains varying chemicals that are used for purposes such as preventing pipe corrosion.[1312] [1313] (A detailed description of the process is shown in the video below.)
* Hydraulic fracturing was first successfully employed to drill for oil in 1947 and has been used commercially since the 1950s. By 1955, more than 100,000 fracking treatments were performed. In the 1980s and early 1990s, Texas oilman George Mitchell refined the process of fracking to extract natural gas from shale in a cost-effective manner.[1314] [1315]
* In the early 2000s, horizontal drilling coupled with hydraulic fracturing became widely used to extract tight gas. In the mid-2000s, the combination of these technologies also became widely used to extract tight oil.[1316] [1317] [1318] The process is shown in this video:
* From 2005 to 2021, U.S. natural gas production increased by 89%, primarily due to the use of horizontal drilling coupled with hydraulic fracturing in shale formations.[1319] [1320] [1321] [1322] [1323]
* From 2005 to 2021, U.S. crude oil production increased by 128%, primarily due to the use of horizontal drilling coupled with hydraulic fracturing in tight oil formations.[1324] [1325] [1326] [1327] [1328] [1329] [1330]
* In 2019, the U.S. Energy Information Administration reported that conventional drilling was “becoming less common” and that “horizontal drilling combined with hydraulic fracturing have become standard practice for oil and natural gas production in the United States.”[1331] [1332]
* In 2021, horizontal drilling coupled with hydraulic fracturing provided about:
* Per a 2012 U.S. Government Accountability Office (GAO) report:
* The primary concern about fracking is that the fuels it releases from tight formations will migrate to the surface of the earth and contaminate wells and other bodies of water.[1338]
* In areas that are rich in petroleum and natural gas (methane), these fuels commonly seep up to ground level through natural processes:
* Because methane is odorless, invisible, and generally nontoxic, people who have naturally occurring methane in their wells may be unaware of it until they test for it.[1345] [1346]
* Fracking is typically performed at depths of 6,000 to 10,000 feet, and the fractures can extend for several hundred feet. Drinking water is commonly located at depths of less than 1,000 feet.[1347]
* As with conventional drilling and other industrial processes (including biofuel production), in cases of accidents and negligence, fracking can and has caused gas leaks, contaminant spills, and other environmental damage.[1348] [1349]
* In May of 2011, Lisa Jackson—head of the Obama administration EPA—stated: “I’m not aware of any proven case where the fracking process itself affected water, although there are investigations ongoing.”[1350]
* A 2012 GAO evaluation of three major studies and a series of interviews with regulatory officials in eight states found no proven cases where groundwater contamination was caused by properly conducted fracking. However, GAO noted that:
* In 2014, the U.S. Department of Energy published the results of an investigation to determine if natural gas or fracking fluids had migrated upward to an underground gas field that is “1,300 feet below the deepest known groundwater aquifer” at six fracking wells in Greene County, Pennsylvania. The study found there was “no detectable migration of gas or aqueous fluids” to the gas field.[1352]
[1] Entry: “energy.” Oxford Dictionary of Biochemistry and Molecular Biology. Oxford University Press, 1997.
Page 207: “The capacity of a system for doing work. There are various forms of energy—potential, kinetic, electrical, chemical, nuclear, and radiant—which can be interconverted by suitable means.”
[2] Booklet: “Energy, Powering Your World.” By M.T. Westra and S. Kuyvenhoven. Foundation for Fundamental Research on Matter, Institute for Plasma Physics, Rijnhuizen (the Netherlands), 2002. <fire.pppl.gov>
Page 2:
Energy appears in many forms, such as motion, heat, light, chemical bonds, and electricity. If you have studied physics, you may know that even mass is a form of energy. We say that energy is present in energy sources, like wood, wind, food, gas, coal, and oil. All these different forms of energy have one thing in common—that we can use them to accomplish something we want. We use energy to set things in motion, to change temperatures, and to make light and sound. So we may say: Energy is the capacity to do useful work.
[3] Report: “Annual Energy Review 2011.” U.S. Energy Information Administration, Office of Energy Statistics, September 2012. <www.eia.gov>
Page 355:
Energy: the capacity for doing work as measured by the capability of doing work (potential energy) or the conversion of this capability to motion (kinetic energy). Energy has several forms, some of which are easily convertible and can be changed to another form useful for work. Most of the world’s convertible energy comes from fossil fuels that are burned to produce heat that is then used as a transfer medium to mechanical or other means in order to accomplish tasks. Electric energy is usually measured in kilowatthours, while heat energy is usually measured in British thermal units.
[4] Book: Applied Energy: An Introduction. By Mohammad Omar Abdullah. CRC Press, 2013.
Page 1: “Generally, energy forms are either potential or kinetic. Potential energy comes in forms that are stored including chemical, gravitational, mechanical, and nuclear energy. Kinetic energy forms are used for doing a variety of work, for instance, electrical, chemical, electrochemical energy, thermal (heat), electromagnetic (light), motion, and vibration (sound energy).”
[5] Report: “Annual Energy Review 2011.” U.S. Energy Information Administration, Office of Energy Statistics, September 2012. <www.eia.gov>
Page 350:
British Thermal Unit (Btu): the quantity of heat required to raise the temperature of 1 pound of liquid water by 1 degree Fahrenheit at the temperature at which water has its greatest density (approximately 39 degrees Fahrenheit). …
Btu Conversion Factor: A factor for converting energy data between one unit of measurement and British thermal units (Btu). Btu conversion factors are generally used to convert energy data from physical units of measure (such as barrels, cubic feet, or short tons) into the energy-equivalent measure of Btu.
[6] Booklet: “Energy, Powering Your World.” By M.T. Westra and S. Kuyvenhoven. Foundation for Fundamental Research on Matter, Institute for Plasma Physics, Rijnhuizen (the Netherlands), 2002. <fire.pppl.gov>
Page 14:
Energy is measured in joules (J), and 1 joule is the amount of energy needed to lift a mass of a hundred grams over one meter. So, if you lift an apple one meter, you need one joule of energy to do it. And we can go on: for two meters, you need 2 joules, and to lift 1 kg 1 meter, you need 10 joules. … All forms of energy can be expressed in joules. For example, when one litre of petrol is burned, it releases 28 MJ [mega joules] of energy.
[7] Book: Physics. By David Halliday and Robert Resnick. John Wiley & Sons, 1978.
Page 151: “Energy may be transformed from one kind to another, but it cannot be created or destroyed; the total energy is constant. This statement is a generalization from our experience, so far not contradicted by observation of nature. … The energy concept now permeates all of physical science and has become one of the unifying ideas of physics.”
Page 154: “Einstein wrote: ‘Pre-relativity physics contains two conservation laws of fundamental importance, namely the law of conservation of energy and the law of conservation of mass; these two appear as completely independent of each other. Through relativity theory they melt together into one principle.’ ”
[8] Book: Physics: the Easy Way (3rd edition). By Robert L. Lehrman. Barron’s Educational Series, 1998.
Page 132:
No exception has ever been detected to the rule that any increase in one form of energy is matched by a corresponding decrease. This has led to the statement known as the first law of thermodynamics, or the law of conservation of energy: in any interaction, the total amount of energy does not change. If a stick of dynamite explodes, the chemical energy stored in the dynamite is exactly equal to the energy of the heat, violent motion, sound, and light produced in the explosion and the remaining chemical energy in the gases produced in the explosion.
[9] Book: Six Easy Pieces: Essentials of Physics Explained By Its Most Brilliant Teacher. Addison-Wesley, 1995. This book is comprised of six chapters taken from the book Lectures on Physics by Richard Feynman. Addison-Wesley, 1963.
Page 69: “There is a fact, or if you wish, a law, governing all natural phenomena that are known to date. There is no known exception to this law—it is exact as far as we know. The law is called the conservation of energy.”
[10] Book: Warmth Disperses and Time Passes: the History of Heat. By Hans Christian von Baeyer. Modern Library, 1999.
Pages 127–128:
The law of conservation of energy, reborn as the law of conservation of mass/energy, has established itself as one of the few unshakable theoretical guideposts in the wilderness of the world of our sense experiences. In scope and generality it surpasses Newton’s laws of motion, Maxwell’s equations for electricity and magnetism, and even Einstein’s potent little E = mc2. It survived not only the storms of the quantum revolution … but also the flood of cosmological discoveries that shattered ancient preconceptions about the permanence and simplicity of the universe. … It comes as close to an absolute truth as our uncertain age will permit.
[11] Booklet: “What You Need to Know About Energy.” National Academy of Sciences, 2008. <nap.nationalacademies.org>
By the time energy is delivered to us in a usable form, it has typically undergone several conversions. Every time energy changes forms, some portion is “lost.” It doesn’t disappear, of course. In nature, energy is always conserved. That is, there is exactly as much of it around after something happens as there was before. But with each change, some amount of the original energy turns into forms we don’t want or can’t use, typically as so-called waste heat that is so diffuse it can’t be captured.
[12] Textbook: Energy Economics: Concepts, Issues, Markets and Governance. By Subhes C. Bhattacharyya. Springer-Verlag, 2011.
Page 10: “The second law of thermodynamics on the other hand introduces the concept of quality of energy. It suggests that any conversion involves generation of low grade energy that cannot be used for useful work and this cannot be eliminated altogether. This imposes physical restriction on the use of energy.”
[13] Article: “The Second Law of Thermodynamics.” New Encyclopaedia Britannica: Macropædia—Knowledge in Depth (Volume 28), 2002.
Page 623: “The second law applies to every type of process—physical, natural, biological, and industrial or technological—and examples of its validity can be seen in life every day.”
[14] Book: Elements of Classical Thermodynamics for Advanced Students of Physics. By A. B. Pippard. Cambridge University Press, 1981.
Page 30: “Moreover, the consequences of the [second] law are so unfailingly verified by experiment that it has come to be regarded as among the most firmly established of all the laws of nature.”
[15] Booklet: “Energy, Powering Your World.” By M.T. Westra and S. Kuyvenhoven. Foundation for Fundamental Research on Matter, Institute for Plasma Physics, Rijnhuizen (the Netherlands), 2002. <fire.pppl.gov>
Page 2: “Energy is so normal to us, we hardly notice it. When we take a hot shower in the morning, we use energy. To wash we need soap and a towel, which were made in factories that use energy. The bricks, concrete and windows of your room were made using energy. Our clothes and shoes were also made using energy.”
Page 3: “Energy is important to us because we use it to do the things we need, which we call energy services. Among the energy services are cooling and refrigeration, space heating, food-processing, water-cleaning, using mobile phones, driving a car or motorbike, making light and sound, the manufacture of products, and many more.”
Page 22:
Some industries use more energy than others. There are six industrial sectors that are the biggest consumers:
• Power plants, oil refinery and coal transformation processes require large amounts of energy to transform energy in the form that is needed.
• Iron and Steel: the reduction of iron ores into metal is energy intensive, as well as the production of steel.
• Chemicals: basic chemicals used elsewhere in industry, plastics and synthetic fibres, and final products like drugs, cosmetics, fertilizers, et.
• Paper and allied products: for the manufacturing of pulps from woods or other cellulose fibres, and for the manufacturing of paper and final products (i.e. napkins, etc.).
• Non ferrous metal industries: for the melting and refining of metallic materials (copper, steel, aluminum) from ore or scrap. It includes also the manufacturing of the final metal products, such as sheets, bars, rods, plates, etc.
• Non metallic materials, such as cement, glass, and all forms of bricks require a lot of energy in special ovens.
[16] Calculated with data from:
a) Report: “July 2022 Monthly Energy Review.” U.S. Energy Information Administration, Office of Energy Statistics, July 26, 2022. <www.eia.gov>
Page 19: “Table 1.7 Primary Energy Consumption, Energy Expenditures, and Carbon Dioxide Emissions Indicators … Primary Energy Consumptiona … Consumption Per Capita (Million Btu) … 2021 [=] 293”
b) Booklet: “Energy, Powering Your World.” By M.T. Westra and S. Kuyvenhoven. Foundation for Fundamental Research on Matter, Institute for Plasma Physics, Rijnhuizen (the Netherlands), 2002. <fire.pppl.gov>
Pages 16–17: “Let’s say you hire a first-class athlete to make this much energy for you, for example on bicycle driving a generator. An athlete can generate 300 watts for several hours, so it will take him about three hours of hard work!”
Page 21: “An average person can generate about 50 watt continuously, which is 1.57·109 joules in a year (working all day and night, all days of the week, all weeks of the year).”
c) Webpage: “Glossary.” U.S. Energy Information Administration. Accessed July 18, 2013 at <www.eia.gov>
“1 Btu is approximately equal to 1,055 joules.”
CALCULATION: 293,000,000 Btu/year × 1,055 joules/Btu / 1,570,000,000 joules/person/year = 197 people
[17] Calculated with data from:
a) Booklet: “Energy, Powering Your World.” By M.T. Westra and S. Kuyvenhoven. Foundation for Fundamental Research on Matter, Institute for Plasma Physics, Rijnhuizen (the Netherlands), 2002. <fire.pppl.gov>
Page 21: “An average person can generate about 50 watt continuously, which is 1.57·109 joules in a year (working all day and night, all days of the week, all weeks of the year).”
Page 22: “For each material that is made, a certain amount of energy was required to make it. This is called the embodied energy. … An average house may easily embody up to 900,000 mega joule! Table 8. Energy embodied in common construction materials … Embodied energy in MJ [megajoules] per kg … Clays bricks [=] 2.5”
b) Webpage: “Glossary.” U.S. Energy Information Administration. Accessed July 18, 2013 at <www.eia.gov>
“1 Btu is approximately equal to 1,055 joules.”
c) Webpage: “8 in. x 2-1/4 in. x 4 in. Clay Brick, Model # RED0126MCO.” Home Depot. Accessed August 14, 2013 at <www.homedepot.com>
“Product Weight (lb.) [=] 5”
CALCULATIONS:
[18] Report: “July 2022 Monthly Energy Review.” U.S. Energy Information Administration, Office of Energy Statistics, July 26, 2022. <www.eia.gov>
Page 19: “Table 1.7 Primary Energy Consumption, Energy Expenditures, and Carbon Dioxide Emissions Indicators … Energy Expendituresb … Expenditures (Million Nominal Dollarsg) … 2020 [=] 1,007,433 … b Expenditures include taxes where data are available.”
[19] Report: “July 2022 Monthly Energy Review.” U.S. Energy Information Administration, Office of Energy Statistics, July 26, 2022. <www.eia.gov>
Page 19: “Table 1.7 Primary Energy Consumption, Energy Expenditures, and Carbon Dioxide Emissions Indicators … Energy Expendituresb … Expenditures Per Capita (Nominal Dollarsg) … 2020 [=] 3,039 … b Expenditures include taxes where data are available.”
[20] Calculated with the dataset: “HH-1. Households by Type: 1940 to Present (Numbers in Thousands).” U.S. Census Bureau, Current Population Survey, November 2021. <www.census.gov>
“Year [=] 2020 … Total households [=] 128,451
CALCULATION: $1,007,433,000,000 energy expenditures / 128,451,000 households = $7,843 energy expenditures/household
[21] Report: “July 2022 Monthly Energy Review.” U.S. Energy Information Administration, Office of Energy Statistics, July 26, 2022. <www.eia.gov>
Page 19: “Table 1.7 Primary Energy Consumption, Energy Expenditures, and Carbon Dioxide Emissions Indicators … Energy Expendituresb … Expenditures as Share of GDPe (Percent) … 2020 [=] 4.8 … b Expenditures include taxes where data are available. … R = Revised.”
[22] Report: “July 2022 Monthly Energy Review.” U.S. Energy Information Administration, Office of Energy Statistics, July 26, 2022. <www.eia.gov>
Page 19: “Table 1.7 Primary Energy Consumption, Energy Expenditures, and Carbon Dioxide Emissions Indicators.”
[23] Book: Fifty Major Economists. By Steven Pressman. Routledge, 2006.
Pages 79–80:
[I]n the 1970s when OPEC [Organization of Petroleum Exporting Countries] raised oil prices, consumers wound up paying more for gasoline and heating oil. With more consumer dollars going to energy-related products, less could be spent on other goods. As a result, producers of these other goods had to cut back production and lay off workers. These layoffs, in turn, would further reduce consumer spending, leading to further production cutbacks and layoffs.
In addition, the energy shock affected the costs of producing goods. Even those goods using little energy in production still require energy when transported from where they are produced to where consumers buy them. Similarly, the parts required for production have to be transported from elsewhere. On the other hand, the layoffs due to reduced spending will push down wages. Consequently, the rising costs of energy should increase the price of some goods (those using little energy and much labor). Consumers will tend to cut back their spending on those goods whose prices rise, and will buy more goods whose prices fall or remain stable.
[24] Textbook: Energy Economics: Concepts, Issues, Markets and Governance. By Subhes C. Bhattacharyya. Springer-Verlag, 2011.
Page 1: “Energy being an ingredient for any economic activity, its availability or lack of it affects the society and consequently, there are greater societal concerns and influences affecting the sector.”
Page 4: “The key role of the energy sector in the economic activities of any economy arises because of the mutual interdependence between economic activities and energy. For example, the energy sector uses inputs from various other sectors (industry, transport, households, etc.) and is also a key input for most of the sectors.”
Page 429:
[with rising] oil prices …
2. The cost of production of goods and services rises, which puts pressure on profits of the firms. The effect depends on the energy intensity of production: normally developed countries with lower energy intensity are expected to face lower pressure than the developing countries.
3. Higher costs of goods and services put pressure on general price levels, fueling inflation.
4. Higher costs and inflation, and lower profit margins would put pressures on demand, wages and employment, affecting the economic activities.
5. Effects on economic activities influence financial markets, interest rates and exchange rates.
[25] Report: “Rising Gasoline Prices 2012.” By Neelesh Nerurkar and Robert Pirog. Congressional Research Service, March 1, 2012. <fas.org>
Page 2 (of PDF): “Higher gasoline prices burden the budgets of households and businesses. Higher gasoline costs can increase indebtedness or reduce spending on other goods and services.”
[26] Calculated with data from:
a) Dataset: “Clean Cooking Access Database.” World Energy Outlook, International Energy Agency, 2021. <www.iea.org>
“Tab: “Summary”: Access to Clean Cooking, Summary by Region … Population Without Access (million) … World … 2020 [=] 2,585”
b) Dataset: “World Population Prospects 2022, Estimates 1950–2021.” United Nations, Population Division, Department of Economic and Social Affairs, July 2022. <population.un.org>
“Tab: “Estimates”: Region, Subregion, Country or Area [=] World … Population … Total Population, as of 1 January (thousands) … 2020 [=] 7,804,973.773”
CALCULATION: 2,585,000,000 without access / 7,804,973,773 population = 33%
[27] Article: “Defining Energy Access: 2020 Methodology.” International Energy Agency, October 13, 2020. <www.iea.org>
There is no single internationally-accepted and internationally-adopted definition of modern energy access. Yet significant commonality exists across definitions, including:
• Household access to a minimum level of electricity.
• Household access to safer and more sustainable (i.e. minimum harmful effects on health and the environment as possible) cooking and heating fuels and stoves.
• Access to modern energy that enables productive economic activity, e.g. mechanical power for agriculture, textile and other industries.
• Access to modern energy for public services, e.g. electricity for health facilities, schools and street lighting.
All of these elements are crucial to economic and social development, as are a number of related issues that are sometimes referred to collectively as “quality of supply,” such as technical availability, adequacy, reliability, convenience, safety and affordability.
However, due to data constraints, the data and projections presented in WEO [World Energy Outlook] focus on two elements of energy access: a household having access to electricity and to a relatively clean, safe means of cooking. These are measured separately. We maintain databases on levels of national, urban and rural electrification rates and on the proportion of the population without clean cooking access. Both databases are regularly updated and form the baseline for WEO energy access scenarios to 2040. …
Access to clean cooking facilities means access to (and primary use of) modern fuels and technologies, including natural gas, liquefied petroleum gas (LPG), electricity and biogas, or improved biomass cookstoves (ICS) that have considerably lower emissions and higher efficiencies than traditional three-stone fires for cooking. … For clean cooking, the database reports on the share of population without clean cooking access, defined as a household having primarily reliance on biomass, coal or kerosene for their cooking needs.
[28] Booklet: “Energy, Powering Your World.” By M.T. Westra and S. Kuyvenhoven. Foundation for Fundamental Research on Matter, Institute for Plasma Physics, Rijnhuizen (the Netherlands), 2002. <fire.pppl.gov>
Page 9: “Around two billion people, one-third of the world population, does not have access to modern forms of energy, and therefore lack the comfort, health, mobility and productivity that modern energy makes possible.”
Page 38: “Biomass was one of the first sources of energy known to mankind, and it continues to be a major source of energy in much of the developing world. Something like 80% of the total energy demand in the developing world is covered by biomass energy, mostly in the form of firewood.”
Page 43:
At the lower end of the ladder, people use more of their own energy, for example to gather wood. Fuel gathering at the lower end of the ladder is a major burden for women and children, because of the heavy loads and the long time it takes. For example, in developing countries women and children spend 9 to 12 hours a week on firewood collection. In Nepal, women spend even two and a half hours every day collecting firewood (the men spend forty-five minutes).
Poor people spend a large part of their time collecting the energy they need. This time cannot be spent in producing things that can be sold, working on the land, or learning. This is called the poverty trap: once you are poor, it is very hard to get out of poverty again, because you need to spend all your time in survival activities. This normally leaves very little time to do things that might get you out of poverty, like education, or production of goods to sell on the market.
[29] Webpage: “Household Air Pollution and Health” World Health Organization, July 26, 2022. <www.who.int>
Worldwide, around 2.4 billion people still cook using solid fuels (such as wood, crop waste, charcoal, coal and dung) and kerosene in open fires and inefficient stoves.1 Most of these people are poor and live in low- and middle-income countries.
Household air pollution is generated by the use of inefficient and polluting fuels and technologies in and around the home that contains a range of health-damaging pollutants, including small particles that penetrate deep into the lungs and enter the bloodstream. In poorly ventilated dwellings, indoor smoke can have levels of fine particles 100 times higher than acceptable. Exposure is particularly high among women and children, who spend the most time near the domestic hearth. Reliance on polluting fuels and technologies also require significant time for cooking on an inefficient device, and gathering and preparing fuel. …
Impacts on Health
Each year, 3.2 million people die prematurely from illnesses attributable to the household air pollution caused by the incomplete combustion of solid fuels and kerosene used for cooking (see household air pollution data for details). Particulate matter and other pollutants in household air pollution inflame the airways and lungs, impair immune response and reduce the oxygen-carrying capacity of the blood.
Among these 3.2 million deaths from household air pollution exposure:
• 32% are from ischaemic heart disease: 12% of all deaths due to ischaemic heart disease, accounting for over a million premature deaths annually, can be attributed to exposure to household air pollution;
• 23% are from stroke: approximately 12% of all deaths due to stroke can be attributed to the daily exposure to household air pollution arising from using solid fuels and kerosene at home;
• 21% are due to lower respiratory infection: exposure to household air pollution almost doubles the risk for childhood LRI and is responsible for 44% of all pneumonia deaths in children less than 5 years old. Household air pollution is a risk for acute lower respiratory infections in adults and contributes to 22% of all adult deaths due to pneumonia;
• 19% are from chronic obstructive pulmonary disease (COPD): 23% of all deaths from chronic obstructive pulmonary disease (COPD) in adults in low- and middle-income countries are due to exposure to household air pollution; and
• 6% are from lung cancer: approximately 11% of lung cancer deaths in adults are attributable to exposure to carcinogens from household air pollution caused by using kerosene or solid fuels like wood, charcoal or coal for household energy needs. …
Impacts on Health Equity, Development and Climate Change …
• Women and children disproportionately bear the greatest health burden from polluting fuels and technologies in homes as they typically labour over household chores such as cooking and collecting firewood and spend more time exposed to harmful smoke from polluting stoves and fuels.
• Gathering fuel increases the risk of musculoskeletal injuries and consumes considerable time for women and children – limiting education and other productive activities. In less secure environments, women and children are at risk of injury and violence while gathering fuel.
• Many of the fuels and technologies used by households for cooking, heating and lighting present safety risks. The ingestion of kerosene by accident is the leading cause of childhood poisonings, and a large fraction of the severe burns and injuries occurring in low- and middle-income countries are linked to household energy use for cooking, heating and lighting.2
• The lack of access to electricity for over 750 million1 people forces households to rely on polluting devices and fuels, such as kerosene lamps for lighting, thus making them exposed to very high levels of fine particulate matter.
• The time spent using and preparing fuel for inefficient, polluting devices constrains other opportunities for health and development, like studying, leisure time, or productive activities.
• Black carbon (sooty particles) and methane emitted by inefficient stove combustion are powerful short-lived climate pollutants (SLCPs).
• Household air pollution is also a major contributor to ambient (outdoor) air pollution.
[30] Report: “Energy Access Outlook 2017: From Poverty to Prosperity.” International Energy Agency, October 2017. <www.oecd.org>
Page 14: “[H]ouseholds relying on biomass for cooking dedicate around 1.4 hours each day collecting firewood, and several hours cooking with inefficient stoves, a burden largely borne by women.”
Page 26: “Access to energy services is critical for advancing human development, furthering social inclusion of the poorest and most vulnerable in society and to meeting many of the SDGs [sustainable development goals].”
Page 40:
Efforts to promote electricity access are having a positive impact in all regions, and the pace of progress has accelerated. Our analysis shows that the number of people without access to electricity fell to 1.1 billion people for the first time in 2016, with nearly 1.2 billion people having gained access since 2000…. However, despite the progress that has been made, 14% of the world’s population still lacks access to electricity, 84% of which live in rural areas.
Page 58: “There is a long way to go to achieve the 2030 objective of universal access to clean fuels and technologies for cooking…. Today, an estimated 2.8 billion do not have access to clean cooking facilities. A third of the world’s population—2.5 billion people—rely on the traditional use of solid biomass to cook their meals.”
[31] Report: “Impacts of Higher Energy Prices on Agriculture and Rural Economies.” By Ronald Sands, Paul Westcott, and others. United States Department of Agriculture, Economic Research Service, August 2011. <www.ers.usda.gov>
Page 1:
Agricultural production is sensitive to changes in energy prices, either through energy consumed directly or through energy-related inputs such as fertilizer. A number of factors can affect energy prices faced by U.S. farmers and ranchers, including developments in the oil and natural gas markets, and energy taxes or subsidies. …
Higher energy-related production costs would generally lower agricultural output, raise prices of agricultural products, and reduce farm income, regardless of the reason for the energy price increase.
[32] Report: “The Impact of Ethanol Use on Food Prices and Greenhouse-Gas Emissions.” Congressional Budget Office, April 2009. <www.cbo.gov>
Page 10:
The impact of higher prices for food will probably be greater in other countries than in the United States because the percentage of households’ income that is spent on food in those other nations is larger and the value of commodities makes up a bigger share of the cost of food. (in 2007, the share of spending for goods and services that a household allocated to food purchases for consumption at home was less than 6 percent in the United States but more than 32 percent in India.)38 In contrast to countries that export commodities, countries that import a large percentage of their food will also be adversely affected by rising global prices for commodities. The United Nations’ Food and Agriculture Organization has estimated that, in contrast to steadily declining real (inflation-adjusted) prices for food commodities between 1974 and 2000, real prices for commodities (including corn, soybeans, and sugarcane) increased by 135 percent between January 2000 and April 2008.39
[33] Article: “Rush to Use Crops as Fuel Raises Food Prices and Hunger Fears.” By Elisabeth Rosenthal. New York Times, April 6, 2011. <www.nytimes.com>
“This year, the United Nations Food and Agriculture Organization reported that its index of food prices was the highest in its more than 20 years of existence. Prices rose 15 percent from October to January alone, potentially ‘throwing an additional 44 million people in low- and middle-income countries into poverty,’ the World Bank said.”
[34] Article: “Desperate Haitians Survive on Mud Cookies.” By Jonathan M. Katz. Associated Press, January 30, 2008. <www.cbsnews.com>
It was lunchtime in one of Haiti’s worst slums, and Charlene Dumas was eating mud. With food prices rising, Haiti’s poorest can’t afford even a daily plate of rice, and some take desperate measures to fill their bellies. …
Food prices around the world have spiked because of higher oil prices, needed for fertilizer, irrigation and transportation. Prices for basic ingredients such as corn and wheat are also up sharply, and the increasing global demand for biofuels is pressuring food markets as well.
The problem is particularly dire in the Caribbean, where island nations depend on imports and food prices are up 40 percent in places. …
Still, at about 5 cents apiece, the [mud] cookies are a bargain compared to food staples. About 80 percent of people in Haiti live on less than $2 a day and a tiny elite controls the economy.
[35] Report: “Energy Tax Policy: Historical Perspectives on and Current Status of Energy Tax Expenditures.” By Molly F. Sherlock. Congressional Research Service, May 2, 2011. <www.leahy.senate.gov>
Page 11: “The economic well-being and economic security of the nation depends on having stable energy sources. There are national economic costs associated with unstable energy supplies, such as increasing unemployment and inflation that may follow oil price spikes.”
[36] Report: “Renewable Energy: Federal Agencies Implement Hundreds of Initiatives.” U.S. Government Accountability Office, February 2012. <www.gao.gov>
Page 1:
Americans’ daily lives, as well as the economic productivity of the United States, depend on the availability of energy, particularly from fossil fuels. However, concerns over the nation’s reliance on imported oil, rising energy costs, and fossil fuels’ potential contribution to global climate change have renewed the focus on developing renewable energy resources and technologies to meet future energy needs.
[37] Webpage: “Metadata Glossary: Access to Electricity (% of Population).” World Bank. Accessed September 5, 2019 at <databank.worldbank.org>
Energy is necessary for creating the conditions for economic growth. It is impossible to operate a factory, run a shop, grow crops or deliver goods to consumers without using some form of energy. Access to electricity is particularly crucial to human development as electricity is, in practice, indispensable for certain basic activities, such as lighting, refrigeration and the running of household appliances, and cannot easily be replaced by other forms of energy. Individuals’ access to electricity is one of the most clear and un-distorted indication of a country’s energy poverty status.
[38] Textbook: Introduction to Air Pollution Science. By Robert F. Phalen and Robert N. Phalen. Jones & Bartlett, 2013.
Page 168: “The availability of affordable electric power is essential for public health and economic prosperity.”
[39] Report: “Annual Energy Outlook 2013 with Projections to 2040.” U.S. Energy Information Administration, April 2013. <www.osti.gov>
Page 32: “Liquid fuels play a vital role in the U.S. energy system and economy, and access to affordable liquid fuels has contributed to the nation’s economic prosperity.”
Page 38:
These alternative cases may also have significant implications for the broader economy. Liquid fuels provide power and raw materials (feedstocks) for a substantial portion of the U.S. economy, and the macroeconomic impacts of both the High Oil and Gas Resource case and the Low/No Net Imports case suggest that significant economic benefits would accrue if some version of those futures were realized (see discussion of NGL [natural gas liquids] later in “Issues in focus”). This is in spite of the fact that petroleum remains a global market in each of the scenarios, which limits the price impacts for gasoline, diesel, and other petroleum-derived fuels. In the High Oil and Gas Resource case, increasing energy production has immediate benefits for the economy. U.S. industries produce more goods with 12 percent lower energy costs in 2025 and 15 percent lower energy costs in 2040. Consumers see roughly 10 percent lower energy prices in 2025, and 13 percent lower energy prices in 2040, as compared with the Reference case. Cheaper energy allows the economy to expand further, with real GDP [gross domestic product] attaining levels that are on average about 1 percent above those in the Reference case from 2025 through 2040, including growth in both aggregate consumption and investment.
[40] Textbook: Microeconomics for Today (6th edition). By Irvin B. Tucker. South-Western Cengage Learning, 2010.
Page 450: “GDP [gross domestic product] per capita provides a general index of a country’s standard of living. Countries with low GDP per capita and slow growth in GDP per capita are less able to satisfy basic needs for food, shelter, clothing, education, and health.”
[41] Textbook: Microeconomics for Today (6th edition). By Irvin B. Tucker. South-Western Cengage Learning, 2010.
Page 450: “GDP [gross domestic product] per capita provides a general index of a country’s standard of living. Countries with low GDP per capita and slow growth in GDP per capita are less able to satisfy basic needs for food, shelter, clothing, education, and health.”
[42] Booklet: “Energy, Powering Your World.” By M.T. Westra and S. Kuyvenhoven. Foundation for Fundamental Research on Matter, Institute for Plasma Physics, Rijnhuizen (the Netherlands), 2002. <fire.pppl.gov>
Page 3: “To get the energy services we want, we need energy in a useful form in the right place, at the right time.”
Page 27: “In an electrical generator electricity is made by turning a magnet in a magnetic field. The changing magnetic field drives the electrical current. … in the case of hydro power, the falling water is led through a hydro turbine, which drives an electrical generator.”
Page 31:
Nuclear fusion is the process whereby two atoms fuse together, and release lots of energy. Fusion is the energy source of the sun and the stars and is therefore the most common energy source in the universe. The sun burns up the lightest of the elements, hydrogen (600 million tons each second), which fuses to form helium. In the fusion process no pollutants are formed.
In a sense, all energy we use comes from fusion energy. Fossil fuels were once plants that grew using energy from sunlight. Wind is caused by temperature differences in the atmosphere, caused by the sun. Hydro-energy is powered by the evaporation of water, which is caused by the sun as well.
[43] Booklet: “What You Need to Know About Energy.” National Academy of Sciences, 2008. <nap.nationalacademies.org>
The sun’s energy warms the planet’s surface, powering titanic transfers of heat and pressure in weather patterns and ocean currents. … Solar energy also evaporates water that falls as rain and builds up behind dams, where its motion is used to generate electricity via hydropower. …
Finally, it [electricity] reaches an incandescent lightbulb where it heats a thin wire filament until the metal glows….
[44] Booklet: “What You Need to Know About Energy.” National Academy of Sciences, 2008. <nap.nationalacademies.org>
By the time energy is delivered to us in a usable form, it has typically undergone several conversions. Every time energy changes forms, some portion is “lost.” It doesn’t disappear, of course. In nature, energy is always conserved. That is, there is exactly as much of it around after something happens as there was before. But with each change, some amount of the original energy turns into forms we don’t want or can’t use, typically as so-called waste heat that is so diffuse it can’t be captured. Reducing the amount lost—also known as increasing efficiency—is as important to our energy future as finding new sources because gigantic amounts of energy are lost every minute of every day in conversions.
[45] Textbook: Energy Economics: Concepts, Issues, Markets and Governance. By Subhes C. Bhattacharyya. Springer-Verlag, 2011.
Page 10: “The second law of thermodynamics on the other hand introduces the concept of quality of energy. It suggests that any conversion involves generation of low grade energy that cannot be used for useful work and this cannot be eliminated altogether. This imposes physical restriction on the use of energy.”
[46] Article: “The Second Law of Thermodynamics.” New Encyclopaedia Britannica: Macropædia – Knowledge in Depth (Volume 28), 2002.
Page 623: “The second law applies to every type of process—physical, natural, biological, and industrial or technological—and examples of its validity can be seen in life every day.”
[47] Book: Elements of Classical Thermodynamics for Advanced Students of Physics. By A. B. Pippard. Cambridge University Press, 1981.
Page 30: “Moreover, the consequences of the [second] law are so unfailingly verified by experiment that it has come to be regarded as among the most firmly established of all the laws of nature.”
[48] Report: “July 2022 Monthly Energy Review.” U.S. Energy Information Administration, Office of Energy Statistics, July 26, 2022. <www.eia.gov>
Page 19: “Table 1.7 Primary Energy Consumption, Energy Expenditures, and Carbon Dioxide Emissions Indicators”
[49] Calculated with data from the report: “2015 Residential Energy Consumption Survey.” U.S. Energy Information Administration, May 2018. <www.eia.gov>
“Table CE1.1 Summary Annual Household Site Consumption and Expenditures in the U.S.—Totals and Intensities, 2015”
“Table HC10.1 Total Square Footage of U.S. Homes, 2015”
NOTE: An Excel file containing the data and calculations is available upon request.
[50] Article: “Newer U.S. Homes Are 30% Larger but Consume About as Much Energy as Older Homes.” U.S. Energy Information Administration, February 12, 2013. <www.eia.gov>
Analysis from EIA’s [U.S. Energy Information Administration] most recent Residential Energy Consumption Survey (RECS) shows that U.S. homes built in 2000 and later consume only 2% more energy on average than homes built prior to 2000, despite being on average 30% larger.
Homes built in the 2000s accounted for about 14% of all occupied housing units in 2009. These new homes consumed 21% less energy for space heating on average than older homes (see graph), which is mainly because of increased efficiency in the form of heating equipment and better building shells built to more demanding energy codes. Geography has played a role too. About 53% of newer homes are in the more temperate South, compared with only 35% of older homes.
The increase in energy for air conditioning also reflects this population migration as well as higher use of central air conditioning and increased square footage. Similar to space heating, these gains were likely moderated by increases in efficiency of cooling equipment and improved building shells, but air conditioning was not the only end use that was higher in newer homes. RECS data show that newer homes were more likely than older homes to have dishwashers, clothes washers, clothes dryers, and two or more refrigerators. Newer homes, with their larger square footage, have more computers, TVs, and TV peripherals such as digital video recorders (DVRs) and video game systems. In total, newer homes consumed about 18% more energy on average in 2009 for appliances, electronics, and lighting than older homes.
[51] Calculated with data from the report: “2015 Residential Energy Consumption Survey.” U.S. Energy Information Administration, May 2018. <www.eia.gov>
“Table CE3.1 Annual Household Site End-Use Consumption in the U.S.—Totals and Averages, 2015”
NOTE: An Excel file containing the data and calculations is available upon request.
[52] Article: “Newer U.S. Homes Are 30% Larger but Consume About as Much Energy as Older Homes.” U.S. Energy Information Administration, February 12, 2013. <www.eia.gov>
RECS [Residential Energy Consumption Survey] data show that newer homes were more likely than older homes to have dishwashers, clothes washers, clothes dryers, and two or more refrigerators. Newer homes, with their larger square footage, have more computers, TVs, and TV peripherals such as digital video recorders (DVRs) and video game systems. In total, newer homes consumed about 18% more energy on average in 2009 for appliances, electronics, and lighting than older homes.
[53] Textbook: Energy Economics: Concepts, Issues, Markets and Governance. By Subhes C. Bhattacharyya. Springer-Verlag, 2011.
Page 13: “The efficiency of the appliance affects the demand. The consumer is interested in the useful energy (i.e. the energy required to meet the need and not the final or primary energies).”
[54] Article: “For Appliances, Choosing the Most Cost-Effective Option Depends on Several Factors.” U.S. Energy Information Administration, May 29, 2013. <www.eia.gov>
Consumers in the market for new appliances have a wide range of choices that likely vary by cost, options, and efficiency level. If energy cost effectiveness is a factor in the decision, picking the most cost-effective model involves comparing the upfront purchase price and an estimate of the expected lifetime energy costs of different options. This calculation requires inputs for equipment lifetime, energy costs, appliance performance, and the time value of money.
Upfront capital costs are relatively simple to compare. Customers can quickly review costs, factor in rebates or incentives, and determine the most and least expensive options. But operating costs are also important. For some appliances, cumulative operating costs over time can exceed upfront costs.
For example, the graphic above illustrates the differences in capital and energy costs of four refrigerators of the same size and type with varying efficiency over time. For the first two years, the baseline (least efficient) option has the lowest total cost of ownership. Over time, the more efficient options have lower cumulative operating costs. After two years, the first Energy Star refrigerator (15% more efficient than baseline) becomes more cost effective than the baseline option. After five years, the 25% more efficient refrigerator is the most cost effective. After 19 years, the most efficient option becomes the most cost effective even though it was originally the most expensive. While 19 years may be longer than most people stay in the same house and near the end of a refrigerator’s expected lifetime, EIA [U.S. Energy Information Administration] survey data show that about 8% of households have a refrigerator that is at least 20 years old.
[55] Webpage: “About Energy Star.” Accessed June 15, 2010 at <www.energystar.gov>
Energy Star is a joint program of the U.S. Environmental Protection Agency and the U.S. Department of Energy helping us all save money and protect the environment through energy efficient products and practices. …
If looking for new household products, look for ones that have earned the Energy Star. They meet strict energy efficiency guidelines set by the EPA [Environmental Protection Agency] and US Department of Energy.
[56] Report: “Covert Testing Shows the Energy Star Program Certification Process Is Vulnerable to Fraud and Abuse.” United States Government Accountability Office, March 2010. <www.gao.gov>
Page 2 (of PDF):
GAO’s [U.S. Government Accountability Office] investigation shows that Energy Star is for the most part a self-certification program vulnerable to fraud and abuse. GAO obtained Energy Star certifications for 15 bogus products, including a gas-powered alarm clock. Two bogus products were rejected by the program and 3 did not receive a response. In addition, two of the bogus Energy Star firms developed by GAO received requests from real companies to purchase products because the bogus firms were listed as Energy Star partners. This clearly shows how heavily American consumers rely on the Energy Star brand. The program is promoted through tax credits and appliance rebates, and federal agencies are required to purchase certain Energy Star certified products. In addition, companies use the Energy Star certification to market their products and consumers buy products relying on the certification by the government of reduced energy consumption and costs. For example, in 2008 Energy Star reported saving consumers $19 billion dollars on utility costs. The table below details several fictitious GAO products certified by Energy Star.
Gas-Powered Alarm Clock
• Product description indicated the clock is the size of a small generator and is powered by gasoline.
• Product was approved by Energy Star without a review of the company Web site or questions of the claimed efficiencies.
Geothermal Heat Pump
• Energy use data reported was more efficient than any product listed as certified on the Energy Star Web site at the time of submission.
• High-energy efficiency data was not questioned by Energy Star.
• Product is eligible for federal tax credits and state rebate programs.
Computer Monitor
• Product was approved by Energy Star within 30 minutes of submission.
• Private firms contacted GAO’s fictitious firm to purchase products based on participation in the Energy Star program.
Refrigerator
• Self-certified product was submitted, qualified, and listed on the Energy Star Web site within 24 hours.
• Product is eligible for federal tax credits and state rebates.
GAO found that for our bogus products, certification controls were ineffective primarily because Energy Star does not verify energy-savings data reported by manufacturers. Energy Star required only 4 of the 20 products GAO submitted for certification to be verified by an independent third party. For 2 of these cases GAO found that controls were effective because the program required an independent verification by a specific firm chosen by Energy Star. However, in another case because Energy Star failed to verify information provided, GAO was able to circumvent this control by certifying that a product met a specific safety standard for ozone emission.
At briefings on GAO’s investigation, DOE [U.S. Department of Energy] and EPA [U.S. Environmental Protection Agency] officials agreed that the program is currently based on self-certifications by manufacturers. However, officials stated there are after-market tests and self-policing that ensure standards are maintained. GAO did not test or evaluate controls related to products that were already certified and available to the public. In addition, prior DOE IG [Inspector General], EPA IG, and GAO reports have found that current Energy Star controls do not ensure products meet efficiency guidelines.
Page 10: “We successfully obtained Energy Star qualification for 15 bogus products, including a gas-powered alarm clock and a room cleaner represented by a photograph of a feather duster adhered to a space heater on our manufacturer’s Web site.”
Page 12:
[57] Webpage: “U.S. Green Building Council.” Accessed June 26, 2019 at <www.usgbc.org>
“The U.S. Green Building Council (USGBC) is a Washington, DC-based 501(c)(3) nonprofit organization committed to a prosperous and sustainable future for our nation through cost-efficient and energy-saving green buildings.”
[58] Webpage: “LEED.” U.S. Green Building Council. Accessed October 14, 2013 at <www.usgbc.org>
At its core, LEED [Leadership in Energy and Environmental Design] is a program that provides third-party verification of green buildings. Building projects satisfy prerequisites and earn points to achieve different levels of certification. Prerequisites and credits differ for each rating system, and teams choose the best fit for the project. Learn more about LEED, the facts, and the LEED rating systems.
What can LEED do for you?
• Lower operating costs and increase asset value
• Conserve energy, water and other resources
• Be healthier and safer for occupants
• Qualify for money-saving incentives, like tax rebates and zoning allowances
[59] Article: “Green Schools: Long on Promise, Short on Delivery.” By Thomas Frank. USA Today, December 11. 2012. <www.usatoday.com>
The Houston Independent School District took a big step in 2007 toward becoming environmentally friendly by designing two new schools to meet a coveted “green” standard set by a private-builders’ group. …
But the schools are not operating as promised.
Thompson Elementary ranked 205th out of 239 Houston schools in a report last year for the district that showed each school’s energy cost per student. Walnut Bend Elementary ranked 155th. A third “green” school, built in 2010, ranked 46th in the report, which a local utility did for the district to find ways of cutting energy costs. …
Building a LEED [Leadership in Energy and Environmental Design]-certified school often adds 2% to 3% to construction costs, and as much as 10% in the case of a Selinsgrove, Pa., high school, state records show. …
“Green schools save money,” the [U.S. Green Building] council declares in an 80-page…. The conclusion is based on estimates made before construction of 30 green-certified schools—including Washington Middle School in Olympia, Wash., projected to use 28% less energy. The school consumed 19% more energy than a conventional school in its first two years, and 65% more than planned, a state report shows. …
More than 200 states, federal agencies and municipalities require LEED certification for public buildings. …
“Green schools help improve student performance,” the building council says in its legislators’ guide. …
USA TODAY found no clear pattern in a review of student test scores for 65 schools in 11 states that have been rebuilt to get LEED certification and have been open for at least two years.
[60] Article: “Can the Human Race Be Saved?” By Gus Speth. U.S. Environmental Protection Agency EPA Journal, January/February 1989. Pages 47–50. <nepis.epa.gov>
Page 49:
The coming energy transformation, I would argue, must have rapid energy efficiency improvements as its dominant feature, supplemented by increased reliance on renewable energy sources. The potential for energy efficiency gains through technological change is simply enormous. If the efficiency in energy use currently in Japan today could be matched in the United States and around the world, total economic output could be doubled globally, and virtually doubled in the United States, without increasing energy use.
Auto efficiency provides a good example of what is possible. Miles per gallon achieved by new cars sold in the United States doubled from 13 mpg to 25 mpg between 1973 and 1985. Ford, Honda, and Suzuki all have cars in production that could double this again to 50 mpg, and Toyota has a prototype family car that could double efficiency again to almost 100 mpg. I am reminded here that there is a huge role for the private sector in the coming technological transformation. Those companies that see the future can profit from it.
Page 50: “Speth is President of the World Resources Institute†. This article is an excerpt from a speech Speth gave at EPA in June 1988.”
NOTE: † The World Resources Institute is a nonprofit organization with a mission to “move human society to live in ways that protect Earth’s environment….” [Webpage: “About Us.” World Resources Institute. Accessed June 15, 2021 at <www.wri.org>]
[61] Article: “Most Fuel-Efficient Cars (That Aren’t Electric or Hybrid).” By Austin Irwin. Car and Driver, March 22, 2022. <www.caranddriver.com>
“The most efficient car on the list gets 39 mpg combined, and another car can go 490 miles on a single tank of gas. … Mitsubishi Mirage: 39 mpg … Powered by a tiny, 1.2-liter 78-hp three-cylinder, the Mirage makes a big stand for fuel economy. With an EPA-rated 39 mpg combined for the CVT-equipped hatchback variant, this is certainly a case of David versus the gas station. … Horsepower: 78 horsepower”
[62] Webpage: “2022 Mitsubishi Mirage Black Edition CVT [continuously variable transmission] Features And Specs.” Car and Driver. Accessed July 27, 2022 at <www.caranddriver.com>
“Engine … Maximum Horsepower @ RPM [=] 78 @ 6000 … Weight Information … Base Curb Weight (pounds) [=] 2095”
[63] Booklet: “What You Need to Know About Energy.” National Academy of Sciences, 2008. <nap.nationalacademies.org>
Another familiar form of conversion loss occurs in a vehicle’s internal combustion engine. The chemical energy in the gasoline is converted to heat energy, which provides pressure on the pistons. That mechanical energy is then transferred to the wheels, increasing the vehicle’s kinetic energy. Even with a host of modern improvements, current vehicles use only about 20% of the energy content of the fuel as power, with the rest wasted as heat.
Electric motors typically have much higher efficiency ratings. But the rating only describes how much of the electricity input they turn into power; it does not reflect how much of the original, primary energy is lost in generating the electricity in the first place and then getting it to the motor.
Efficiencies of heat engines can be improved further, but only to a degree. Principles of physics place upper limits on how efficient they can be. Still, efforts are being made to capture more of the energy that is lost and to make use of it. This already happens in vehicles in the winter months, when heat loss is captured and used to warm the interior for passengers.
[64] Article: “Two Perspectives on Household Electricity Use.” U.S. Energy Information Administration, March 6, 2013. <www.eia.gov>
Electricity and natural gas now account for approximately equal amounts of the energy consumed on site in U.S. households. But because it takes on average nearly three units of energy from primary fuels such as coal, natural gas, and nuclear fuel to generate one unit of electricity, increased electricity use has a disproportionate impact on the amount of total primary energy required to support site-level energy use.
[65] Calculated with data from the report: “June 2024 Monthly Energy Review.” U.S. Energy Information Administration, Office of Energy Statistics, June 25, 2024. <www.eia.gov>
Page 258: “Table E3. Primary Energy Consumption by Source (Quadrillion Btu)” <www.eia.gov>
Page 259: “Table E4. Renewable Energy Production and Consumption by Source (Trillion Btu)” <www.eia.gov>
NOTE: An Excel file containing the data and calculations is available upon request.
[66] Textbook: Energy Economics: Concepts, Issues, Markets and Governance. By Subhes C. Bhattacharyya. Springer-Verlag, 2011.
Page 10: “The term primary energy is used to designate an energy source that is extracted from a stock of natural resources captured from a flow of resources and that has not undergone any transformation or conversion other than separation and cleaning (IEA [International Energy Agency] 2004). Examples include coal, crude oil, natural gas, solar power, nuclear power, etc.”
[67] Report: “June 2024 Monthly Energy Review.” U.S. Energy Information Administration, Office of Energy Statistics, June 25, 2024. <www.eia.gov>
Pages 283–284:
Primary energy consumption: Consumption of primary energy. EIA includes the following in U.S. primary energy consumption: coal; coal coke net imports; petroleum consumption (equal to petroleum products supplied, excluding biofuels); dry natural gas—excluding supplemental gaseous fuels; nuclear electricity net generation (converted to Btu using the average annual heat rate of nuclear plants); conventional hydroelectricity net generation (converted to Btu using the heat content of electricity); geothermal electricity net generation (converted to Btu using the heat content of electricity), geothermal heat pump energy, and geothermal direct‐use thermal energy; solar thermal and photovoltaic electricity net generation (converted to Btu using the heat content of electricity), and solar thermal direct‐use energy; wind electricity net generation (converted to Btu using the heat content of electricity); wood and wood‐derived fuels; biomass waste; biofuels (fuel ethanol, biodiesel, renewable diesel, and other biofuels); losses and co‐products from the production of biofuels; electricity net imports (converted to Btu using the electricity heat content of 3,412 Btu per kilowatthour). Primary energy consumption includes all non‐combustion use of fossil fuels. Primary energy consumption also includes other energy losses throughout the energy system. See Total energy consumption. Energy sources produced from other energy sources—e.g. coal coke from coal—are included in primary energy consumption only if their energy content has not already been included as part of the original energy source. As a result, U.S. primary energy consumption does include net imports of coal coke, but it does not include the coal coke produced from domestic coal.
[68] Calculated with data from the report: “June 2024 Monthly Energy Review.” U.S. Energy Information Administration, Office of Energy Statistics, June 25, 2024. <www.eia.gov>
Page 258: “Table E3. Primary Energy Consumption by Source (Quadrillion Btu)” <www.eia.gov>
Page 259: “Table E4. Renewable Energy Production and Consumption by Source (Trillion Btu)” <www.eia.gov>
NOTE: An Excel file containing the data and calculations is available upon request.
[69] Calculated with data from the report: “June 2024 Monthly Energy Review.” U.S. Energy Information Administration, Office of Energy Statistics, June 25, 2024. <www.eia.gov>
Page 258: “Table E3. Primary Energy Consumption by Source (Quadrillion Btu)” <www.eia.gov>
Page 259: “Table E4. Renewable Energy Production and Consumption by Source (Trillion Btu)” <www.eia.gov>
NOTE: An Excel file containing the data and calculations is available upon request.
[70] Textbook: Energy Economics: Concepts, Issues, Markets and Governance. By Subhes C. Bhattacharyya. Springer-Verlag, 2011.
Page 10: “The term primary energy is used to designate an energy source that is extracted from a stock of natural resources captured from a flow of resources and that has not undergone any transformation or conversion other than separation and cleaning…. Examples include coal, crude oil, natural gas, solar power, nuclear power, etc.”
[71] Report: “June 2024 Monthly Energy Review.” U.S. Energy Information Administration, Office of Energy Statistics, June 25, 2024. <www.eia.gov>
Pages 283–284:
Primary energy consumption: Consumption of primary energy. EIA includes the following in U.S. primary energy consumption: coal; coal coke net imports; petroleum consumption (equal to petroleum products supplied, excluding biofuels); dry natural gas—excluding supplemental gaseous fuels; nuclear electricity net generation (converted to Btu using the average annual heat rate of nuclear plants); conventional hydroelectricity net generation (converted to Btu using the heat content of electricity); geothermal electricity net generation (converted to Btu using the heat content of electricity), geothermal heat pump energy, and geothermal direct‐use thermal energy; solar thermal and photovoltaic electricity net generation (converted to Btu using the heat content of electricity), and solar thermal direct‐use energy; wind electricity net generation (converted to Btu using the heat content of electricity); wood and wood‐derived fuels; biomass waste; biofuels (fuel ethanol, biodiesel, renewable diesel, and other biofuels); losses and co‐products from the production of biofuels; electricity net imports (converted to Btu using the electricity heat content of 3,412 Btu per kilowatthour). Primary energy consumption includes all non‐combustion use of fossil fuels. Primary energy consumption also includes other energy losses throughout the energy system. See Total energy consumption. Energy sources produced from other energy sources—e.g. coal coke from coal—are included in primary energy consumption only if their energy content has not already been included as part of the original energy source. As a result, U.S. primary energy consumption does include net imports of coal coke, but it does not include the coal coke produced from domestic coal.
[72] Calculated with data from the report: “June 2024 Monthly Energy Review.” U.S. Energy Information Administration, Office of Energy Statistics, June 25, 2024. <www.eia.gov>
Page 258: “Table E3. Primary Energy Consumption by Source (Quadrillion Btu)” <www.eia.gov>
Page 259: “Table E4. Renewable Energy Production and Consumption by Source (Trillion Btu)” <www.eia.gov>
NOTE: An Excel file containing the data and calculations is available upon request.
[73] Textbook: Energy Economics: Concepts, Issues, Markets and Governance. By Subhes C. Bhattacharyya. Springer-Verlag, 2011.
Page 10: “The term primary energy is used to designate an energy source that is extracted from a stock of natural resources captured from a flow of resources and that has not undergone any transformation or conversion other than separation and cleaning…. Examples include coal, crude oil, natural gas, solar power, nuclear power, etc.”
[74] Report: “June 2024 Monthly Energy Review.” U.S. Energy Information Administration, Office of Energy Statistics, June 25, 2024. <www.eia.gov>
Pages 283–284:
Primary energy consumption: Consumption of primary energy. EIA includes the following in U.S. primary energy consumption: coal; coal coke net imports; petroleum consumption (equal to petroleum products supplied, excluding biofuels); dry natural gas—excluding supplemental gaseous fuels; nuclear electricity net generation (converted to Btu using the average annual heat rate of nuclear plants); conventional hydroelectricity net generation (converted to Btu using the heat content of electricity); geothermal electricity net generation (converted to Btu using the heat content of electricity), geothermal heat pump energy, and geothermal direct‐use thermal energy; solar thermal and photovoltaic electricity net generation (converted to Btu using the heat content of electricity), and solar thermal direct‐use energy; wind electricity net generation (converted to Btu using the heat content of electricity); wood and wood‐derived fuels; biomass waste; biofuels (fuel ethanol, biodiesel, renewable diesel, and other biofuels); losses and co‐products from the production of biofuels; electricity net imports (converted to Btu using the electricity heat content of 3,412 Btu per kilowatthour). Primary energy consumption includes all non‐combustion use of fossil fuels. Primary energy consumption also includes other energy losses throughout the energy system. See Total energy consumption. Energy sources produced from other energy sources—e.g. coal coke from coal—are included in primary energy consumption only if their energy content has not already been included as part of the original energy source. As a result, U.S. primary energy consumption does include net imports of coal coke, but it does not include the coal coke produced from domestic coal.
[75] Calculated with data from the report: “June 2024 Monthly Energy Review.” U.S. Energy Information Administration, Office of Energy Statistics, June 25, 2024. <www.eia.gov>
Page 258: “Table E3. Primary Energy Consumption by Source (Quadrillion Btu)” <www.eia.gov>
NOTE: An Excel file containing the data and calculations is available upon request.
[76] Calculated with data from the report: “June 2024 Monthly Energy Review.” U.S. Energy Information Administration, Office of Energy Statistics, June 25, 2024. <www.eia.gov>
Page 258: “Table E3. Primary Energy Consumption by Source (Quadrillion Btu)” <www.eia.gov>
Page 259: “Table E4. Renewable Energy Production and Consumption by Source (Trillion Btu)” <www.eia.gov>
NOTE: An Excel file containing the data and calculations is available upon request.
[77] Calculated with data from the report: “June 2024 Monthly Energy Review.” U.S. Energy Information Administration, Office of Energy Statistics, June 25, 2024. <www.eia.gov>
Page 258: “Table E3. Primary Energy Consumption by Source (Quadrillion Btu)” <www.eia.gov>
Page 259: “Table E4. Renewable Energy Production and Consumption by Source (Trillion Btu)” <www.eia.gov>
NOTE: An Excel file containing the data and calculations is available upon request.
[78] Webpage: “Glossary.” U.S. Energy Information Administration. Accessed July 28, 2022 at <www.eia.gov>
Residential sector: An energy-consuming sector that consists of living quarters for private households. Common uses of energy associated with this sector include space heating, water heating, air conditioning, lighting, refrigeration, cooking, and running a variety of other appliances. The residential sector excludes institutional living quarters. Note: Various EIA [U.S. Energy Information Administration] programs differ in sectoral coverage.
[79] Webpage: “Glossary.” U.S. Energy Information Administration. Accessed July 28, 2022 at <www.eia.gov>
Commercial sector: An energy-consuming sector that consists of service-providing facilities and equipment of businesses; Federal, State, and local governments; and other private and public organizations, such as religious, social, or fraternal groups. The commercial sector includes institutional living quarters. It also includes sewage treatment facilities. Common uses of energy associated with this sector include space heating, water heating, air conditioning, lighting, refrigeration, cooking, and running a wide variety of other equipment. Note: This sector includes generators that produce electricity and/or useful thermal output primarily to support the activities of the above-mentioned commercial establishments.
[80] Webpage: “Glossary.” U.S. Energy Information Administration. Accessed July 28, 2022 at <www.eia.gov>
Transportation sector: An energy-consuming sector that consists of all vehicles whose primary purpose is transporting people and/or goods from one physical location to another. Included are automobiles; trucks; buses; motorcycles; trains, subways, and other rail vehicles; aircraft; and ships, barges, and other waterborne vehicles. Vehicles whose primary purpose is not transportation (e.g., construction cranes and bulldozers, farming vehicles, and warehouse tractors and forklifts) are classified in the sector of their primary use. Note: Various EIA [U.S. Energy Information Administration] programs differ in sectoral coverage.
[81] Webpage: “Glossary.” U.S. Energy Information Administration. Accessed July 28, 2022 at <www.eia.gov>
Industrial sector: An energy-consuming sector that consists of all facilities and equipment used for producing, processing, or assembling goods. The industrial sector encompasses the following types of activity manufacturing (NAICS [North American Industry Classification System] codes 31–33); agriculture, forestry, fishing and hunting (NAICS code 11); mining, including oil and gas extraction (NAICS code 21); and construction (NAICS code 23). Overall energy use in this sector is largely for process heat and cooling and powering machinery, with lesser amounts used for facility heating, air conditioning, and lighting. Fossil fuels are also used as raw material inputs to manufactured products. Note: This sector includes generators that produce electricity and/or useful thermal output primarily to support the above-mentioned industrial activities. Various EIA [U.S. Energy Information Administration] programs differ in sectoral coverage.
[82] Booklet: “Energy, Powering Your World.” By M.T. Westra and S. Kuyvenhoven. Foundation for Fundamental Research on Matter, Institute for Plasma Physics, Rijnhuizen (the Netherlands), 2002. <fire.pppl.gov>
Page 12:
Industrial Use of Energy
The manufacture of the products we use every day, and the materials that were used e.g. to build our houses, cost a large amount of energy. Factories burn fuels to produce heat and power. Apart from the usual fuels and electricity, industry uses a large variety of less commonly used fuels, like wood chips, bark, and wood waste material from the production of paper, coal briquettes, coke oven gas, and others. Manufacturing processes require large quantities of steam, which is produced in boilers using the combustion of fuels.
[83] Calculated with data from the report: “July 2022 Monthly Energy Review.” U.S. Energy Information Administration, Office of Energy Statistics, July 26, 2022. <www.eia.gov>
Page 38: “Table 2.1a Energy Consumption: Residential, Commercial, and Industrial Sectors (Trillion Btu)”
Page 39: “Table 2.1b Energy Consumption: Transportation Sector, Total End-Use Sectors, and Electric Power Sector (Trillion Btu)”
NOTE: An Excel file containing the data and calculations is available upon request.
[84] Webpage: “Glossary.” U.S. Energy Information Administration. Accessed July 28, 2022 at <www.eia.gov>
Electric power sector: An energy-consuming sector that consists of electricity only and combined heat and power (CHP) plants whose primary business is to sell electricity, or electricity and heat, to the public—i.e., North American Industry Classification System 22 plants. See also Combined heat and power (CHP) plant and Electricity only plant.
Combined heat and power (CHP) plant: A plant designed to produce both heat and electricity from a single heat source. Note: This term is being used in place of the term “cogenerator” that was used by EIA [U.S. Energy Information Administration] in the past. CHP better describes the facilities because some of the plants included do not produce heat and power in a sequential fashion and, as a result, do not meet the legal definition of cogeneration specified in the Public Utility Regulatory Policies Act (PURPA).
Electricity only plant: A plant designed to produce electricity only. See also Combined heat and power (CHP) plant.
[85] Webpage: “How Much Energy Is Consumed in the World by Each Sector?” U.S. Energy Information Administration. Accessed August 16, 2013 at <www.eia.gov>
There are four major energy end-use sectors: commercial, industrial, residential, and transportation. The electric power sector also consumes energy. The electricity it produces is consumed by the end-use sectors. There are also losses in electricity generation, transmission, and distribution. The electricity consumed by the four major energy end-use sectors and electricity losses can be apportioned to these respective end-use sectors to calculate their total energy use. Losses are the difference between the amount of energy used to generate electricity and the energy content of the electricity consumed at the point of end use.
[86] Calculated with data from the report: “July 2022 Monthly Energy Review.” U.S. Energy Information Administration, Office of Energy Statistics, July 26, 2022. <www.eia.gov>
Page 39: “Table 2.1b Energy Consumption: Transportation Sector, Total End-Use Sectors, and Electric Power Sector (Trillion Btu)”
NOTE: An Excel file containing the data and calculations is available upon request.
[87] Booklet: “Energy, Powering Your World.” By M.T. Westra and S. Kuyvenhoven. Foundation for Fundamental Research on Matter, Institute for Plasma Physics, Rijnhuizen (the Netherlands), 2002. <fire.pppl.gov>
Page 12:
Heating can also be carried out with electricity. Think for example of a water heater and an electrical oven. However, this is normally much more expensive than using fossil fuels, and it is only used for relatively small amounts of heat. …
Electricity is the most flexible form of energy: it can be used for virtually any application. No noises or gasses are produced at the place where electricity is used. You don’t need a tank of fuel to power your computer or stereo, it is there the moment you need it and in the form you want to have it. You could say that everywhere you would like to use energy when you are not moving, electricity will do the job, unless it is not possible, or cheaper to combust oil, gas, or coal on the spot.
But there are some disadvantages too. The central generation of electricity means it has to be distributed over the country in order to bring it to your house. This causes an average loss of energy of 10%, and needs a large and expensive distribution system. Electricity is also quite hard to store in large quantities. You need large, heavy batteries to store a reasonable amount of electrical energy. As you have to take these batteries with you on a vehicle, transportation doesn’t work very well on electricity. Of course, trains solve this problem by having their own power lines, which act like very long extension cords!
[88] Article: “How Many Workers Are Employed in Sectors Directly Affected by Covid-19 Shutdowns, Where Do They Work, and How Much Do They Earn?” By Matthew Dey and Mark A. Loewenstein. U.S. Bureau of Labor Statistics Monthly Labor Review, April 2020. <www.bls.gov>
Page 1:
To reduce the spread of coronavirus disease 2019 (Covid-19), nearly all states have issued stay-at-home orders and shut down establishments deemed nonessential. Answering the following questions is crucial to assessing the potential labor market impacts of the shutdown policy: How many jobs are in the industries that are shut down? Where are these jobs located? What wages do they pay?
We provide answers to these questions by using data from the U.S. Bureau of Labor Statistics (BLS) Quarterly Census of Employment and Wages (QCEW) and Occupational Employment Statistics (OES) programs.1
[89] Working paper: “Tracking Labor Market Developments During the Covid-19 Pandemic: A Preliminary Assessment.” By Tomas Cajner and others. Board of Governors of the Federal Reserve System, Division of Research & Statistics and Monetary Affairs, April 15, 2020 <www.federalreserve.gov>
Page 2 (of PDF):
Many traditional official statistics are not suitable for measuring high-frequency developments that evolve over the course of weeks, not months. In this paper, we track the labor market effects of the Covid-19 pandemic with weekly payroll employment series based on microdata from ADP [a payroll processing firm]. These data are available essentially in real-time, and allow us to track both aggregate and industry effects. Cumulative losses in paid employment through April 4 are currently estimated at 18 million; just during the two weeks between March 14 and March 28 the U.S. economy lost about 13 million paid jobs. For comparison, during the entire Great Recession less than 9 million private payroll employment jobs were lost. In the current crisis, the most affected sector is leisure and hospitality, which has so far lost or furloughed about 30 percent of employment, or roughly 4 million jobs.
[90] “Monetary Policy Report.” Board of Governors of the Federal Reserve System, February 19, 2021. <www.federalreserve.gov>
Page 1:
The COVID-19 pandemic continues to weigh heavily on economic activity and labor markets in the United States and around the world, even as the ongoing vaccination campaigns offer hope for a return to more normal conditions later this year. While unprecedented fiscal and monetary stimulus and a relaxation of rigorous social-distancing restrictions supported a rapid rebound in the U.S. labor market last summer, the pace of gains has slowed and employment remains well below pre-pandemic levels.
Page 5:
The public health crisis spurred by the spread of COVID-19 weighed on economic activity throughout 2020, and patterns in the labor market reflected the ebb and flow of the virus and the actions taken by households, businesses, and governments to combat its spread. During the initial stage of the pandemic in March and April, payroll employment plunged by 22 million jobs, while the measured unemployment rate jumped to 14.8 percent—its highest level since the Great Depression….2 As cases subsided and early lockdowns were relaxed, payroll employment rebounded rapidly—particularly outside of the service sectors—and the unemployment rate fell back. Beginning late last year, however, the pace of improvement in the labor market slowed markedly amid another large wave of COVID-19 cases. The unemployment rate declined only 0.4 percentage point from November through January, while payroll gains averaged just 29,000 per month, weighed down by a contraction in the leisure and hospitality sector, which is particularly affected by social distancing and government-mandated restrictions.
[91] Calculated with data from the report: “Electric Power Monthly with Data for January 2022.” U.S. Energy Information Administration, Office of Energy Statistics, March 24, 2022. <www.eia.gov>
Page 17 (of PDF): “Table 1.1. Net Generation by Energy Source: Total (All Sectors), 2012–January 2022 (Thousand Megawatthours)”
Page 18 (of PDF): “Table 1.1.A. Net Generation from Renewable Sources: Total (All Sectors), 2012–January 2022 (Thousand Megawatthours)”
NOTES:
[92] Calculated with data from the report: “Electric Power Monthly with Data for January 2022.” U.S. Energy Information Administration, Office of Energy Statistics, March 24, 2022. <www.eia.gov>
Page 17 (of PDF): “Table 1.1. Net Generation by Energy Source: Total (All Sectors), 2012–January 2022 (Thousand Megawatthours)”
Page 18 (of PDF): “Table 1.1.A. Net Generation from Renewable Sources: Total (All Sectors), 2012–January 2022 (Thousand Megawatthours)”
NOTES:
[93] Report: “International Energy Outlook 2016.” U.S. Energy Information Administration, May 2016. <www.eia.gov>
Page 81:
Economic growth is an important factor in electricity demand growth. …
In general, the projected growth of electricity demand in OECD [Organization for Economic Cooperation and Development] countries, where electricity markets are well established and electricity consumption patterns are mature, is slower than in the non-OECD countries. …
From 2005 to 2012, world GDP [gross domestic product] increased by 3.7%/year, while world net electricity generation rose by 3.2%/year . In many parts of the world, policy actions aimed at improving efficiency will help to decouple economic growth rates and electricity demand growth rates more in the future (Figure 5-2) . In the IEO2016 [International Energy Outlook] Reference case, world GDP grows by 3.3%/year, and world net electricity generation grows by 1.9%/year, from 2012 to 2040. The 69% increase in world electricity generation through 2040 is far below what it would be if economic growth and electricity demand growth maintained the same relationship they had in the recent past.
[94] Calculated with data from the report: “July 2022 Monthly Energy Review.” U.S. Energy Information Administration, Office of Energy Statistics, July 26, 2022. <www.eia.gov>
Page 131: “Table 7.2a. Electricity Net Generation: Total (All Sectors)”
NOTE: An Excel file containing the data and calculations is available upon request.
[95] Calculated with data from the report: “July 2022 Monthly Energy Review.” U.S. Energy Information Administration, Office of Energy Statistics, July 26, 2022. <www.eia.gov>
Page 131: “Table 7.2a. Electricity Net Generation: Total (All Sectors)”
NOTE: An Excel file containing the data and calculations is available upon request.
[96] Calculated with data from the report: “July 2022 Monthly Energy Review.” U.S. Energy Information Administration, Office of Energy Statistics, July 26, 2022. <www.eia.gov>
Page 131: “Table 7.2a. Electricity Net Generation: Total (All Sectors)”
NOTE: An Excel file containing the data and calculations is available upon request.
[97] Calculated with data from:
a) Dataset: “International Energy Outlook 2021, Delivered Energy Consumption by End-Use Sector and Fuel, Reference Case, Total World.” U.S. Energy Information Administration. Accessed August 1, 2022 at <www.eia.gov>
b) Dataset: “International Energy Outlook 2021, Net Electricity Generation by Region and Fuel, Reference Case, Total World.” U.S. Energy Information Administration. Accessed August 2, 2022 at <www.eia.gov>
NOTE: An Excel file containing the data and calculations is available upon request.
[98] Report: “International Energy Outlook 2016.” U.S. Energy Information Administration, May 2016. <www.eia.gov>
Page ii: “Nonmarketed energy sources include selected energy consumption data for which the energy is not bought or sold, either directly or indirectly, as an input to marketed energy—particularly, traditional fuels such as fuelwood, charcoal, agricultural waste, and animal dung used for cooking and water heating. EIA [U.S. Energy Information Administration] does not estimate or project total consumption of nonmarketed energy.”
Page 87:
Global production of wood pellets has increased significantly over the past five years, and demand in the European Union (EU) has led to international trade in this renewable energy source. In 2013, the EU accounted for 85% of the world’s total consumption of wood pellets for energy production.183 Wood pellets can be used for heating homes and businesses and as a fuel for small-scale industrial boilers . In the United Kingdom, Belgium, and the Netherlands, they are used predominantly for utility-scale electricity generation.
Page 273: “[K]ey primary energy sources: several petroleum products, other liquid fuels, natural gas, coal, nuclear power, hydropower, wind, geothermal, solar, and other renewable sources (biomass, waste, and tide/wave/ocean).”
[99] Calculated with data from:
a) Dataset: “International Energy Outlook 2021, Delivered Energy Consumption by End-Use Sector and Fuel, Reference Case, Total World.” U.S. Energy Information Administration. Accessed August 1, 2022 at <www.eia.gov>
b) Dataset: “International Energy Outlook 2021, Net Electricity Generation by Region and Fuel, Reference Case, Total World.” U.S. Energy Information Administration. Accessed August 2, 2022 at <www.eia.gov>
NOTE: An Excel file containing the data and calculations is available upon request.
[100] Report: “International Energy Outlook 2016.” U.S. Energy Information Administration, May 2016. <www.eia.gov>
Page ii: “Nonmarketed energy sources include selected energy consumption data for which the energy is not bought or sold, either directly or indirectly, as an input to marketed energy—particularly, traditional fuels such as fuelwood, charcoal, agricultural waste, and animal dung used for cooking and water heating. EIA [U.S. Energy Information Administration] does not estimate or project total consumption of nonmarketed energy.”
Page 87:
Global production of wood pellets has increased significantly over the past five years, and demand in the European Union (EU) has led to international trade in this renewable energy source. In 2013, the EU accounted for 85% of the world’s total consumption of wood pellets for energy production.183 Wood pellets can be used for heating homes and businesses and as a fuel for small-scale industrial boilers . In the United Kingdom, Belgium, and the Netherlands, they are used predominantly for utility-scale electricity generation.
Page 273: “[K]ey primary energy sources: several petroleum products, other liquid fuels, natural gas, coal, nuclear power, hydropower, wind, geothermal, solar, and other renewable sources (biomass, waste, and tide/wave/ocean).”
[101] Calculated with the dataset: “International Energy Outlook 2021, Net Electricity Generation by Region and Fuel, Reference Case, Total World.” U.S. Energy Information Administration. Accessed August 2, 2022 at <www.eia.gov>
NOTE: An Excel file containing the data and calculations is available upon request.
[102] Report: “International Energy Outlook 2016.” U.S. Energy Information Administration, May 2016. <www.eia.gov>
Page ii: “Nonmarketed energy sources include selected energy consumption data for which the energy is not bought or sold, either directly or indirectly, as an input to marketed energy—particularly, traditional fuels such as fuelwood, charcoal, agricultural waste, and animal dung used for cooking and water heating. EIA [U.S. Energy Information Administration] does not estimate or project total consumption of nonmarketed energy.”
Page 87:
Global production of wood pellets has increased significantly over the past five years, and demand in the European Union (EU) has led to international trade in this renewable energy source. In 2013, the EU accounted for 85% of the world’s total consumption of wood pellets for energy production.183 Wood pellets can be used for heating homes and businesses and as a fuel for small-scale industrial boilers . In the United Kingdom, Belgium, and the Netherlands, they are used predominantly for utility-scale electricity generation.
Page 273: “[K]ey primary energy sources: several petroleum products, other liquid fuels, natural gas, coal, nuclear power, hydropower, wind, geothermal, solar, and other renewable sources (biomass, waste, and tide/wave/ocean).”
[103] Calculated with the dataset: “International Energy Outlook 2021, Net Electricity Generation by Region and Fuel, Reference Case, Total World.” U.S. Energy Information Administration. Accessed August 2, 2022 at <www.eia.gov>
NOTE: An Excel file containing the data and calculations is available upon request.
[104] Report: “International Energy Outlook 2016.” U.S. Energy Information Administration, May 2016. <www.eia.gov>
Page ii: “Nonmarketed energy sources include selected energy consumption data for which the energy is not bought or sold, either directly or indirectly, as an input to marketed energy—particularly, traditional fuels such as fuelwood, charcoal, agricultural waste, and animal dung used for cooking and water heating. EIA [U.S. Energy Information Administration] does not estimate or project total consumption of nonmarketed energy.”
Page 87:
Global production of wood pellets has increased significantly over the past five years, and demand in the European Union (EU) has led to international trade in this renewable energy source. In 2013, the EU accounted for 85% of the world’s total consumption of wood pellets for energy production.183 Wood pellets can be used for heating homes and businesses and as a fuel for small-scale industrial boilers . In the United Kingdom, Belgium, and the Netherlands, they are used predominantly for utility-scale electricity generation.
Page 273: “[K]ey primary energy sources: several petroleum products, other liquid fuels, natural gas, coal, nuclear power, hydropower, wind, geothermal, solar, and other renewable sources (biomass, waste, and tide/wave/ocean).”
[105] Booklet: “Energy, Powering Your World.” By M.T. Westra and S. Kuyvenhoven. Foundation for Fundamental Research on Matter, Institute for Plasma Physics, Rijnhuizen (the Netherlands), 2002. <fire.pppl.gov>
Page 5:
The first energy crisis in history started in 1630, when charcoal, made from wood, started running out. Coal from coal mines could not be used for this purpose, as it contained too much water and sulphur, which made it burn at a lower temperature. Large parts of the woods in Sweden and Russia were turned into charcoal, to solve this problem. … By this time [around 1700], most of Europe and especially England had cut down most of their forests.
Page 42:
In western countries, there is not much pollution produced in homes. Most of us cook on electricity, gas or some fluid fuel, which is quite clean. However, about half of the households in the world depend on firewood and coal for cooking and heating. It is very hard to burn solid fuels in a clean way, because it is hard to mix them thoroughly with air in simple cooking stoves. In fact, only about 5–18 percent of the energy goes in the pot, the rest is wasted. What is more, incomplete burning of solid fuel produces a wide range of health-damaging pollutants, as shown in table 10.
… of course, the risk of pollutants is the largest when people are near. The problem is that the dirtiest fuels are used exactly at times when people are present: every day, in the kitchen and in heating stoves.
[106] Webpage: “Household Air Pollution and Health” World Health Organization, July 26, 2022. <www.who.int>
Worldwide, around 2.4 billion people still cook using solid fuels (such as wood, crop waste, charcoal, coal and dung) and kerosene in open fires and inefficient stoves.1 Most of these people are poor and live in low- and middle-income countries.
Household air pollution is generated by the use of inefficient and polluting fuels and technologies in and around the home that contains a range of health-damaging pollutants, including small particles that penetrate deep into the lungs and enter the bloodstream. In poorly ventilated dwellings, indoor smoke can have levels of fine particles 100 times higher than acceptable. Exposure is particularly high among women and children, who spend the most time near the domestic hearth. Reliance on polluting fuels and technologies also require significant time for cooking on an inefficient device, and gathering and preparing fuel.
[107] Article: “Greeks Raid Forests in Search of Wood to Heat Homes.” Wall Street Journal, January 11, 2013. <online.wsj.com>
Tens of thousands of trees have disappeared from parks and woodlands this winter across Greece, authorities said, in a worsening problem that has had tragic consequences as the crisis-hit country’s impoverished residents, too broke to pay for electricity or fuel, turn to fireplaces and wood stoves for heat.
As winter temperatures bite, that trend is dealing a serious blow to the environment, as hillsides are denuded of timber and smog from fires clouds the air in Athens and other cities, posing risks to public health.
[108] Article: “Woodland Heists: Rising Energy Costs Drive Up Forest Thievery.” By Renuka Rayasam. Der Spiegel, January 17, 2013. <www.spiegel.de>
With energy costs escalating, more Germans are turning to wood burning stoves for heat. That, though, has also led to a rise in tree theft in the country’s forests.
The Germany’s Renters Association estimates the heating costs will go up 22 percent this winter alone. A side effect is an increasing number of people turning to wood-burning stoves for warmth. Germans bought 400,000 such stoves in 2011, the German magazine FOCUS reported this week. It marks the continuation of a trend: the number of Germans buying heating devices that burn wood and coal has grown steadily since 2005, according to consumer research company GfK Group.
That increase in demand has now also boosted prices for wood, leading many to fuel their fires with theft.
[109] Report: “Life Cycle Assessment: Principles and Practice.” By Mary Ann Curran. U.S. Environmental Protection Agency, National Risk Management Research Laboratory, Office of Research and Development, May 2006. <nepis.epa.gov>
Page 1:
Life cycle assessment is a “cradle-to-grave” approach for assessing industrial systems. “Cradle-to-grave” begins with the gathering of raw materials from the earth to create the product and ends at the point when all materials are returned to the earth. LCA [life cycle assessment] evaluates all stages of a product’s life from the perspective that they are interdependent, meaning that one operation leads to the next. LCA enables the estimation of the cumulative environmental impacts resulting from all stages in the product life cycle, often including impacts not considered in more traditional analyses (e.g., raw material extraction, material transportation, ultimate product disposal, etc.). By including the impacts throughout the product life cycle, LCA provides a comprehensive view of the environmental aspects of the product or process and a more accurate picture of the true environmental trade-offs in product and process selection.
The term “life cycle” refers to the major activities in the course of the product’s life-span from its manufacture, use, and maintenance, to its final disposal, including the raw material acquisition required to manufacture the product. Exhibit 1-1 illustrates the possible life cycle stages that can be considered in an LCA and the typical inputs/outputs measured.
[110] Report: “Life-Cycle Greenhouse Gas Emissions of Transportation Fuels: Issues and Implications for Unconventional Fuel Sources.” IPIECA [International Petroleum Industry Environmental Conservation Association], September 14, 2010. <www.ipieca.org>
Page 13:
Life-cycle analysis is not a precise science. Whilst it does have a role in directing technology research, it provides great uncertainty when being used as a regulatory tool. The boundary and accounting choices are critical, changing the outcomes, when comparing across studies. Additionally, the margins of error in a study can actually be greater than the percentage reduction in emissions required under an LCFS [low carbon fuel standard], raising serious questions about their validity.
[111] Paper: “Emissions from Photovoltaic Life Cycles.” By Vasilis M. Fthenakis and others. Environmental Science & Technology, February 6, 2008. Pages 2168–2174. <pubs.acs.org>
Page 2168:
The production of energy by burning fossil fuels releases many pollutants and carbon dioxide to the environment. Indeed, all anthropogenic means of generating energy, including solar electric, create pollutants when their entire life cycle is taken into account. Life-cycle emissions result from using fossil-fuel-based energy to produce the materials for solar cells, modules, and systems, as well as directly from smelting, production, and manufacturing facilities. These emissions differ in different countries, depending on that country’s mixture in the electricity grid, and the various methods of material/fuel processing.
[112] Paper: “Energy Balance of the Global Photovoltaic (PV) Industry—Is the PV Industry a Net Electricity Producer?” By Michael Dale and Sally M. Benson. Environmental Science & Technology, February 26, 2013. Pages 3482–3489. <pubs.acs.org>
Page 3482:
A combination of declining costs and policy measures motivated by greenhouse gas (GHG) emissions reduction and energy security have driven rapid growth in the global installed capacity of solar photovoltaics (PV). This paper develops a number of unique data sets, namely the following: calculation of distribution of global capacity factor for PV deployment; meta-analysis of energy consumption in PV system manufacture and deployment; and documentation of reduction in energetic costs of PV system production. These data are used as input into a new net energy analysis of the global PV industry, as opposed to device level analysis. … Results suggest that the industry was a net consumer of electricity as recently as 2010. However, there is a >50% that in 2012 the PV industry is a net electricity provider and will “pay back” the electrical energy required for its early growth before 2020.
[113] Report: “Emission Factor Documentation for AP-42 Section 1.1: Bituminous And Subbituminous Coal Combustion.” By Acurex Environmental Corporation, Edward Aul & Associates, and E. H. Pechan and Associates. Prepared for the U.S. Environmental Protection Agency, Office of Air Quality Planning and Standards Office of Air And Radiation, April 1993. <nepis.epa.gov>
Page 2-1: “The amount and type of coal consumed, design of combustion equipment, and application of emission control technology have a direct bearing on emissions from coal-fired combustion equipment.”
[114] Paper: “Emissions from Photovoltaic Life Cycles.” By Vasilis M. Fthenakis and others. Environmental Science & Technology, February 6, 2008. Pages 2168–2174. <pubs.acs.org>
Page 2168: “Life-cycle emissions result from using fossil-fuel-based energy to produce the materials for solar cells, modules, and systems, as well as directly from smelting, production, and manufacturing facilities. These emissions differ in different countries, depending on that country’s mixture in the electricity grid, and the various methods of material/fuel processing.”
[115] Report: “Electric Power Annual 2020.” U.S. Energy Information Administration, Assistant Administrator for Energy Statistics, October 29, 2021. Updated 3/10/22. <www.eia.gov>
Page 202 (of PDF): “Table A.1. Sulfur Dioxide Uncontrolled Emission Factors … Fuel … Bituminous Coal … Cyclone Firing Boiler [=] 38.00 [lbs. per ton] … Fluidized Bed Firing Boiler [=] 3.80 [lbs. per ton]”
[116] Brief: “What Is the Role of Coal in the United States?” U.S. Energy Information Administration. Last updated July 18, 2012. <www.eia.gov>
Different types of coal have different characteristics including sulfur content, mercury content, and heat energy content. Heat content is used to group coal into four distinct categories, known as ranks: anthracite, bituminous, subbituminous, and lignite (generally in decreasing order of heat content).
There are far more bituminous coal mines in the United States than the other ranks (over 90% of total mines), but subbituminous mines (located predominantly in Wyoming and Montana) produce more coal because their average size is much larger.
[117] Report: “Emission Factor Documentation for AP-42 Section 1.1: Bituminous And Subbituminous Coal Combustion.” By Acurex Environmental Corporation, Edward Aul & Associates, and E. H. Pechan and Associates. Prepared for the U.S. Environmental Protection Agency, Office of Air Quality Planning and Standards Office of Air And Radiation, April 1993. <nepis.epa.gov>
Page 2-2:
Coal-fired boilers can be classified by type, fuel, and method of construction. Boiler types are identified by the heat transfer method (watertube, firetube, or cast iron), the arrangement of the heat transfer surfaces (horizontal or vertical, straight or bent tube), and the firing configuration (suspension, stoker, or fluidized bed). Table 2-2 summarizes boiler type usage by sector. Most of the installed capacity of firetube and cast iron units is oil- and gas-fired3; however, a description of these designs for coal is included here for completeness.
A watertube boiler is one in which the hot combustion gases contact the outside of the heat transfer tubes, while the boiler water and steam are contained within the tubes. Coal-fired watertube boilers consist of pulverized coal, cyclone, stoker, fluidized bed, and handfeed units. Pulverized coal and cyclone boilers are types of suspension systems because some or all of the combustion takes place while the fuel is suspended in the furnace volume. In stoker-fired systems and most handfeed units, the fuel is primarily burned on the bottom of the furnace or on a grate. Some fine particles are entrained in upwardly flowing air, however, and are burned in suspension in the upper furnace volume. In a fluidized bed combustor, the coal is introduced to a bed of either sorbent or inert material (usually sand) which is fluidized by an upward flow of air. Most of the combustion occurs within the bed, but some smaller particles burn above the bed in the “freeboard” space. …
In pulverized coal-fired (PC-fired) boilers the fuel is pulverized to the consistency of light powder and pneumatically injected through the burners into the furnace. Combustion in PC-fired units takes place almost entirely while the coal is suspended in the furnace volume. PC-fired boilers are classified as either dry bottom or wet bottom, depending on whether the ash is removed in solid or molten state. In dry bottom furnaces, coals with high fusion temperatures are burned, resulting in dry ash. In wet bottom furnaces, coals with low fusion temperatures are used, resulting in molten ash or slag. Wet bottom furnaces are also referred to as slag tap furnaces.
Page 2-3:
Wall-fired boilers can be either single wall-fired, with burners on only one wall of the furnace firing horizontally, or opposed wall-fired, with burners mounted on two opposing walls. PC-fired suspension boilers usually are characterized by very high combustion efficiencies, and are generally receptive to low-NOX [nitrogen oxides] burners and other combustion modification techniques. Tangential or corner-fired boilers have burners mounted in the corners of the furnace. The fuel and air are injected toward the center of the furnace to create a vortex that is essentially the burner. Because of the large flame volumes and relatively slow mixing, tangential boilers tend to be lower NOX emitters for baseline uncontrolled operation. Cyclone furnaces are often categorized as a PC-fired system even though the coal burned in a cyclone is crushed to a maximum size of about 4.75 mm (4 mesh). The coal is fed tangentially, with primary air, into a horizontal cylindrical furnace. Smaller coal particles are burned in suspension while larger particles adhere to the molten layer of slag on the combustion chamber wall. Cyclone boilers are high-temperature, wet bottom-type systems. Because of their high furnace heat release rate, cyclones are high NOX emitters and are generally more difficult to control with combustion modifications.
[118] Presentation: “Uncertainty Analysis in LCA [life-cycle assessment] Concepts, Tools, and Practice.” By Reinout Heijungs. Leiden University, Institute of Environmental
Sciences, July 22, 2010. <formations.cirad.fr>
Pages 5–6 (of PDF):
What is uncertainty? (1)
Lots of meanings:
• incomplete information
• conflicting information
• linguistic imprecision
• variability
• errors …
What is uncertainty? (2)
Abundance of typologies and terminologies:
• systematic errors, random errors …
• data uncertainty, model uncertainty, completeness uncertainty …
• scenario uncertainty, parameter uncertainty, model uncertainty …
• uncertainty vs. accuracy vs. variability vs. sensitivity vs.…
[119] Paper: “Evaluating Uncertainty in Environmental Life-Cycle Assessment. A Case Study Comparing Two Insulation Options for a Dutch One-Family Dwelling.” By Mark A. J. Huijbregts and others. Environmental Science & Technology, May 29, 2003. Pages 2600–2608. <pubs.acs.org>
Abstract:
The evaluation of uncertainty is relatively new in environmental life-cycle assessment (LCA). It provides useful information to assess the reliability of LCA-based decisions and to guide future research toward reducing uncertainty. Most uncertainty studies in LCA quantify only one type of uncertainty, i.e., uncertainty due to input data (parameter uncertainty). However, LCA outcomes can also be uncertain due to normative choices (scenario uncertainty) and the mathematical models involved (model uncertainty).
[120] Report: “Environmental Decisions in the Face of Uncertainty.” National Academy of Sciences, Institute of Medicine, 2013. <www.nap.edu>
Page 1:
The U.S. Environmental Protection Agency (EPA) is one of several federal agencies responsible for protecting Americans against significant risks to human health and the environment. As part of that mission, EPA estimates the nature, magnitude, and likelihood of risks to human health and the environment; identifies the potential regulatory actions that will mitigate those risks and protect public health1 and the environment; and uses that information to decide on appropriate regulatory action. Uncertainties, both qualitative and quantitative, in the data and analyses on which these decisions are based enter into the process at each step.
[121] Article: “Background and Reflections on the Life Cycle Assessment Harmonization Project.” By Garvin A. Heath and Margaret K. Mann. Journal of Industrial Ecology, April 4, 2012. Pages S8–S11. <onlinelibrary.wiley.com>
Page S8:
Despite the ever-growing body of life cycle assessment (LCA) literature on electricity generation technologies, inconsistent methods and assumptions hamper comparison across studies and pooling of published results. Synthesis of the body of previous research is necessary to generate robust results to assess and compare environmental performance of different energy technologies for the benefit of pol-icy makers, managers, investors, and citizens. …
The LCA Harmonization Project’s initial focus was evaluating life cycle greenhouse gas (GHG) emissions from electricity generation technologies. Six articles from this first phase of the project are presented in a special supplemental issue of the Journal of Industrial Ecology on Meta-Analysis of LCA: coal (Whitaker and others 2012), concentrating solar power (Burkhardt and others 2012), crystalline silicon photovoltaics (PVs) (Hsu and others 2012), thin-film PVs (Kim and others 2012), nuclear (Warner and Heath 2012), and wind (Dolan and Heath2012).
Page S10:
Harmonization is a meta-analytical approach that addresses inconsistency in methods and assumptions of previously published life cycle impact estimates. It has been applied in a rigorous manner to estimates of life cycle GHG emissions from many categories of electricity generation technologies in articles that appear in this special supplemental issue, reducing the variability and clarifying the central tendency of those estimates in ways useful for decision makers and analysts.
[122] Webpage: “Air Emissions.” U.S. Environmental Protection Agency. Last updated October 17, 2012. <www.justfacts.com>
Nuclear power plants do not emit carbon dioxide, sulfur dioxide, or nitrogen oxides. However, fossil fuel emissions are associated with the uranium mining and uranium enrichment process as well as the transport of the uranium fuel to the nuclear plant. …
Hydropower’s air emissions are negligible because no fuels are burned. …
Emissions associated with generating electricity from solar technologies are negligible because no fuels are combusted. …
Emissions associated with generating electricity from geothermal technologies are negligible because no fuels are combusted. …
Emissions associated with generating electricity from wind technology are negligible because no fuels are combusted.
[123] Paper: “Life Cycle Greenhouse Gas Emissions of Nuclear Electricity Generation: Systematic Review and Harmonization.” By Ethan S. Warner and Garvin A. Heath. Journal of Industrial Ecology, April 2012. Pages S73–S92. <onlinelibrary.wiley.com>
Page S73:
Screening 274 references yielded 27 that reported 99 independent estimates of life cycle GHG [greenhouse gas] emissions from light water reactors (LWRs). The published median, interquartile range (IQR), and range for the pool of LWR life cycle GHG emission estimates were 13, 23, and 220 grams of carbon dioxide equivalent per kilowatt-hour (g CO2-eq/kWh), respectively. After harmonizing methods to use consistent gross system boundaries and values for several important system parameters, the same statistics were 12, 17, and 110 g CO2-eq/kWh, respectively. Harmonization (especially of performance characteristics) clarifies the estimation of central tendency and variability.
Page S90:
This study ultimately concludes that given the large number of previously published life cycle GHG emissions estimates of nuclear power systems, their relatively narrow distribution postharmonization, and assuming deployment under relatively similar conditions examined in literature passing screens, it is unlikely that new process-based LCAs [life cycle assessments] of LWRs would fall outside the range of, and will probably be similar in central tendency to, existing literature. The collective LCA literature indicates that life cycle GHG emissions from nuclear power are only a fraction of traditional fossil sources (e.g., Whitaker et al. 2012) and comparable to renewable technologies (e.g., Dolan and Heath 2012). Evidence is limited on whether similar conclusions apply consistently to other common technologies (i.e., HWRs [heavy water reactors] and GCRs [gas-cooled reactors]).
However, the conditions and assumptions under which nuclear power is deployed can have a significant impact on the magnitude of life cycle GHG emissions, and several related contextual and consequential issues remain unexamined in much of the existing literature. …
NOTE: This study only examines greenhouse gases and not air pollutants such as SO2 [sulfur dioxide] and NOX [nitrogen oxides]. However, because the greenhouse gases emitted in the lifecycle of nuclear power are primarily generated by the usage of fossil fuels, greenhouse gases serve as a rough proxy for qualitative (not quantitative) emissions of air pollutants.
[124] Paper: “Emissions from Photovoltaic Life Cycles.” By Vasilis M. Fthenakis and others. Environmental Science & Technology, February 6, 2008. Pages 2168–2174. <pubs.acs.org>
Page 2173:
Using data compiled from the original records of twelve PV [photovoltaic] manufacturers, we quantified the emissions from the life cycle of four major commercial photovoltaic technologies and showed that they are insignificant in comparison to the emissions that they replace when introduced in average European and U.S. grids. According to our analysis, replacing grid electricity with central PV systems presents significant environmental benefits, which for CdTe [cadmium telluride] PV amounts to 89–98% reductions of GHG [greenhouse gas] emissions, criteria pollutants, heavy metals, and radioactive species. For roof-top dispersed installations, such pollution reductions are expected to be even greater as the loads on the transmission and distribution networks are reduced, and part of the emissions related to the life cycle of these networks are avoided.
[125] Webpage: “Geothermal Energy and the Environment.” U.S. Energy Information Administration. Last updated November 19, 2020. <www.eia.gov>
Geothermal power plants do not burn fuel to generate electricity, but they may release small amounts of sulfur dioxide and carbon dioxide. Geothermal power plants emit 97% less acid rain-causing sulfur compounds and about 99% less carbon dioxide than fossil fuel power plants of similar size. Geothermal power plants use scrubbers to remove the hydrogen sulfide naturally found in geothermal reservoirs. Most geothermal power plants inject the geothermal steam and water that they use back into the earth. This recycling helps to renew the geothermal resource and to reduce emissions from the geothermal power plants.
[126] Paper: “Life Cycle Greenhouse Gas Emissions of Utility-Scale Wind Power: Systematic Review and Harmonization.” By Stacey L. Dolan and Garvin A. Heath. Journal of Industrial Ecology, April 2012. Pages S136–S154. <onlinelibrary.wiley.com>
Page S136:
Interest in technologies powered by renewable energy sources such as the wind and sun has grown partly because of the potential to reduce greenhouse gas (GHG) emissions from the power sector. However, due to GHG emissions produced during equipment manufacture, transportation, on-site construction, maintenance, and decommissioning, wind and solar technologies are not GHG emission-free.
Pages S151–152:
Life cycle GHG [greenhouse] emissions of wind-powered electricity generation published since 1980 range from 1.7 to 81 g CO2-eq/kWh. Although this is already a tight range, upon harmonizing the data to a consistent set of GWPs [global warming potentials], system lifetime, capacity factors, and gross system boundary, the range of life cycle GHG emission estimates was reduced by 47%, to 3.0 to 45 g CO2-eq/kWh. … the parameter found to have the greatest effect on reducing variability is capacity factor.
NOTE: This study only examines greenhouse gases and not air pollutants such as SO2 [sulfur dioxide] and NOX [nitrogen oxides]. However, because the greenhouse gases emitted in the lifecycle of wind turbines are primarily generated by the usage of fossil fuels, greenhouse gases serve as a rough proxy for qualitative (not quantitative) emissions of air pollutants.
[127] Webpage: “Geothermal Heat Pumps.” U.S. Energy Information Administration. Last reviewed November 19, 2020. <www.eia.gov>
“According to the U.S. Environmental Protection Agency (EPA), geothermal heat pumps are the most energy-efficient, environmentally clean, and cost-effective systems for heating and cooling buildings. All types of buildings, including homes, office buildings, schools, and hospitals, can use geothermal heat pumps.”
[128] Webpage: “Biofuels Explained: Biofuels and the Environment.” U.S. Energy Information Administration. Last reviewed April 13, 2022. <www.eia.gov>
When burned, pure biofuels generally produce fewer emissions of particulates, sulfur dioxide, and air toxics than their fossil-fuel derived counterparts. Biofuel-petroleum blends also generally result in lower emissions relative to fuels that do not contain biofuels. Biodiesel combustion may result in slightly higher amounts of nitrogen oxides relative to petroleum diesel.
Ethanol and ethanol-gasoline mixtures burn cleaner and have higher octane levels than gasoline that does not contain ethanol, but they also have higher evaporative emissions from fuel tanks and dispensing equipment. These evaporative emissions contribute to the formation of harmful, ground-level ozone and smog. Gasoline requires extra processing to reduce evaporative emissions before blending with ethanol.
[129] Paper: “Impacts of Biofuel Cultivation on Mortality and Crop Yields.” By K. Ashworth and others. Nature Climate Change, January 6, 2013. Pages 492–496. <www.nature.com>
Page 492:
Ground-level ozone is a priority air pollutant …. It is produced in the troposphere through photochemical reactions involving oxides of nitrogen (NOX) and volatile organic compounds (VOCs). … Concerns about climate change and energy security are driving an aggressive expansion of bioenergy crop production and many of these plant species emit more isoprene than the traditional crops they are replacing. Here we quantify the increases in isoprene emission rates caused by cultivation of 72 Mha of biofuel crops in Europe. We then estimate the resultant changes in ground-level ozone concentrations and the impacts on human mortality and crop yields that these could cause.
[130] Webpage: “Ground-Level Ozone Standards Designations: Frequently Asked Questions.” U.S. Environmental Protection Agency. Last updated March 8, 2016. <archive.epa.gov>
Ozone is a gas composed of three atoms of oxygen. Ozone occurs both in the Earth’s upper atmosphere and at ground level. Ozone can be good or bad, depending on where it is found.
Good Ozone
Good ozone occurs naturally in the upper atmosphere, 6 to 30 miles above the Earth’s surface, where it forms a protective layer that shields us from the sun’s harmful ultraviolet rays. This beneficial ozone is gradually being destroyed by manmade chemicals. When the protective ozone “layer” has been significantly depleted; for example, over the North or South Pole; it is sometimes called a “hole in the ozone.”
Bad Ozone
Troposheric, or ground level ozone, is not emitted directly into the air, but is created by chemical reactions between oxides of nitrogen (NOX) and volatile organic compounds (VOC). Ozone is likely to reach unhealthy levels on hot sunny days in urban environments. Ozone can also be transported long distances by wind. For this reason, even rural areas can experience high ozone levels.
[131] Webpage: “Air Emissions.” U.S. Environmental Protection Agency. Last updated September 25, 2013. <www.justfacts.com>
Biomass power plants emit nitrogen oxides and a small amount of sulfur dioxide. The amounts emitted depend on the type of biomass that is burned and the type of generator used. … Biomass contains much less sulfur and nitrogen than coal;6 therefore, when biomass is co-fired with coal, sulfur dioxide and nitrogen oxides emissions are lower than when coal is burned alone.
[132] Paper: “A Review of the Environmental Impacts of Biobased Materials.” By Martin Weiss and others. Journal of Industrial Ecology, April 12, 2012. Pages S169–S181. <onlinelibrary.wiley.com>
Page S173:
A limited number of seven LCA [life cycle assessment] studies indicates that biobased materials may increase stratospheric ozone depletion by, on average, 1.9 ± 1.8 kg N2O-eq/t and 2.4 ± 1.3kg N2O-eq/(ha∗a) relative to their conventional counterparts (figure 1). The additional impacts thereby account, respectively, for 28 ± 26% and 35 ± 18% of the worldwide average per capita ozone depletion potential in the year 2000.The impacts in this category largely result from N2O [nitrous oxide] emissions that originate from fertilizer application in agriculture (Muller-Samannand others 2002; Wurdinger and others 2002). Because fertilizer application is characteristic for industrial farming used for growing biomass, high stratospheric ozone depletion potentials may be found for a wide range of biobased materials.
Pages S176–177:
• Biobased materials generally exert lower environmental impacts than conventional materials in the category of climate change (if GHG [greenhouse gas] emissions from indirect land use change are neglected).
• Biobased materials may exert higher environmental impacts than their conventional counterparts in the categories of eutrophication and stratospheric ozone depletion; our results are inconclusive with regard to acidification and photochemical ozone formation. …
• The GHG emissions savings identified here are uncertain because the reviewed LCA studies (1) may only insufficiently account for N2O emissions from biomass cultivation and (2) exclude the effects of indirect land use change. Depending on product scenarios and time horizons, especially the latter factor may substantially lower the established GHG emissions savings. Further research is needed.
[133] Book: Fundamentals of Natural Gas. By Vivek Chandra. Pennwell, 2006. <vdoc.pub>
Natural gas offers a number of significant environmental benefits over other fossil fuels. Largely a result of its chemical simplicity, it is the cleanest burning of all fossil fuels. Natural gas is primarily composed of methane, with most of the impurities removed by gas processing at the field and gas plant. …
… Studies indicate that vehicles operating on natural gas versus conventional fuels such as gasoline and diesel fuels can reduce CO [carbon monoxide] output by 90% to 97% and CO2 [carbon dioxide] by 25%. The switch can also significantly reduce NOX [nitrogen oxides] emissions, as well as nonhydrocarbon emissions and particulates.
[134] Booklet: “Energy, Powering Your World.” By M.T. Westra and S. Kuyvenhoven. Foundation for Fundamental Research on Matter, Institute for Plasma Physics, Rijnhuizen (the Netherlands), 2002. <fire.pppl.gov>
Page 25: “Natural gas is made up mainly of methane (CH4), a compound that has a carbon atom surrounded by four hydrogen atoms. Methane is highly flammable and burns almost completely. There is no ash and very little air pollution. Natural gas is colourless and in its pure form, odourless.”
[135] Book: Energy and the Missing Resource: A View from the Laboratory. By I. Dostrovsky. Cambridge University Press, 1988.
Pages 21–22: “Natural gas consists essentially of methane diluted by some other light hydrocarbons and contaminated at times by carbon dioxide and hydrogen sulfide. These diluents or noxious gases must be removed before the methane is shipped to consumers. Beyond this relatively simple operation, the raw material requires little processing.”
[136] Webpage: “Air Emissions.” U.S. Environmental Protection Agency. Last updated September 25, 2013. <www.justfacts.com>
At the power plant, the burning of natural gas produces nitrogen oxides … but in lower quantities than burning coal or oil. … Similarly, methane can be emitted as the result of leaks and losses during transportation. Emissions of sulfur dioxide and mercury compounds from burning natural gas are negligible.
The average emissions rates in the United States from natural gas-fired generation are … 0.1 lbs/MWh [pounds per megawatthour] of sulfur dioxide, and 1.7 lbs/MWh of nitrogen oxides.1 Compared to the average air emissions from coal-fired generation, natural gas produces … less than a third as much nitrogen oxides, and one percent as much sulfur oxides at the power plant. In addition, the process of extraction, treatment, and transport of the natural gas to the power plant generates additional emissions.
[137] Webpage: “Civic Natural Gas: Frequently Asked Questions.” American Honda Motor Company. Accessed February 3, 2016 at <automobiles.honda.com>
“In fact, the Civic Natural Gas is the cleanest internal-combustion vehicle ever tested by the U.S. Environmental Protection Agency2. … 2 EPA [Environmental Protection Agency] Tier-2, Bin-2 and ILEV [Inherently Low Emission Vehicle] certification as of December 2013.”
[138] Webpage: “Air Emissions.” U.S. Environmental Protection Agency. Last updated October 17, 2012. <www.justfacts.com>
When coal is burned … sulfur dioxide, nitrogen oxides, and mercury compounds are released. For that reason, coal-fired boilers are required to have control devices to reduce the amount of emissions that are released.
The average emission rates in the United States from coal-fired generation are … 13 lbs/MWh [pounds per megawatthour] of sulfur dioxide, and 6 lbs/MWh of nitrogen oxides.3
Mining, cleaning, and transporting coal to the power plant generate additional emissions.
NOTE: The table below was constructed by Just Facts with data from this EPA webpage:
|
Average U.S. Emissions of Electricity Generation (Pounds Per MWh) |
||
|
Fuel |
SO2 |
NOX |
|
Natural gas† |
0.1 |
1.7 |
|
Coal† |
13.0 |
6.0 |
|
Oil† |
12.0 |
4.0 |
|
Municipal Solid Waste‡ |
0.8 |
5.4 |
Cited sources:
† U.S. EPA, eGRID 2000.
‡ U.S. EPA, Compilation of Air Pollutant Emission Factors (AP-42).
[139] Study Guide: “Coal.” U.S. Department of Energy, February, 24, 2010. <energy.gov>
Page 5:
While we may rely on coal for nearly half of our electricity, it is far from being the perfect fuel. Coal contains traces of impurities like sulfur and nitrogen. When coal burns, these impurities are released into the air, where they can combine with water vapor (for example, in clouds) and form droplets that fall to earth as weak forms of sulfuric and nitric acid—called “acid rain.” There are also tiny specks of minerals—including common dirt—mixed in coal. These particles don’t burn and make up the ash left behind in a coal combustor. Some of the particles also get caught up in the swirling combustion gases and, along with water vapor, form the smoke that comes out of a coal plant’s smokestack. Mercury is another potentially harmful emission contained in coal power plant emissions. …
While coal used to be a dirty fuel to burn, technology advances have helped to greatly improve air quality, especially in the last 20 years. Scientists have developed ways to capture the pollutants trapped in coal before they escape into the atmosphere. Today, technology can filter out 99 percent of the tiny particles and remove more than 95 percent of the acid rain pollutants in coal, and also help control mercury.
[140] Presentation: “Changes in Control Technologies at Coal-Fired Units: 2000–2016.” U.S. Environmental Protection Agency, 2016. <www.epa.gov>
Page 1: “2000 Coal Controls for SO2 [sulfur dioxide] and NOX [nitrogen oxides] … Virtually all coal-fired units have electrostatic precipitators, baghouses, or other advanced controls for high levels of particulate removal.”
[141] Calculated with the dataset: “Power Plant Emissions Trends.” U.S. Environmental Protection Agency. Last updated June 27, 2022. <www.epa.gov>
NOTE: An Excel file containing the data and calculations is available upon request.
[142] Proposed rule: “Regulation to Mitigate the Misfueling of Vehicles and Engines with Gasoline Containing Greater Than Ten Volume Percent Ethanol and Modifications to the Reformulated and Conventional Gasoline Programs.” Federal Register, November 4, 2010. <www.govinfo.gov>
Pages 68069–68070:
As a result of the Clean Air Act, EPA [U.S. Environmental Protection Agency] established standards and measurement procedures for exhaust, evaporative, and refueling emissions of criteria pollutants. From 1975 into the 1980s, motor vehicles became equipped with catalytic converters, first with catalysts capable of oxidizing HC [hydrocarbons] and CO [carbon monoxide], and then, in response to EPA’s “Tier 0” standards, with three-way catalysts that also reduced NOX [nitrogen oxides]. Motor vehicles produced in the 1980s and even more so in the 1990s as a result of more stringent California and Federal (e.g., “Tier 1”) standards evolved to incorporate more sophisticated and durable emission control systems. These systems generally included an onboard computer, oxygen sensor, and electronic fuel injection with more precise closed-loop fuel compensation and therefore A/F [air-to-fuel] ratio control during more of the engine’s operating range. However, even with the use of closed loop systems through the late 1990s, the emission control system and controls remained fairly simple with a limited range of authority and were primarily designed to adjust for component variability (i.e., fuel pressure, injectors, etc.) and not for changes in the fuel composition.
[143] Webpage: “Glossary – Mobile Source Emissions – Past, Present, and Future.” U.S. Environmental Protection Agency, Office of Transportation and Air Quality. Last updated July 09, 2007. <www.epa.gov>
“Catalytic Converter: An anti-pollution device located between a vehicle’s engine and tailpipe. Catalytic converters work by facilitating chemical reactions that convert exhaust pollutants such as carbon monoxide and nitrogen oxides to normal atmospheric gases such as nitrogen, carbon dioxide, and water.”
[144] Webpage: “Glossary.” U.S. Energy Information Administration. Accessed July 18, 2013 at <www.eia.gov>
“Catalytic converter: A device containing a catalyst for converting automobile exhaust into mostly harmless products.”
[145] Webpage: “Federal Tax Credits for New All-Electric and Plug-in Hybrid Vehicles.” U.S. Department of Energy and U.S. Environmental Protection Agency. Updated July 7, 2022 at <www.fueleconomy.gov>
“All-electric and plug-in hybrid cars purchased new in or after 2010 may be eligible for a federal income tax credit of up to $7,500. The credit amount will vary based on the capacity of the battery used to power the vehicle. State and/or local incentives may also apply.”
[146] Webpage: “State and Federal Electric Vehicle Funding Programs.” Massachusetts State Government. Accessed June 25, 2021 at <www.mass.gov>
The Department of Energy Resources’ Massachusetts Offers Rebates for Electric Vehicles (MOR-EV) program which had expired on September 30th, 2019, has been re-opened. Starting on January 1, 2020, MOR-EV will be extended to support qualifying battery electric vehicles (BEVs) and fuel cell electric vehicles (FCEVs) up to a $50,000 final purchase price with a $2,500 rebate. Additionally, plug-in hybrid electric vehicles (PHEVS) with an all-electric range of 25 miles or greater and with a final purchase price up to $50,000 are eligible for a $1,500 rebate.
[147] Press release: “Governor Newsom Announces California Will Phase Out Gasoline-Powered Cars & Drastically Reduce Demand for Fossil Fuel in California’s Fight Against Climate Change.” Office of Governor Gavin Newson, September 23, 2020. <www.gov.ca.gov>
Governor Gavin Newsom today announced that he will aggressively move the state further away from its reliance on climate change-causing fossil fuels while retaining and creating jobs and spurring economic growth—he issued an executive order requiring sales of all new passenger vehicles to be zero-emission by 2035 and additional measures to eliminate harmful emissions from the transportation sector. …
Following the order, the California Air Resources Board will develop regulations to mandate that 100 percent of in-state sales of new passenger cars and trucks are zero-emission by 2035—a target which would achieve more than a 35 percent reduction in greenhouse gas emissions and an 80 percent improvement in oxides of nitrogen emissions from cars statewide. In addition, the Air Resources Board will develop regulations to mandate that all operations of medium- and heavy-duty vehicles shall be 100 percent zero emission by 2045 where feasible, with the mandate going into effect by 2035 for drayage trucks. To ensure needed infrastructure to support zero-emission vehicles, the order requires state agencies, in partnership with the private sector, to accelerate deployment of affordable fueling and charging options. It also requires support of new and used zero-emission vehicle markets to provide broad accessibility to zero-emission vehicles for all Californians.
[148] Webpage: “Zero Emission Vehicles.” Vermont State Department of Environmental Conservation. Accessed June 25, 2021 at <dec.vermont.gov>
Vermont’s Low Emission Vehicle (LEV) program, authorized under section 177 of the Clean Air Act, has been a centerpiece of Vermont’s air quality efforts since 1996. The Zero Emission Vehicle (ZEV) program, which is a technology-forcing component of the LEV program, has been a major contributor to the successful commercialization of hybrid-electric vehicles and ultra-low-emission technologies. To date, 12 states have adopted the ZEV Program (California, Colorado, Connecticut, Maine, Maryland, Massachusetts, New Jersey, New York, Oregon, Rhode Island, Vermont and Washington).
The ZEV program requires increasing sales of ZEVs over the next decade. The annual sales requirements in state programs are modest at the outset, but increase over time, anticipating that consumer demand will expand as consumers become more familiar with a growing range of continually improving ZEV products. The ZEV program provides manufacturers substantial flexibility through mechanisms such as credit banking and trading, alternative compliance options, cross-state credit pooling, and by allowing manufacturers to develop their preferred compliance strategy using Battery Electric Vehicles (BEVs), Plug-in Hybrid Electric Vehicles (PHEVs), Fuel Cell Electric Vehicles (FCEVs), or some combination. The Vermont Department of Environmental Conservation estimates that by 2025, about 5.4 percent of new vehicles sold in Vermont will be required to be ZEVs.
[149] Paper: “Comparative Life Cycle Assessment of Conventional, Electric and Hybrid Passenger Vehicles in Spain.” By Gonzalo Puig-Samber Naranjo and others. Journal of Cleaner Production, April 1, 2021. <www.sciencedirect.com>
[C]urrent and future energy scenario predictions show that electric vehicles will produce an increase in fine particulate matter formation (26%), human carcinogenic (20%) and non-carcinogenic toxicity (61%), terrestrial ecotoxicity (31%), freshwater ecotoxicity (39%), and marine ecotoxicity (41%) relative to petrol vehicles. …
The scope of this study represents a cradle-to-grave approach, considering five life cycle phases: i) vehicle manufacture, ii) components production and transport, iii) vehicle distribution, iv) use phase and v) end-of-life (see Fig. 1), which are further subdivided to express the results and identify hotspots at a process level. …
The results are given (1) for all the vehicle models in the baseline scenario, including the electric vehicle with battery replacement and (2) for the electric vehicle, in future scenarios (2030 and 2050). LCIA [life cycle impact assessment] results are broken down into various vehicle life cycle phases and emission sources….
… Baseline BEV [battery electric vehicle] impact in terms of fine particulate matter formation is caused in a high proportion (40%) by the electricity generation mix, mainly because of the electricity generation from coal, lignite and to a lesser extent oil. The cradle-to-gate phase always contributes the most, principally because of the steel employed for the glider manufacture. …
… Human toxicity related categories are principally influenced by the disposal of sulfidic tailings generated during copper, nickel and gold extraction. Regarding the human carcinogenic toxicity impact category, steel production also plays a major role, which explains the more intensive cradle-to-gate phase of ICEVs [internal combustion engine vehicles] and HEVs [hybrid electric vehicle]. Still, BEVs show the highest impact for both categories in present and future scenarios. This is due to the high copper demand related to the traction battery manufacturing and the influence of the electricity grid. For all vehicles, the vehicle and battery manufacture are the life cycle hotspots, representing 74–88% of the total impact in the baseline and future scenarios. …
The Monte Carlo test provides the confidence intervals of the results. The results for GWP and Fine particulate matter formation show the lowest deviation from the mean, whereas categories related to human toxicity have the largest uncertainties … linked to the large uncertainty of the emissions of Zn and Cr (VI) into water, which are the major contributors to human carcinogenic and non-carcinogenic toxicity, respectively. Regarding ecotoxicity-related categories, BEVs and HEVs have larger uncertainties than ICEVs because of the higher deviations of the most contributing processes: emissions of Zn into water (i.e. aquatic ecotoxicity categories) and Cu airborne emissions. Generally, the uncertainty analysis of the difference between vehicles and the BEV confirms the conclusions drawn in this study. This difference is considered statistically-significant when at least 95% of the Monte Carlo runs show a clear positive or negative output. …
The results highlight the need for evaluating passenger vehicles from a cradle-to-grave perspective and considering different impact categories. The study underlines that this approach is increasingly required because of both BEV and HEV transfer of environmental burdens to the cradle-to-gate phase and their very high impacts on human health and ecosystems. In this regard, BEVs perform the worst regarding fine particulate matter formation, human toxicity and ecotoxicity in current and future scenarios.
[150] Synthesis report: “Climate Change 2007.” Based on a draft prepared by Lenny Bernstein and others. World Meteorological Organization/United Nations Environment Programme, Intergovernmental Panel on Climate Change, 2007. <www.ipcc.ch>
Page 36: “Carbon dioxide (CO2) is the most important anthropogenic GHG [greenhouse gas]. Its annual [anthropogenic] emissions have grown between 1970 and 2004 by about 80%, from 21 to 38 gigatonnes (Gt), and represented 77% of total anthropogenic GHG emissions in 2004….”
[151] Book: Dictionary of Environment and Development: People, Places, Ideas and Organizations. By Andy Crump. MIT Press, 1993.
Page 42: “It is known that carbon dioxide contributes more than any other gas to the greenhouse effect….”
[152] Article: “Background and Reflections on the Life Cycle Assessment Harmonization Project.” By Garvin A. Heath and Margaret K. Mann. Journal of Industrial Ecology, April 4, 2012. Pages S8–S11. <onlinelibrary.wiley.com>
Page S8:
Despite the ever-growing body of life cycle assessment (LCA) literature on electricity generation technologies, inconsistent methods and assumptions hamper comparison across studies and pooling of published results. Synthesis of the body of previous research is necessary to generate robust results to assess and compare environmental performance of different energy technologies for the benefit of pol-icy makers, managers, investors, and citizens. …
The LCA Harmonization Project’s initial focus was evaluating life cycle greenhouse gas (GHG) emissions from electricity generation technologies. Six articles from this first phase of the project are presented in a special supplemental issue of the Journal of Industrial Ecology on Meta-Analysis of LCA: coal (Whitaker and others 2012), concentrating solar power (Burkhardt and others 2012), crystalline silicon photovoltaics (PVs) (Hsu and others 2012), thin-film PVs (Kim and others 2012), nuclear (Warner and Heath 2012), and wind (Dolan and Heath2012).
Page S10:
Harmonization is a meta-analytical approach that addresses inconsistency in methods and assumptions of previously published life cycle impact estimates. It has been applied in a rigorous manner to estimates of life cycle GHG emissions from many categories of electricity generation technologies in articles that appear in this special supplemental issue, reducing the variability and clarifying the central tendency of those estimates in ways useful for decision makers and analysts.
[153] Webpage: “Air Emissions.” U.S. Environmental Protection Agency. Last updated September 25, 2013. <www.justfacts.com>
Nuclear power plants do not emit carbon dioxide, sulfur dioxide, or nitrogen oxides. However, fossil fuel emissions are associated with the uranium mining and uranium enrichment process as well as the transport of the uranium fuel to the nuclear plant. …
Emissions associated with generating electricity from solar technologies are negligible because no fuels are combusted. …
Emissions associated with generating electricity from geothermal technologies are negligible because no fuels are combusted. …
Emissions associated with generating electricity from wind technology are negligible because no fuels are combusted.
[154] Paper: “Life Cycle Greenhouse Gas Emissions of Nuclear Electricity Generation: Systematic Review and Harmonization.” By Ethan S. Warner and Garvin A. Heath. Journal of Industrial Ecology, April 2012. Pages S73–S92. <onlinelibrary.wiley.com>
Page S73:
Screening 274 references yielded 27 that reported 99 independent estimates of life cycle GHG [greenhouse gas] emissions from light water reactors (LWRs). The published median, interquartile range (IQR), and range for the pool of LWR life cycle GHG emission estimates were 13, 23, and 220 grams of carbon dioxide equivalent per kilowatt-hour (g CO2-eq/kWh), respectively. After harmonizing methods to use consistent gross system boundaries and values for several important system parameters, the same statistics were 12, 17, and 110 g CO2-eq/kWh, respectively. Harmonization (especially of performance characteristics) clarifies the estimation of central tendency and variability.
Page S90:
This study ultimately concludes that given the large number of previously published life cycle GHG emissions estimates of nuclear power systems, their relatively narrow distribution postharmonization, and assuming deployment under relatively similar conditions examined in literature passing screens, it is unlikely that new process-based LCAs [life cycle assessments] of LWRs would fall outside the range of, and will probably be similar in central tendency to, existing literature. The collective LCA literature indicates that life cycle GHG emissions from nuclear power are only a fraction of traditional fossil sources (e.g., Whitaker et al. 2012) and comparable to renewable technologies (e.g., Dolan and Heath 2012). Evidence is limited on whether similar conclusions apply consistently to other common technologies (i.e., HWRs [heavy water reactors] and GCRs [gas-cooled reactors]).
However, the conditions and assumptions under which nuclear power is deployed can have a significant impact on the magnitude of life cycle GHG emissions, and several related contextual and consequential issues remain unexamined in much of the existing literature. …
[155] Paper: “Emissions from Photovoltaic Life Cycles.” By Vasilis M. Fthenakis and others. Environmental Science & Technology, February 6, 2008. Pages 2168–2174. <pubs.acs.org>
Page 2173:
Using data compiled from the original records of twelve PV [photovoltaic] manufacturers, we quantified the emissions from the life cycle of four major commercial photovoltaic technologies and showed that they are insignificant in comparison to the emissions that they replace when introduced in average European and U.S. grids. According to our analysis, replacing grid electricity with central PV systems presents significant environmental benefits, which for CdTe [cadmium telluride] PV amounts to 89–98% reductions of GHG [greenhouse gas] emissions, criteria pollutants, heavy metals, and radioactive species. For roof-top dispersed installations, such pollution reductions are expected to be even greater as the loads on the transmission and distribution networks are reduced, and part of the emissions related to the life cycle of these networks are avoided.
[156] Paper: “Life Cycle Greenhouse Gas Emissions of Crystalline Silicon Photovoltaic Electricity Generation.” By David D. Hsu and others. Journal of Industrial Ecology, March 19, 2012. Pages 122–135. <onlinelibrary.wiley.com>
Page 2173:
Published scientific literature contains many studies estimating life cycle greenhouse gas (GHG) emissions of residential and utility‐scale solar photovoltaics (PVs). Despite the volume of published work, variability in results hinders generalized conclusions. Most variance between studies can be attributed to differences in methods and assumptions. To clarify the published results for use in decision making and other analyses, we conduct a meta‐analysis of existing studies, harmonizing key performance characteristics to produce more comparable and consistently derived results.
Screening 397 life cycle assessments (LCAs) relevant to PVs yielded 13 studies on crystalline silicon (c‐Si) that met minimum standards of quality, transparency, and relevance. Prior to harmonization, the median of 42 estimates of life cycle GHG emissions from those 13 LCAs was 57 grams carbon dioxide equivalent per kilowatt‐hour (g CO2‐eq/kWh), with an interquartile range (IQR) of 44 to 73. After harmonizing key performance characteristics (irradiation of 1,700 kilowatt‐hours per square meter per year (kWh/m2/yr); system lifetime of 30 years; module efficiency of 13.2% or 14.0%, depending on module type; and a performance ratio of 0.75 or 0.80, depending on installation, the median estimate decreased to 45 and the IQR tightened to 39 to 49. The median estimate and variability were reduced compared to published estimates mainly because of higher average assumptions for irradiation and system lifetime.
[157] Webpage: “Geothermal Energy and the Environment.” U.S. Energy Information Administration. Last updated November 19, 2020. <www.eia.gov>
Geothermal power plants do not burn fuel to generate electricity, but they may release small amounts of sulfur dioxide and carbon dioxide. Geothermal power plants emit 97% less acid rain-causing sulfur compounds and about 99% less carbon dioxide than fossil fuel power plants of similar size. Geothermal power plants use scrubbers to remove the hydrogen sulfide naturally found in geothermal reservoirs. Most geothermal power plants inject the geothermal steam and water that they use back into the earth. This recycling helps to renew the geothermal resource….
[158] Paper: “Life Cycle Greenhouse Gas Emissions of Utility-Scale Wind Power: Systematic Review and Harmonization.” By Stacey L. Dolan and Garvin A. Heath. Journal of Industrial Ecology, April 2012. Pages S136–S154. <onlinelibrary.wiley.com>
Page S136:
Interest in technologies powered by renewable energy sources such as the wind and sun has grown partly because of the potential to reduce greenhouse gas (GHG) emissions from the power sector. However, due to GHG emissions produced during equipment manufacture, transportation, on-site construction, maintenance, and decommissioning, wind and solar technologies are not GHG emission-free.
Pages S151–152:
Life cycle GHG emissions of wind-powered electricity generation published since 1980 range from 1.7 to 81 g CO2-eq/kWh. Although this is already a tight range, upon harmonizing the data to a consistent set of GWPs [global warming potentials], system lifetime, capacity factors, and gross system boundary, the range of life cycle GHG emission estimates was reduced by 47%, to 3.0 to 45 g CO2-eq/kWh. … the parameter found to have the greatest effect on reducing variability is capacity factor.
[159] Webpage: “Hydropower Explained: Hydropower and the Environment.” U.S. Energy Information Administration. Last updated December 9, 2021.
Most dams in the United States were built mainly for flood control, municipal water supply, and irrigation water. Although many of these dams have hydroelectric generators, only a small number of dams were built specifically for hydropower generation. Hydropower generators do not directly emit air pollutants. However, dams, reservoirs, and the operation of hydroelectric generators can affect the environment. …
Manufacturing the concrete and steel in hydropower dams requires equipment that may produce emissions. If fossil fuels are the energy sources for making these materials, then the emissions from the equipment could be associated with the electricity that hydropower facilities generate. However, given the long operating lifetime of a hydropower plant (50 years to 100 years) these emissions are offset by the emissions-free hydroelectricity.
Greenhouse gases (GHG) such as carbon dioxide and methane form in natural aquatic systems and in human-made water storage reservoirs as a result of the aerobic and anaerobic decomposition of biomass in the water. The exact amounts of GHG that form in and are emitted from hydropower reservoirs is uncertain and depend on many site specific and regional factors.
[160] Webpage: “Air Emissions.” U.S. Environmental Protection Agency. Last updated September 25, 2013. <www.justfacts.com>
“Hydropower’s air emissions are negligible because no fuels are burned. However, if a large amount of vegetation is growing along the riverbed when a dam is built, it can decay in the lake that is created, causing the buildup and release of methane, a potent greenhouse gas.”
[161] Webpage: “Air Emissions.” U.S. Environmental Protection Agency. Last updated September 25, 2013. <www.justfacts.com>
Methane, a primary component of natural gas and a greenhouse gas, can also be emitted into the air when natural gas is not burned completely. Similarly, methane can be emitted as the result of leaks and losses during transportation. …
Mining, cleaning, and transporting coal to the power plant generate additional emissions. For example, methane, a potent greenhouse gas that is trapped in the coal, is often vented during these processes to increase safety….
In addition, oil wells and oil collection equipment are a source of emissions of methane, a potent greenhouse gas. The large engines that are used in the oil drilling, production, and transportation processes burn natural gas or diesel that also produce emissions.
[162] Report: “July 2022 Monthly Energy Review.” U.S. Energy Information Administration, Office of Energy Statistics, July 26, 2022. <www.eia.gov>
Page 255:
Global Warming Potential (GWP): An index used to compare the relative radiative forcing of different gases without directly calculating the changes in atmospheric concentrations. GWPs are calculated as the ratio of the radiative forcing that would result from the emission of one kilogram of a greenhouse gas to that from the emission of one kilogram of carbon dioxide over a fixed period of time, such as 100 years.
[163] Report: “Recent Greenhouse Gas Concentrations.” By T.J. Blasing. U.S. Department of Energy, Carbon Dioxide Information Analysis Center. Updated April 2016. <cdiac.ess-dive.lbl.gov>
“GWP4 [global warming potential] (100-yr time horizon) … Carbon dioxide (CO2) [=] 1 … Methane (CH4) [=] 28”
[164] Webpage: “How Much Carbon Dioxide Is Produced When Different Fuels Are Burned?” U.S. Energy Information Administration. Last reviewed May 10, 2022. <www.eia.gov>
Different fuels emit different amounts of carbon dioxide (CO2) in relation to the energy they produce when burned. To analyze emissions across fuels, compare the amount of CO2 emitted per unit of energy output or heat content. …
The amount of CO2 produced when a fuel is burned is a function of the carbon content of the fuel. The heat content, or the amount of energy produced when a fuel is burned, is mainly determined by the carbon (C) and hydrogen (H) content of the fuel. Heat is produced when C and H combine with oxygen (O) during combustion. Natural gas is primarily methane (CH4), which has a higher energy content relative to other fuels, and thus, it has a relatively lower CO2-to-energy content. Water and various elements, such as sulfur and noncombustible elements in some fuels, reduce their heating values and increase their CO2-to-heat contents.
[165] Webpage: “Carbon Dioxide Emissions Coefficients.” U.S. Energy Information Administration. Last reviewed May 10, 2022. <www.eia.gov>
|
Carbon Dioxide Emissions Coefficients by Fuel |
|
|
Carbon Dioxide (CO2) Factors: |
Pounds CO2 Per Million Btu |
|
Propane |
138.63 |
|
Diesel and Home Heating Fuel |
163.45 |
|
Natural Gas |
116.65 |
|
Motor Gasoline |
155.77 |
|
Coal (Anthracite) |
228.60 |
|
Coal (Bituminous) |
205.40 |
|
Coal (Subbituminous) |
214.13 |
|
Coal (Lignite) |
216.24 |
[166] Webpage: “Federal Tax Credits for New All-Electric and Plug-in Hybrid Vehicles.” U.S. Department of Energy and U.S. Environmental Protection Agency. Updated July 7, 2022 at <www.fueleconomy.gov>
“All-electric and plug-in hybrid cars purchased new in or after 2010 may be eligible for a federal income tax credit of up to $7,500. The credit amount will vary based on the capacity of the battery used to power the vehicle. State and/or local incentives may also apply.”
[167] Webpage: “State and Federal Electric Vehicle Funding Programs.” Massachusetts State Government. Accessed June 25, 2021 at <www.mass.gov>
The Department of Energy Resources’ Massachusetts Offers Rebates for Electric Vehicles (MOR-EV) program which had expired on September 30th, 2019, has been re-opened. Starting on January 1, 2020, MOR-EV will be extended to support qualifying battery electric vehicles (BEVs) and fuel cell electric vehicles (FCEVs) up to a $50,000 final purchase price with a $2,500 rebate. Additionally, plug-in hybrid electric vehicles (PHEVS) with an all-electric range of 25 miles or greater and with a final purchase price up to $50,000 are eligible for a $1,500 rebate.
[168] Press release: “Governor Newsom Announces California Will Phase Out Gasoline-Powered Cars & Drastically Reduce Demand for Fossil Fuel in California’s Fight Against Climate Change.” Office of Governor Gavin Newson, September 23, 2020. <www.gov.ca.gov>
Governor Gavin Newsom today announced that he will aggressively move the state further away from its reliance on climate change-causing fossil fuels while retaining and creating jobs and spurring economic growth—he issued an executive order requiring sales of all new passenger vehicles to be zero-emission by 2035 and additional measures to eliminate harmful emissions from the transportation sector. …
Following the order, the California Air Resources Board will develop regulations to mandate that 100 percent of in-state sales of new passenger cars and trucks are zero-emission by 2035—a target which would achieve more than a 35 percent reduction in greenhouse gas emissions and an 80 percent improvement in oxides of nitrogen emissions from cars statewide. In addition, the Air Resources Board will develop regulations to mandate that all operations of medium- and heavy-duty vehicles shall be 100 percent zero emission by 2045 where feasible, with the mandate going into effect by 2035 for drayage trucks. To ensure needed infrastructure to support zero-emission vehicles, the order requires state agencies, in partnership with the private sector, to accelerate deployment of affordable fueling and charging options. It also requires support of new and used zero-emission vehicle markets to provide broad accessibility to zero-emission vehicles for all Californians.
[169] Webpage: “Zero Emission Vehicles.” Vermont State Department of Environmental Conservation. Accessed June 25, 2021 at <dec.vermont.gov>
Vermont’s Low Emission Vehicle (LEV) program, authorized under section 177 of the Clean Air Act, has been a centerpiece of Vermont’s air quality efforts since 1996. The Zero Emission Vehicle (ZEV) program, which is a technology-forcing component of the LEV program, has been a major contributor to the successful commercialization of hybrid-electric vehicles and ultra-low-emission technologies. To date, 12 states have adopted the ZEV Program (California, Colorado, Connecticut, Maine, Maryland, Massachusetts, New Jersey, New York, Oregon, Rhode Island, Vermont and Washington).
The ZEV program requires increasing sales of ZEVs over the next decade. The annual sales requirements in state programs are modest at the outset, but increase over time, anticipating that consumer demand will expand as consumers become more familiar with a growing range of continually improving ZEV products. The ZEV program provides manufacturers substantial flexibility through mechanisms such as credit banking and trading, alternative compliance options, cross-state credit pooling, and by allowing manufacturers to develop their preferred compliance strategy using Battery Electric Vehicles (BEVs), Plug-in Hybrid Electric Vehicles (PHEVs), Fuel Cell Electric Vehicles (FCEVs), or some combination. The Vermont Department of Environmental Conservation estimates that by 2025, about 5.4 percent of new vehicles sold in Vermont will be required to be ZEVs.
[170] Paper: “Comparative Life Cycle Assessment of Conventional, Electric and Hybrid Passenger Vehicles in Spain.” By Gonzalo Puig-Samber Naranjo and others. Journal of Cleaner Production, April 1, 2021. <www.sciencedirect.com>
BEVs [battery electric vehicles] and HEVs [hybrid electric vehicles] are generally perceived as a clean alternative and in the case of the former, they are marketed as “zero-emission” because of their null tailpipe emissions. However, the BEV use phase produces environmental impacts through processes that occur in various locations (i.e. power plants). The life cycle approach is needed to avoid problem shifting and evaluate vehicle environmental impacts completely. Only the study of the complete energy carrier, which is known as the Well-to-Wheels (WTW) analysis, enables us to fairly compare the use phase environmental impacts of vehicles with different powertrains. WTW and Life Cycle Assessment (LCA) studies indicate that BEVs only achieve their maximum potential of GHG emissions reduction in electricity grids with a low carbon footprint (Burchart-Korol and others, 2018).
Despite the WTW analysis usefulness to compare the use phase impacts, it is not completely representative of vehicle life cycle environmental impacts since it does not consider other important phases (i.e. production, disposal) and usually only assesses GHG [greenhouse gas] emissions (Folega and Burchart-Korol, 2017). Its limitations are greater for evaluating BEVs and HEVs because these vehicles show higher relative importance of the upstream supply chain and vehicle manufacture. Bauer and others found that BEV and its traction battery production contributes to approximately 55% of the GHG emissions (Bauer and others, 2015). …
The found GWP [global warming potential] for BEVs is considerably lower than the obtained for the other vehicles: Petrol ICEVs (−48%), diesel ICEVs (−44%) and HEVs (−39%), whose values are also within the GWP range established from literature: 258–301 g CO2 eq/km for the petrol and 172–253 g CO2 eq/km for the diesel car…. Regarding the life cycle structure, the results confirm that the vehicle use is the most contributing life cycle phase in terms of GWP. … The reduction of BEV use phase GWP in future scenarios also reveals the progressive transfer of environmental burdens in terms of GHG emissions from the electricity consumption to the cradle-to-gate phase. The contribution of BEV cradle-to-gate phase (i.e. vehicle and traction battery manufacture) to the life cycle GWP increases from 42% to more than 50% in 2030 and 2050.
In this sense, BEVs and HEVs have the most polluting cradle-to-gate phase in terms of GWP. While in the case of HEVs this is due to the production of two different powertrains, BEV manufacture is more intensive mainly because of the battery production, which constitutes approximately 8.5% of the vehicle life cycle GWP. … However, BEVs are capable of rapidly recovering their more intensive manufacturing phase and equalising petrol ICEV total GHG emissions after 6,906 km…. The break-even distance between BEVs and petrol ICEVs rises to 13,353 km if a battery replacement is needed.
The Monte Carlo test provides the confidence intervals of the results. The results for GWP and Fine particulate matter formation show the lowest deviation from the mean, whereas categories related to human toxicity have the largest uncertainties…. This difference is considered statistically-significant when at least 95% of the Monte Carlo runs show a clear positive or negative output. …
… The results regarding future scenarios for BEVs also indicate an important transfer of GHG emissions to the vehicle cradle-to-gate phase, meaning that globally LCA results might be used to plan new eco-design strategies such as a longer lifetime of vehicles, substitution of some hotspot materials and processes, and higher use of secondary materials. In terms of GWP, BEVs are capable of reducing 48% of petrol ICEV GHG emissions in the current Spanish scenario. Future scenarios results underline that BEV promotion must be accompanied by a massive introduction of renewable energies in order to achieve their maximum benefits in terms of GHG emissions. Following the European prospective for Spain, BEVs could potentially reduce 27% of their current GWP by 2050. The use of BEVs in countries or regions with a fossil fuel-based electricity generation completely erases their benefits and could be counterproductive (Burchart-Korol and others, 2018).
[171] Webpage: “Ethanol and the Environment.” U.S. Energy Information Administration. Last updated December 7, 2020. <bit.ly>
Producing and burning ethanol results in emissions of carbon dioxide (CO2), a greenhouse gas. However, the combustion of ethanol made from biomass (such as corn and sugarcane) is considered atmospheric carbon neutral because as the biomass grows, it absorbs CO2, which may offset the CO2 produced when the ethanol is burned. Some ethanol producers burn coal and natural gas for heat sources in the fermentation process to make fuel ethanol, while some burn corn stocks or sugar cane stocks.
The effect that increased ethanol use has on net CO2 emissions depends on how ethanol is made and whether or not indirect impacts on land use are included in the calculations. Growing plants for fuel is a controversial topic because some people believe the land, fertilizers, and energy used to grow biofuel crops should be used to grow food crops instead.
[172] Webpage: “Air Emissions.” U.S. Environmental Protection Agency. Last updated September 25, 2013. <www.justfacts.com>
“The carbon dioxide emissions from burning biomass may not result in a net increase in carbon emissions if the biomass resources are managed sustainably, but it is not safe to assume biomass power plants are carbon neutral.”
[173] Article: “Ethanol Not Green or Clean, Some Charge.” By Henry C. Jackson. Associated Press, January 30, 2008.
All sides agree that it takes lots of electricity to produce ethanol. Utilities note a typical plant eats up as much energy as 1,600 farms.
The divide comes over where that electricity should come from. Environmental activists believe greener means, such as natural gas, should be used. Power companies argue that coal is the only cost-efficient solution.
In Iowa, the nation’s top producer of corn and ethanol, dozens of plants are producing the fuel and more are being built. That’s prompted a push for two coal-fired electricity plants, in Marshalltown and near Waterloo.
[174] Report: “The Impact of Ethanol Use on Food Prices and Greenhouse-Gas Emissions.” Congressional Budget Office, April 2009. <www.cbo.gov>
Page 13: “Producing ethanol from corn and distributing it emits more greenhouse gases than producing gasoline from crude oil and distributing it. (That is, planting, fertilizing, and harvesting corn as an ethanol feedstock uses more fossil-fuel energy than does drilling for petroleum, refining it into gasoline, and delivering it to customers.)”
[175] Paper: “Fuel Miles and the Blend Wall: Costs and Emissions From Ethanol Distribution in the United States.” By Bret Strogen and others. Environmental Science & Technology, April 16, 2012. Pages 5285–5293. <www.ncbi.nlm.nih.gov>
Page 5285:
As low-level ethanol-gasoline blends have not consistently outperformed ethanol-free gasoline in vehicle performance or tailpipe emissions, national-level economic and environmental goals could be accomplished more efficiently by concentrating consumption of gasoline containing 10% ethanol (i.e., E10) near producers to minimize freight activity. As the domestic transportation of ethanol increased 10-fold in metric ton-kilometers (t-km) from 2000 to 2009, the portion of t-km potentially justified by the E10 blend wall increased from less than 40% to 80%. However, we estimate 10 billion t-km took place annually from 2004 to 2009 for reasons other than the blend wall. This “unnecessary” transportation resulted in more than $240 million in freight costs, 90 million L of diesel consumption, 300,000 metric tons of CO(2)-e emissions, and 440 g of human intake of PM(2.5) [particulate matter].
[176] Report: “The Impact of Ethanol Use on Food Prices and Greenhouse-Gas Emissions.” Congressional Budget Office, April 2009. <www.cbo.gov>
Pages 12–13:
Research suggests that the use of ethanol currently reduces greenhouse-gas emissions relative to the use of gasoline because, over the “life cycle” of the two fuels—that is, during their production, distribution, and combustion—ethanol uses less fossil fuel energy than does gasoline. Yet if ethanol production continues to increase, whether use of the fuel reduces greenhouse-gas emissions will also depend on changes in land use that might offset the potential reduction in emissions. For example, a substantial amount of carbon already stored in forests or grasslands could be released if those lands were converted into land to grow crops (such as corn) that would be used to make ethanol, or to grow crops that had been displaced by the ethanol feedstocks. …
Analysis of greenhouse-gas emissions from ethanol and gasoline depends on measurements during all stages of their product life cycles, including production, distribution, and combustion of the fuels. In that regard, ethanol has advantages over gasoline during certain stages but disadvantages during others. On balance, the use of corn ethanol that has been produced at plants fueled by natural gas (which accounts for most of the United States’ production of ethanol) is estimated to generate fewer greenhouse-gas emissions than the use of gasoline. …
Looking at the entire life cycle of the two fuels, research conducted at Argonne National Laboratory (ANL) compared the greenhouse-gas emissions of ethanol and gasoline.43 That research, which has been widely accepted by federal agencies, found that the use of corn ethanol as it is currently produced—using coal-fired and natural gas-fired plants—reduces life-cycle greenhouse-gas emissions by about 20 percent when compared with the use of gasoline.44 …
The reduction in greenhouse-gas emissions depends critically on which fuel is used to produce ethanol. The ANL researchers found that if corn ethanol was produced at a plant that used natural gas to fuel its production processes, the life-cycle greenhouse-gas emissions for ethanol would be about 30 percent lower than those for gasoline. In contrast, corn ethanol that was produced by using energy derived from burning coal would increase lifecycle greenhouse-gas emissions by 3 percent compared with gasoline (because the burning of coal produces a much greater volume of emissions than does the burning of natural gas). Most ethanol plants in the United States are fueled by natural gas. The rest are coal fired or fired jointly by coal and natural gas.
The ANL researchers’ finding that ethanol releases fewer life-cycle greenhouse-gas emissions than gasoline releases has been challenged by some analysts. An alternative viewpoint is that the production of corn ethanol produces more life-cycle greenhouse-gas emissions than gasoline does because the production of such ethanol relies more heavily on fossil fuels than the ANL researchers’ estimates recognize.47 Such analysts also contend that the reductions in greenhouse-gas emissions derived from using by-products of ethanol production to displace the production of other goods—such as animal feeds or fertilizer—are smaller than those assumed in the ANL analysis.48 Those criticisms are not widely embraced, however. Some observers argue that such contentions are based on outdated data, on overestimates of how much fossil fuel is used in farming and in ethanol production, and on underestimates of the extent to which the use of by-products from ethanol production reduces the amount of fossil fuels used for producing other goods.49
43 Michael Wang, May Wu, and Hong Huo, “Life-Cycle Energy and Greenhouse Gas Emission Impacts of Different Corn Ethanol Plant Types,” Environmental Research Letters, vol. 2, no. 2 (2007).
44 ANL’s estimate of the reduction in life-cycle greenhouse-gas emissions from using corn ethanol in place of gasoline is consistent with a range of other recent estimates. For example, a 2006 study found that the use of corn ethanol reduced life-cycle greenhouse gas emissions by 12 percent (see Jason Hill and others, “Environmental, Economic, and Energetic Costs and Benefits of Biodiesel and Ethanol Biofuels,” Proceedings of the National Academy of Sciences, vol. 103, no. 30, July 25, 2006), whereas a 2009 study found a reduction of 50 percent to 60 percent (see Adam J. Liska and others, “Improvements in Life Cycle Energy Efficiency and Greenhouse Gas Emissions of Corn-Ethanol,” Journal of Industrial Ecology, vol. 13, no. 1, 2009).
47 David Pimentel and Tad W. Patzek, “Ethanol Production Using Corn, Switchgrass, and Wood; Biodiesel Production Using Soybean and Sunflower,” Natural Resources Research, vol. 14, no. 1 (March 2005).
48 Coproduct credits—ethanol by-products that reduce the amount of fossil-fuel energy used in other industries—are assumed to reduce the net amount of fossil-fuel energy consumed in producing ethanol. The use of distillers’ dried grains as animal feed, for example, displaces some production of other feeds and reduces the overall use of fossil fuels. The resulting decrease in greenhouse-gas emissions is credited to the production of ethanol.
49 For example, see the discussion in Environmental Protection Agency, Office of Transportation and Air Quality, Regulatory Impact Analysis: Renewable Fuel Standard Program, Report No. EPA420-R-07-004 (April 2007), p. 226.
[177] Webpage: “Biofuels Explained: Biofuels and the Environment.” U.S. Energy Information Administration. Last reviewed April 13, 2022. <www.eia.gov>
“The U.S. government is supporting efforts to produce biofuels with methods that use less energy than conventional fermentation and that use cellulosic biomass, which requires less cultivation, fertilizer, and pesticides than corn or sugar cane. Cellulosic ethanol feedstock includes native prairie grasses, fast-growing trees, sawdust, and even waste paper.”
[178] Public Law 110-140: “Energy Independence and Security Act of 2007.” 110th U.S. Congress. Signed into law by George W. Bush on December 19, 2007. <www.gpo.gov>
Pages 28–29:
(C) Baseline Lifecycle Greenhouse Gas Emissions.—The term “baseline lifecycle greenhouse gas emissions” means the average lifecycle greenhouse gas emissions, as determined by the Administrator, after notice and opportunity for comment, for gasoline or diesel (whichever is being replaced by the renewable fuel) sold or distributed as transportation fuel in 2005. …
(E) Cellulosic Biofuel.—The term “cellulosic biofuel” means renewable fuel derived from any cellulose, hemicellulose, or lignin that is derived from renewable biomass and that has lifecycle greenhouse gas emissions, as determined by the Administrator, that are at least 60 percent less than the baseline lifecycle greenhouse gas emissions.
(G) Greenhouse Gas.—The term “greenhouse gas” means carbon dioxide, hydrofluorocarbons, methane, nitrous oxide, perfluorocarbons, sulfur hexafluoride. The Administrator may include any other anthropogenically emitted gas that is determined by the Administrator, after notice and comment, to contribute to global warming.
(H) Lifecycle Greenhouse Gas Emissions.—The term “lifecycle greenhouse gas emissions” means the aggregate quantity of greenhouse gas emissions (including direct emissions and significant indirect emissions such as significant emissions from land use changes), as determined by the Administrator, related to the full fuel lifecycle, including all stages of fuel and feedstock production and distribution, from feedstock generation or extraction through the distribution and delivery and use of the finished fuel to the ultimate consumer, where the mass values for all greenhouse gases are adjusted to account for their relative global warming potential.
[179] Webpage: “Ethanol Production and Distribution.” U.S. Department of Energy, Alternative Fuels Data Center. Accessed August 3, 2022. <www.afdc.energy.gov>
Making ethanol from cellulosic feedstocks—such as grass, wood, and crop residues—is a more involved process than using starch-based crops. There are two primary pathways to produce cellulosic ethanol: biochemical and thermochemical. The biochemical process involves a pretreatment to release hemicellulose sugars followed by hydrolysis to break cellulose into sugars. Sugars are fermented into ethanol and lignin is recovered and used to produce energy to power the process. The thermochemical conversion process involves adding heat and chemicals to a biomass feedstock to produce syngas, which is a mixture of carbon monoxide and hydrogen. Syngas is mixed with a catalyst and reformed into ethanol and other liquid co-products..
[180] Report: “The Impact of Ethanol Use on Food Prices and Greenhouse-Gas Emissions.” Congressional Budget Office, April 2009. <www.cbo.gov>
Page 10 (of PDF): “In the future, the use of cellulosic ethanol, which is made from wood, grasses, and agricultural plant wastes rather than corn, might reduce greenhouse-gas emissions more substantially, but current technologies for producing cellulosic ethanol are not commercially viable.”
Page 14:
Cellulosic ethanol—produced by using switchgrass (a North American grass used for hay and forage), corn stover (the leaves and stalks of the corn plant), or forest residues (in general, small or dead wood items not useful for resale and wastes from lumber operations) as feedstocks—offers the potential for greater reductions in greenhouse-gas emissions (see Figure 3). Relative to corn ethanol, cellulosic ethanol is expected to produce fewer net greenhouse-gas emissions because cellulosic wastes (rather than fossil fuels) might be used as a source of energy for an ethanol plant’s operations or in cogeneration facilities (facilities that produce electricity as well as steam that can be used for the plant’s operations). Electricity produced by such facilities could be transmitted to the electric grid, which might reduce the use of fossil fuels in coal-fired or natural gas-fired power plants.50
According to researchers, cellulosic ethanol, if successfully developed, could reduce greenhouse-gas emissions by 85 percent to 95 percent relative to emissions associated with the production of gasoline.51 In the long run, if cellulosic ethanol could be produced on a large scale and if that fuel along with corn ethanol was substituted for gasoline at the levels called for under the EISA [Energy Independence and Security Act of 2007] mandate, greenhouse-gas emissions might be reduced by about 130 million metric tons of CO2e [carbon dioxide equivalent] by 2022, or 6 percent of total projected emissions from the transportation sector and 2 percent of total emissions generated in the United States.52
The technology for large-scale commercial production of the fuel, however, has not yet been developed. Estimates of the reductions in emissions that might be gained from producing and using cellulosic ethanol reflect assumptions about potential future technology and production processes. Considerable technical hurdles must be overcome—to access the sugars within the cellulose and convert them into ethanol—before commercial production of the fuel can occur on a large scale. EIA [U.S. Energy Information Administration] projects that those technological constraints are substantial enough that the federal mandate for the use of advanced biofuels, including cellulosic ethanol, in 2022—21 billion gallons—will not be met until 2027.53
[181] Article: “A Fine for Not Using a Biofuel That Doesn’t Exist.” By Matthew L. Wald. New York Times, January 9, 2012. <www.nytimes.com>
When the companies that supply motor fuel close the books on 2011, they will pay about $6.8 million in penalties to the Treasury because they failed to mix a special type of biofuel into their gasoline and diesel as required by law.
But there was none to be had. Outside a handful of laboratories and workshops, the ingredient, cellulosic biofuel, does not exist.
In 2012, the oil companies expect to pay even higher penalties for failing to blend in the fuel, which is made from wood chips or the inedible parts of plants like corncobs. Refiners were required to blend 6.6 million gallons into gasoline and diesel in 2011 and face a quota of 8.65 million gallons this year.
[182] Ruling: American Petroleum Institute v. Environmental Protection Agency. U.S. Court of Appeals for the District of Columbia Circuit. January 25, 2013. <www.cadc.uscourts.gov>
Page 4:
In a January 2012 Final Rule (the “2012 RFS [Renewable Fuel Standard] rule”), EPA [U.S. Environmental Protection Agency] projected that 8.65 million gallons of cellulosic biofuel (10.45 million ethanol-equivalent gallons) would be produced in 2012, well short of the 500 million ethanol-equivalent gallons mandated by the Act for that year. … in the same rule, EPA considered but rejected a reduction in the volume of total advanced biofuels required for 2012, stating that other kinds of advanced biofuels could make up for the shortfall.
Page 12: “Apart from their role as captive consumers, the refiners are in no position to ensure, or even contribute to, growth in the cellulosic biofuel industry. ‘Do a good job, cellulosic fuel producers. If you fail, we’ll fine your customers.’ ”
Page 14:
For the reasons set out above, we reject API’s [American Petroleum Institute’s] challenge to EPA’s refusal to lower the applicable volume of advanced biofuels for 2012. However, we agree with API that EPA’s 2012 projection of cellulosic biofuel production was in excess of the agency’s statutory authority. We accordingly vacate that aspect of the 2012 RFS rule and remand for further proceedings consistent with this opinion.
[183] See the section on biofuels for the latest details about producers’ inability to make enough cellulosic ethanol to meet the mandated amounts specified in federal law.
[184] Paper: “Land Clearing and the Biofuel Carbon Debt.” By Joseph Fargione and others. Science, February 29, 2008. Pages 1235–1238. <www.sciencemag.org>
Page 1237:
Our results show that converting native ecosystems to biofuel production results in large carbon debts. … Converting lowland tropical rainforest in Indonesia and Malaysia to palm biodiesel would result in a biofuel carbon debt … that would take ~86 years to repay…. Until then, producing and using palm biodiesel from this land would cause greater GHG [greenhouse gas] release than would refining and using an energy-equivalent amount of petroleum diesel. Converting tropical peatland rainforest to palm production … would take over 840 years to repay. Soybean biodiesel produced on converted Amazonian rainforest … would require ~320 years to repay as compared with GHG emissions from petroleum diesel. The biofuel carbon debt from biofuels produced on converted Cerrado [Brazilian woodland-savanna] is repaid in the least amount of time of the scenarios that we examined. Sugarcane ethanol produced on … the wetter and more productive end of this woodland-savanna biome, would take ~17 years to repay the biofuel carbon debt. Soybean biodiesel from the drier, less productive grass-dominated end … would take ~37 years. Ethanol from corn produced on newly converted U.S. central grasslands results in a biofuel carbon debt repayment time of ~93 years.
[185] Webpage: “Biomass-Based Diesel and the Environment.” U.S. Energy Information Administration. Last reviewed December 10, 2020. <bit.ly>
Compared to petroleum diesel fuel, which is refined from crude oil, biodiesel combustion produces fewer air pollutants such as particulates, carbon monoxide, sulfur dioxide, hydrocarbons, and air toxics. Nitrogen oxide emissions from burning a gallon of biodiesel may be slightly higher than emissions from burning a gallon of petroleum diesel.
Biodiesel Use May Reduce Greenhouse Gas Emissions
The U.S. government considers biodiesel to be carbon-neutral because the plants that are the sources of the feedstocks for making biodiesel, such as soybeans and palm oil trees, absorb carbon dioxide (CO2) as they grow. The absorption of CO2 by these plants offsets the CO2 that forms while making and burning biodiesel. Most of the biodiesel produced in the United States is made from soybean oil. Some biodiesel is also produced from used vegetable oils or animal fats, including recycled restaurant oil and grease.
In some parts of the world, large areas of natural vegetation and forests have been cleared and burned to grow soybeans and palm oil trees to make biodiesel. The negative environmental effects of this land clearing and burning may be greater than the potential benefits of using biodiesel produced from soybeans and palm oil trees.
[186] Article: “Ethanol Blend Wall: Are We There Yet?” U.S. Energy Information Administration, November 23, 2011. <www.eia.gov>
“E85, a fuel blend with 70 percent to 85 percent ethanol content presently used in very limited volumes that may be sold only for use in flex-fuel vehicles that have been specifically designed to accommodate its use.”
NOTE: Observe the range discrepancy with the next footnote.
[187] Webpage: “Flexible Fuel Vehicles.” U.S. Department of Energy, Alternative Fuels Data Center. Last updated October 1, 2013. <www.afdc.energy.gov>
“Flexible fuel vehicles (FFVs) have an internal combustion engine and are capable of operating on gasoline, E85 (a gasoline-ethanol blend containing 51% to 83% ethanol, depending on geography and season), or a mixture of the two.”
[188] Report: “A Primer on Alternative Transportation Fuels.” By Timothy Coffey. National Defense University, Center for Technology and National Security Policy, September 2010. <apps.dtic.mil>
Page 25: “Table 6. Energy content and chemical composition of several energy sources referenced to gasoline. … Energy per unit volume … Liquid Ethanol [=] .69”
Page 25:
Table 6. Energy content and chemical composition of several energy sources referenced to gasoline. The bracket < > indicates the average chemical formula. (Source: modified from Coffey et al.7)
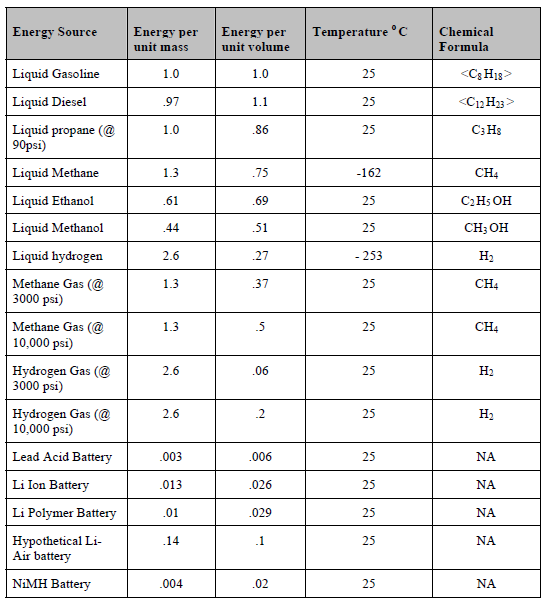
[189] Report: “Biofuels: Challenges to the Transportation, Sale, and Use of Intermediate Ethanol Blends.” U.S. Government Accountability Office, June 2011. <www.gao.gov>
Page 6: “Because a gallon of ethanol contains only about two-thirds the energy of a gallon of gasoline, the use of E85 [a mixture of 70–85% ethanol and 15–30% gasoline] results in an approximately 25 percent reduction in fuel economy.”
[190] “Clean Cities Alternative Fuel Price Report.” U.S. Department of Energy, August 1, 2013. <www.afdc.energy.gov>
Page 7: “Ethanol (E85) [a mixture of 70–85% ethanol and 15–30% gasoline] contains about 30% less energy (Btus) per volume than gasoline. Flexible fuel vehicles (FFVs) operating on E85 do not experience a loss in operational performance, but may experience a 25–30% decrease in miles driven per gallon compared to operation on gasoline.”
[191] Webpage: “Biodiesel.” U.S. Department of Energy, Office of Energy Efficiency and Renewable Energy. Last updated September 27, 2013. <www.fueleconomy.gov>
“Biodiesel can be used in its pure form (B100) or blended with petroleum diesel. Common blends include B2 (2% biodiesel), B5, and B20.”
[192] Calculated with data from:
a) Report: “July 2022 Monthly Energy Review.” U.S. Energy Information Administration, Office of Energy Statistics, July 26, 2022. <www.eia.gov>
Page 162: “Table 9.4 Retail Motor Gasoline and On-Highway Diesel Fuel Prices … Prices are not adjusted for inflation.”
b) “Clean Cities Alternative Fuel Price Report, January 2021.” U.S. Department of Energy, April 26, 2021.
Page 3: “This report’s prices represent retail, at-the-pump sales prices for each fuel, including federal and state motor fuel taxes.1 … Some states charge a flat annual fee in lieu of collecting motor fuel taxes at the pump, usually for large trucks using gaseous fuels like compressed natural gas (CNG) and liquefied petroleum gas (LPG or propane). These flat fees are not included in the prices reported in these pages.”
Page 4: “Table 3. National Average Retail Fuel Prices on an Energy‐Equivalent Basis, January 2021”
c) “Clean Cities Alternative Fuel Price Report, April 2021.” U.S. Department of Energy, July 6, 2021.
Page 4: “National Average Retail Fuel Prices on an Energy‐Equivalent Basis, April 2021”
d) “Clean Cities Alternative Fuel Price Report, July 2021.” U.S. Department of Energy, October 26, 2021.
Page 4: “Table 3. National Average Fuel Prices on An Energy-Equivalent Basis, July 2021”
e) “Clean Cities Alternative Fuel Price Report, October 2021.” U.S. Department of Energy, December 15, 2021.
Page 4: “Table 3. National Average Fuel Prices on An Energy-Equivalent Basis, October 2021”
NOTE: An Excel file containing the data and calculations is available upon request.
[193] Report: “Biofuels Issues and Trends.” U.S. Energy Information Administration, October, 2012. <www.eia.gov>
Page 18:
RINs [Renewable Identification Numbers] for the biomass-based diesel component of RFS2 [Renewable Fuel Standard, Energy Independence and Security Act of 2007] have become especially important to biodiesel producers. The RFS2 compliance mechanism offers an economic incentive to producers of renewable fuel to achieve the mandated levels. Refiners and petroleum product importers demonstrate compliance with the RFS2 through the submission of RINs that are generated by the production of qualifying renewable fuels. Fuel blenders may separate RINs from physical volumes of renewable fuel and subsequently sell any RINs above the quantity needed to meet their individual requirement. Thus, RINs act as tradable credits that can offset any cost disadvantage renewable fuels may have over comparable petroleum products in order to achieve the required levels of consumption.
Biodiesel RIN prices averaged $0.75 per gallon in 2011.42 Because each gallon of biodiesel generates 1.5 RINs due to the ethanol equivalence factor specified in the RFS2, a $0.75-per-gallon RIN value meant that diesel blenders received an average $1.13-per-gallon offset against the price of each gallon of biodiesel blended in excess of the obligated quantity. These RIN values combined with the $1.00-per-gallon tax credit encouraged greater volumes of consumption even though wholesale biodiesel was priced at a large premium to wholesale petroleum diesel.
[194] Article: “Intricacies of Meeting the Renewable Fuels Standard.” By Bruce A. Babcock. Iowa State University Center for Agricultural and Rural Development Iowa Ag Review, Spring 2009. <www.card.iastate.edu>
Gasoline producers and importers are assigned a number of RINs [Renewable Identification Numbers] that they must give to EPA [U.S. Environmental Protection Agency] each year. Because each gallon of biofuels has a RIN associated with it, producers and importers can obtain RINs by buying biofuels and keeping the RINs. Alternatively, they can enter the RIN market and buy the RINs from somebody else. …
The price of a RIN reflects the difference in the market value of a biofuel in meeting fuel demand and the price that is needed to allow biofuel producers to cover the costs of producing the required amount of biofuel. This means that RIN prices will reflect changes in both market values and production costs. Because biofuels substitute for petroleum-based fuels, the price of crude oil will be one factor that determines RIN prices. Higher crude oil prices will lead to lower RIN prices. …
Consumers choose fuel based on retail prices. Blenders use wholesale prices to determine what fuel blends to use. Retail fuel prices equal the wholesale price plus taxes plus transportation costs plus a profit margin. … A reasonable approximation for the spread between wholesale and retail fuel prices is that the retail price equals the wholesale price plus 10 percent plus 40 cents.
[195] Article: “Ethanol and Biomass-Based Diesel RIN Prices Approaching All-Time Highs.” By Sean Hill. U.S. Energy Information Administration, February 24, 2021. <www.eia.gov>
Although the RFS [Renewable Fuel Standard] renewable volume obligations for 2021 have yet to be released, RIN [Renewable Identification Numbers] prices have been increasing because of limited fuel production as a result of lower fuel demand related to responses to COVID-19, fewer approved new small refinery exemptions (SRE) since 2018, and uncertainty around future RFS levels.
In the past, RIN credit prices increased, generally, because of two situations: when the cost of a biofuel was higher than the petroleum fuel it was blended into or when RFS targets increased more than market-driven biofuel consumption. In the second situation, the higher-value RINs encourage additional, more costly blending beyond normal market levels.
The recent price increase is likely attributable to the first situation. In spring 2020, as transportation demand was quickly falling, wholesale gasoline prices fell by more than wholesale ethanol prices, causing ethanol D6 RIN prices to increase enough to encourage increased ethanol blending. Similarly, diesel fuel prices fell significantly lower than biomass-based diesel (both biodiesel and renewable diesel), driving biomass-based diesel D4 RIN prices higher to encourage blending costlier biofuels.
[196] Article: “Higher RIN Prices Support Continued Ethanol Blending Despite Lower Gasoline Prices.” U.S. Energy Information Administration, February 23, 2015. <www.eia.gov>
The recent increase in the D6 [ethanol] RIN [Renewable Identification Numbers] price, shown as the difference between the green and yellow lines in the graph, appears to be driven at least in part by the decline in gasoline prices. When the economics for ethanol blending may seem to be unfavorable based on spot prices, a higher RIN value reduces the “net of RIN” cost of ethanol blending. …
Over the past few years, ethanol has sold at prices roughly 10% lower [per gallon] than the price of wholesale gasoline, which combined with positive RIN values and the value of octane encourages refiners and blenders to blend ethanol with gasoline. In most cases, ethanol is blended into gasoline up to 10% by volume. This percentage is the maximum blend approved for use in all gasoline-powered vehicles by EPA [U.S. Environmental Protection Agency] and is also accepted by all manufacturers as a fuel that does not risk the voiding of vehicle warranties.
As ethanol prices rose to a $0.25/gal-to-$0.30/gal premium over gasoline in December and January, prices for the 2014 D6 ethanol RIN, which can be used for RFS [Renewable Fuel Standard] compliance in either 2014 or 2015, increased by roughly the same amount, from about $0.45/gal in November to $0.71/gal in mid-January. This increase in the RIN value reduces the effective price of ethanol and supports ethanol blending despite the unfavorable spot ethanol pricing.
[197] Report: “The Renewable Identification Number System and U.S. Biofuel Mandates.” By Lihong McPhail, Paul Westcott, and Heather Lutman. U.S. Department of Agriculture, Economic Research Service, November 2011. <www.ers.usda.gov>
Page 8:
The actual RIN [Renewable Identification Number] price includes the core value of RINs, transaction costs, and/ or a speculative component. The core value of a RIN is the gap, if positive, between the supply price … and the demand price … for biofuels at any given quantity…. In aggregate, the total cost of meeting the RFS2 [Renewable Fuel Standard, Energy Independence and Security Act of 2007] is equal to the mandated quantity times this per-unit cost (RIN price). The RIN price, or the gap between supply price and demand price, represents the per-unit cost of meeting the mandate. …
RIN prices will rise to bridge the gap between the willingness to pay for biofuels and the cost of producing biofuels at the mandated quantity. In theory, the RIN market ensures that mandated demand will generate high enough biofuel prices to allow biofuel producers to cover their production costs up to the RFS2.
Page 10: “When crude oil prices drop, consumers’ willingness to pay for biofuels decreases. The demand curve for biofuels shifts downward, and prices for RINs increase.”
[198] Webpage: “Biodiesel Income Tax Credit.” U.S. Department of Energy, Office of Energy Efficiency and Renewable Energy, Alternative Fuels Data Center. Accessed August 6, 2022 at <afdc.energy.gov>
Biodiesel Income Tax Credit
NOTE: This incentive originally expired on December 31, 2017, but was retroactively extended through December 31, 2022, by Public Law 116-94.
A taxpayer that delivers pure, unblended biodiesel (B100) into the tank of a vehicle or uses B100 as an on-road fuel in their trade or business may be eligible for an incentive in the amount of $1.00 per gallon of biodiesel, agri-biodiesel, or renewable diesel. If the biodiesel was sold at retail, only the person that sold the fuel and placed it into the tank of the vehicle is eligible for the tax credit. The incentive is allowed as a credit against the taxpayer’s income tax liability.
[199] Calculated with data from:
a) Report: “Direct Federal Financial Interventions and Subsidies in Energy in Fiscal Year 2016.” U.S. Energy Information Administration, April 2018. <www.eia.gov>
Page 9: “Table 3. Quantified Energy-Specific Subsidies and Support by Type, FY 2010, FY 2013 and FY 2016 (million 2016 dollars) … Year and Support Type … 2016 … Natural Gas and Petroleum Liquids … Direct Expenditures [=] 111 … Tax Expenditures [=] (940) … Research and Development [=] 56 … DOE [U.S. Department of Energy] Loan Guarantee Program [=] 0”
Page 25: “Natural gas and petroleum-related U.S. tax expenditures decreased from $2.3 billion in FY 2013 to an estimated revenue inflow (versus a positive tax expenditure) of $940 million in FY 2016 thus in aggregate becoming a set of revenue-generating tax provisions to the government in that fiscal year….”
b) Report: “July 2022 Monthly Energy Review.” U.S. Energy Information Administration, Office of Energy Statistics, July 26, 2022. <www.eia.gov>
Page 5: “Table 1.2: Primary Energy Production by Source (Quadrillion BTU) … 2016 … Natural Gas (Dry) [=] 27.576 … Crude Oil [=] 18.522 … NGPL [Natural Gas Plant Liquids] [=] 4.665”
c) Dataset: “Fuel Properties Comparison.” U.S. Department of Energy, Office of Energy Efficiency and Renewable Energy, Alternative Fuels Data Center, January 2021. <www.afdc.energy.gov>
Page 1: “Energy Content (Higher heating value) … Gasoline [=] 120,388–124,340 Btu/gal”
NOTES:
[200] Calculated with data from:
a) Report: “July 2022 Monthly Energy Review.” U.S. Energy Information Administration, Office of Energy Statistics, July 26, 2022. <www.eia.gov>
Page 162: “Table 9.4 Retail Motor Gasoline and On-Highway Diesel Fuel Prices … Prices are not adjusted for inflation.”
b) “Clean Cities Alternative Fuel Price Report, January 2021.” U.S. Department of Energy, April 26, 2021.
Page 3: “This report’s prices represent retail, at-the-pump sales prices for each fuel, including federal and state motor fuel taxes.1 … Some states charge a flat annual fee in lieu of collecting motor fuel taxes at the pump, usually for large trucks using gaseous fuels like compressed natural gas (CNG) and liquefied petroleum gas (LPG or propane). These flat fees are not included in the prices reported in these pages.”
Page 4: “Table 3. National Average Retail Fuel Prices on an Energy‐Equivalent Basis, January 2021”
c) “Clean Cities Alternative Fuel Price Report, April 2021.” U.S. Department of Energy, July 6, 2021.
Page 4: “National Average Retail Fuel Prices on an Energy‐Equivalent Basis, April 2021”
d) “Clean Cities Alternative Fuel Price Report, July 2021.” U.S. Department of Energy, October 26, 2021.
Page 4: “Table 3. National Average Fuel Prices on An Energy-Equivalent Basis, July 2021”
e) “Clean Cities Alternative Fuel Price Report, October 2021.” U.S. Department of Energy, December 15, 2021.
Page 4: “Table 3. National Average Fuel Prices on An Energy-Equivalent Basis, October 2021”
f) Dataset: “RIN Price Report, 2021.” U.S. Environmental Protection Agency. Last updated July 25, 2022. <www.epa.gov>
g) Dataset: “RIN Transaction Volumes, 2021.” U.S. Environmental Protection Agency. Last updated July 25, 2022. <www.epa.gov>
h) Article: “Ethanol Blend Wall: Are We There Yet?” U.S. Energy Information Administration, November 23, 2011. <www.eia.gov>
“Ethanol blending in the United States has recently grown to the point where nearly every gallon of gasoline contains 10-percent ethanol by volume (E10), the legal maximum for general use in conventional gasoline-powered vehicles under the gasohol waiver issued in 1979 by the U.S. Environmental Protection Agency (EPA).”
i) “Fuel Properties Comparison.” U.S. Department of Energy, Office of Energy Efficiency and Renewable Energy, Alternative Fuels Data Center, February 27, 2013. <www.afdc.energy.gov>
Page 1: “1 gallon of diesel has 113% of the energy of one gallon of gasoline. … B100 has 103% of the energy in one gallon of gasoline or 93% of the energy of one gallon of diesel. … 1 gallon of propane has 73% of the energy of one gallon of gasoline.”
j) Report: “A Primer on Alternative Transportation Fuels.” By Timothy Coffey. National Defense University, Center for Technology and National Security Policy, September 2010. <apps.dtic.mil>
Page 25: “Table 6. Energy content and chemical composition of several energy sources referenced to gasoline. … Energy per unit volume … Liquid Ethanol [=] .69”
k) Webpage: “Biodiesel Income Tax Credit.” U.S. Department of Energy, Office of Energy Efficiency and Renewable Energy, Alternative Fuels Data Center. Accessed August 6, 2022 at <www.afdc.energy.gov>
“Biodiesel Income Tax Credit … NOTE: This incentive originally expired on December 31, 2017, but was retroactively extended through December 31, 2022, by Public Law 116-94. … A taxpayer that delivers pure, unblended biodiesel (B100) into the tank of a vehicle or uses B100 as an on-road fuel in their trade or business may be eligible for an incentive in the amount of $1.00 per gallon of biodiesel, agri-biodiesel, or renewable diesel. If the biodiesel was sold at retail, only the person that sold the fuel and placed it into the tank of the vehicle is eligible for the tax credit. The incentive is allowed as a credit against the taxpayer’s income tax liability.”
NOTE: An Excel file containing the data and calculations is available upon request.
[201] Renewable Fuel Standard (RFS) subsidies for biodiesel and ethanol are measured by the cost of the credits petroleum companies use “to demonstrate compliance with the standard.” The credits—called RINs [Renewable Identification Numbers]—represent each gallon of renewable fuel produced. Companies that produce renewable fuels are issued RINs, which petroleum companies buy and submit to the U.S. Environmental Protection Agency.†
Just Facts uses the records from the EPA’s RIN transaction system to calculate the weighted average RIN price for each fuel. This data has the following caveats and limitations:
NOTES:
[202] Article: “Scientific Survey Shows Voters Widely Accept Misinformation Spread By the Media.” By James D. Agresti. Just Facts, January 2, 2020. <www.justfacts.com>
The findings are from a nationally representative annual survey commissioned by Just Facts, a non-profit research and educational institute. The survey was conducted by Triton Polling & Research, an academic research firm that used sound methodologies to assess U.S. residents who regularly vote. …
The survey was conducted by Triton Polling & Research, an academic research firm that serves scholars, corporations, and political campaigns. The responses were obtained through live telephone surveys of 700 likely voters across the U.S. during December 2–11, 2019. This sample size is large enough to accurately represent the U.S. population. Likely voters are people who say they vote “every time there is an opportunity” or in “most” elections.
The margin of sampling error for the total pool of respondents is ±4% with at least 95% confidence. The margins of error for the subsets are 6% for Democrat voters, 6% for Trump voters, 5% for males, 5% for females, 12% for 18 to 34 year olds, 5% for 35 to 64 year olds, and 6% for 65+ year olds.
The survey results presented in this article are slightly weighted to match the ages and genders of likely voters. The political parties and geographic locations of the survey respondents almost precisely match the population of likely voters. Thus, there is no need for weighting based upon these variables.
NOTE: For facts about what constitutes a scientific survey and the factors that impact their accuracy, visit Just Facts’ research on Deconstructing Polls & Surveys.
[203] Calculated with the dataset: “Just Facts’ 2019 U.S. Nationwide Survey.” Just Facts, January 2020. <www.justfacts.com>
Page 4:
Q17. Without government subsidies, which of these fuels do you believe is least expensive for powering automobiles?
Gasoline [=] 46.3%
Ethanol [=] 14.1%
Biodiesel [=] 25.7%
Unsure [=] 13.4%
Refused [=] 0.4%
CALCULATION: 14.1% ethanol + 25.7% biodiesel = 39.8%
[204] For facts about how surveys work and why some are accurate while others are not, click here.
[205] Calculated with data from:
a) Report: “June 2020 Monthly Energy Review.” U.S. Energy Information Administration, Office of Energy Statistics, June 25, 2020. <www.eia.gov>
Page 160: “Table 9.4. Retail Motor Gasoline and On-Highway Diesel Fuel Prices (Dollars per Gallon, Including Taxes) … Prices are not adjusted for inflation.”
b) “Clean Cities Alternative Fuel Price Report, January 2019.” U.S. Department of Energy, March 14, 2019.
Page 3: “This report’s prices represent retail, at-the-pump sales prices for each fuel, including federal and state motor fuel taxes. … Some states charge a flat annual fee, in lieu of collecting motor fuel taxes at the pump, usually for large trucks using gaseous fuels like compressed natural gas (CNG) and liquefied petroleum gas (LPG or propane). These flat fees are not included in the prices reported in these pages.”
Page 4: “Table 3. National Average Retail Fuel Prices on an Energy‐Equivalent Basis, January 2019”
c) “Clean Cities Alternative Fuel Price Report, April 2019.” U.S. Department of Energy, May 30, 2019.
Page 4: “National Average Retail Fuel Prices on an Energy‐Equivalent Basis, April 2019”
d) “Clean Cities Alternative Fuel Price Report, July 2019.” U.S. Department of Energy, October 8, 2019.
Page 4: “Table 3. National Average Fuel Prices on An Energy-Equivalent Basis, July 2019”
e) “Clean Cities Alternative Fuel Price Report, October 2019.” U.S. Department of Energy, December 18, 2019.
Page 4: “Table 3. National Average Fuel Prices on An Energy-Equivalent Basis, October 2019”
f) Email from the Department of Agricultural and Consumer Economics at the University of Illinois at Urbana-Champaign to Just Facts, July 15, 2020.
“2019 national average RINs prices … D6 [ethanol] = $0.18 … D4 [biodiesel] = $0.47”
g) Article: “Ethanol Blend Wall: Are We There Yet?” U.S. Energy Information Administration, November 23, 2011. <www.eia.gov>
“Ethanol blending in the United States has recently grown to the point where nearly every gallon of gasoline contains 10-percent ethanol by volume (E10), the legal maximum for general use in conventional gasoline-powered vehicles under the gasohol waiver issued in 1979 by the U.S. Environmental Protection Agency (EPA).”
h) “Fuel Properties Comparison.” U.S. Department of Energy, Office of Energy Efficiency and Renewable Energy, Alternative Fuels Data Center, February 27, 2013. <www.afdc.energy.gov>
Page 1: “1 gallon of diesel has 113% of the energy of one gallon of gasoline. … B100 has 103% of the energy in one gallon of gasoline or 93% of the energy of one gallon of diesel. … 1 gallon of propane has 73% of the energy of one gallon of gasoline.”
i) Report: “A Primer on Alternative Transportation Fuels.” By Timothy Coffey. National Defense University, Center for Technology and National Security Policy, September 2010. <apps.dtic.mil>
Page 25: “Table 6. Energy content and chemical composition of several energy sources referenced to gasoline. … Energy per unit volume … Liquid Ethanol [=] .69”
j) Webpage: “Biodiesel Income Tax Credit.” U.S. Department of Energy, Office of Energy Efficiency and Renewable Energy, Alternative Fuels Data Center. Accessed May 5, 2020 at <afdc.energy.gov>
“Biodiesel Income Tax Credit … NOTE: This incentive originally expired on December 31, 2016, but was retroactively extended through December 31, 2022, by Public Law 116-94. … A taxpayer that delivers pure, unblended biodiesel (B100) into the tank of a vehicle or uses B100 as an on-road fuel in their trade or business may be eligible for an incentive in the amount of $1.00 per gallon of biodiesel, agri-biodiesel, or renewable diesel. If the biodiesel was sold at retail, only the person that sold the fuel and placed it into the tank of the vehicle is eligible for the tax credit. The incentive is allowed as a credit against the taxpayer’s income tax liability.”
NOTE: An Excel file containing the data and calculations is available upon request.
[206] “Energy Primer: A Handbook of Energy Market Basics.” Federal Energy Regulatory Commission, November 2015. <www.ferc.gov>
Page 36:
The electric industry has met this growing demand with increasing efficiency. Between 1929 and 1967, the national average cost of electricity for residential customers plummeted from about 60¢/kWh [kilowatt hour] to 10¢/kWh (in 2005 dollars), and remains around there today. How did the industry achieve such tremendous cost savings and then keep the real price of electricity flat over the past 40 years? Part can be explained by greater efficiency—power plants use less fuel, and new techniques make it cheaper to extract the coal and natural gas that fuels generators. Another part of the answer, though, stems from changes in the way the industry is organized and operated.
[207] For rates after 2015, see the forthcoming chart of inflation-adjusted average prices of electricity in the United States.
[208] Calculated with data from:
a) Dataset: “Average Price by State by Provider, 1990–2020.” U.S. Energy Information Administration, April 15, 2022. <www.eia.gov>
b) Dataset: “CPI—All Urban Consumers (Current Series).” U.S. Department of Labor, Bureau of Labor Statistics. Accessed February 5, 2022 at <www.bls.gov>
“Series Id: CUUR0000SA0; Series Title: All Items in U.S. City Average, All Urban Consumers, Not Seasonally Adjusted; Area: U.S. City Average; Item: All Items; Base Period: 1982–84=100”
NOTE: An Excel file containing the data and calculations is available upon request.
[209] “Kansas Energy Report 2009.” Kansas Energy Council, January 7, 2009. <www.justfacts.com>
Page 26:
Electricity peak loads in Kansas are the greatest during the summer months, primarily due to the electricity needs of air-conditioning systems. …
In order to cost-effectively meet the varying demand of their customers at different times of the year and even different times of the day, most utilities maintain a diverse portfolio of electric power plants (e.g., generating units) that use a variety of fuels. These generating units can be distinguished according to the type of power they produce (firm vs. intermittent) as well as the type of load they are designed to meet (base, peak, or intermediate).
[210] Webpage: “Demand for Electricity Changes Through the Day.” U.S. Energy Information Administration, April 6, 2011. <www.eia.gov>
“Electric power systems must match generation and load in real time, with tight tolerances. As a result, both system stress and prices can vary considerably throughout the day. … Load curve shapes vary among regions and change with the season of the year.”
[211] Report: “Methods for Analyzing Electric Load Shape and Its Variability.” By P. Price. Ernest Orlando Lawrence Berkeley National Laboratory, Environmental Energy Technologies Division, May 2010. <eta-publications.lbl.gov>
Page 1:
“Whole-building electric load” is the total electrical power used by a building at a given moment. The load changes with time in response to changes in lighting levels; heating, ventilating, and air conditioning (HVAC) requirements; and uses such as computers, copy machines, and so on. The curve that represents load as a function of time, called the “load shape,” can often yield useful information. Unexpectedly high night-time loads may indicate waste (such as lights that needlessly remain on when the building is unoccupied); a change in load shape may indicate an equipment or thermostat malfunction; unexpectedly high sensitivity to outdoor temperature may indicate that excessive outdoor air is being brought into the building by the HVAC system; and so on.
[212] “Kansas Energy Report 2009.” Kansas Energy Council, January 7, 2009. <www.justfacts.com>
Page 26:
Electricity consumption (also called “load”) is divided into three categories: base, peak, and intermediate load. Base load refers to demand that occurs continuously, day and night, seven days a week. Peak load, on the other hand, refers to maximum demand that occurs within a given period of time. Intermediate load is a more generic term applied to demand that occurs between base and peak load.
[213] Webpage: “Glossary.” U.S. Energy Information Administration. Accessed July 18, 2013 at <www.eia.gov>
Peak load: the maximum load during a specified period of time.
Base load: the minimum amount of electric power delivered or required over a given period of time at a steady rate.
Base load capacity: the generating equipment normally operated to serve loads on an around-the-clock basis.
Base load plant: A plant, usually housing high-efficiency steam-electric units, which is normally operated to take all or part of the minimum load of a system, and which consequently produces electricity at an essentially constant rate and runs continuously. These units are operated to maximize system mechanical and thermal efficiency and minimize system operating costs.
[214] Report: “Methods for Analyzing Electric Load Shape and Its Variability.” By P. Price. Ernest Orlando Lawrence Berkeley National Laboratory, Environmental Energy Technologies Division, May 2010. <eta-publications.lbl.gov>
Page 22: “Figure 15: Sketch indicating five parameters that we recommend as a minimum set to characterize load shape. The value of each parameter can be calculated for each day; these values can then be summarized (e.g. average peak load, standard deviation of peak load).”
[215] Report: “Nuclear Power’s Role in Generating Electricity.” Congressional Budget Office, May 2008. <www.cbo.gov>
Page 2: “Historically, most base-load capacity has been provided using coal or nuclear technologies because, once the plants have been built, low fuel costs make them relatively cheap to operate continuously.”
Page 4: “Pulverized coal power plants, which burn solid coal ignited by injected air, are by far the most common option for generating base-load electricity.”
[216] “Kansas Energy Report 2009.” Kansas Energy Council, January 7, 2009. <www.justfacts.com>
Page 27:
Power plants that are used to meet the minimum or “base load” of the system are referred to as base-load generating units; they are run continuously and operated, in general, so as to produce electricity at a constant rate. Base-load units are operated to maximize system mechanical and thermal efficiency and minimize system operating costs. Costs are minimized by operating units with the lowest fuel costs for the most hours in the year (i.e., at a high capacity factor). Generally, base-load units include nuclear, coal-fired, geothermal, hydropower, and waste-to-energy plants.63
[217] Book: Fundamentals of Natural Gas. By Vivek Chandra. Pennwell, 2006. <vdoc.pub>
Coal remains the dominant fuel for the world’s thermal electric power plants. … Coal has been the main thermal electric fuel due to its cheap price, worldwide availability, easy transport, and low-technology threshold. Coal’s biggest drawback is the pollution emitted from its combustion. …
Typically, base load power stations are large nuclear, hydroelectric, or coal-burning plants that are expensive to build, with high fixed costs. However, they are cheap to maintain and operate. They operate continuously and are difficult to switch on or off.
[218] “Energy Primer: A Handbook of Energy Market Basics.” Federal Energy Regulatory Commission, November 2015. <www.ferc.gov>
Page 52:
Grid operators dispatch plants—or, call them into service—with the simultaneous goals of providing reliable power at the lowest reasonable cost. Because various generation technologies have differing variable costs, plants are dispatched only when they are part of the most economic combination of plants needed to supply the customers on the grid. For plants operating in RTOs [regional transmission organizations], this cost is determined by the price that generators offer. In other areas, it is determined by the marginal cost of the available generating plants.
[219] Book: Fundamentals of Natural Gas. By Vivek Chandra. Pennwell, 2006. <vdoc.pub>
“The development of IPPs [Independent Power Producers] and the increased efficiency of gas-fired combined cycle plants have allowed gas to become the fuel of choice in both intermediate and peak load phases.”
[220] Report: “Annual Energy Outlook 2013 with Projections to 2040.” U.S. Energy Information Administration, April 2013. <www.osti.gov>
Page 44:
In general, [natural gas] combined-cycle units are considered to be more flexible than steam turbines. They can ramp their output up and down more easily, and their start-up and shutdown procedures involve less time and expense. However, plants that are operated more flexibly (i.e., ramping up and down and cycling on and off) often have higher maintenance requirements and higher maintenance costs.
[221] Report: “Nuclear Power’s Role in Generating Electricity.” Congressional Budget Office, May 2008. <www.cbo.gov>
Page 2: “Even though natural gas prices have increased significantly in recent years, natural gas remains the dominant source of peak capacity because power plants using that fuel are less expensive to build than coal-fired plants or nuclear reactors and easier to start up and shut down.”
[222] Webpage: “Demand for Electricity Changes Through the Day.” U.S. Energy Information Administration, April 6, 2011. <www.eia.gov>
The transition from relatively lower loads to higher loads in the morning is called the “morning ramp”. This transition can stress power systems and lead to volatile prices. … Responding to such load changes often requires using units that can start up quickly. These units can be more expensive to operate than units that stay on for long periods such as baseload units. Power prices can increase during ramping, sometimes considerably, for short periods.
[223] Brief: “What Is the Role of Coal in the United States?” U.S. Energy Information Administration. Last updated July 18, 2012. <www.eia.gov>
“In 2009, coal began losing its price advantage over natural gas for electricity generation in some parts of the country, particularly in the eastern United States as a surge in natural gas production from domestic shale deposits (made possible by advances in drilling technologies) substantially reduced the price of natural gas.”
[224] Article: “On the Rise.” By Thomas Helbling. International Monetary Fund Finance & Development, March 2013. Pages 34–37. <www.imf.org>
Page 36: “The main increased usage of gas has occurred in the U.S. power sector, where the share of electricity produced with natural gas has started to rise because many power plants can switch between gas and the now relatively more expensive (and dirtier) coal.”
[225] Report: “Natural Gas-Electricity Primer.” By Randy Friedman and others. Pacific Northwest Utilities Conference Committee/Northwest Natural Gas Association Planning Task Force, August 2012. <docplayer.net>
Page 3:
In the United States, over the past decade, the single largest sector of natural gas demand growth has occurred in the area of power generation. As emissions from coal-fired power plants have come under increasing public scrutiny, more and more electric utilities and merchant power producers have turned to natural gas for new baseload and peaking generation. This trend has been accelerated in recent years, due to the boom of shale gas production, the relatively short lead time and low cost of natural gas-fired power plant construction, and the robust flexibility that natural gas-fired plants can bring to the area of Variable Energy Resource (VER) integration (i.e., wind and solar).
[226] Report: “Annual Energy Outlook 2013 with Projections to 2040.” U.S. Energy Information Administration, April 2013. <www.osti.gov>
Page 39:
Over the past 20 years, natural gas has been the go-to fuel for new electricity generation capacity. From 1990 to 2011, natural gas-fired plants accounted for 77 percent of all generating capacity additions, and many of the plants added were very efficient combined-cycle plants. However, with slow growth in electricity demand and spikes in natural gas prices between 2005 and 2008, much of the added capacity was used infrequently. Since 2009 natural gas prices have been relatively low, making efficient natural gas-fired combined-cycle plants increasingly competitive to operate in comparison with existing coal-fired plants, particularly in the Southeast and other regions where they have been used to meet demand formerly served by coal-fired plants. In 2012, as natural gas prices reached historic lows, there were many months when natural gas displacement of coal-fired generation was widespread nationally. …
At any point, short-term competition between existing coal- and gas-fired generators—i.e., the decisions determining which generators will be dispatched to generate electricity—depends largely on the relative operating costs for each type of generation, of which fuel costs are a major portion. A second aspect of competition occurs over the longer term, as developers choose which fuels and technologies to use for new capacity builds and whether or not to make mandated or optional upgrades to existing plants. The natural gas or coal share of total generation depends both on the available capacity of each fuel type (affected by the latter type of competition) and on how intensively the capacity is operated. …
In recent years, natural gas has come into dispatch-level competition with coal as the cost of operating natural gas-fired generators has neared the cost of operating coal-fired generators. A number of factors led to the growing competition, including:
• A build-out of efficient combined-cycle capacity during the early 2000s, which in general was used infrequently until recently
• Expansion of the natural gas pipeline network, reducing uncertainty about the availability of natural gas
• Gains in natural gas production from domestic shale formations that have contributed to falling natural gas prices
• Rising coal prices.
Until mid-2008, coal-fired generators were cheaper to operate than natural gas-fired generators in most applications and regions. Competition between available natural gas combined-cycle generators (NGCC) and generators burning eastern (Appalachian) and imported coal began in southeastern electric markets in 2009. Rough parity between NGCC and more expensive coal-fired plants continued until late 2011, when increased natural gas production led to a decline in the fuel price and, in the spring of 2012, a dramatic increase in competition between natural gas and even less expensive types of coal. With natural gas-fired generation increasing steadily, the natural gas share of U.S. electric power sector electricity generation was almost equal to the coal share for the first time in April 2012.
Page 41:
Coal and natural gas prices are key factors in the decision to retire a power plant, along with environmental regulations and the demand for electricity. … The interaction of fuel prices and environmental rules is a key factor in coal plant retirements. AEO2013 [Annual Energy Outlook] assumes that all coal-fired plants have flue gas desulfurization equipment (scrubbers) or dry sorbent injection systems installed by 2016 to comply with the Mercury and Air Toxics Standards. Higher coal prices, lower wholesale electricity prices (often tied to natural gas prices), and reduced use may make investment in such equipment uneconomical in some cases, resulting in plant retirements. …
For new builds, natural gas and renewables generally are more competitive than coal, and concerns surrounding potential future GHG [greenhouse gas] legislation also dampen interest in new coal-fired capacity82. New capacity additions are not the most important factor in the competition between coal and natural gas for electricity generation. There is also significant dispatch-level competition in determining how intensively to operate existing coal-fired power plants versus new and existing natural gas-fired plants.
Page 44:
In addition to relative fuel prices, a number of factors influence the competition between coal-fired steam turbines and natural gas-fired combined-cycle units. One factor in the dispatch-level competition is the availability of capacity of each type. In New England, for example, competition between coal and natural gas is not discussed, because very little coal-fired capacity exists or is projected to be built in that region…. New England is located far from coal sources, and a regional cap on GHG emissions is in place, which makes investment in new coal-fired capacity unlikely. …
… Another component of operating costs not mentioned above is the cost of buying emissions allowances for plants covered by the Acid Rain Program and Clean Air Interstate Rule. In recent years, allowance prices have dropped to levels that make them essentially negligible, although for many years they were a significant component of operating costs.
[227] Report: “Annual Energy Outlook 2013 with Projections to 2040.” U.S. Energy Information Administration, April 2013. <www.osti.gov>
Page 3:
Although coal is expected to continue its important role in U.S. electricity generation, there are many uncertainties that could affect future outcomes. Chief among them are the relationship between coal and natural gas prices and the potential for policies aimed at reducing greenhouse gas (GHG) emissions. In 2012, natural gas prices were low enough for a few months for power companies to run natural gas-fired generation plants more economically than coal plants in many areas. During those months, coal and natural gas were nearly tied in providing the largest share of total electricity generation, something that had never happened before.
Page 40:
The difference between average annual prices per million Btu for natural gas and coal delivered to U.S. electric power plants narrowed substantially in 2012, so that the fuel costs of generating power from NGCC [natural gas combined cycle] units and coal steam turbines per megawatthour were essentially equal on a national average basis (Figure 26), given that combined-cycle plants are much more efficient than coal-fired plants. When the ratio of natural gas prices to coal prices is approximately 1.5 or lower, a typical natural gas-fired combined-cycle plant has lower generating costs than a typical coal-fired plant. … Because fuel prices vary by region, and because there is also considerable variation in efficiencies across the existing fleet of both coal-fired and combined-cycle plants, dispatch-level competition between coal and natural gas continues.
Page 43: “The delivered cost of coal in the [southeastern United States] region is somewhat higher than in many other regions. Central Appalachian and Illinois Basin coals must be transported by rail or barge to the Southeast, and coal from the Powder River Basin must travel great distances by rail. The region also uses some imported coal, typically along the Gulf Coast, which tends to be more expensive.”
Page 44:
In addition to relative fuel prices, a number of factors influence the competition between coal-fired steam turbines and natural gas-fired combined-cycle units. One factor in the dispatch-level competition is the availability of capacity of each type. In New England, for example, competition between coal and natural gas is not discussed, because very little coal-fired capacity exists or is projected to be built in that region…. New England is located far from coal sources, and a regional cap on GHG emissions is in place, which makes investment in new coal-fired capacity unlikely.
NOTE: The next footnote documents that natural gas is currently about 2.5 times the price of coal, which is higher than the breakeven point for being competitive with coal in generating baseload power.
[228] Calculated with data from the report: “July 2022 Monthly Energy Review.” U.S. Energy Information Administration, Office of Energy Statistics, July 26, 2022. <www.eia.gov>
Page 169: “Table 9.9. Cost of Fossil-Fuel Receipts at Electric Generating Plants (Dollars per Million Btu, Including Taxes)”
NOTES:

[229] Article: “Natural Gas-Fired Power Plants Are Being Added and Used More in PJM Interconnection.” U.S. Energy Information Administration, October 17, 2018. <www.eia.gov>
Higher capacity factors for natural gas-fired combined-cycle generators in recent years also indicate a fundamental shift in day-to-day operations of these power plants. Natural gas-fired generators were traditionally used as either intermediate load following (cycling) or peaking resources. In recent years, however, combined-cycle power plants have become more competitive with coal-fired plants for baseload operations and have led to increasing retirements of coal plants.
[230] Article: “U.S. Natural Gas Consumption Sets New Record in 2019.” U.S. Energy Information Administration, March 3, 2020. <www.eia.gov>
Natural gas continues to account for the largest share of electricity generation after first surpassing coal-fired generation on an annual basis in 2016. In 2019, natural gas accounted for 38% of total electricity generation, followed by 23% for coal and 20% for nuclear. New natural gas generation capacity additions have continued to displace coal-fired power plants; about 5% of the total existing U.S. coal-fired capacity was retired in 2019. …
The electric power sector has been shifting toward natural gas in the past decade because of competitive natural gas prices and power plant technology improvements.
[231] Article: “More Power Generation Came From Natural Gas in First Half of 2020 Than First Half of 2019.” By Stephen York and Mark Morey. U.S. Energy Information Administration, August 12, 2020. <www.eia.gov>
Natural gas-fired generation in the Lower 48 states increased nearly 55,000 gigawatthours (GWh), or 9%, in the first half of 2020 compared with the first half of 2019. …
Coal-fired generation absorbed most of the decrease in electrical load in the first half of 2020, registering a 138,000 GWh (30%) decline in output. Because of historically low natural gas prices so far in 2020, coal-fired generation this year has been uneconomical in most regions compared with natural gas-fired generation, leading to price-driven coal-to-natural gas fuel switching. …
Coal-to-natural gas switching was most prominent in the PJM Interconnection (PJM), which covers an area stretching from New Jersey to Illinois, and the Midcontinent Independent System Operator (MISO), which primarily includes areas in the Midwest. PJM and MISO together account for about 35% of the total Lower 48 states’ electric power generation. In both interconnections, competition exists between natural gas and coal as generation fuels, so relative shifts in fuel prices can influence the type of power plant that is dispatched.
… In addition, coal-fired generation remains reasonably competitive in ERCOT [Electric Reliability Council of Texas] because power plants have access to low-cost subbituminous coal from Wyoming’s Powder River Basin and to lignite—the lowest quality of coal—produced at mines near several plants.
Capacity additions have also contributed to the growth in natural gas-fired generation. According to the Electric Power Monthly, about 18,000 megawatts (MW) of net capacity from new combined-cycle natural gas turbine plants has entered service since 2018. Output from these highly efficient plants has been steadily ramping up and helping to drive increases in generation.
[232] Booklet: “Energy, Powering Your World.” By M.T. Westra and S. Kuyvenhoven. Foundation for Fundamental Research on Matter, Institute for Plasma Physics, Rijnhuizen (the Netherlands), 2002. <fire.pppl.gov>
Page 27:
In an electrical generator electricity is made by turning a magnet in a magnetic field. The changing magnetic field drives the electrical current. With the exception of solar cells and fuel cells (which are discussed in chapters 4 and 6), all ways of generating electricity in some way drive a generator of this type. For example, fossil fuels are used to heat water into steam, which can be used to power a steam turbine. The steam turbine then drives the electrical generator.
A gas turbine works in a similar way: when the gas is ignited and starts to burn, it expands. The expanding gas is used to power an electrical generator through a turbine. In addition, the heat of the burning gas is then used to make steam, which powers a steam turbine.
This process is called combined cycle, and it has a high efficiency. If the waste heat of the steam turbine is also used, for example by a factory or for household heating, we have a Cogeneration Plant or Combined Heat and Power Plant.
[233] Report: “Annual Energy Outlook 2013 with Projections to 2040.” U.S. Energy Information Administration, April 2013. <www.osti.gov>
Page 40:
The difference between average annual prices per million Btu for natural gas and coal delivered to U.S. electric power plants narrowed substantially in 2012, so that the fuel costs of generating power from NGCC [natural gas combined cycle] units and coal steam turbines per megawatthour were essentially equal on a national average basis (Figure 26), given that combined-cycle plants are much more efficient than coal-fired plants. When the ratio of natural gas prices to coal prices is approximately 1.5 or lower, a typical natural gas-fired combined-cycle plant has lower generating costs than a typical coal-fired plant.
[234] Booklet: “What You Need to Know About Energy.” National Academy of Sciences, 2008. <nap.nationalacademies.org>
A typical coal-fired electrical plant might be 38% efficient, so a little more than one-third of the chemical energy content of the fuel is ultimately converted to usable electricity. …
In natural gas combined cycle, or NGCC, power plants, we now have technology that takes the waste heat from a natural gas turbine and uses it to power a steam turbine, resulting in a power plant that is as much as 60% efficient. Similar technologies are being developed for use in coal power plants.
[235] Calculated with data from the report: “July 2022 Monthly Energy Review.” U.S. Energy Information Administration, Office of Energy Statistics, July 26, 2022. <www.eia.gov>
Page 169: “Table 9.9. Cost of Fossil-Fuel Receipts at Electric Generating Plants (Dollars per Million Btu, Including Taxes)”
NOTE: An Excel file containing the data and calculations is available upon request.
[236] Calculated with data from:
a) Report: “July 2022 Monthly Energy Review.” U.S. Energy Information Administration, Office of Energy Statistics, July 26, 2022. <www.eia.gov>
Page 169:“Table 9.9. Cost of Fossil-Fuel Receipts at Electric Generating Plants (Dollars per Million Btu, Including Taxes)”
b) Dataset: “CPI—All Urban Consumers (Current Series).” U.S. Department of Labor, Bureau of Labor Statistics. Accessed February 5, 2022 at <www.bls.gov>
“Series Id: CUUR0000SA0; Series Title: All Items in U.S. City Average, All Urban Consumers, Not Seasonally Adjusted; Area: U.S. City Average; Item: All Items; Base Period: 1982–84=100”
NOTE: An Excel file containing the data and calculations is available upon request.
[237] Booklet: “Energy, Powering Your World.” By M.T. Westra and S. Kuyvenhoven. Foundation for Fundamental Research on Matter, Institute for Plasma Physics, Rijnhuizen (the Netherlands), 2002. <fire.pppl.gov>
Page 17: “[N]atural gas gives you a lot of energy for very little money. That is why it is almost always preferable to cook and heat your home with gas, if it is available.”
[238] Article: “Electricity Resource Planners Credit Only a Fraction of Potential Wind Capacity.” U.S. Energy Information Administration, May 13, 2011. <www.eia.gov>
Electric power system planners forecast the demand for electricity at the time of the peak, and then identify existing and potential generating resources needed to satisfy that demand, plus enough additional resources to provide a comfortable reserve margin. The goal is to minimize the costs associated with new capacity investments while ensuring reliability for customers.
[239] Report: “Nuclear Power’s Role in Generating Electricity.” Congressional Budget Office, May 2008. <www.cbo.gov>
Page 15: “State utility commissions commonly direct regulated utilities to meet anticipated demand for new capacity using the technology with the lowest levelized cost.”
[240] “Energy Primer: A Handbook of Energy Market Basics.” Federal Energy Regulatory Commission, November 2015. <www.ferc.gov>
Page 37:
Much of the wholesale market and certain retail markets are competitive, with prices set competitively. Other prices are set based on the service provider’s cost of service. For wholesale markets, FERC [Federal Energy Regulatory Commission] either authorizes jurisdictional entities to sell at market-based rates or reviews and authorizes cost-based rates.
In competitive markets, prices reflect the factors driving supply and demand—the physical fundamentals. In markets where rates are set based on costs, market fundamentals matter as well. Supply incorporates generation and transmission, which must be adequate to meet all customers demand simultaneously, instantaneously and reliably.
Page 40: “State regulators approve a utility’s investments in generation and distribution facilities, either in advance of construction or afterwards when the utility seeks to include a facility’s costs in retail rates. Some states eventually developed elaborate integrated resource planning (IRP) processes to determine what facilities should be built.”
[241] Report: “Annual Energy Outlook 2013 with Projections to 2040.” U.S. Energy Information Administration, April 2013. <www.osti.gov>
Page 73:
Regulatory uncertainty also affects capacity planning. New coal plants may require carbon control and sequestration equipment, resulting in higher material, labor, and operating costs. Alternatively, coal plants without carbon controls could incur higher costs for siting and permitting. Because nuclear and renewable power plants (including wind plants) do not emit GHGs [greenhouse gases], their costs are not directly affected by regulatory uncertainty in this area.
Page 86: “Similarly, actions to reduce GHG emissions can reduce the competiveness of coal, because its high carbon content can translate into a price penalty, in the form of GHG fees, relative to other fuels.”
Page 211:
Although currently there is no Federal legislation in place that restricts GHG emissions, regulators and the investment community have continued to push energy companies to invest in technologies that are less GHG-intensive. The trend is captured in the AEO2013 [Annual Energy Outlook] Reference case through a 3-percentage-point increase in the cost of capital, when evaluating investments in new coal-fired power plants, new coal-to-liquids (CTL) plants without carbon capture and storage (CCS), and pollution control retrofits.
[242] Report: “Investment Decisions for Baseload Power Plants.” Prepared by ICF International for the National Energy Technology Laboratory, January 29, 2010. <citeseerx.ist.psu.edu>
Page x:
Over the last two years, there has been a record level of growth in power plant construction costs. The average cost of building a plant in the U.S. increased over 50 percent from 2006 to 2008. This rapid rise in power plant costs makes investment in baseload plants in particular more risky because they tend to be more capital intensive. The run-up in capital costs was a factor in many utilities’ decision to revise cost estimates and, in some cases, delay or cancel projects.
Page I-1:
Electric utilities continue to need new generation capacity resulting from continuing electric demand growth and the retirement of existing power plants. The decision regarding which technologies to pursue has become extremely complicated, and the direction is unclear. This uncertainty is problematic because the power industry is one of the most capital-intensive industries in the U.S., and accounts for a large portion of the non-governmental, non-financial debt raised in the U.S. Uncertainty complicates this financing process. This is also problematic because of the importance of the power industry to economic performance and environmental impacts.
Page I-6:
Investing in new baseload electric generation capacity involves exchanging an up-front capital outlay in return for an uncertain income stream in the future. Companies will make this exchange if the expected project returns are high enough to cover the initial lump sum as well as compensate them for taking on the project risks. Project risks arise from many sources including policy/regulatory, market, and financial.
These risk factors affect the economic viability of different baseload generation technologies in different ways, and may alter the relative attractiveness of the various investment options from which a generation company may choose. For this reason, the investment decision-making process must incorporate risk into the analysis. For example, technical risks vary considerably between technology types and will be important elements of investment decision making, since, all else being equal, companies would prefer to invest in lower-risk technologies.
Page I-26: “Power plant investment is expensive. Even though utilities have a rate recovery mechanism, full recovery is not guaranteed. Costly and imprudent power plant investments in the 1970s and 1980s have brought about a financial crisis and sometimes bankruptcy for power companies….”
[243] Report: “Nuclear Power’s Role in Generating Electricity.” Congressional Budget Office, May 2008. <www.cbo.gov>
Page 1:
This reappraisal of nuclear power is motivated in large part by the expectation that market-based approaches to limit greenhouse-gas emissions could be put in place in the near future. Several options currently being considered by the Congress—including “cap-and-trade” programs—would impose a price on emissions of carbon dioxide, the most common greenhouse gas.1 If implemented, such limits would encourage the use of nuclear technology by increasing the cost of generating electricity with conventional fossil-fuel technologies. The prospect that such legislation will be enacted is probably already reducing investment in conventional coal-fired power plants.
[244] Report: “Levelized Cost of New Generation Resources in the Annual Energy Outlook 2013.” U.S. Energy Information Administration, January 28, 2013. <www.justfacts.com>
Page 1: “As with any projection, there is uncertainty about all of these factors and their values can vary regionally and across time as technologies evolve and fuel prices change.”
Pages 2–3:
Policy-related factors, such as investment or production tax credits for specified generation sources, can also impact investment decisions. …
[I]n the AEO2013 [Annual Energy Outlook] reference case a 3-percentage point increase in the cost of capital is added when evaluating investments in greenhouse gas (GHG) intensive technologies like coal-fired power and coal-to-liquids (CTL) plants without carbon control and sequestration (CCS). While the 3-percentage point adjustment is somewhat arbitrary, in levelized cost terms its impact is similar to that of an emissions fee of $15 per metric ton of carbon dioxide (CO2) when investing in a new coal plant without CCS, similar to the costs used by utilities and regulators in their resource planning. The adjustment should not be seen as an increase in the actual cost of financing, but rather as representing the implicit hurdle being added to GHG [greenhouse gas]-intensive projects to account for the possibility they may eventually have to purchase allowances or invest in other GHG emission-reducing projects that offset their emissions. As a result, the levelized capital costs of coal-fired plants without CCS [carbon control and sequestration] are higher than would otherwise be expected.
[245] Article: “Ethanol Not Green or Clean, Some Charge.” By Henry C. Jackson. Associated Press, January 30, 2008.
“Robert C. Brown, a professor and the director of the Bioeconomy Institute at Iowa State University … notes that the volatility of natural gas prices are a tough sell for utilities, even though the gas burns more cleanly than a typical coal-fueled plant.”
[246] “Energy Primer: A Handbook of Energy Market Basics.” Federal Energy Regulatory Commission, November 2015. <www.ferc.gov>
Page 38: “Electric power is one of the most capital intensive industries.”
[247] Report: “Natural Gas-Electricity Primer.” By Randy Friedman and others. Pacific Northwest Utilities Conference Committee / Northwest Natural Gas Association Planning Task Force, August 2012. <docplayer.net>
Page 12: “However, electricity supply and demand must be balanced on a real-time basis in very short intervals (measured in seconds).”
[248] Webpage: “Demand for Electricity Changes Through the Day.” U.S. Energy Information Administration, April 6, 2011. <www.eia.gov>
The transition from relatively lower loads to higher loads in the morning is called the “morning ramp.” This transition can stress power systems and lead to volatile prices. On this day, the chart shows a distinct morning ramp or increase in load between 5:00 a.m. and 7:00 a.m. Responding to such load changes often requires using units that can start up quickly. These units can be more expensive to operate than units that stay on for long periods such as baseload units. Power prices can increase during ramping, sometimes considerably, for short periods.
[249] Report: “Annual Energy Outlook 2013 with Projections to 2040.” U.S. Energy Information Administration, April 2013. <www.osti.gov>
Page 44:
In general, [natural gas] combined-cycle units are considered to be more flexible than steam turbines. They can ramp their output up and down more easily, and their start-up and shutdown procedures involve less time and expense. However, plants that are operated more flexibly (i.e., ramping up and down and cycling on and off) often have higher maintenance requirements and higher maintenance costs.
[250] Article: “Electric Rates Not Falling Along with Fuel Costs.” By Jonathan Fahey. Associated Press, July 11, 2012. <news.yahoo.com>
“Even though coal accounts for 38 percent of all power produced in the U.S., natural gas plays an outsized role in determining the price of electricity. The price paid for electricity from the last power plant fired up to meet demand at any given moment is what sets the wholesale price for a given region. And since gas-fired power plants are usually the most expensive, they tend to be fired up last.”
[251] “Energy Primer: A Handbook of Energy Market Basics.” Federal Energy Regulatory Commission, November 2015. <www.ferc.gov>
Page 37: “Sharp changes in demand, as well as extremely high levels of demand, affect prices as well, especially if less-efficient, more-expensive power plants must be turned on to serve load.”
[252] Report: “Levelized Cost of New Generation Resources in the Annual Energy Outlook 2013.” U.S. Energy Information Administration, January 28, 2013. <www.justfacts.com>
Page 2: “Since load must be balanced on a continuous basis, dispatchable technologies generally have more value to a system than non-dispatchable ones, including those whose operation is tied to the availability of an intermittent resource.”
Page 3: “The duty cycle for intermittent renewable resources, wind and solar, is not operator controlled, but dependent on the weather or solar cycle (that is, sunrise/sunset) and so will not necessarily correspond to operator dispatched duty cycles.”
[253] Booklet: “Energy, Powering Your World.” By M.T. Westra and S. Kuyvenhoven. Foundation for Fundamental Research on Matter, Institute for Plasma Physics, Rijnhuizen (the Netherlands), 2002. <fire.pppl.gov>
Page 54: “[W]ind and solar energy are so-called intermittent sources of energy, meaning that they do not deliver energy all the time. This means that you need back-up power, or a means of storing power for times when there is no sun or wind, which adds to the costs of these energy sources.”
[254] Discussion paper: “Assessing the Economic Value of New Utility-Scale Electricity Generation Projects.” U.S. Energy Information Administration, July 2013. <www.eia.gov>
Page 1:
Actual plant investment decisions are affected by the specific technological and regional characteristics of a project, which involve numerous other considerations. The projected utilization rate, which depends on the load shape and the existing resource mix in an area where additional capacity may be needed, is one such factor. The existing resource mix in a region can directly affect the economic viability of a new investment through its effect on the economics surrounding the displacement of existing resources. For example, a wind resource that would primarily displace existing natural gas generation will usually have a different value than one that would displace existing coal generation. A related factor is the capacity value, which depends on both the existing capacity mix and load characteristics in a region.
[255] Discussion paper: “Assessing the Economic Value of New Utility-Scale Electricity Generation Projects.” U.S. Energy Information Administration, July 2013. <www.eia.gov>
Page 1:
Electricity producers, consumers, and policymakers all desire measures that can provide insight into the economic attractiveness of deploying alternate electricity generation technologies. Levelized cost of electricity (LCOE), one commonly cited cost measure, reflects both the capital and operating costs of deploying and running new utility-scale generation capacity of any given type.
[256] Report: “Levelized Cost of New Generation Resources in the Annual Energy Outlook 2013.” U.S. Energy Information Administration, January 28, 2013. <www.justfacts.com>
Page 1: “Levelized cost is often cited as a convenient summary measure of the overall competiveness of different generating technologies. It represents the per-kilowatthour cost (in real dollars) of building and operating a generating plant over an assumed financial life and duty cycle.”
Page 3: “Some technologies, notably solar photovoltaic (PV), are used in both utility-scale plants and distributed end-use residential and commercial applications. As noted above, the levelized cost calculations presented in the tables apply only to utility-scale use of those technologies.”
[257] Discussion paper: “Assessing the Economic Value of New Utility-Scale Electricity Generation Projects.” U.S. Energy Information Administration, July 2013. <www.eia.gov>
Page 1:
Levelized cost of electricity (LCOE), one commonly cited cost measure, reflects both the capital and operating costs of deploying and running new utility-scale generation capacity of any given type. However, as often noted by EIA1 [U.S. Energy Information Administration], the direct comparison of LCOE across technologies to determine the economic competitiveness of various generation alternatives is problematic and potentially misleading.
[258] Report: “Levelized Cost of New Generation Resources in the Annual Energy Outlook 2013.” U.S. Energy Information Administration, January 28, 2013. <www.justfacts.com>
Page 1:
As with any projection, there is uncertainty about all of these factors and their values can vary regionally and across time as technologies evolve and fuel prices change. …
It is important to note that, while levelized costs are a convenient summary measure of the overall competiveness of different generating technologies, actual plant investment decisions are affected by the specific technological and regional characteristics of a project, which involve numerous other considerations. The projected utilization rate, which depends on the load shape and the existing resource mix in an area where additional capacity is needed, is one such factor. The existing resource mix in a region can directly affect the economic viability of a new investment through its effect on the economics surrounding the displacement of existing resources.
Page 2: “Since projected utilization rates, the existing resource mix, and capacity values can all vary dramatically across regions where new generation capacity may be needed, the direct comparison of the levelized cost of electricity across technologies is often problematic and can be misleading as a method to assess the economic competitiveness of various generation alternatives.”
[259] Report: “Levelized Cost of New Generation Resources in the Annual Energy Outlook 2013.” U.S. Energy Information Administration, January 28, 2013. <www.justfacts.com>
Page 1: “The availability of various incentives, including state or federal tax credits, can also impact the calculation of levelized cost. The values shown in the tables in this discussion do not incorporate any such incentives.”
[260] Email from Just Facts to the U.S. Energy Information Administration on April 11, 2016:
“Could you advise if LCOE [levelized cost of electricity] and LACE [levelized avoided cost of electricity] include the costs of land for each type of technology to be built and operated?”
Email from the U.S. Energy Information Administration to Just Facts on April 11, 2016:
“Yes, the underlying capital and operating costs include typical land acquisition costs for each technology. Generally, land is purchased, and would be included in the capital cost. For some technologies (especially wind), it is more typical to lease the land, making land acquisition an operating cost.”
[261] Discussion paper: “Assessing the Economic Value of New Utility-Scale Electricity Generation Projects.” U.S. Energy Information Administration, July 2013. <www.eia.gov>
Page 15: “Environmental regulations that affect the electric power sector are represented as they were in place during late 2012, and do not account for any subsequent judicial or regulatory rulings that may have been issued.”
[262] Report: “Levelized Cost of New Generation Resources in the Annual Energy Outlook 2013.” U.S. Energy Information Administration, January 28, 2013. <www.justfacts.com>
Page 1: “Costs are estimated using tax depreciation schedules consistent with current law, which vary by technology.”
[263] Email from Just Facts to the U.S. Energy Information Administration on June 12, 2013:
“Has anyone produced credible cost estimates for existing capacity (as opposed to cost projections for new capacity in future years)? If so, can you point me to them?”
Email from the U.S. Energy Information Administration to Just Facts on June 12, 2013:
Levelized costs are typically applied as a “forward looking” concept. Once something is built, there is (in theory at least) an actual market price for its generation. In practice, these prices are often hard to obtain, since they are often either contained in private contracts or the result of a dynamic market. But in general, levelized cost estimates and actual market prices would likely be poorly correlated anyway, as prices can be set through demand-side considerations (how much the buyer is willing to pay), and are subject to all sorts of project-specific financing terms, incentives, and other contract conditions that are hard to represent in the levelized cost concept. In general, levelized costs are (or have been) used to compare options for future construction, where it is helpful to be able to compare the combination of investment (fixed) and operating (variable) costs among different options. Once a project is built, the decision on how to operate it are based mostly on variable cost considerations, so levelized costs (which include both variable and fixed cost considerations) are of much less interest to system operators and utilities.
[264] Calculated with data from:
a) Report: “2016 Levelized Cost of New Generation Resources from the Annual Energy Outlook 2010.” U.S. Energy Information Administration, January 12, 2010. <www.eia.gov>
b) Report: “Levelized Cost of New Generation Resources in the Annual Energy Outlook 2011.” U.S. Energy Information Administration, April 26, 2011. <www.eia.gov>
c) Dataset: “Consumer Price Index, All Urban Consumers (CPI-U), U.S. City Average, All items.” U.S. Department of Labor, Bureau of Labor Statistics, August 15, 2013. <www.bls.gov>
NOTE: An Excel file containing the data and calculations is available upon request.
[265] Email from Just Facts to the U.S. Energy Information Administration on June 11, 2013:
In AEO [Annual Energy Outlook] 2010, the estimated levelized cost of new generation wind capacity in 2016 was 149.3 (2008 $/megawatthour). Contrastingly, in AEO 2013, the estimated levelized cost of new generation wind capacity in 2018 is 86.6 (2011 $/megawatthour). After adjusting for inflation, this amounts to a 44% decrease. What are the specific causes of this differential? Has the technology changed dramatically, or is this change driven by other factors?
Email from the U.S. Energy Information Administration to Just Facts on June 11, 2013:
The levelized costs, especially for wind, are the result of a number of different factors, many of which contribute to its variation over time. Often times, these changes work in opposite directions, and the net impact on levelized cost when compared across AEO volumes may not necessarily be intuitively obvious. For example, between AEO 2010 and AEO 2013, our estimated base capital cost for onshore wind capacity increased from $1966/kW (in 2008$) to $2,212/kW (in 2011$). However, between these two estimates, a number of other factors in the estimate changed. For example, our 2015 estimate for utility-grade bond interest rates went from 7.2% to 6.2%. The cost of debt contributes significantly to the levelized cost calculation for a capital-intensive technology like wind.
Another significant factor contributing to the difference between the two estimates relates to our modeling of the “supply curve” for windy lands. In general, we assume that the best wind sites will be built-out first, and that windy lands will become incrementally more expensive to exploit as lower-quality (lower wind speeds, further from transmission, more community opposition, etc.) sites need to be utilized for new builds. For AEO 2011, we significantly changed how we represented this in the model, providing better resolution of both the regional geography and the supply curve itself (note, the numbers you cite are averages across several regions, and are strongly affected by the characteristics of the best and worst regions). As a result of these changes, there are fewer regions contributing to the average with very high costs, and hence lower averages.
Finally, we have updated our estimates of capacity factors for wind. In general, we find that the performance of newer wind plants is improving at a rate that is somewhat better than we had assumed in 2010. Higher capacity factors result in lower levelized costs (since levelized cost is essentially annualized costs divided by annual generation, where annual generation is capacity factor*capacity*hours in a year).
I have not attempted to analyze the exact contribution of these various factors to the change in levelized cost that you note, but I believe I have captured the primary constituents of the change. However, it is possible that there are other factors at work.
We do not generally estimate the physical life of the various electric power technologies that we model. We assume a financial life of 30 years for all technologies (actually, this is something else that has changed since AEO 2010 … used to be 20 years; the longer financial life would also tend to decrease the levelized cost). This means that an investor would expect to recover his investment over a 30-year period. Our assumptions for operation and maintenance expenses account for the cost of maintaining the facility during the assumed financial life. In general, the electric power industry has shown a significant ability to extend the life of most plants well beyond a 30-year cost recovery period (there are many examples of hydro, coal, and nuclear plants that have operated well over 30 years, although I do not know the averages for any of these…. There are also a few wind plants that have operated for as much as 30 years, although the overwhelming majority of wind and solar capacity has been installed in the past few years, so it is hard to get a good estimate of an “expected” life span for these units (similarly, much of the natural gas build-out occurred in the past 20-years, so it would be hard to estimate life span for that).
As indicated above, the capacity factor is a major component in the equation for calculating levelized cost.
[266] Calculated with data from:
a) Report: “Levelized Cost of New Generation Resources in the Annual Energy Outlook 2013.” U.S. Energy Information Administration, January 28, 2013. <www.justfacts.com>
b) Report: “Levelized Cost and Levelized Avoided Cost of New Generation Resources in the Annual Energy Outlook 2015.” U.S. Energy Information Administration, June 3, 2015. <www.eia.gov>
c) Dataset: “CPI Detailed Report Data for December 2015.” U.S. Department of Labor, Bureau of Labor Statistics, January 27, 2016. <www.bls.gov>
NOTE: An Excel file containing the data and calculations is available upon request.
[267] Email from Just Facts to the U.S. Energy Information Administration on February 17, 2016:
“Did the capital cost of building a geothermal plant actually decrease by 57% in just two years? If so, what would account for the changes? Did the economic life assumption change between 2013 and 2015?”
Email from the U.S. Energy Information Administration to Just Facts on February 17, 2016:
The costs shown in the table(s) for geothermal are site-specific, based on the “marginal” (or least-cost) site available to build-out in any given year/region. Costs can vary quite substantially from site to site for geothermal projects, and depend on factors such as depth-to-resource, water temperature, how much of the site has already been developed, distance to transmission, etc. The LCOE [levelized costs of electricity] tables are based on the costs for a future year, and the particular site evaluated (for geothermal) varies from AEO-to-AEO [Annual Energy Outlook], and even from year-to-year within an AEO edition, as each AEO has a different regional build-out of geothermal resources. The cost changes you see from AEO 2013 to AEO 2015 mostly reflect a change in the particular site being evaluated, and not a change in the underlying technology costs. That is, if we held the site being evaluated constant across AEO’s, you wouldn’t see that much change in cost.
Email from the U.S. Energy Information Administration to Just Facts on February 18, 2016:
Correct, the financial life assumptions are the same for AEO 2013 and AEO 2015 (30 year financial life for all plants).
The capital costs are for a specific site (or rather, specific sites, since they are different from year to year). Essentially, we have a “supply curve” that ranks sites from lowest cost to highest cost, and our economic model figures out how many sites are needed to meet the demand for electricity (among all the competing options). The costs for any given year are then taken from the “next available” plant on the supply curve (that is, the one that would be chosen next if demand increased). It’s a bit more complicated than that, but that’s generally what is going on.
There are a number of factors in the model that affect capital cost as a function of time (or at least as tend to correlate with time). These include things like changes in interest rate (important if you are looking at levelized costs), changes in the cost of key input commodities, the effects of “learning-by-doing”, etc. These factors affect all technologies, including geothermal. However, not all technologies have a similar sort of resource or site-specific supply curve like geothermal. It just works out that between AEO 2013 and 2015, the impacts of the “supply curve” effects (that is, moving to a higher cost marginal site) outweigh the various factors that would have likely brought the technology cost down.
[268] Calculated with data from:
a) Report: “Levelized Cost and Levelized Avoided Cost of New Generation Resources in the Annual Energy Outlook 2017.” U.S. Energy Information Administration, April 2017. <www.eia.gov>
Page 8: “Table 1b. Estimated Levelized Cost of Electricity (capacity-weighted average1) for New Generation Resources Entering Service in 2022 (2016 $/MWh)”
b) Report: “Levelized Cost and Levelized Avoided Cost of New Generation Resources in the Annual Energy Outlook 2019.” U.S. Energy Information Administration, February 2019. <www.eia.gov>
Page 7: “Table 1b. Estimated Levelized Cost of Electricity (Unweighted Average) for New Generation Resources Entering Service in 2023 (2018 $/Mwh))”
c) Dataset: “CPI—All Urban Consumers (Current Series).” U.S. Department of Labor, Bureau of Labor Statistics. Accessed February 15, 2020 at <www.bls.gov>
“Series Id: CUUR0000SA0; Series Title: All Items in U.S. City Average, All Urban Consumers, Not Seasonally Adjusted; Area: U.S. City Average; Item: All Items; Base Period: 1982–84=100”
NOTE: An Excel file containing the data and calculations is available upon request.
[269] Email from the U.S. Energy Information Administration to Just Facts on June 15, 2018:
Most of the cost declines in AEO2018 [Annual Energy Outlook] relative to AEO2017 projected LCOE [levelized costs of electricity] are the result of a change in the weighted average cost of capital (WACC) assumption used in the LCOE calculation. The WACC represents the rate-of-return needed on the sale of the electricity in order to pay interest on project development loans (cost of debt) and ensure a competitive return on investment for project owners (cost of equity). While the WACC components (cost of debt and cost of equity) are determined in the macroeconomic module of our energy modeling system, we did change a key assumption in our LCOE calculation between AEO20017 and 2018 that is probably magnifying any changes in underlying interest rates or equity markets.
Specifically, for AEO2017 and prior outlooks, we assumed that the cost of debt accounted for 45% of the total WACC (cost of equity the remaining 55%). However, based on a study we did during 2017, we determined that the typical capital structure used in the electric power industry had moved to be more debt-weighted. Therefore, starting in AEO2018, we now assume that the debt component of WACC is 60%. Note that in the early years of the projection (AEO2018 only), the equity component for wind and solar is a bit higher than it is for other technologies because of the impact of the expiring Federal tax credits on financing considerations for these technologies. In general, this reduced the WACC by about 20%, from about 5.5% in AEO2017 to about 4.5% in AEO2018 (WACC varies by projection year, and will be somewhat higher for wind and solar when receiving the tax credit).
[270] In these same projections, EIA [U.S. Energy Information Administration] increased the capacity factor (rate of actual output to potential output) for PV [photovoltaic] solar by 32%. When asked why, EIA responded:
For PV in particular, we did a significant update of our projection methodology to better account for intra-regional variation in solar output. Therefore, we have higher available capacity factors for PV in most regions (reflecting that we are no longer using simple averages across large geographic footprint regions, but allowing projects to be built in better places in each region first). We have had a similar construct in place for our wind model for some time, which results in modest changes in wind capacity factors from scenario to scenario and outlook to outlook. [Email from the U.S. Energy Information Administration to Just Facts on June 15, 2018.]
[271] Calculated with data from:
b) Report: “Levelized Cost and Levelized Avoided Cost of New Generation Resources in the Annual Energy Outlook 2020.” U.S. Energy Information Administration, February 2020. <www.eia.gov>
Page 7: “Table 1b. Estimated Levelized Cost of Electricity (LCOE, unweighted) for New Generation Resources Entering Service in 2025 (2019 Dollars Per Megawatthour)”
a) Report: “Levelized Costs of New Generation Resources in the Annual Energy Outlook 2019.” U.S. Energy Information Administration, February 2019. <www.eia.gov>
Page 7: “Table 1b. Estimated Levelized Cost of Electricity (LCOE, unweighted) for New Generation Resources Entering Service in 2025 (2019 Dollars Per Megawatthour)”
c) Dataset: “CPI—All Urban Consumers (Current Series).” U.S. Department of Labor, Bureau of Labor Statistics. Accessed March 5, 2021 at <www.bls.gov>
“Series Id: CUUR0000SA0; Series Title: All Items in U.S. City Average, All Urban Consumers, Not Seasonally Adjusted; Area: U.S. City Average; Item: All Items; Base Period: 1982–84=100”
NOTE: An Excel file containing the data and calculations is available upon request.
[272] Email from Just Facts to the U.S. Energy Information Administration on February 19, 2016:
“Are LCOE [levelized costs of electricity] capital costs marginal? If so, to what extent? It sounds like they are technically marginal costs to build a tiny added amount of capacity.”
Email from the U.S. Energy Information Administration to Just Facts on February 19, 2016:
Yes, they are all effectively estimates of what it would cost to build the next unit of capacity (i.e., the next plant) for the specified technology in the given year. For the most part, the slopes of the effective supply curves are shallow enough that the estimates are good over a fairly wide range of builds, but in some cases (especially geothermal … possibly wind or hydro, depending on the year/region/scenario) you may be near an inflection point in the supply curve that narrows the range that the estimate would be good for.
[273] Email from Just Facts to the U.S. Energy Information Administration on August 13, 2013:
Does EIA [U.S. Energy Information Administration] have a monitoring and feedback mechanism to test previous LCOE [levelized cost of electricity] projections? For example, the 2005 AEO [Annual Energy Outlook] contained LCOEs for 2010. Does EIA have a system to measure how these projections compared to realized costs? I searched through a few of the NEMS [National Energy Modeling System] Retrospectives and did not find anything of this nature.
Email from the U.S. Energy Information Administration to Just Facts on August 26, 2013:
No, although we do have some limited review of previous projections from the AEO to compare with “as-realized” values, we do not have the resources to look at every projected value. Since the LCOE estimates are not really part of the AEO, and because there isn’t really an “actual” as-realized value that we can easily compare to (LCOE is essentially an artificial construct, not an actual, measurable value like megawatts of installed capacity, or total annual generation), we do not include it in our key market benchmarks review.
[274] Report: “Levelized Cost of New Generation Resources in the Annual Energy Outlook 2013.” U.S. Energy Information Administration, January 28, 2013. <www.justfacts.com>
Page 2:
Since load must be balanced on a continuous basis, dispatchable technologies generally have more value to a system than non-dispatchable ones, including those whose operation is tied to the availability of an intermittent resource. The levelized costs for dispatchable and nondispatchable technologies are listed separately in the tables, because caution should be used when comparing them to one another.
Page 3:
The duty cycle for intermittent renewable resources, wind and solar, is not operator controlled, but dependent on the weather or solar cycle (that is, sunrise/sunset) and so will not necessarily correspond to operator dispatched duty cycles. As a result, their levelized costs are not directly comparable to those for other technologies (even where the average annual capacity factor may be similar) and therefore are shown in separate sections within each of the tables.
[275] “Kansas Energy Report 2009.” Kansas Energy Council, January 7, 2009. <www.justfacts.com>
Pages 26–27:
Electricity differs from other commodities in that it can not be stored on a commercial scale: in other words, electricity stored through currently available mechanical and chemical means encounters very large losses in efficiency. Therefore, in order to provide reliable service, utilities must have enough capacity—defined as instantaneous electrical production—to meet the greatest peak loads experienced.63 This capacity can be provided either from their own generation assets; long-term power purchase agreements; or “real-time” purchases in the spot market.
Generating units that rely on fuel sources whose availability can be controlled by the operators of the plant are said to provide firm power. Power plants that generate electricity from most conventional sources of electricity (e.g., fossil fuels, nuclear, and hydro), as well as some non-conventional sources such as geothermal and landfill wastes, are considered firm power. On the other hand, generating units that rely on fuel sources, such as wind and solar energy, whose availability can not be controlled by the operators of the unit are said to provide intermittent power. Because intermittent resources cannot be depended on to supply electricity at any given moment, units relying on these resources must be accompanied by power plants that provide firm power. For example, dedicated (load-following) units, which operate on standby, can be used to meet demand during periods when the intermittent resource is unavailable, as when the wind is not blowing or the sun is not shining.
63 In practice utilities are required to maintain capacity well in excess of forecasted peak loads. Southwest Power Pool (SPP) requires (with few exceptions) that all members maintain capacity margins 12% greater than forecasted peak load.
[276] Article: “Electricity Systems Adjust Operations to Growing Wind Power Output.” U.S. Energy Information Administration, March 25, 2011. Corrected 3/28/11. <www.eia.gov>
[Electric power system] operators must continuously match electricity generation to electricity demand, a process that becomes more difficult with additional intermittency. …
Electric power systems with a large share of intermittent resources may rely more on flexible resources such as gas turbines or hydropower to “firm up” the output of intermittent generators.
[277] Report: “Levelized Costs of New Generation Resources in the Annual Energy Outlook 2022.” U.S. Energy Information Administration, February 2021. <www.eia.gov>
Page 6: “We calculate all levelized costs and values based on a 30-year cost recovery period, using a nominal after-tax weighted average cost of capital (WACC) of 6.2%.8 In reality, a plant’s cost recovery period and cost of capital can vary by technology and project type.”
[278] Email from the U.S. Energy Information Administration to Just Facts on June 11, 2013:
“We do not generally estimate the physical life of the various electric power technologies that we model. We assume a financial life of 30 years for all technologies.”
[279] Report: “Levelized Cost of New Generation Resources in the Annual Energy Outlook 2013.” U.S. Energy Information Administration, January 28, 2013. <www.justfacts.com>
Page 2: “The levelized cost shown for each utility-scale generation technology in the tables in this discussion are calculated based on a 30-year cost recovery period, using a real after tax weighted average cost of capital (WACC) of 6.6 percent. In reality, the cost recovery period and cost of capital can vary by technology and project type.”
[280] Report: “Annual Energy Outlook 2013 with Projections to 2040.” U.S. Energy Information Administration, April 2013. <www.osti.gov>
Pages 45–46:
NRC [the Nuclear Regulatory Commission] has the authority to issue initial operating licenses for commercial nuclear power plants for a period of 40 years. Decisions to apply for operating license renewals are made entirely by nuclear power plant owners, and typically they are based on economics and the ability to meet NRC requirements.
In April 2012, Oyster Creek Unit 1 became the first commercial nuclear reactor to have operated for 40 years, followed by Nine Mile Point Unit 1 in August, R. E. Ginna in September, and Dresden Unit 2 in December 2012. Two additional plants, H.B. Robinson Unit 2 and Point Beach Unit 1, will complete 40 years of operation in 2013. As of December 2012, the NRC had granted license renewals to 72 of the 104 operating U.S. reactors, allowing them to operate for a total of 60 years. Currently, the NRC is reviewing license renewal applications for 13 reactors, and 15 more applications for license renewals are expected between 2013 and 2019.
NRC regulations do not limit the number of license renewals a nuclear power plant may be granted. The nuclear power industry is preparing applications for license renewals that would allow continued operation beyond 60 years. The first such application, for permission to operate a commercial reactor for a total of 80 years is tentatively scheduled to be submitted in 2015. Aging plants may face a variety of issues that could lead to a decision not to apply for a second license renewal, including both economic and regulatory issues—such as increased operation and maintenance (O&M) costs and capital expenditures to meet NRC requirements. Industry research is focused on identifying challenges that aging facilities might encounter and formulating potential approaches to meet those challenges90, 91. Typical challenges involve degradation of structural materials, maintaining safety margins, and assessing the structural integrity of concrete92.
The outcome of pending research and market developments will be important to future decisions regarding life extensions beyond 60 years. The AEO2013 [Annual Energy Outlook] Reference case assumes that the operating lives of most of the existing U.S. nuclear power plants will be extended at least through 2040. The only planned retirement included in the Reference case is the announced early retirement of the Oyster Creek nuclear power station in 2019, as reported on Form EIA-860. The Reference case also assumes an additional 7.1 gigawatts of nuclear power capacity retirements by 2040, representing about 7 percent of the current fleet. These generic retirements reflect uncertainty related to issues associated with long-term operations and age management.
Page 219: “The Low Nuclear case assumes that reactors will not receive a second license renewal, so that all existing nuclear plants are retired within 60 years of operation.”
[281] Report: “Nuclear Power’s Role in Generating Electricity.” Congressional Budget Office, May 2008. <www.cbo.gov>
Page 6: “Because power plants can operate for many years (numerous power stations built in the first half of the previous century are still in use), new capacity is expected to replace existing capacity slowly in the absence of a cost advantage.”
[282] Article: “Hydropower Has a Long History in the United States.” U.S. Energy Information Administration, July 8, 2011. <www.eia.gov>
“At the end of 2010, hydro represented 24 of the 25 oldest operating power facilities in the United States and 72% of all electric generating capacity more than 60 years old. Unlike most other generator types, Federal entities (for example, the Bureau of Land Management) built and currently own or operate hydro facilities in many areas of the country.”
[283] Report: “Distributed Generation System Characteristics and Costs in the Buildings Sector.” Prepared by ICF International for the U.S. Energy Information Administration, Office of Integrated Analysis and Forecasting, August 2013. <www.eia.gov>
Page vi:
Lifetime. Crystalline PV [photovoltaic] modules and balance of plant components (except the inverter) are forecast to have an expected lifetime of 25 years in 2008. Thin-film modules and balance of plant components (except the inverter) are forecast to have a lifetime of 20 years in 2008. Both technologies are forecast to have a lifetime of 30 years by 2035. Inverters, which are assumed to be identical for both crystalline and thin-film technologies, are forecast to have lifetime of 10 years in 2008, rising to 15 years by 2035.
Page 25:
Thin-film technologies are relatively new, and there is little field experience data available to support lifetime projections. However, for forecasting purposes, ICF assumed that thin-film systems would follow similar lifetime trends as more mature crystalline technologies, but lag behind in terms of the time required to achieve these lifetime estimates. For crystalline technologies, ICF developed the forecasting parameters shown in Table 15. This table also shows the forecasting parameters developed for thin-film technologies and inverters. …
Lifetime forecasts are shown in Figure 13. As indicated, the lifetime of thin-film modules is forecast to lag crystalline modules through 2028. From 2028 onward, the lifetime for both technologies is assumed to be 30 years. For forecasting purposes, ICF is estimating that average inverter lifetimes will start at 10 years in 2008, and increase to 15 years by 2018.
[284] Email from the U.S. Energy Information Administration to Just Facts on June 12, 2013:
“Once a project is built, the decision on how to operate it are based mostly on variable cost considerations, so levelized costs (which include both variable and fixed cost considerations) are of much less interest to system operators and utilities.”
[285] Report: “Nuclear Power’s Role in Generating Electricity.” Congressional Budget Office, May 2008. <www.cbo.gov>
Page 6: “Because power plants can operate for many years (numerous power stations built in the first half of the previous century are still in use), new capacity is expected to replace existing capacity slowly in the absence of a cost advantage.”
[286] Email from the U.S. Energy Information Administration to Just Facts on August 26, 2013:
EIA [U.S. Energy Information Administration] doesn’t produce levelized cost estimates for rooftop solar, in part because the economic decision criteria that a “end-use” customer (that is, a resident or business considering placing PV [photovoltaic] on their building) are significantly different than the economic decision criteria that a wholesale generator might face. This would include different financing options and costs, different valuations for the energy (wholesale vs. retail electricity displaced), and different abilities to capture tax incentives (especially for residential units).
[287] “2010 Solar Technologies Market Report.” U.S. Department of Energy, Office of Energy Efficiency and Renewable Energy, National Renewable Energy Laboratory, November 2011. <www.nrel.gov>
Page 52:
The LCOEs [levelized costs of electricity] of utility-scale PV [photovoltaic] systems are generally lower than those of residential and commercial PV systems located in the same region. This is partly due to the fact that installed and O&M [operating and maintenance] costs per watt tend to decrease as PV system size increases, owing to more advantageous economies of scale and other factors (see Section 3.6 on PV installation cost trends and Section 3.7 on PV O&M.) in addition, larger, optimized, better-maintained PV systems can produce electricity more efficiently and consistently.
[288] Report: “Photovoltaic (PV) Pricing Trends: Historical, Recent, and Near-Term Projections.” By David Feldman and others. Lawrence Berkeley National Laboratory, November 2012. <www.nrel.gov>
Page 11:
System size has a significant and beneficial impact on rooftop and ground-mount system prices. Large PV [photovoltaic] systems not only better amortize fixed project overhead expenses—they also improve installer efficiencies and drive more efficient supply chain strategies. Figure 10 summarizes the modeled price benefits of increased system size across market segments. There are significant economies-of-scale within and across market segments, with diminishing returns as system size increases within each market segment.
[289] Report: “Levelized Cost and Levelized Avoided Cost of New Generation Resources in the Annual Energy Outlook 2015.” U.S. Energy Information Administration, June 3, 2015. <www.eia.gov>
Page 3:
In the AEO2015 [Annual Energy Outlook] reference case, 3 percentage points are added to the cost of capital when evaluating investments in greenhouse gas (GHG) intensive technologies like coal-fired power…. The adjustment should not be seen as an increase in the actual cost of financing, but rather as representing the implicit hurdle being added to GHG-intensive projects to account for the possibility that they may eventually have to purchase allowances or invest in other GHG-emission-reducing projects to offset their emissions. As a result, the LCOE [levelized cost of electricity] values for coal-fired plants without CCS [carbon control and sequestration] are higher than would otherwise be expected.
[290] Report: “Levelized Cost and Levelized Avoided Cost of New Generation Resources in the Annual Energy Outlook 2019.” U.S. Energy Information Administration, February 2019. <www.eia.gov>
Pages 5–6:
EIA [U.S. Energy Information Administration] calculates LCOE [levelized cost of electricity] values based on a 30-year cost recovery period, using a real after-tax weighted average cost of capital (WACC) of 4.2%.7 In reality, a plant’s cost recovery period and cost of capital can vary by technology and project type. In the AEO2019 [Annual Energy Outlook] Reference case, EIA includes a three-percentage-point increase to the cost of capital when evaluating investments for new coal-fired power plants and new coal-to-liquids (CTL) plants without carbon capture and sequestration (CCS) and pollution control retrofits. This increase reflects observed financial risks8 associated with major investments in long operating-life power plants with a relatively higher rate of carbon dioxide (CO2) emissions. AEO2019 takes into account two coal-fired technologies that are compliant with the New Source Performance Standard (NSPS) for CO2 emissions under Section 111(b) of the Clean Air Act. One technology is designed to capture 30% of CO2 emissions and would still be considered a high emitter relative to other new sources; therefore, it may continue to face potential financial risk if CO2 emission controls are further strengthened. Another technology is designed to capture 90% of CO2 emissions and would not face the same financial risk; therefore, EIA does not assume the three-percentage-point increase in the cost of capital. As a result, the LCOE values for a coal-fired plant with 30% CCS are higher than they would be if the same cost of capital were used for all technologies.
7 The real WACC of 4.2% corresponds to a nominal after-tax rate of 7.0% for plants entering service in 2023. For plants entering service in 2021 and 2040, the nominal WACC used to calculate LCOE was 6.8% and 7.0%, respectively. An overview of the WACC assumptions and methodology can be found in the Electricity Market Module of the National Energy Modeling System: Model Documentation 2018 (<www.eia.gov>).
8 See, for example, “Companies End Effort to Buy Navajo Generating Station”, Power, September 21, 2018 for an example of both financing and off-take risks facing coal-fired capacity or “One of U.K.’s largest banks won’t fund new plants or mines,” ClimateWire (subscription required), August 3, 2018 for an example of increasingly limited options in international finance markets for such plants.
[291] Calculated with data from:
a) Report: “Levelized Cost and Levelized Avoided Cost of New Generation Resources in the Annual Energy Outlook 2015.” U.S. Energy Information Administration, June 3, 2015. <www.eia.gov>
Page 6: “Table 1. Estimated levelized cost of electricity (LCOE) for new generation resources, 2020”
b) “Loan Calculator and Amortization.” Bankrate. Accessed October 9, 2013 at <www.bankrate.com>
NOTES:
[292] Report: “Levelized Costs of New Generation Resources in the Annual Energy Outlook 2021.” U.S. Energy Information Administration, February 2021. <www.eia.gov>
Page 6:
Starting in AEO [Annual Energy Outlook] 2020, EIA represents an ultra-supercritical9 (USC) coal generation technology without carbon capture and sequestration (CCS). In December 2018, the U.S. Environmental Protection Agency (EPA) amended earlier 2015 findings that partial CCS was the best system of emissions reductions (BSER) for greenhouse gas reductions and proposed to replace it with the most efficient demonstrated steam cycle, which EIA assumes is represented by ultra-supercritical coal technology. Regulatory or court actions related to power plant emissions taken after September 2020 are not accounted for in AEO2021.
9 USC coal plants are compatible with CCS technologies because they use boilers that heat coal to higher temperatures, which increases the pressure of steam to improve efficiency and results in less coal use and fewer carbon emissions than other boiler technologies.
[293] Calculated with data from:
a) Report: “Levelized Costs of New Generation Resources in the Annual Energy Outlook 2022.” U.S. Energy Information Administration, March 2022. <www.eia.gov>
Page 6:
Starting in AEO2020[Annual Energy Outlook], we model an ultrasupercritical10 (USC) coal generation technology without carbon capture and sequestration (CCS), and we continue to model USC with 30% and 90% CCS. In December 2018, the U.S. Environmental Protection Agency (EPA) amended earlier 2015 findings that partial CCS was the best system of emissions reductions (BSER) for greenhouse gas reductions and proposed to replace it with the most efficient demonstrated steam cycle, which we assume is represented by USC technology. …
10 USC coal plants are compatible with CCS technologies because they use boilers that heat coal to higher temperatures, which increases the pressure of steam to improve efficiency and results in less coal use and fewer carbon emissions than other boiler technologies.
Page 9: “Table 1b. Estimated Unweighted Levelized Cost of Electricity (LCOE) and Levelized Cost of Storage for New Resources Entering Service in 2027 (2021 Dollars Per Megawatthour)”
Page 13: “Table 4b. Value-Cost Ratio (Unweighted) for New Resources Entering Service in 2027”
NOTE: An Excel file containing the data and calculations is available upon request.
[294] Report: “Levelized Cost of New Generation Resources in the Annual Energy Outlook 2013.” U.S. Energy Information Administration, January 28, 2013. <www.justfacts.com>
Pages 1–2:
Conceptually, a better assessment of economic competitiveness can be gained through consideration of avoided cost, a measure of what it would cost the grid to generate the electricity that is otherwise displaced by a new generation project, as well as its levelized cost. Avoided cost, which provides a proxy measure for the annual economic value of a candidate project, may be summed over its financial life and converted to a stream of equal annual payments, which may then be divided by average annual output of the project to develop a figure that expresses the “levelized” avoided cost of the project. This levelized avoided cost may then be compared to the levelized cost of the candidate project to provide an indication of whether or not the project’s value exceeds its cost. If multiple technologies are available to meet load, comparisons of each project’s levelized avoided cost to its levelized project cost may be used to determine which project provides the best net economic value. Estimating avoided costs is more complex than for simple levelized costs, because they require tools to simulate the operation of the power system with and without any project under consideration. The economic decisions regarding capacity additions in EIA’s [U.S. Energy Information Administration] long-term projections reflect these concepts rather than simple comparisons of levelized project costs across technologies.
[295] Discussion paper: “Assessing the Economic Value of New Utility-Scale Electricity Generation Projects.” U.S. Energy Information Administration, July 2013. <www.eia.gov>
Page 1:
A better assessment of the economic competitiveness of a candidate generation project can be gained through joint consideration of its LCOE [levelized cost of electricity] and its avoided cost, a measure of what it would cost the grid to meet the demand that is otherwise displaced by a new generation project. …
The difference between the LACE [levelized avoided cost of electricity] and LCOE values for the candidate project provides an indication of whether or not its economic value exceeds its cost, where cost is considered net of the value of any production or investment tax credits provided by federal law.
[296] Email from Just Facts to the U.S. Energy Information Administration on June 12, 2013:
The EIA [U.S. Energy Information Administration] overview of levelized costs states that “a better assessment of economic competitiveness can be gained through consideration of avoided cost, a measure of what it would cost the grid to generate the electricity that is otherwise displaced by a new generation project, as well as its levelized cost.” Have credible estimates of avoided costs for the various generating technologies been performed by anyone? If so, can you point me to them?
Email from the U.S. Energy Information Administration to Just Facts on June 12, 2013:
We are currently working on a paper that will provide an explanation of and estimates for the avoided costs mentioned in the write-up. We plan on hosting a workshop in July to more fully vet these concepts, and I expect that we should be publishing something in conjunction with that workshop. However, in the interim, we don’t have any estimates ready for publication.
[297] Discussion paper: “Assessing the Economic Value of New Utility-Scale Electricity Generation Projects.” U.S. Energy Information Administration, July 2013. <www.eia.gov>
Page 1: “The difference between the LACE [levelized avoided cost of electricity] and LCOE [levelized cost of electricity] values for the candidate project provides an indication of whether or not its economic value exceeds its cost, where cost is considered net of the value of any production or investment tax credits provided by federal law.”
Page 2:
This paper presents measures of the economic value for three types of power generation projects (onshore wind, solar PV [photovoltaic], and advanced combined cycle natural gas generation)2 across 22 regions within the U.S. electricity system based on the difference between the LACE and LCOE values for each project type in each region. These estimates are derived from input and calculations performed within the National Energy Modeling System (NEMS), and reflect the resource utilization and electric grid characteristics that are projected in the Annual Energy Outlook 2013 (AEO 2013) Reference and No Sunset cases. These calculations of economic value do not reflect the direct value of compliance with Renewable Portfolio Standards (RPS), which are currently in force in 30 states. That is, the payment of Renewable Energy Credits or other RPS compliance revenues are not included. …
For projects entering service in 2018, the estimated economic value of onshore wind and solar PV projects is negative and significantly below that of advanced combined cycle (Adv CC) projects in all regions (Table 3a). However, the net economic value of onshore wind and solar PV projects improves significantly over the projection period. By 2035, the economic value of onshore wind is positive in 6 of 20 regions where the technology can be built, and in 3 of 21 regions for solar PV (with 5 additional regions close to breakeven). Improved economics for wind and PV projects over time reflect higher costs to operate existing generation, increased load, and lower LCOE of wind and solar PV due to declining technology costs3. In other regions, wind and solar PV projects continue to be unattractive on a net value basis relative to Adv CC projects.
3 Wind is assumed to not be available in Florida because of the lack of suitable, high-quality wind resources. In New York City, wind cannot be built for lack of significant undeveloped land on which to site a utility-scale wind plant.
Page 3: “Direct comparison of LCOE values significantly understate the advantage of the Adv CC relative to onshore wind in terms of economic value in all regions, while overstating the advantage of Adv CC relative to solar PV (Tables 1a and 3a).”
Page 6: “PV LCOE shown in Table 1a includes the 10-percent ITC [investment tax credit] currently embedded as a permanent provision of U.S. tax law. … This differs from the treatment of the permanent 10-percent ITC in other EIA [U.S. Energy Information Administration] published LCOE estimates, which do not include direct electric power subsidies, and is done to facilitate the comparison of cost, as seen in the market, with value as seen by the market.”
Page 9:
Table 3a looks at the difference between the LACE and LCOE results for the Reference case to provide an indicator of the economic value of each of the 3 project types at the margin for the 2018 and 2035 service entry dates. If LACE is smaller than LCOE, the resource costs more than the combination of resources that would otherwise serve load. Under such conditions, the new resource would generally not be built. However, if the difference between LACE and LCOE is positive, the resource should be attractive as a new build, since its economic value exceeds its cost. As shown in Table 3a, LCOE exceeds LACE for wind projects entering service in 2018 in all regions, indicating the absence of an economic incentive to build additional wind capacity. With modest natural gas prices and a surplus of generating capacity relative to current load, wind would be displacing low-cost incumbent sources like coal and natural gas generation from combined cycle units.
Page 10: “For example, Table 4a shows that there is almost no wind built between 2017 and 2020, consistent with the reported net negative economic value (LACE less LCOE) for this technology in 2018.”
Page 11: “Solar LCOE remains substantially higher than wind LCOE throughout the projection period, but because of its higher LACE values, the economic attractiveness of PV improves along with that of wind.”
[298] Discussion paper: “Assessing the Economic Value of New Utility-Scale Electricity Generation Projects.” U.S. Energy Information Administration, July 2013. <www.eia.gov>
“These estimates are derived from input and calculations performed within the National Energy Modeling System (NEMS), and reflect the resource utilization and electric grid characteristics that are projected in the Annual Energy Outlook 2013 (AEO 2013) Reference and No Sunset cases.”
[299] Report: “Annual Energy Outlook 2013 with Projections to 2040.” U.S. Energy Information Administration, April 2013. <www.osti.gov>
Page 28:
Construction of wind-generation units slows considerably in the Reference case from recent construction rates, following the assumed expiration of the tax credit for wind power in 2012. The combination of slow growth in electricity demand, little impact from state-level renewable generation requirements, and low prices for competing fuels like natural gas keeps growth relatively low until around 2025, when load growth finally catches up with installed capacity, and natural gas prices increase to a level at which wind is a cost-competitive option in some regions.
[300] Discussion paper: “Assessing the Economic Value of New Utility-Scale Electricity Generation Projects.” U.S. Energy Information Administration, July 2013. <www.eia.gov>
Page 6: “PV [photovoltaic] LCOE [levelized cost of electricity] shown in Table 1a includes the 10-percent ITC [investment tax credit] currently embedded as a permanent provision of U.S. tax law. … This differs from the treatment of the permanent 10-percent ITC in other EIA [U.S. Energy Information Administration] published LCOE estimates, which do not include direct electric power subsidies, and is done to facilitate the comparison of cost, as seen in the market, with value as seen by the market.”
[301] Discussion paper: “Assessing the Economic Value of New Utility-Scale Electricity Generation Projects.” U.S. Energy Information Administration, July 2013. <www.eia.gov>
Page 15: “Environmental regulations that affect the electric power sector are represented as they were in place during late 2012, and do not account for any subsequent judicial or regulatory rulings that may have been issued.”
[302] Report: “Levelized Cost of New Generation Resources in the Annual Energy Outlook 2013.” U.S. Energy Information Administration, January 28, 2013. <www.justfacts.com>
Page 1: “Costs are estimated using tax depreciation schedules consistent with current law, which vary by technology.”
[303] Email from Just Facts to the U.S. Energy Information Administration on February 19, 2016:
“Are LCOE [levelized cost of electricity] capital costs marginal? If so, to what extent? It sounds like they are technically marginal costs to build a tiny added amount of capacity.”
Email from the U.S. Energy Information Administration to Just Facts on February 19, 2016:
Yes, they are all effectively estimates of what it would cost to build the next unit of capacity (i.e., the next plant) for the specified technology in the given year. For the most part, the slopes of the effective supply curves are shallow enough that the estimates are good over a fairly wide range of builds, but in some cases (especially geothermal … possibly wind or hydro, depending on the year/region/scenario) you may be near an inflection point in the supply curve that narrows the range that the estimate would be good for.
[304] Email from Just Facts to the U.S. Energy Information Administration on August 13, 2013:
“Are the LACE [levelized avoided cost of electricity] values in the discussion paper calculated under the assumption that the financial life of all technologies is 30 years (like LCOE [levelized cost of electricity])?”
Email from the U.S. Energy Information Administration to Just Facts on August 26, 2013:
“Yes, the LACE calculation utilizes market-value information over a 30-year period.”
[305] Report: “Levelized Costs of New Generation Resources in the Annual Energy Outlook 2022.” U.S. Energy Information Administration, March 2022. <www.eia.gov>
Page 6: “We calculate all levelized costs and values based on a 30-year cost recovery period, using a nominal after-tax weighted average cost of capital (WACC) of 6.2%.8 In reality, a plant’s cost recovery period and cost of capital can vary by technology and project type.”
[306] Email from the U.S. Energy Information Administration to Just Facts on August 26, 2013:
EIA [U.S. Energy Information Administration] doesn’t produce levelized cost estimates for rooftop solar, in part because the economic decision criteria that a “end-use” customer (that is, a resident or business considering placing PV [photovoltaic] on their building) are significantly different than the economic decision criteria that a wholesale generator might face. This would include different financing options and costs, different valuations for the energy (wholesale vs. retail electricity displaced), and different abilities to capture tax incentives (especially for residential units).
[307] “2010 Solar Technologies Market Report.” U.S. Department of Energy, Office of Energy Efficiency and Renewable Energy, National Renewable Energy Laboratory, November 2011. <www.nrel.gov>
Page 52:
The LCOEs [levelized costs of electricity] of utility-scale PV [photovoltaic] systems are generally lower than those of residential and commercial PV systems located in the same region. This is partly due to the fact that installed and O&M [operating and maintenance] costs per watt tend to decrease as PV system size increases, owing to more advantageous economies of scale and other factors (see Section 3.6 on PV installation cost trends and Section 3.7 on PV O&M.) in addition, larger, optimized, better-maintained PV systems can produce electricity more efficiently and consistently.
[308] Report: “Photovoltaic (PV) Pricing Trends: Historical, Recent, and Near-Term Projections.” By David Feldman and others. Lawrence Berkeley National Laboratory, November 2012. <www.nrel.gov>
Page 11:
System size has a significant and beneficial impact on rooftop and ground-mount system prices. Large PV systems not only better amortize fixed project overhead expenses—they also improve installer efficiencies and drive more efficient supply chain strategies. Figure 10 summarizes the modeled price benefits of increased system size across market segments. There are significant economies-of-scale within and across market segments, with diminishing returns as system size increases within each market segment.
[309] Report: “Levelized Cost and Levelized Avoided Cost of New Generation Resources in the Annual Energy Outlook 2022.” U.S. Energy Information Administration, March 2022. <www.eia.gov>
Pages 11–12:
When the LACE [levelized avoided cost of electricity] of a particular technology exceeds its LCOE [levelized cost of electricity] or LCOS [levelized cost of storage], that technology would generally be economically attractive to build. The build decisions in actuality (and as we model in AEO2022), however, are more complex than a simple LACE-to-LCOE or LACE-to-LCOS comparison because they include factors such as policy and non-economic drivers. Nevertheless, the value-cost ratio (the ratio of LACE-to-LCOE or LACE-to-LCOS) provides a reasonable point of comparison of first-order economic competitiveness among a wider variety of technologies than is possible using LCOE, LCOS, or LACE tables individually. In Tables 4a and 4b, a value index of less than one indicates that the cost of the marginal new unit of capacity exceeds its value to the system, and a value-cost ratio greater than one indicates that the marginal new unit brings in value higher than its cost by displacing more expensive generation and capacity options. The average value-cost ratio is an average of 25 regional LACE-to-LCOE or LACE-to-LCOS ratios. The range of the LACE-to-LCOE or LACE-to-LCOS ratios represents the lower and upper bounds of the regional LACE-to-LCOE and LACE-to-LCOS ratios, and it is not based on the ratio between the minimum and maximum values shown in Tables 2 and 3.
[310] Calculated with data from:
a) Report: “Levelized Costs of New Generation Resources in the Annual Energy Outlook 2022.” U.S. Energy Information Administration, March 2022. <www.eia.gov>
Page 9: “Table 1b. Estimated Unweighted Levelized Cost of Electricity (LCOE) and Levelized Cost of Storage for New Resources Entering Service in 2027 (2021 Dollars Per Megawatthour)”
Page 13: “Table 4b. Value-Cost Ratio (Unweighted) for New Resources Entering Service in 2027”
b) Report: “Levelized Costs of New Generation Resources in the Annual Energy Outlook 2021.” U.S. Energy Information Administration, February 2021. <www.eia.gov>
Page 6: “Starting in AEO [Annual Energy Outlook] 2020, EIA represents an ultra-supercritical9 (USC) coal generation technology without carbon capture and sequestration (CCS). In December 2018, the U.S. Environmental Protection Agency (EPA) amended earlier 2015 findings that partial CCS was the best system of emissions reductions (BSER) for greenhouse gas reductions and proposed to replace it with the most efficient demonstrated steam cycle, which EIA assumes is represented by ultra-supercritical coal technology. Regulatory or court actions related to power plant emissions taken after September 2020 are not accounted for in AEO2021. …9 USC coal plants are compatible with CCS technologies because they use boilers that heat coal to higher temperatures, which increases the pressure of steam to improve efficiency and results in less coal use and fewer carbon emissions than other boiler technologies.”
NOTE: An Excel file containing the data and calculations is available upon request.
[311] Report: “Challenges of Electric Power Industry Restructuring for Fuel Suppliers.” U.S. Energy Information Administration, September 1998. <www.eia.gov>
Page 81:
Biomass produced 75 percent of non-hydroelectric renewable electricity in 1997, with wood comprising the largest component of biomass energy. … [W]ood and wood waste … are the principal biomass products used to produce electricity. Their use is greatest in the forest products industry, which consumes about 85 percent of all wood and wood waste used for energy and is the second-largest consumer of electricity in the industrial sector (Figure 23).184 Electric utilities have historically relied on fossil fuels and consumed very little biomass. Of the more than 500 U.S. biomass power production facilities (with total capability near 10 gigawatts), fewer than 20 are owned or operated by electric utilities.
Almost all industrial firms that generate biomass-based electricity do so to achieve multiple objectives. First, most of these firms are producing biomass-related products185 and have waste streams (e.g., pulping liquor) available as (nearly) free fuel. This makes the cost of self-generation cheaper in many cases than purchasing electricity. Despite the fact that the Forest Products Industry self-generates a substantial portion of its electricity demand, its sizable power requirements leave plenty of room for additional competitively priced self-generation, if such is possible. Second, combusting waste to generate electricity also solves otherwise substantial waste disposal problems. Thus, the net cost of generation is much lower to the forest products industry than it would be if its generating facilities were used only to produce electricity, because a sizable waste disposal cost is being avoided. The use of waste-based fuel by some industrial generators to reduce waste disposal costs while simultaneously providing power is an example of synergy among industrial production, environmental concerns, and energy production.
[312] Calculated with data from the report: “Electric Power Monthly with Data for January 2022.” U.S. Energy Information Administration, Office of Energy Statistics, March 24, 2022. <www.eia.gov>
Page 17 (of PDF): “Table 1.1. Net Generation by Energy Source: Total (All Sectors), 2012–January 2022 (Thousand Megawatthours)”
Page 18 (of PDF): “Table 1.1.A. Net Generation from Renewable Sources: Total (All Sectors), 2012–January 2022 (Thousand Megawatthours)”
NOTES:
[313] Report: “Nuclear Power’s Role in Generating Electricity.” Congressional Budget Office, May 2008. <www.cbo.gov>
Page 5: “Biomass technology can generate base-load electricity in certain parts of the country but is typically limited to small applications because fuel costs become prohibitive at large facilities.”
[314] “Energy Primer: A Handbook of Energy Market Basics.” Federal Energy Regulatory Commission, November 2015. <www.ferc.gov>
Page 49: “Oil-fired plants generally produce only a small amount of the total electricity generated in the U.S. power markets. These facilities are expensive to run and also emit more pollutants than gas plants.”
[315] Calculated with data from the report: “July 2022 Monthly Energy Review.” U.S. Energy Information Administration, Office of Energy Statistics, July 26, 2022. <www.eia.gov>
Page 169: “Table 9.9. Cost of Fossil-Fuel Receipts at Electric Generating Plants (Dollars per Million Btua, Including Taxes)”
NOTE: An Excel file containing the data and calculations is available upon request.
[316] Textbook: The Chemistry and Technology of Petroleum (4th edition). By James G. Speight. CRC Press, 2007.
Page 3: “The word petroleum, derived from Latin petra and oelum, means literally rock oil and refers to hydrocarbons that occur widely in sedimentary rocks in all the forms of gases, liquids, semisolids, or solids.”
Page 12:
The definition of petroleum has been varied, unsystematic, diverse, and often archaic. …
… This part of the text attempts to alleviate much of the confusion that exists, but it must be remembered that the terminology of petroleum is still open to personal choice and historical usage. …
Petroleum is a mixture of gaseous, liquid, and solid hydrocarbon compounds that occur in sedimentary rock deposits….
Petroleum is a naturally occurring mixture of hydrocarbons, generally in a liquid state (ASTM [American Society for Testing and Materials], 2005b).
Page 14: “Petroleum and the equivalent term crude oil cover a wide assortment of materials consisting of mixtures of hydrocarbons and other compounds containing variable amounts of sulfur, nitrogen, and oxygen, which may vary in volatility, specific gravity, and viscosity.”
[317] Report: “Annual Energy Review 2011.” U.S. Energy Information Administration, Office of Energy Statistics, September 2012. <www.eia.gov>
Page 352:
Crude Oil: A mixture of hydrocarbons that exists in liquid phase in natural underground reservoirs and remains liquid at atmospheric pressure after passing through surface separating facilities. Depending upon the characteristics of the crude stream, it may also include: 1) small amounts of hydrocarbons that exist in gaseous phase in natural underground reservoirs but are liquid at atmospheric pressure after being recovered from oil well (casinghead) gas in lease separators and are subsequently commingled with the crude stream without being separately measured. Lease condensate recovered as a liquid from natural gas wells in lease or field separation facilities and later mixed into the crude stream is also included; 2) small amounts of nonhydrocarbons produced with the oil, such as sulfur and various metals; and 3) drip gases, and liquid hydrocarbons produced from tar sands, oil sands, gilsonite, and oil shale. Liquids produced at natural gas processing plants are excluded.
Page 358: “Hydrocarbon: An organic chemical compound of hydrogen and carbon in the gaseous, liquid, or solid phase. The molecular structure of hydrocarbon compounds varies from the simplest (methane, a constituent of natural gas) to the very heavy and very complex.”
Page 360: “Lease Condensate: A mixture consisting primarily of pentanes and heavier hydrocarbons which is recovered as a liquid from natural gas in lease separation facilities. This category excludes natural gas plant liquids, such as butane and propane, which are recovered at downstream natural gas processing plants or facilities.”
Page 362:
Natural Gas Plant Liquids (NGPL): Those hydrocarbons in natural gas that are separated as liquids at natural gas processing plants, fractionating and cycling plants, and, in some instances, field facilities. Lease condensate is excluded. Products obtained include ethane; liquefied petroleum gases (propane, butanes, propane-butane mixtures, ethane-propane mixtures); isopentane; and other small quantities of finished products, such as motor gasoline, special naphthas, jet fuel, kerosene, and distillate fuel oil. See Natural Gas Liquids.
Page 364: “Petroleum: A broadly defined class of liquid hydrocarbon mixtures. Included are crude oil, lease condensate, unfinished oils, refined products obtained from the processing of crude oil, and natural gas plant liquids.”
Page 369: “Unfinished Oils: All oils requiring further processing, except those requiring only mechanical blending. Unfinished oils are produced by partial refining of crude oil and include naphthas and lighter oils, kerosene and light gas oils, heavy gas oils, and residuum.”
[318] Report: “Annual Energy Review 2011.” U.S. Energy Information Administration, Office of Energy Statistics, September 2012. <www.eia.gov>
Page 358: “Hydrocarbon: An organic chemical compound of hydrogen and carbon in the gaseous, liquid, or solid phase. The molecular structure of hydrocarbon compounds varies from the simplest (methane, a constituent of natural gas) to the very heavy and very complex.”
Page 360: “Lease Condensate: A mixture consisting primarily of pentanes and heavier hydrocarbons which is recovered as a liquid from natural gas in lease separation facilities. This category excludes natural gas plant liquids, such as butane and propane, which are recovered at downstream natural gas processing plants or facilities.”
Page 364: “Petroleum: A broadly defined class of liquid hydrocarbon mixtures. Included are crude oil, lease condensate, unfinished oils, refined products obtained from the processing of crude oil, and natural gas plant liquids.”
[319] Textbook: The Chemistry and Technology of Petroleum (4th edition). By James G. Speight. CRC Press, 2007.
Page 3: “The word petroleum … refers to hydrocarbons that occur widely in sedimentary rocks in all the forms of gases, liquids, semisolids, or solids.”
Page 14: “Petroleum … cover a wide assortment of materials consisting of mixtures of hydrocarbons and other compounds containing variable amounts of sulfur, nitrogen, and oxygen, which may vary in volatility, specific gravity, and viscosity.”
[320] Book: Petroleum Chemistry and Refining. Edited by James G. Speight. Taylor and Francis, 1998.
Chapter 1: “The Composition of Petroleum.” By Robert B. Long and James G. Speight. Pages 1–38.
Page 8:
[I]t is perhaps remarkable that petroleum has such a narrow spread of elemental (ultimate) composition (Speight, 1991):
|
Element |
Range, Weight % |
|
Carbon |
83.0–87.0 |
|
Hydrogen |
10.0–14.0 |
|
Nitrogen |
0.1–2.0 |
|
Oxygen |
0.05–1.5 |
|
Sulfur |
0.05–6.0 |
However it is not so much the elemental composition (which may be a reflection of physical or fractional composition) of petroleum that determines its behavior and properties. It is the fractional composition of petroleum, more specifically the differences in petroleum composition of crude oils, that determines the properties and behavior.
In many cases, the differences in properties can be ascribed to differences in the ratios of the various hydrocarbon constituents….
[321] Book: Petroleum Chemistry and Refining. Edited by James G. Speight. Taylor and Francis, 1998.
Chapter 1: “The Composition of Petroleum.” By Robert B. Long and James G. Speight. Pages 1–38.
Page 6:
[P]rotopetroleum is a generic term that has been employed on occasion to indicate the product after initial changes in the precursors have occurred that result in the formation of petroleum. In some instances, the terms protopetroleum and kerogen have been used interchangeably, although there is the notion that protopetroleum is the first product of diagenesis and kerogen is the later product of this sequence.
Thus, using this form of terminology, differences in petroleum composition can be ascribed not only to the nature of the precursors that form the protopetroleum but also to the relative amounts of precursors in the mix and the maturation conditions under which the protopetroleum is converted to kerogen and thence to petroleum.
Petroleum is generally accepted as being formed from buried marine sediments by the action of heat and pressure. …
Marine sediment is a term used to describe the organic biomass believed to be the raw material from which petroleum is derived, and it is mixture of many types of marine organic material that collected at the bottom of the seas and then become buried by the geological action of the earth. The types of marine organic material that collected in the sediment could be bacteria, plankton, animals, fish, and marine vegetation in varying proportions in the different sediments buried at various locations around the world. …
These buried marine deposits then undergo a series of concurrent and consecutive chemical reactions collectively called diagenesis under the influence of the temperature, pressure, and long reaction times afforded by history in the earth.
[322] Book: Energy and the Missing Resource: A View From the Laboratory. By I. Dostrovsky. Cambridge University Press, 1988.
Pages 12–13:
[Petroleum is] formed as the breakdown products of plant organisms, mainly of marine origin, that become incorporated in sediments and are then subjected to heat under high pressures over long periods of time. … [T]he precipitated organic matter must escape oxidization by oxygen dissolved in the water. Where stagnant conditions exist, accumulation of sediments rich in organic debris may be formed. Such sediments, when compacted by extensive pressure of accumulated material, become rocks, source rocks as they are called in the petroleum industry, in which oil may be formed.
[323] Article: “Feuding Over the Origins of Fossil Fuels.” By Lisa M. Pinsker. American Geological Institute Geotimes, October 2005. <www.geotimes.org>
A petroleum geochemist at the U.S. Geological Survey, [Mike] Lewan is an expert on the origins of oil, and quite familiar with an idea that has been lingering within some scientific circles for many years now: that petroleum—oil and natural gas—comes from processes deep in Earth that do not involve organic material. This idea runs contrary to the theory that has driven modern oil exploration: that petroleum comes from the heating of organic material over time in Earth’s shallower crust.
[324] Textbook: The Chemistry and Technology of Petroleum (4th edition). By James G. Speight. CRC Press, 2007.
Page 10: “The modern petroleum industry began in the later years of the 1850s with the discovery, in 1857, and subsequent commercialization of petroleum in Pennsylvania in 1859…. The modern refining era can be said to have commenced in 1862 with the first appearance of petroleum distillation….”
Page 12:
After completion of the first well (by Edwin Drake [in 1857]) the surrounding areas were immediately leased and extensive drilling took place. Crude oil output in the United States increased from approximately 2000 barrels … in 1859 to nearly 3,000,000 bbl in 1863 and approximately 10,000,000 barrels in 1874. In 1861 the first cargo of oil, contained in wooden barrels, was sent across the Atlantic to London, and by the 1870s, refineries, tank cars, and pipelines had become characteristic features of the industry….
[325] Report: “Year-in-Review: 2012, Energy Infrastructure Events and Expansions.” U.S. Department of Energy, July 2013. <energy.gov>
Page 16: “Crude oil and petroleum products are largely transported by marine vessels and pipelines. These assets deliver the vast majority of the world’s crude oil supply, including that of the United States.”
[326] Report: “Overview of the Design, Construction, and Operation of Interstate Liquid Petroleum Pipelines.” By T.C. Pharris and R.L. Kolpa. Argonne National Laboratory, Environmental Science Division, November 2007. <corridoreis.anl.gov>
Page 1:
The U.S. liquid petroleum pipeline industry is large, diverse, and vital to the nation’s economy. Comprised of approximately 200,000 miles of pipe in all fifty states, liquid petroleum pipelines carried more than 40 million barrels per day, or 4 trillion barrel-miles, of crude oil and refined products during 2001. That represents about 17% of all freight transported in the United States, yet the cost of doing so amounted to only 2% of the nation’s freight bill. Approximately 66% of domestic petroleum transport (by ton-mile) occurs by pipeline, with marine movements accounting for 28% and rail and truck transport making up the balance. In 2004, the movement of crude petroleum by domestic federally regulated pipelines amounted to 599.6 billion ton-miles, while that of petroleum products amounted to 315.9 billion ton-miles…. As an illustration of the low cost of pipeline transportation, the cost to move a barrel of gasoline from Houston, Texas, to New York Harbor is only 3¢ per gallon, which is a small fraction of the cost of gasoline to consumers.
[327] Report: “Biofuels: Challenges to the Transportation, Sale, and Use of Intermediate Ethanol Blends.” U.S. Government Accountability Office, June 2011. <www.gao.gov>
Page 6:
As shown in figure 2, the infrastructure used to transport petroleum fuels from refineries to wholesale terminals in the United States is different from that used to transport ethanol. Petroleum-based fuel is primarily transported from refineries to terminals by pipeline.10 …
10 Terminals on the East Coast are large integrated facilities with marine, pipeline, and tanker truck receiving and dispatching capabilities. Although some terminals have rail access, they were not originally designed to support rail as a major mode for transporting fuel.
Page 7:
Figure 2: Primary Transportation of Petroleum Products and Ethanol from Refineries to Retail Fueling Outlets
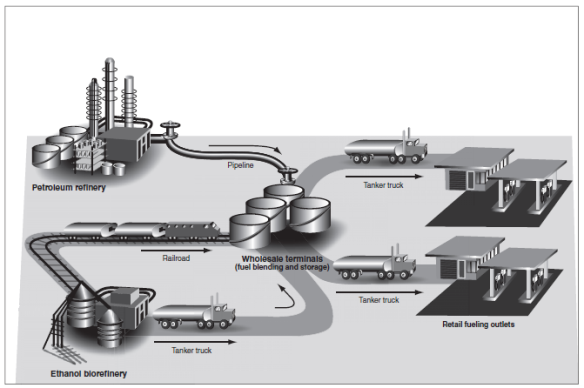
Note: Other means of transportation are also used to move petroleum and ethanol products to wholesale terminals. For example, for ethanol, barges are also used to a limited extent.
Page 16: “Over many decades, the United States has established very efficient networks of pipelines that move large volumes of petroleum-based fuels from production or import centers on the Gulf Coast and in the Northeast to distribution terminals along the coasts.”
[328] Textbook: The Chemistry and Technology of Petroleum (4th edition). By James G. Speight. CRC Press, 2007.
Page 138: “Large-scale transportation of crude oil, refined petroleum products, and natural gas is usually accomplished by pipelines and tankers, whereas smaller-scale distribution, especially of petroleum products, is carried out by barges, trucks, and rail cars.”
[329] Webpage: “Safe Pipelines FAQs.” U.S. Department of Transportation, Pipeline and Hazardous Materials Safety Administration, August 29, 2007. <www.phmsa.dot.gov>
Pipelines are one of the safest and most cost-effective means to transport the extraordinary volumes of natural gas and hazardous liquid products that fuel our economy. To move the volume of even a modest pipeline, it would take a constant line of tanker trucks, about 750 per day, loading up and moving out every two minutes, 24 hours a day, seven days a week. The railroad-equivalent of this single pipeline would be a train of seventy-five 2,000-barrel tank rail cars everyday.
Relative to the volumes of products transported, pipelines are extremely safe when compared to other modes of energy transportation. Oil pipeline spills amount to about 1 gallon per million barrel-miles (Association of Oil Pipelines). One barrel, transported one mile, equals one barrel-mile, and there are 42 gallons in a barrel. In household terms, this is less than one teaspoon of oil spilled per thousand barrel-miles.
Pipeline statistics for calendar year 2002 report 139 liquid pipeline accidents resulted in the loss of about 97,000 barrels and about $31 million in property damage, but no deaths nor injuries. Natural gas transmission line accidents in 2002 resulted in one death and five injuries. …
Even though pipeline transportation is the safest and most economical means of transportation for our nation’s energy products, PHMSA [Pipeline and Hazardous Materials Safety Administration] and pipeline operators are engaged in research to identify and develop more effective means of ensuring the safety of energy pipelines.
[330] Report: “Annual Energy Review 2011.” U.S. Energy Information Administration, Office of Energy Statistics, September 2012. <www.eia.gov>
Page 352:
Crude Oil: A mixture of hydrocarbons that exists in liquid phase in natural underground reservoirs and remains liquid at atmospheric pressure after passing through surface separating facilities. Depending upon the characteristics of the crude stream, it may also include: 1) small amounts of hydrocarbons that exist in gaseous phase in natural underground reservoirs but are liquid at atmospheric pressure after being recovered from oil well (casinghead) gas in lease separators and are subsequently commingled with the crude stream without being separately measured. Lease condensate recovered as a liquid from natural gas wells in lease or field separation facilities and later mixed into the crude stream is also included; 2) small amounts of nonhydrocarbons produced with the oil, such as sulfur and various metals; and 3) drip gases, and liquid hydrocarbons produced from tar sands, oil sands, gilsonite, and oil shale. Liquids produced at natural gas processing plants are excluded.
[331] Textbook: The Chemistry and Technology of Petroleum (4th edition). By James G. Speight. CRC Press, 2007.
Page 3: “Petroleum products are the basic materials used for the manufacture of synthetic fibers for clothing and in plastics, paints, fertilizers, insecticides, soap, and synthetic rubber. The uses of petroleum as a source of raw material in manufacturing are central to the functioning of modern industry.”
[332] Calculated with data from the report: “July 2022 Monthly Energy Review.” U.S. Energy Information Administration, Office of Energy Statistics, July 26, 2022. <www.eia.gov>
Page 7: “Table 1.3 Primary Energy Consumption by Source (Quadrillion Btu) … Fossil Fuelsa … 2021 Total … Petroleumd [=] 35.071 … 2021 Total … Totalg [=] R97.331”
CALCULATION: 35.071 / 97.331 = 36%
[333] Calculated with data from the report: “July 2022 Monthly Energy Review.” U.S. Energy Information Administration, Office of Energy Statistics, July 26, 2022. <www.eia.gov>
Page 41: “Table 2.2. Residential Sector Energy Consumption”
Page 43: “Table 2.3. Commercial Sector Energy Consumption”
Page 45: “Table 2.4. Industrial Sector Energy Consumption”
Page 47: “Table 2.5. Transportation Sector Energy Consumption”
Page 49: “Table 2.6. Electric Power Sector Energy Consumption”
NOTE: An Excel file containing the data and calculations is available upon request.
[334] Calculated with data from the report: “July 2022 Monthly Energy Review.” U.S. Energy Information Administration, Office of Energy Statistics, July 26, 2022. <www.eia.gov>
Page 61: “Table 3.1 Petroleum Overview (Thousand Barrels per Day)”
NOTE: An Excel file containing the data and calculations is available upon request.
[335] Webpage: “Oil: Crude and Petroleum Products Explained, Oil Imports and Exports.” U.S. Energy Information Administration. Last updated May 1, 2018. <bit.ly>
U.S. petroleum imports peaked in 2005 and generally declined up until 2015. This trend was the result of many factors, including a decline in consumption, increased use of domestic biofuels (ethanol in gasoline and biodiesel in diesel fuel), and increased domestic production of crude oil and hydrocarbon gas liquids. The economic downturn following the financial crisis of 2008, improvements in vehicle fuel economy, and changes in consumer behavior contributed to the decline in U.S. petroleum consumption. Imports and consumption both increased in 2015 through 2017.
NOTE: This webpage includes renewable fuels in the totals for petroleum products. In keeping with the precise definition of petroleum and EIA’s [U.S. Energy Information Administration’s] data cited above, Just Facts does not include renewable fuels in totals for petroleum products.
[336] Webpage: “Oil: Crude and Petroleum Products Explained, Oil Imports and Exports—Basics.” U.S. Energy Information Administration. Last updated June 9, 2015. <bit.ly>
U.S. dependence on imported petroleum has declined since peaking in 2005. This trend is the result of a variety of factors including a decline in consumption and shifts in supply patterns. The economic downturn following the financial crisis of 2008, improvements in efficiency, changes in consumer behavior, and patterns of economic growth all contributed to the decline in petroleum consumption. Additionally, increased use of domestic biofuels (ethanol and biodiesel) and strong gains in domestic production of crude oil and natural gas plant liquids expanded domestic supplies and reduced the need for imports.
NOTE: This webpage includes renewable fuels in the totals for petroleum products. In keeping with the precise definition of petroleum and EIA’s [U.S. Energy Information Administration’s] data cited above, Just Facts does not include renewable fuels in the totals for petroleum products.
[337] Article: “On the Rise.” By Thomas Helbling. International Monetary Fund Finance & Development, March 2013. Pages 34–37. <www.imf.org>
Page 37: “Because of increased domestic production, net imports of natural gas, crude oil, and petroleum products have declined markedly from a peak of about 12.5 million barrels a day in 2005 to roughly 7.7 million in 2012. Besides higher domestic production, the decline in net imports reflects the impact of high oil prices on consumption.”
[338] Article: “Covid-19 Mitigation Efforts Result in the Lowest U.S. Petroleum Consumption in Decades.” By Jesse Barnett. U.S. Energy Information Administration, April 23, 2020. <www.eia.gov>
U.S. consumption of petroleum products has fallen to its lowest level in decades because of measures that limit travel and because of the general economic slowdown induced by mitigation efforts for the coronavirus disease 2019 (Covid-19). …
Motor gasoline consumption has declined the most in absolute terms. Before many businesses were shut down and stay-at-home orders were issued, motor gasoline product supplied averaged 8.9 million b/d, based on 2020 data through March 13. Since then, motor gasoline product supplied has fallen 40% to 5.3 million b/d as of the week ending April 17. This decrease in motor gasoline product supplied accounts for 54% of the total change in product supplied. U.S. consumption of jet fuel experienced the largest drop in relative terms, declining 62% from a pre-shutdown average of 1.6 million b/d to just 612,000 b/d on April 17.
[339] Webpage: “Oil and Petroleum Products Explained: Oil Imports and Exports.” U.S. Energy Information Administration. Last updated April 13, 2021. <bit.ly>
In 2020, the United States exported about 8.51 MMb/d and imported about 7.86 MMb/d of petroleum,1 making the United States a net annual petroleum exporter for the first time since at least 1949. Also in 2020, the United States produced2 about 18.40 million barrels per day (MMb/d) of petroleum, and consumed3 about 18.12 MMb/d. Even though in 2020, total U.S. annual petroleum production was greater than total petroleum consumption and exports were greater than imports, the United States still imported some crude oil and petroleum products from other countries to help to supply domestic demand for petroleum and to supply international markets. …
After generally increasing every year from 1954 through 2005, U.S. total gross and net petroleum imports peaked in 2005. Increases in domestic petroleum production and in petroleum exports helped to reduce total annual petroleum net imports every year except one since 2005. In 2020, annual petroleum net imports were actually negative (at –0.65 MMb/d), the first time this occurred since at least 1949.
NOTE: This webpage includes renewable fuels in the totals for petroleum products. In keeping with the precise definition of petroleum and EIA’s [U.S. Energy Information Administration’s] data cited above, Just Facts does not include renewable fuels in totals for petroleum products.
[340]Calculated with data from the report: “July 2022 Monthly Energy Review.” U.S. Energy Information Administration, Office of Energy Statistics, July 26, 2022. <www.eia.gov>
Page 61:
Table 3.1 Petroleum Overview (Thousand Barrels per Day)
|
Year |
Consumption |
Imports |
|
(Million Barrels Per Year) |
||
|
2005 |
7,593 |
4,580 |
|
2006 |
7,551 |
4,523 |
|
2007 |
7,548 |
4,393 |
|
2008 |
7,117 |
4,056 |
|
2009 |
6,579 |
3,528 |
|
2010 |
6,669 |
3,446 |
|
2011 |
6,526 |
3,084 |
|
2012 |
6,394 |
2,698 |
|
2013 |
6,557 |
2,277 |
|
2014 |
6,587 |
1,849 |
|
2015 |
6,729 |
1,719 |
|
2016 |
6,765 |
1,750 |
|
2017 |
6,845 |
1,375 |
|
2018 |
7,036 |
855 |
|
2019 |
7,087 |
244 |
|
2020 |
6,270 |
–232 |
|
2021 |
6,809 |
–60 |
NOTES:
[341] Calculated with data from the report: “July 2022 Monthly Energy Review.” U.S. Energy Information Administration, Office of Energy Statistics, July 26, 2022. <www.eia.gov>
Page 61: “Table 3.1: Petroleum Overview (Thousand Barrels per Day)”
NOTE: An Excel file containing the data and calculations is available upon request.
[342] Calculated with the dataset: “U.S. Net Imports by Country.” U.S. Energy Information Administration, Office of Energy Statistics, July 29, 2022. <www.eia.gov>
“Net Imports of Total Crude Oil and Products into the U.S. by Country 1973–2021” <www.eia.gov>
NOTES:
[343] Calculated with the dataset: “U.S. Net Imports by Country.” U.S. Energy Information Administration, Office of Energy Statistics, July 29, 2022. <www.eia.gov>
“Net Imports of Total Crude Oil and Products into the U.S. by Country 1973–2021” <www.eia.gov>
NOTES:
[344] Calculated with the dataset: “U.S. Net Imports by Country.” U.S. Energy Information Administration, Office of Energy Statistics, July 29, 2022. <www.eia.gov>
“Net Imports of Total Crude Oil and Products into the U.S. by Country 1973–2021” <www.eia.gov>
NOTES:
[345] Webpage: “Our Mission.” Organization of the Petroleum Exporting Countries. Accessed August 18, 2022. <www.opec.org>
In accordance with its Statute, the mission of the Organization of the Petroleum Exporting Countries (OPEC) is to coordinate and unify the petroleum policies of its Member Countries and ensure the stabilization of oil markets in order to secure an efficient, economic and regular supply of petroleum to consumers, a steady income to producers and a fair return on capital for those investing in the petroleum industry.
[346] Webpage: “Member Countries.” Organization of the Petroleum Exporting Countries. Accessed August 18, 2022 at <www.opec.org>
The Organization of the Petroleum Exporting Countries (OPEC) was founded in Baghdad, Iraq, with the signing of an agreement in September 1960 by five countries namely Islamic Republic of Iran, Iraq, Kuwait, Saudi Arabia and Venezuela. They were to become the Founder Members of the Organization.
These countries were later joined by Qatar (1961), Indonesia (1962), Libya (1962), the United Arab Emirates (1967), Algeria (1969), Nigeria (1971), Ecuador (1973), Gabon (1975), Angola (2007), Equatorial Guinea (2017) and Congo (2018).
Ecuador suspended its membership in December 1992, rejoined OPEC in October 2007, but decided to withdraw its membership of OPEC effective 1 January 2020. Indonesia suspended its membership in January 2009, reactivated it again in January 2016, but decided to suspend its membership once more at the 171st Meeting of the OPEC Conference on 30 November 2016. Gabon terminated its membership in January 1995. However, it rejoined the Organization in July 2016. Qatar terminated its membership on 1 January 2019.
This means that, currently, the Organization has a total of 13 Member Countries.
[347] “OPEC Statute.” Organization of the Petroleum Exporting Countries, 2021. <www.opec.org>
Page 1:
Article 1
The Organization of the Petroleum Exporting Countries (OPEC), hereinafter referred to as “the Organization”, created as a permanent intergovernmental organization in conformity with the Resolutions of the Conference of the Representatives of the Governments of Iran, Iraq, Kuwait, Saudi Arabia and Venezuela, held in Baghdad from September 10 to 14, 1960, shall carry out its functions in accordance with the provisions set forth hereunder.
Article 2
A. The principal aim of the Organization shall be the coordination and unification of the petroleum policies of Member Countries and the determination of the best means for safeguarding their interests, individually and collectively. …
C. Due regard shall be given at all times to the interests of the producing nations and to the necessity of securing a steady income to the producing countries; an efficient, economic and regular supply of petroleum to consuming nations; and a fair return on their capital to those investing in the petroleum industry.
[348] Report: “Annual Energy Outlook 2013 with Projections to 2040.” U.S. Energy Information Administration, April 2013. <www.osti.gov>
Page 30:
The key factors determining long-term supply, demand, and prices for petroleum and other liquids can be summarized in four broad categories: the economics of non-Organization of the Petroleum-Exporting Countries (OPEC) petroleum liquids supply; OPEC investment and production decisions; the economics of other liquids supply; and world demand for petroleum and other liquids.
Page 31:
Although the OPEC resource base is sufficient to support much higher production levels, the OPEC countries have an incentive to restrict production in order to support higher prices and sustain revenues in the long term. The Reference case assumes that OPEC will maintain a cohesive policy of limiting supply growth, rather than maximizing total annual revenues.
[349] Textbook: Energy Economics: Concepts, Issues, Markets and Governance. By Subhes C. Bhattacharyya. Springer-Verlag, 2011.
Pages 344–345:
14.3.3 Analysis of the OPEC Behaviour
There is a vast literature analyzing the OPEC [Organization of the Petroleum Exporting Countries] behaviour and strategies…. As usual in such an area, there is no consensus about how best OPEC can be described. This difficulty arises because OPEC has followed different strategies at different times to determine prices and production levels (Fattouh 2007). …
The models on OPEC behaviour can be categorized into broad groups of models: (a) cartel models such as the dominant firm model or (b) non-cartel models such as target revenue model, and the competitive model. …
14.3.3.1 Cartel Model
A cartel occurs when a group of firms or organizations enter into an agreement to control the market by fixing price and/or limiting supply through production quotas. A cartel may work in a number of ways: as if there is a single monopoly producer, or with market-sharing agreements. The objective is to reduce competition and thereby generate higher profits for the group. … [I]f the producers enter into an agreement to enforce a monopoly price (pm) in the market, they will have to agree to reduce supply… in such a way that the marginal revenue equals the marginal cost. Each member of the cartel then receives a higher price for the output but any producer will be interested to participate only if it can extract more benefits compared to a competitive environment. As long as this condition is satisfied, members will be happy to support the collusive behaviour.
[350] Textbook: Energy Economics: Concepts, Issues, Markets and Governance. By Subhes C. Bhattacharyya. Springer-Verlag, 2011.
Pages 347–348:
14.3.3.3 Limit Pricing Model
Limit pricing model examines the effect of changes in demand for cartel. Competition can arise from non-cartel producers as well as from other fuels. Producers outside the cartel affect the demand and supply. …
Two general strategies have been considered: an offensive strategy where the cartel declares the price war and another defensive strategy where the cartel conserves its resources leaving non-cartel producers freedom and space to operate in the market.
In the price war strategy, the cartel will try to drive the competitors out of the market. As the cartel benefits from cost advantage, it can forgo the market control strategy and let price drop down to the competitive level. At this point, costly producers who were benefiting from the price protection offered by the cartel will become non-competitive and will be displaced by cartel output. Hence, the cartel will see its market share increase but the price will reach the competitive market levels (see Fig. 14.23). The overall market supply will increase as well.
The cartel can adopt a defensive strategy when it faces competition from other substitutes that threaten the demand of the commodity under cartel control. Generally, such substitutes are viable when the price reaches a certain level where it becomes profitable for alternatives to appear. In such a case the cartel can decide to set the price below this threshold level where the profit for the cartel may not be maximized but it prevents entry of new substitutes. … OPEC [Organization of the Petroleum Exporting Countries] has used both the strategies to ensure its control over the oil market.
[351] Report: “2015 World Oil Outlook.” Organization of the Petroleum Exporting Countries, October 20, 2015. <www.opec.org>
Page 5:
Since the publication of the 2014 edition of the WOO [World Oil Outlook] in November last year, the most obvious market development has been the oil price collapse. While the average price of the OPEC [Organization of the Petroleum Exporting Countries] Reference Basket (ORB) during the first half of 2014 was over $100/barrel, it dropped to less than $60/b in December 2014 and has averaged close to $53/b in the first nine months of 2015.
[352] Article: “Saudi Arabia’s Oil Strategy Tears OPEC Apart.” By John Defterios. CNN Money, January 15, 2016. <money.cnn.com>
The Vienna-based group of 13 producers is now a house deeply divided, and I would suggest, facing the worst internal crisis in its 55-year history. …
OPEC [Organization of the Petroleum Exporting Countries] appears to be divided into two main camps: One has nine members—ranging from Algeria to Venezuela—who want to scrap the Saudi-led price war with non-OPEC producers.
The problem for them is that the four who want to continue the fight—Saudi Arabia, Kuwait, Qatar and the UAE [United Arab Emirates]—hold nearly all of OPEC’s spare capacity, so their votes inevitably carry more sway.
Also often overlooked is that OPEC only works by unanimous decision—making the effort to corral all members incredibly difficult at a time when their economies are hurting badly. …
Saudi Arabia opened the taps to bring prices lower, then dialed them back when oil collapsed to $40 a barrel. Prices then stabilized, but since then, the U.S. added four million barrels a day of production, which has been a global game changer.
Chris Faulkner, CEO of Dallas-based oil fracker Breitling Energy, is convinced OPEC will not reverse its stance even if U.S. output falls from a peak of 9.6 million barrels a day to an estimated 8 million by the end of 2016.
Faulkner says he constantly gets asked, “when is America going away?” in reference to shale production. The reality is the small and medium sized players are elastic and can rev back up if oil recovers and stabilizes at $50.
This is why the U.S. shale revolution, and Russia’s record output of nearly 11 million barrels a day, are creating unprecedented tension within OPEC.
[353] Article: “There’s One Place Where OPEC [Organization of the Petroleum Exporting Countries] Can’t Broker an Oil Deal: Texas.” By Javier Blas and Dan Murtaugh. Bloomberg, February 16, 2016. <www.bloomberg.com>
Slowly but surely, low prices have been bringing the U.S. shale industry to its knees. Bankruptcies have mounted while company after company slashed spending, laid off roughnecks and idled drilling rigs. As many as 74 North American producers face significant difficulties in sustaining debt, according to credit rating firm Moody’s Investors Service.
The drop in U.S. oil rigs to the lowest level since 2010 is starting to translate to the wellhead. In North Dakota, production from the prolific Bakken formation suffered its first year-on-year drop in a decade in September. In Texas, home of the Eagle Ford and Permian basins, output in November fell on an annual basis the first time since 2010.
“Saudi Arabia needs to be assured that U.S. shale wouldn’t bounce back quickly,” said Bob McNally, president of consultant Rapidan Group in Washington and a former senior oil official at the White House.
[354] Transcript: “Outlook for Global Oil Markets.” Organization of the Petroleum Exporting Countries, January 25, 2016. <www.opec.org>
Opening address by HE Abdalla S. El-Badri, OPEC Secretary General, at the Chatham House Conference: Middle East and North Africa Energy 2016, Theme: “Power, Security and Energy Markets”, Overview: Energy Markets, Political Developments and Security Challenges, 25 January 2016, London, U.K. …
The story of our industry is one of many cycles, both up and down. …
It is well documented that the cycle on this occasion has been supply-driven, with most of the supply increases in recent years coming from high-cost production. Until 2015, all of the supply growth since 2008 has come from non-OPEC [Organization of the Petroleum Exporting Countries] countries. Between 2008 and 2014, overall non-OPEC growth was more than 6 million barrels a day, while OPEC actually saw a contraction.
In fact, in 2013 and 2014, OPEC supply fell by more than 1 million barrels a day and non-OPEC grew by 3.7 million barrels a day. To put this in some context, global demand growth over these two years was 2.3 million barrels a day. …
In 2015, this dynamic changed as expansion was seen from both non-OPEC and OPEC. Non-OPEC grew by slightly over 1.2 million barrels a day, and OPEC at around 1 million barrels a day. …
These numbers are important when we look at the growth in OECD [Organization for Cooperation and Economic Development] commercial stocks. … [T]he five-year average was at its lowest level at the end of 2013. Since then the five-year average has risen dramatically, from a negative level of 85 million barrels to a surplus of more than 260 million barrels at the end of 2015. There is no doubt this has strongly impacted crude prices.
Moreover, for the same period there has also been a rise in non-OECD inventories, plus an expansion in some non-OECD strategic petroleum reserves.
It is vital the market addresses the issue of the stock overhang. As you can see from previous cycles, once this overhang starts falling then prices start to rise.
Given how this developed, it should be viewed as something OPEC and non-OPEC tackle together. Yes, OPEC provided some of the additional supply last year, but the majority of this has come from Non-OPEC countries.
It is crucial that all major producers sit down to come up with a solution to this. The market needs to see inventories come down to levels that allow prices to recover and investments to return.
[355] Article: “Saudi Arabia, Russia to Freeze Oil Output Near Record Levels.” By Mohammed Sergie, Grant Smith, and Javier Blas. Bloomberg, February 16, 2016. <www.bloomberg.com>
Saudi Arabia and Russia agreed to freeze oil output at near-record levels, the first coordinated move by the world’s two largest producers to counter a slump that has pummeled economies, markets and companies.
While the deal is preliminary and doesn’t include Iran, it’s the first significant cooperation between OPEC [Organization of the Petroleum Exporting Countries] and non-OPEC producers in 15 years and Saudi Arabia said it’s open to further action. …
The deal to fix production at January levels, which includes Qatar and Venezuela, is the “beginning of a process” that could require “other steps to stabilize and improve the market,” Saudi Oil Minister Ali Al-Naimi said in Doha Tuesday after the talks with Russian Energy Minister Alexander Novak. Qatar and Venezuela also agreed to participate, he said.
Saudi Arabia has resisted making any cuts in output to boost prices from a 12-year low, arguing that it would simply be losing market share unless its rivals also agreed to reduce supplies. Naimi’s comments may continue to feed speculation that the world’s biggest oil producers will take action to revive prices.
[356] Article: “5 Charts That Explain the Saudi Arabia–Russia Oil Price War So Far.” CNBC, April 1, 2020. <www.cnbc.com>
Two of the world’s largest oil producers—Saudi Arabia and Russia—are set to increase production dramatically this month, after an agreement between OPEC [Organization of the Petroleum Exporting Countries] and its allies to lower output expired at the end of March.
OPEC+ countries have teamed up to reduce their supply to the market since 2017, but failed to reach a deal last month.
Riyadh and Moscow then separately announced that they would flood the market with oil in April. That, against the backdrop of demand destruction due to the global coronavirus pandemic, has crushed oil prices. Crude oil benchmarks plunged to 18-year lows on Tuesday and have fallen more than 60% since the beginning of the year.
[357] Article: “From the Barrel to the Pump: The Impact of the Covid-19 Pandemic on Prices for Petroleum Products.” By Kevin M. Camp and others. U.S. Bureau of Labor Statistics Monthly Labor Review, October 2020. <doi.org>
As the Covid-19 pandemic continued to spread across the world, Saudi Arabia, the world’s second-largest oil producer behind the United States, urged fellow Organization of the Petroleum Exporting Countries (OPEC) members and Russia to cut production.5 Having formed a 2016 alliance with OPEC to control the price of oil through production cuts, Russia, the world’s third-largest oil producer, now resisted the call for further reductions in response to the pandemic. Russia sought to gain market share in anticipation that the U.S. shale industry’s profitability and output would fall in the face of lower prices.6 … By the beginning of April, OPEC had raised output by 1.7 million barrels per day, up to a level of 30.4 million barrels per day, the largest production jump since September 1990. According to Bloomberg, Saudi Arabia alone reached a record production of 12.3 million barrels per day on April 1, an output exceeding the pre-pandemic consumption levels of Japan, Germany, France, the United Kingdom, Italy, and Spain combined.8 The production boom coincided with an International Energy Agency (IEA) estimate that global demand for oil was down by almost 30 million barrels per day because of the shutdowns in response to the Covid-19 pandemic.9 With demand down, the addition of petroleum to an already saturated market led to a near-record level of 535.2 million barrels of crude petroleum stockpiles in the United States on May 1.10
[358] Calculated with data from:
a) Report: “Annual Energy Review 2011.” U.S. Energy Information Administration, Office of Energy Statistics, September 2012. <www.eia.gov>
Page 133: “Table 5.7: Petroleum Net Imports by Country of Origin, Selected Years, 1960–2011.” <www.eia.gov>
b) Dataset: “U.S. Net Imports by Country.” U.S. Energy Information Administration, Office of Energy Statistics, July 29, 2022. <www.eia.gov>
“Net Imports of Total Crude Oil and Products into the U.S. by Country 1973–2021” <www.eia.gov>
NOTES:
[359] Webpage: “Oil Prices and Outlook.” U.S. Energy Information Administration. Last updated July 2, 2019. <www.eia.gov>
Crude oil prices are determined by global supply and demand. Economic growth is one of the biggest factors affecting petroleum product—and therefore crude oil—demand. Growing economies increase demand for energy in general and especially for transporting goods and materials from producers to consumers. …
The Organization of the Petroleum Exporting Countries (OPEC) can have a significant influence on oil prices by setting production targets for its members. OPEC includes countries with some of the world's largest oil reserves. As of the end of 2018, OPEC members controlled about 72% of total world proved oil reserves, and in 2018, they accounted for 41% of total world crude oil production.
[360] Webpage: “Spot Prices.” U.S. Energy Information Administration. Accessed April 5, 2018 at <www.eia.gov>
Crude oil is traded in a global market. Prices of the many crude oil streams produced globally tend to move closely together, although there are persistent differentials between light-weight, low-sulfur (light-sweet) grades and heavier, higher-sulfur (heavy-sour) crudes that are lower in quality. …
Both crude oil and petroleum product prices can be affected by events that have the potential to disrupt the flow of oil and products to market, including geopolitical and weather-related developments. These types of events may lead to actual disruptions or create uncertainty about future supply or demand, which can lead to higher volatility in prices. The volatility of oil prices is inherently tied to the low responsiveness or “inelasticity” of both supply and demand to price changes in the short run. Both oil production capacity and the equipment that use petroleum products as their main source of energy are relatively fixed in the near-term. It takes years to develop new supply sources or vary production, and it is very hard for consumers to switch to other fuels or increase fuel efficiency in the near-term when prices rise. Under such conditions, a large price change can be necessary to re-balance physical supply and demand following a shock to the system.
Much of the world’s crude oil is located in regions that have been prone historically to political upheaval, or have had their oil production disrupted due to political events. Several major oil price shocks have occurred at the same time as supply disruptions triggered by political events, most notably the Arab Oil Embargo in 1973–74, the Iranian revolution and Iran–Iraq war in the late 1970s and early 1980s, and Persian Gulf War in 1990. More recently, disruptions to supply (or curbs on potential development of resources) from political events have been seen in Nigeria, Venezuela, Iraq, Iran, and Libya. …
Weather can also play a significant role in oil supply. Hurricanes in 2005, for example, shut down oil and natural gas production as well as refineries. As a result, petroleum product prices increased sharply as supplies to the market dropped. Severely cold weather can strain product markets as producers attempt to supply enough of the product, such as heating oil, to consumers in a short amount of time, resulting in higher prices. Other events such as refinery outages or pipeline problems can restrict the flow of oil and products, driving up prices.
However, the influence of these types of factors on oil prices tends to be relatively short lived. Once the problem subsides and oil and product flows return to normal, prices usually return to previous levels.
[361] Report: “Rising Gasoline Prices 2012.” By Neelesh Nerurkar and Robert Pirog. Congressional Research Service, March 1, 2012. <fas.org>
Pages 3–5:
Why Crude Oil Prices Increased
Figure 1 shows how rising crude prices in the first half of 2011 corresponded to higher gasoline prices.8 That increase was due at least in part to unrest in Libya and elsewhere in the Middle East and North Africa. In early 2012, developments around Iran and their implications for global oil supply have been a key factor in recent oil and gasoline price changes. Sustained demand growth in emerging economies and several other factors have also played a role.
A series of developments around Iran are likely contributing to higher crude oil prices. The EU [European Union] elected to ban Iranian oil imports by July 1, 2012. Additional U.S. and EU sanctions have made it more difficult for Iran’s customers to finance and insure Iranian crude shipments.9 Japan, South Korea and others are reducing imports of Iranian crude to avoid U.S. sanctions on foreign banks that deal with Iran’s Central Bank.10 Iran’s largest customers, China and India, have publicly rejected non-U.N. sanctions. China reduced imports from Iran in January 2012; this may have been to press for a discount on oil.11 India reportedly increased imports in January, and has negotiated to pay for some Iranian imports in Indian rupees instead of dollars.12 However, some Indian companies may be having difficulties finding shippers willing to transport crude from Iran.13 … Tightening sanctions have prompted Iranian officials to threaten closing the Strait of Hormuz, a critical thoroughfare of the global oil trade. …
Developments that reduce, reshuffle, or create risks to oil supply can contribute to higher crude oil prices. Those no longer buying Iranian crude oil are looking for supplies from elsewhere, potentially bidding up the cost of oil. Those who continue to buy crude from Iran may be able to negotiate a discount as Iran has fewer customers to choose from, but it is unclear whether the Iranians have been willing to offer such a discount, though they do appear ready to be flexible on other payment terms, such as currency. If these adjustments take place, it could reduce pressure on global oil prices. If instead Iranian oil supply is shut-in as a result of Iran not being able to find buyers, this could reduce global oil supply and create a more durable impact on global oil prices.
There are additional concerns about the adequacy of global supply. Unrest has reduced production from several smaller producers in recent months, including South Sudan, Yemen, and Syria.14 Oil production from the newly independent Republic of South Sudan has shut down due to transit fee disputes with the Republic of Sudan (North Sudan).15 Saudi Arabia, which holds most of the world’s spare oil production capacity, has stated that it stands ready to make up for supply disruptions elsewhere. However, some worry that Saudi Arabia does not have as much spare capacity as it claims (others disagree), and there is concern that if oil trade through the Strait of Hormuz were disrupted, that this additional Saudi supply would have little way to reach international markets.16
While global oil supply is slated to grow from numerous sources, including from the United States, new production takes time. In the short run, oil supply is inelastic to prices, which means supply is slow to ramp up in the face of an oil price spike, even if it makes such production profitable. There is a long lead time for investment to yield higher output. (Some investors may fear that prices may have eased by the time the new oil is actually produced.) the exception is oil produced from existing spare capacity, which is mostly held by Saudi Arabia, as mentioned earlier.
Meanwhile, global demand has reached new highs. According to EIA [U.S. Energy Information Administration], global oil consumption is expected to grow at an above trend rate, led entirely by emerging economies, despite rising oil prices.17 Some such as China continue to experience strong oil demand growth, due largely to their rapidly expanding economies. Several one-off events may also be contributing to a tighter supply demand balance: Japan is using more oil in power generation to offset nuclear outages and China may be adding crude oil to its own new strategic petroleum stockpile.18 European oil demand was boosted in February 2012 due to colder weather.19
Global developments may be difficult to understand from the U.S. perspective, where oil production is rising, demand growth remains weak, and no oil is imported from Iran. However, the market for oil is globally integrated; events anywhere can affect oil prices. The United States imported almost no oil from Libya prior to unrest there in 2011. However, when refineries elsewhere that did buy Libyan crude had to find oil from elsewhere, they bid up global oil prices. A similar effect may be taking place as customers shift away from Iranian oil. While U.S. imports have declined in recent years, the United States remains the world’s largest oil importer.20 Further, recent positive economic data for the United States point to a recovering economy,21 which also may mean recovering demand for gasoline and other oil products. Just as concerns about future supply disruptions can drive up prices, so too can concerns that oil demand will be greater than previously anticipated.
[362] Article: “On the Rise.” By Thomas Helbling. International Monetary Fund Finance & Development, March 2013. Pages 34–37. <www.imf.org>
Page 34:
A strong rebound in gas and then oil production in the United States over the past few years has taken markets and policymakers by surprise…. As a result … light sweet crude oil from the landlocked production areas in the U.S. Midwest is selling at an unusually large discount from international benchmark prices. …
The surge in production is largely the result of the new ability of producers to extract oil and gas from unconventional geological formations—so-called shale rock and tight rock or sand formations.
Page 37: “[T]he shale revolution highlights the reality that price incentives and technological change can trigger important supply responses in the oil and gas sector and that supply constraints can change over time.”
[363] Article: “5 Charts That Explain the Saudi Arabia–Russia Oil Price War So Far.” CNBC, April 1, 2020. <www.cnbc.com>
Two of the world’s largest oil producers—Saudi Arabia and Russia—are set to increase production dramatically this month, after an agreement between OPEC [Organization of the Petroleum Exporting Countries] and its allies to lower output expired at the end of March.
OPEC+ countries have teamed up to reduce their supply to the market since 2017, but failed to reach a deal last month.
Riyadh and Moscow then separately announced that they would flood the market with oil in April. That, against the backdrop of demand destruction due to the global coronavirus pandemic, has crushed oil prices. Crude oil benchmarks plunged to 18-year lows on Tuesday and have fallen more than 60% since the beginning of the year.
[364] Article: “From the Barrel to the Pump: The Impact of the Covid-19 Pandemic on Prices for Petroleum Products.” By Kevin M. Camp and others. U.S. Bureau of Labor Statistics Monthly Labor Review, October 2020. <doi.org>
By the beginning of April [2020], OPEC [Organization of the Petroleum Exporting Countries] had raised output by 1.7 million barrels per day, up to a level of 30.4 million barrels per day, the largest production jump since September 1990. … The production boom coincided with an International Energy Agency (IEA) estimate that global demand for oil was down by almost 30 million barrels per day because of the shutdowns in response to the Covid-19 pandemic.9 With demand down, the addition of petroleum to an already saturated market led to a near-record level of 535.2 million barrels of crude petroleum stockpiles in the United States on May 1.10
Prices dropped precipitously in March and April 2020. The combination of falling demand, rising supply, and diminishing storage space caused such a pronounced crude petroleum price plunge that, on April 20, crude petroleum traded at a negative price in the intraday futures market. …
The recurrence of Covid-19 cases in the United States and other countries, as well as travel restrictions, led to a slower-than-expected recovery. Both the IEA and OPEC made downward revisions to their earlier demand forecasts for 2020. For both 2020 and 2021, world petroleum demand is projected to decline from 2019 levels.
[365] Calculated with data from:
a) Report: “July 2022 Monthly Energy Review.” U.S. Energy Information Administration, Office of Energy Statistics, July 26, 2022. <www.eia.gov>
Page 159: “Table 9.1: Crude Oil Price Summary”
Page 161: “Table 9.3: Landed Costs of Crude Oil Imports From Selected Countries … On this table, ‘Total OPEC [Organization of the Petroleum Exporting Countries]’ for all years includes Algeria, Iran, Iraq, Kuwait, Libya, Nigeria, Qatar, Saudi Arabia, United Arab Emirates, and Venezuela; Angola is included in ‘Total OPEC’ 2007 forward; Gabon is included in ‘Total OPEC’ 1974–1995 and July 2016 forward; Ecuador is included in ‘Total OPEC’ 1973–1992 and 2008 forward; Indonesia is included in ‘Total OPEC’ 1973–2008 and 2016.”
b) Dataset: “CPI—All Urban Consumers (Current Series).” U.S. Department of Labor, Bureau of Labor Statistics. Accessed February 5, 2022 at <www.bls.gov>
“Series Id: CUUR0000SA0; Series Title: All Items in U.S. City Average, All Urban Consumers, Not Seasonally Adjusted; Area: U.S. City Average; Item: All Items; Base Period: 1982–84=100”
NOTE: An Excel file containing the data and calculations is available upon request.
[366] Calculated with data from:
a) Report: “July 2022 Monthly Energy Review.” U.S. Energy Information Administration, Office of Energy Statistics, July 26, 2022. <www.eia.gov>
Page 159: “Table 9.1: Crude Oil Price Summary”
Page 161: “Table 9.3: Landed Costs of Crude Oil Imports From Selected Countries … On this table, ‘Total OPEC [Organization of the Petroleum Exporting Countries]’ for all years includes Algeria, Iran, Iraq, Kuwait, Libya, Nigeria, Qatar, Saudi Arabia, United Arab Emirates, and Venezuela; Angola is included in ‘Total OPEC’ 2007 forward; Gabon is included in ‘Total OPEC’ 1974–1995 and July 2016 forward; Ecuador is included in ‘Total OPEC’ 1973–1992 and 2008 forward; Indonesia is included in ‘Total OPEC’ 1973–2008 and 2016.”
b) Dataset: “CPI—All Urban Consumers (Current Series).” U.S. Department of Labor, Bureau of Labor Statistics. Accessed February 5, 2022 at <www.bls.gov>
“Series Id: CUUR0000SA0; Series Title: All Items in U.S. City Average, All Urban Consumers, Not Seasonally Adjusted; Area: U.S. City Average; Item: All Items; Base Period: 1982–84=100”
NOTE: An Excel file containing the data and calculations is available upon request.
[367] Webpage: “Factors Affecting Gasoline Prices.” U.S. Energy Information Administration. Last updated March 15, 2022. <www.eia.gov>
“What do we pay for per gallon of retail regular grade gasoline … 2021 Average Retail Price: $3.01/gallon … refining costs and profits [=] 14.4% … distribution and marketing [=] 15.6% … federal and state taxes [=] 16.4% … crude oil [=] 53.6%”
[368] Report: “Annual Energy Review 2011.” U.S. Energy Information Administration, Office of Energy Statistics, September 2012. <www.eia.gov>
Page 352:
Crude Oil: A mixture of hydrocarbons that exists in liquid phase in natural underground reservoirs and remains liquid at atmospheric pressure after passing through surface separating facilities. Depending upon the characteristics of the crude stream, it may also include: 1) small amounts of hydrocarbons that exist in gaseous phase in natural underground reservoirs but are liquid at atmospheric pressure after being recovered from oil well (casinghead) gas in lease separators and are subsequently commingled with the crude stream without being separately measured. Lease condensate recovered as a liquid from natural gas wells in lease or field separation facilities and later mixed into the crude stream is also included; 2) small amounts of nonhydrocarbons produced with the oil, such as sulfur and various metals; and 3) drip gases, and liquid hydrocarbons produced from tar sands, oil sands, gilsonite, and oil shale. Liquids produced at natural gas processing plants are excluded.
[369] Report: “Information on Shale Resources, Development, and Environmental and Public Health Risks.” U.S. Government Accountability Office, September 5, 2012. <www.gao.gov>
Page 5: “Oil and natural gas are found in a variety of geologic formations. Conventional oil and natural gas are found in deep, porous rock or reservoirs and can flow under natural pressure to the surface after drilling.”
[370] Article: “On the Rise.” By Thomas Helbling. International Monetary Fund Finance & Development, March 2013. Pages 34–37. <www.imf.org>
Page 35: “Oil and gas have long been produced from what are now called ‘conventional sources’: wells are drilled into the earth’s surface, and pressure that is naturally present in the field—possibly with help from pumps—is used to bring the fuel to the surface.”
[371] Report: “Information on Shale Resources, Development, and Environmental and Public Health Risks.” U.S. Government Accountability Office, September 5, 2012. <www.gao.gov>
Page 2: “[F]or the purposes of this report, we use the term ‘shale oil’ to refer to oil from shale and other tight formations, which is recoverable by hydraulic fracturing and horizontal drilling techniques and is described by others as ‘tight oil.’ ”
NOTE: See the difference in the definitions between this footnote and the one below.
[372] Report: “Technically Recoverable Shale Oil and Shale Gas Resources: An Assessment of 137 Shale Formations in 41 Countries Outside the United States.” U.S. Energy Information Administration, June 10, 2013. <www.eia.gov>
Executive Summary (<www.eia.gov>):
Although the terms shale oil2 and tight oil are often used interchangeably in public discourse, shale formations are only a subset of all low permeability tight formations, which include sandstones and carbonates, as well as shales, as sources of tight oil production. Within the United States, the oil and natural gas industry typically refers to tight oil production rather than shale oil production, because it is a more encompassing and accurate term with respect to the geologic formations producing oil at any particular well. EIA [U.S. Energy Information Administration] has adopted this convention, and develops estimates of tight oil production and resources in the United States that include, but are not limited to, production from shale formations.
[373] Report: “Annual Energy Outlook 2013 with Projections to 2040.” U.S. Energy Information Administration, April 2013. <www.osti.gov>
Page 82:
The term tight oil does not have a specific technical, scientific, or geologic definition. Tight oil is an industry convention that generally refers to oil produced from very-low-permeability138 shale, sandstone, and carbonate formations. Some of these geologic formations have been producing low volumes of oil for many decades in limited portions of the formation.
[374] Report: “Information on Shale Resources, Development, and Environmental and Public Health Risks.” U.S. Government Accountability Office, September 5, 2012. <www.gao.gov>
Page 1: “Shale is a sedimentary rock that is predominantly composed of consolidated clay-sized particles.”
Pages 5–6:
In contrast to the free-flowing resources found in conventional formations, the low permeability of some formations, including shale, means that oil and gas trapped in the formation cannot move easily within the rock. … [T]o extract shale oil and gas from the rock, fluids and proppants (usually sand or ceramic beads used to hold fractures open in the formation) are injected under high pressure to create and maintain fractures to increase permeability, thus allowing oil or gas to be extracted. Other formations, such as coalbed methane formations and tight sandstone formations,12 may also require stimulation to allow oil or gas to be extracted.13…
The process to develop shale oil and gas is similar to the process for conventional onshore oil and gas, but shale formations may rely on the use of horizontal drilling and hydraulic fracturing—which may or may not be used on conventional wells.
12 Conventional sandstone has well-connected pores, but tight sandstone has irregularly distributed and poorly connected pores. Due to this low connectivity or permeability, gas trapped within tight sandstone is not easily produced.
13 For coalbed methane formations, the reduction in pressure needed to extract gas is achieved through dewatering. As water is pumped out of the coal seams, reservoir pressure decreases, allowing the natural gas to release (desorb) from the surface of the coal and flow through natural fracture networks into the well.
[375] Article: “On the Rise.” By Thomas Helbling. International Monetary Fund Finance & Development, March 2013. Pages 34–37. <www.imf.org>
Page 35:
Other geological structures in the United States—shale rock and tight sand formations—have long been known to contain oil and gas. But the fuels are trapped in these formations and cannot be extracted in the same way as from conventional sources. Instead, producers use a combination of horizontal drilling and hydraulic fracturing, or “fracking,” during which fluids are injected under high pressure to break up the formations and release trapped fossil fuels.
[376] Report: “Technically Recoverable Shale Oil and Shale Gas Resources: An Assessment of 137 Shale Formations in 41 Countries Outside the United States.” U.S. Energy Information Administration, June 10, 2013. <www.eia.gov>
Executive Summary (<www.eia.gov>):
[T]he production of shale oil requires that at least 15 percent to 25 percent of the pore fluids be in the form of natural gas so that there is sufficient gas-expansion to drive the oil to the well-bore. In the absence of natural gas to provide reservoir drive, shale oil production is problematic and potentially uneconomic at a low production rate.
[377] Webpage: “About Tar Sands.” Oil Shale and Tar Sands Programmatic Environmental Impact Statement Information Center, U.S. Department of the Interior, Bureau of Land Management. Accessed August 29, 2013 at <www.anl.gov>
Tar sands (also referred to as oil sands) are a combination of clay, sand, water, and bitumen, a heavy black viscous oil. Tar sands can be mined and processed to extract the oil-rich bitumen, which is then refined into oil. The bitumen in tar sands cannot be pumped from the ground in its natural state; instead tar sand deposits are mined, usually using strip mining or open pit techniques, or the oil is extracted by underground heating with additional upgrading.
Tar sands are mined and processed to generate oil similar to oil pumped from conventional oil wells, but extracting oil from tar sands is more complex than conventional oil recovery. Oil sands recovery processes include extraction and separation systems to separate the bitumen from the clay, sand, and water that make up the tar sands. Bitumen also requires additional upgrading before it can be refined. Because it is so viscous (thick), it also requires dilution with lighter hydrocarbons to make it transportable by pipelines.
Much of the world’s oil (more than 2 trillion barrels) is in the form of tar sands, although it is not all recoverable. While tar sands are found in many places worldwide, the largest deposits in the world are found in Canada (Alberta) and Venezuela, and much of the rest is found in various countries in the Middle East. In the United States, tar sands resources are primarily concentrated in Eastern Utah, mostly on public lands. The in-place tar sands oil resources in Utah are estimated at 12 to 19 billion barrels.
[378] Webpage: “Glossary.” U.S. Energy Information Administration. Accessed July 18, 2013 at <www.eia.gov>
“Bitumen: A naturally occurring viscous mixture, mainly of hydrocarbons heavier than pentane, that may contain sulphur compounds and that, in its natural occurring viscous state, is not recoverable at a commercial rate through a well.”
[379] Report: “Technically Recoverable Shale Oil and Shale Gas Resources: An Assessment of 137 Shale Formations in 41 Countries Outside the United States.” U.S. Energy Information Administration, June 10, 2013. <www.eia.gov>
Executive Summary (<www.eia.gov>): “[Shale oil] is not to be confused with oil shale, which is a sedimentary rock with solid organic content (kerogen) but no resident oil and natural gas fluids.”
[380] Report: “Information on Shale Resources, Development, and Environmental and Public Health Risks.” U.S. Government Accountability Office, September 5, 2012. <www.gao.gov>
Page 26: “Oil shale is a sedimentary rock containing solid organic material that converts into a type of crude oil only when heated.”
Page 5: “[T]he hydrocarbon trapped in the [oil] shale will not reach a liquid form without first being heated to very high temperatures—ranging from about 650 to 1,000 degrees Fahrenheit—in a process known as retorting.”
[381] Webpage: “About Oil Shale.” Oil Shale and Tar Sands Programmatic Environmental Impact Statement Information Center, U.S. Department of the Interior, Bureau of Land Management. Accessed August 29, 2013 at <www.anl.gov>
Oil shale can be mined and processed to generate oil similar to oil pumped from conventional oil wells; however, extracting oil from oil shale is more complex than conventional oil recovery and currently is more expensive. The oil substances in oil shale are solid and cannot be pumped directly out of the ground. The oil shale must first be mined and then heated to a high temperature (a process called retorting); the resultant liquid must then be separated and collected. An alternative but currently experimental process referred to as in situ retorting involves heating the oil shale while it is still underground, and then pumping the resulting liquid to the surface. …
While oil shale has been used as fuel and as a source of oil in small quantities for many years, few countries currently produce oil from oil shale on a significant commercial level. Many countries do not have significant oil shale resources, but in those countries that do have significant oil shale resources, the oil shale industry has not developed because historically, the cost of oil derived from oil shale has been significantly higher than conventional pumped oil. The lack of commercial viability of oil shale-derived oil has in turn inhibited the development of better technologies that might reduce its cost.
Relatively high prices for conventional oil in the 1970s and 1980s stimulated interest and some development of better oil shale technology, but oil prices eventually fell, and major research and development activities largely ceased. More recently, prices for crude oil have again risen to levels that may make oil shale-based oil production commercially viable, and both governments and industry are interested in pursuing the development of oil shale as an alternative to conventional oil. …
Oil shale can be mined using one of two methods: underground mining using the room-and-pillar method or surface mining. After mining, the oil shale is transported to a facility for retorting, a heating process that separates the oil fractions of oil shale from the mineral fraction. The vessel in which retorting takes place is known as a retort. After retorting, the oil must be upgraded by further processing before it can be sent to a refinery, and the spent shale must be disposed of. Spent shale may be disposed of in surface impoundments, or as fill in graded areas; it may also be disposed of in previously mined areas. Eventually, the mined land is reclaimed. Both mining and processing of oil shale involve a variety of environmental impacts, such as global warming and greenhouse gas emissions, disturbance of mined land, disposal of spent shale, use of water resources, and impacts on air and water quality. The development of a commercial oil shale industry in the United States would also have significant social and economic impacts on local communities. Other impediments to development of the oil shale industry in the United States include the relatively high cost of producing oil from oil shale (currently greater than $60 per barrel), and the lack of regulations to lease oil shale.
[382] Report: “Oil Shale and Nahcolite Resources of the Piceance Basin, Colorado.” U.S. Department of the Interior, U.S. Geological Survey, Oil Shale Assessment Team, 2010. <pubs.usgs.gov>
Chapter 1: “An Assessment of In-Place Oil Shale Resources in the Green River Formation, Piceance Basin, Colorado.” By Ronald C. Johnson and others. <pubs.usgs.gov>
Page 5: “This assessment does not attempt to estimate the amount of oil that is economically recoverable, largely because there has not been an economic method developed to recover oil from Green River oil shale.”
[383] Report: “Drilling Sideways—A Review of Horizontal Well Technology and Its Domestic Application.” U.S. Energy Information Administration, April 1993. <www.eia.gov>
Page viii:
The technical objective of horizontal drilling is to expose significantly more reservoir rock to the well bore surface than can be achieved via drilling of a conventional vertical well. The desire to achieve this objective stems from the intended achievement of other, more important technical objectives that relate to specific physical characteristics of the target reservoir, and that provide economic benefits. Examples of these technical objectives are the need to intersect multiple fracture systems within a reservoir and the need to avoid unnecessarily premature water or gas intrusion that would interfere with oil production. In both examples, an economic benefit of horizontal drilling success is increased productivity of the reservoir. In the latter example, prolongation of the reservoir’s commercial life is also an economic benefit.
… Significant successes include many horizontal wells drilled into the fractured Austin Chalk of Texas’ Giddings Field, which have produced at 2.5 to 7 times the rate of vertical wells, wells drilled into North Dakota’s Bakken Shale, from which horizontal oil production increased from nothing in 1986 to account for 10 percent of the State’s 1991 production, and wells drilled into Alaska’s North Slope fields.
Page 1:
A widely accepted definition of what qualifies as horizontal drilling has yet to be written. The following combines the essential components of two previously published definitions:1
Horizontal drilling is the process of drilling and completing, for production, a well that begins as a vertical or inclined linear bore which extends from the surface to a subsurface location just above the target oil or gas reservoir called the “kickoff point,” then bears off on an arc to intersect the reservoir at the “entry point,” and, thereafter, continues at a near-horizontal attitude tangent to the arc, to substantially or entirely remain within the reservoir until the desired bottom hole location is reached.
Most oil and gas reservoirs are much more extensive in their horizontal (areal) dimensions than in their vertical (thickness) dimension. By drilling that portion of a well which intersects such a reservoir parallel to its plane of more extensive dimension, horizontal drilling’s immediate technical objective is achieved. That objective is to expose significantly more reservoir rock to the wellbore surface than would be the case with a conventional vertical well penetrating the reservoir perpendicular to its plane of more extensive dimension (Figure 1). The desire to attain this immediate technical objective is almost always motivated by the intended achievement of more important objectives (such as avoidance of water production) related to specific physical characteristics of the target reservoir.
Pages 4–5:
Even when drilling technique has been optimized for a target, the expected financial benefits of horizontal drilling must at least offset the increased well costs before such a project will be undertaken. In successful horizontal drilling applications, the “offset or better” happens due to the occurrence of one or more of a number of factors.
First, operators often are able to develop a reservoir with a sufficiently smaller number of horizontal wells, since each well can drain a larger rock volume about its bore than a vertical well could. When this is the case, per well proved reserves are higher than for a vertical well. An added advantage relative to the environmental costs or land use problems that may pertain in some situations is that the aggregate surface “footprint” of an oil or gas recovery operation can be reduced by use of horizontal wells.
Second, a horizontal well may produce at rates several times greater than a vertical well, due to the increased wellbore surface area within the producing interval. For example, in the Austin Chalk reservoir of Texas’ Giddings Field, under equal pressure conditions, horizontal completions of 500 to 2,200 foot HD [horizontal displacement] produce at initial rates 2½ to 7 times higher than vertical completions.7 Chairman Robert Hauptfuhrer of Oryx Energy Co. noted that “Our costs in the [Austin] chalk now are 50 percent more than a vertical well, but we have three to five or more times the daily production and reserves than a vertical well.”8 A faster producing rate translates financially to a higher rate of return on the horizontal project than would be achieved by a vertical project.
Third, use of a horizontal well may preclude or significantly delay the onset of production problems (interferences) that engender low production rates, low recovery efficiencies, and/or premature well abandonment, reducing or even eliminating, as a result of their occurrence, return on investment and total return.
Page 7: “Early production well drilling using horizontal techniques was subsequently undertaken by British Petroleum in Alaska’s Prudhoe Bay Field, in a successful attempt to minimize unwanted water and gas intrusions into the Sadlerochit reservoir.”
Page 13:
As noted previously, horizontal drilling is usually undertaken to achieve important technical objectives related to specific characteristics of a target reservoir. These characteristics typically involve:
• the reservoir rock’s permeability, which is its capacity to conduct fluid flow through the interconnections of its pore spaces (termed its “matrix permeability”), or through fractures (its “fracture permeability”), and/or
• the expected propensity of the reservoir to develop water or gas influxes deleterious to production, either from other parts of the reservoir or from adjacent rocks, as production takes place (an event called “coning”).
Due to its higher cost, horizontal drilling is currently restricted to situations where these characteristics indicate that vertical wells would not be as financially successful. In an oil reservoir which has good matrix permeability in all directions, no gas cap and no water drive, drilling of horizontal wells would likely be financial folly, since a vertical well program could achieve a similar recovery of oil at lower cost. But when low matrix permeability exists in the reservoir rock (especially in the horizontal plane), or when coning of gas or water can be expected to interfere with full recovery, horizontal drilling becomes a financially viable or even preferred current option. Most existing domestic applications of horizontal drilling reflect this “philosophy of application.”
[384] Report: “Technically Recoverable Shale Oil and Shale Gas Resources: An Assessment of 137 Shale Formations in 41 Countries Outside the United States.” U.S. Energy Information Administration, June 10, 2013. <www.eia.gov>
Executive Summary (<www.eia.gov>): “One reason why 3,000-to-5,000-foot horizontal laterals are employed in the United States is to increase the likelihood that a portion of the horizontal lateral will be sufficiently productive to make the well profitable.”
[385] Webpage: “Development of Radar Navigation and Radio Data Transmission for Microhole Coiled Tubing Bottomhole Assemblies.” U.S. Department of Energy, National Energy Technology Laboratory. Accessed April 5, 2018 at <www.netl.doe.gov>
[386] Report: “Drilling Sideways—A Review of Horizontal Well Technology and Its Domestic Application.” U.S. Energy Information Administration, April 1993. <www.eia.gov>
Page vii: “Horizontal drilling technology achieved commercial viability during the late 1980’s. Its successful employment, particularly in the Bakken Shale of North Dakota and the Austin Chalk of Texas, has encouraged testing of it in many domestic geographic regions and geologic situations.”
Pages 7–8:
The modern concept of non-straight line, relatively short-radius drilling, dates back at least to September 8, 1891, when the first U.S. patent for the use of flexible shafts to rotate drilling bits was issued to John Smalley Campbell (Patent Number 459,152). While the prime application described in the patent was dental, the patent also carefully covered use of his flexible shafts at much larger and heavier physical scales “… such, for example, as those used in engineer’s shops for drilling holes in boiler-plates or other like heavy work. The flexible shafts or cables ordinarily employed are not capable of being bent to and working at a curve of very short radius …”
The first recorded true horizontal oil well, drilled near Texon, Texas, was completed in 1929.9 Another was drilled in 1944 in the Franklin Heavy Oil Field, Venango County, Pennsylvania, at a depth of 500 feet.10 China tried horizontal drilling as early as 1957, and later the Soviet Union tried the technique.11 Generally, however, little practical application occurred until the early 1980’s, by which time the advent of improved downhole drilling motors and the invention of other necessary supporting equipment, materials, and technologies, particularly downhole telemetry equipment, had brought some kinds of applications within the imaginable realm of commercial viability.
Early Commercial Horizontal Wells
Tests, which indicated that commercial horizontal drilling success could be achieved in more than isolated instances, were carried out between 1980 and 1983 by the French firm Elf Aquitaine in four horizontal wells drilled in three European fields: the Lacq Superieur Oil Field (2 wells) and the Castera Lou Oil Field, both located in southwestern France, and the Rospo Mare Oil Field, located offshore Italy in the Mediterranean Sea. In the latter instance, output was very considerably enhanced.12 Early production well drilling using horizontal techniques was subsequently undertaken by British Petroleum in Alaska’s Prudhoe Bay Field, in a successful attempt to minimize unwanted water and gas intrusions into the Sadlerochit reservoir.13
The Recent Growth of Commercial Horizontal Drilling Taking a cue from these initial successes, horizontal drilling has been undertaken with increasing frequency by more and more operators. They and the drilling and service firms that support them have expanded application of the technology to many additional types of geological and reservoir engineering factor-related drilling objectives. Domestic horizontal wells have now been planned and completed in at least 57 counties or offshore areas located in or off 20 States.
Horizontal drilling in the United States has thus far been focused almost entirely on crude oil applications. In 1990, worldwide, more than 1,000 horizontal wells were drilled. Some 850 of them were targeted at Texas’ Upper Cretaceous Austin Chalk Formation alone.
Page viii:
An offset to the benefits provided by successful horizontal drilling is its higher cost. But the average cost is going down. By 1990, the cost premium associated with horizontal wells had shrunk from the 300-percent level experienced with some early experimental wells to an annual average of 17 percent. Learning curves are apparent, as indicated by incurred costs, as new companies try horizontal drilling and as companies move to new target reservoirs. It is probable that the cost premium associated with horizontal drilling will continue to decline, leading to its increased use.
[387] Article: “On the Rise.” By Thomas Helbling. International Monetary Fund Finance & Development, March 2013. Pages 34–37. <www.imf.org>
Page 35: “[During fracking] fluids are injected under high pressure to break up the formations and release trapped fossil fuels.”
[388] Report: “Information on Shale Resources, Development, and Environmental and Public Health Risks.” U.S. Government Accountability Office, September 5, 2012. <www.gao.gov>
Page 1: “[Hydraulic fracturing is] a process that injects a combination of water, sand, and chemical additives under high pressure to create and maintain fractures in underground rock formations that allow oil and natural gas to flow….”
Page 5: “[T]o extract shale oil and gas from the rock, fluids and proppants (usually sand or ceramic beads used to hold fractures open in the formation) are injected under high pressure to create and maintain fractures to increase permeability, thus allowing oil or gas to be extracted.”
Pages 9–13:
The next stage in the development process is stimulation of the shale formation using hydraulic fracturing. Before operators or service companies perform a hydraulic fracture treatment of a well, a series of tests may be conducted to ensure that the well, wellhead equipment, and fracturing equipment can safely withstand the high pressures associated with the fracturing process. Minimum requirements for equipment pressure testing can be determined by state regulatory agencies for operations on state or private lands. In addition, fracturing is conducted below the surface of the earth, sometimes several thousand feet below, and can only be indirectly observed. Therefore, operators may collect subsurface data—such as information on rock stresses20 and natural fault structures—needed to develop models that predict fracture height, length, and orientation prior to drilling a well. The purpose of modeling is to design a fracturing treatment that optimizes the location and size of induced fractures and maximizes oil or gas production.
To prepare a well to be hydraulically fractured, a perforating tool may be inserted into the casing and used to create holes in the casing and cement. Through these holes, fracturing fluid—that is injected under high pressures—can flow into the shale (fig. 2 shows a used perforating tool).
Fracturing fluids are tailored to site specific conditions, such as shale thickness, stress, compressibility, and rigidity. As such, the chemical additives used in a fracture treatment vary. Operators may use computer models that consider local conditions to design site-specific hydraulic fluids. The water, chemicals, and proppant used in fracturing fluid are typically stored on-site in separate tanks and blended just before they are injected into the well. Figure 3 provides greater detail about some chemicals commonly used in fracturing.
Figure 3: Examples of Common Ingredients Found in Fracturing Fluid
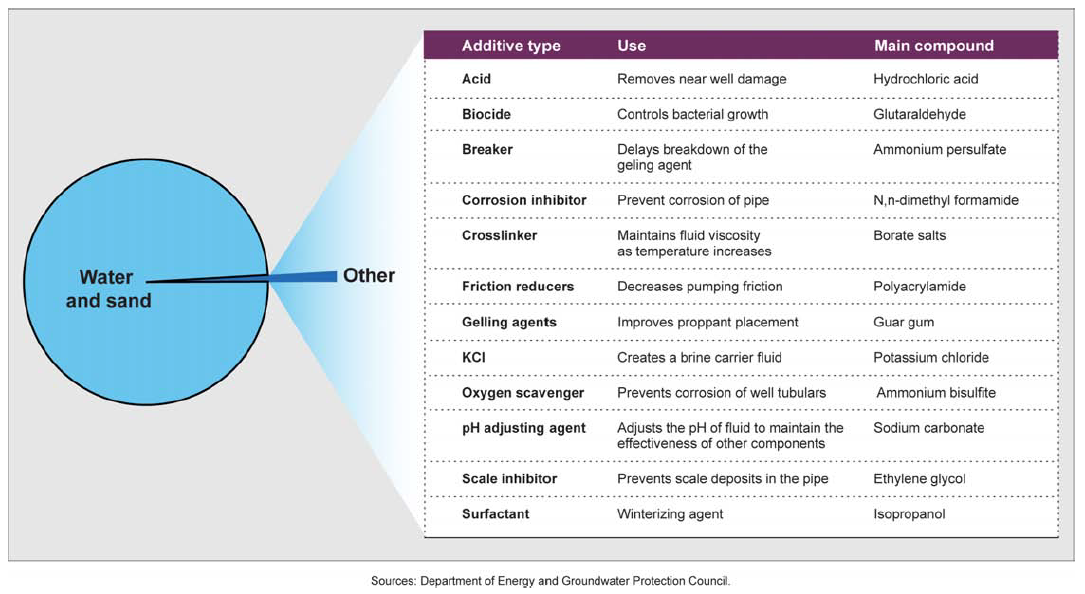
The operator pumps the fracturing fluid into the wellbore at pressures high enough to force the fluid through the perforations into the surrounding formation—which can be shale, coalbeds, or tight sandstone—expanding existing fractures and creating new ones in the process. After the fractures are created, the operator reduces the pressure. The proppant stays in the formation to hold open the fractures and allow the release of oil and gas. Some of the fracturing fluid that was injected into the well will return to the surface (commonly referred to as flowback) along with water that occurs naturally in the oil- or gas-bearing formation—collectively referred to as produced water. The produced water is brought to the surface and collected by the operator, where it can be stored on-site in impoundments, injected into underground wells, transported to a wastewater treatment plant, or reused by the operator in other ways.21 Given the length of horizontal wells, hydraulic fracturing is often conducted in stages, where each stage focuses on a limited linear section and may be repeated numerous times.
Once a well is producing oil or natural gas, equipment and temporary infrastructure associated with drilling and hydraulic fracturing operations is no longer needed and may be removed, leaving only the parts of the infrastructure required to collect and process the oil or gas and ongoing produced water. Operators may begin to reclaim the part of the site that will not be used by restoring the area to predevelopment conditions. Throughout the producing life of an oil or gas well, the operator may find it necessary to periodically restimulate the flow of oil or gas by repeating the hydraulic fracturing process. The frequency of such activity depends on the characteristics of the geologic formation and the economics of the individual well. If the hydraulic fracturing process is repeated, the site and surrounding area will be further affected by the required infrastructure, truck transport, and other activity associated with this process.
20 Stresses in the formation generally define a maximum and minimum stress direction that influence the direction a fracture will grow.
21 Underground injection is the predominant practice for disposing of produced water. In addition to underground injection, a limited amount of produced water is managed by discharging it to surface water, storing it in surface impoundments, and reusing it for irrigation or hydraulic fracturing.
[389] Report: “Technically Recoverable Shale Oil and Shale Gas Resources: An Assessment of 137 Shale Formations in 41 Countries Outside the United States.” U.S. Energy Information Administration, June 10, 2013. <www.eia.gov>
Executive Summary (<www.eia.gov>): “[T]he production of shale oil requires that at least 15 percent to 25 percent of the pore fluids be in the form of natural gas so that there is sufficient gas-expansion to drive the oil to the well-bore. In the absence of natural gas to provide reservoir drive, shale oil production is problematic and potentially uneconomic at a low production rate.”
[390] Report: “Information on Shale Resources, Development, and Environmental and Public Health Risks.” U.S. Government Accountability Office, September 5, 2012. <www.gao.gov>
Page 7:
1940s Hydraulic fracturing first introduced to the petroleum industry.
1947 The first experimental hydraulic fracturing treatment conducted in Grant County, Kansas.
1949 The first commercial hydraulic fracturing treatment conducted in Stephens County, Oklahoma.
1950s Hydraulic fracturing becomes a commercially accepted process.
1955 More than 100,000 individual hydraulic fracturing treatments performed.
[391] Webpage: “Factors Affecting Gasoline Prices.” U.S. Energy Information Administration. Last updated March 6, 2018. <www.eia.gov>
In recent years, the world’s appetite for gasoline and diesel fuel grew so quickly that suppliers of these fuels had a difficult time keeping up with demand. This demand growth is a key reason why prices of both crude oil and gasoline reached record levels in mid-2008. …
… Crude oil prices are determined by both supply and demand factors. On the demand side of the equation, world economic growth is the biggest factor.
[392] Report: “Rising Gasoline Prices 2012.” By Neelesh Nerurkar and Robert Pirog. Congressional Research Service, March 1, 2012. <fas.org>
Page 4: “Meanwhile, global demand has reached new highs. According to EIA [Energy Information Administration], global oil consumption is expected to grow at an above trend rate, led entirely by emerging economies, despite rising oil prices.17 Some such as China continue to experience strong oil demand growth, due largely to their rapidly expanding economies.”
[393] Article: “U.S. Oil Notches Record Growth.” By Keith Johnson and Russell Gold. Wall Street Journal, June 12, 2013. <online.wsj.com>
“While the U.S. gusher tamped down the effect of supply problems elsewhere, BP [British Petroleum] noted average oil prices remained at record-high levels last year. The prices reflect relentless demand for oil from developing countries, including China, India and most of the Middle East.”
[394] Report: “Information on Shale Resources, Development, and Environmental and Public Health Risks.” U.S. Government Accountability Office, September 5, 2012. <www.gao.gov>
Page 1:
For decades, the United States has relied on imports of oil and natural gas to meet domestic needs. As recently as 2007, the expectation was that the nation would increasingly rely on imports of natural gas to meet its growing demand. However, recent improvements in technology have allowed companies that develop petroleum resources to extract oil and natural gas from shale formations,1 known as “shale oil” and “shale gas,” respectively, which were previously inaccessible because traditional techniques did not yield sufficient amounts for economically viable production.
Page 6:
The process to develop shale oil and gas is similar to the process for conventional onshore oil and gas, but shale formations may rely on the use of horizontal drilling and hydraulic fracturing—which may or may not be used on conventional wells. Horizontal drilling and hydraulic fracturing are not new technologies, as seen in figure 1, but advancements, refinements, and new uses of these technologies have greatly expanded oil and gas operators’ abilities to use these processes to economically develop shale oil and gas resources. For example, the use of multistage hydraulic fracturing within a horizontal well has only been widely used in the last decade.15
15 Hydraulic fracturing is often conducted in stages. Each stage focuses on a limited linear section and may be repeated numerous times.
Page 7: “Late 1970s and early 1980s Shale formations, such as the Barnett in Texas and Marcellus in Pennsylvania, are known but believed to have essentially zero permeability and thus are not considered economic.”
Page 26: “Annual shale oil production in the United States increased more than fivefold, from about 39 million barrels in 2007 to about 217 million barrels in 2011…. This is because new technologies allowed more oil to be produced economically, and because of recent increases in the price for liquid petroleum that have led to increased investment in shale oil development.”
[395] Article: “On the Rise.” By Thomas Helbling. International Monetary Fund Finance & Development, March 2013. Pages 34–37. <www.imf.org>
Page 34: “The sudden takeoff in the production of oil and gas from unconventional sources in recent years is another case in which high prices and new technologies combined to turn a previously uneconomical resource into an economically viable one.”
Page 35:
Both technologies [horizontal drilling and hydraulic fracturing] have been around for more than a half century, but until recently, using them cost more than the price of crude oil and natural gas.
This changed when prices began to rise sharply in recent years. Producers were able to profitably extract oil and gas from these [shale] formations. At the same time, improvements in horizontal drilling and fracking technologies reduced the cost of using them.
[396] Report: “Annual Energy Outlook 2013 with Projections to 2040.” U.S. Energy Information Administration, April 2013. <www.osti.gov>
Page 2:
Crude oil production has increased since 2008, reversing a decline that began in 1986. From 5.0 million barrels per day in 2008, U.S. crude oil production increased to 6.5 million barrels per day in 2012. Improvements in advanced crude oil production technologies continues to lift domestic supply, with domestic production of crude oil increasing in the Reference case before declining gradually beginning in 2020 for the remainder of the projection period. The projected growth results largely from a significant increase in onshore crude oil production, particularly from shale and other tight formations, which has been spurred by technological advances and relatively high oil prices. Tight oil development is still at an early stage, and the outlook is highly uncertain. In some of the AEO2013 [Annual Energy Outlook] alternative cases, tight oil production and total U.S. crude oil production are significantly above their levels in the Reference case.
Page 33: “A key contributing factor to the recent decline in net import dependence has been the rapid growth of U.S. oil production from tight onshore formations, which has followed closely after the rapid growth of natural gas production from similar types of resources.”
[397] Calculated with data from the report: “July 2022 Monthly Energy Review.” U.S. Energy Information Administration, Office of Energy Statistics, July 26, 2022. <www.eia.gov>
Page 61: “Table 3.1: Petroleum Overview (Thousand Barrels per Day)”
NOTE: An Excel file containing the data and calculations is available upon request.
[398] Article: “U.S. Crude Oil Production Grew 11% in 2019, Surpassing 12 Million Barrels Per Day.” U.S. Energy Information Administration, March 2, 2020. <www.eia.gov>
Annual U.S. crude oil production reached another record level at 12.23 million barrels per day (b/d) in 2019, 1.24 million b/d, or 11%, more than 2018 levels. The 2019 growth rate was down from a 17% growth rate in 2018. In November 2019, monthly U.S. crude oil production averaged 12.86 million b/d, the most monthly crude oil production in U.S. history, according to the U.S. Energy Information Administration’s (EIA) Petroleum Supply Monthly. U.S. crude oil production has increased significantly during the past 10 years, driven mainly by production from tight rock formations developed using horizontal drilling and hydraulic fracturing to extract hydrocarbons.
[399] Article: “Hydraulic Fracturing Accounts for About Half of Current U.S. Crude Oil Production.” U.S. Energy Information Administration, March 15, 2016. <www.eia.gov>
Even though hydraulic fracturing has been in use for more than six decades, it has only recently been used to produce a significant portion of crude oil in the United States. This technique, often used in combination with horizontal drilling, has allowed the United States to increase its oil production faster than at any time in its history. Based on the most recent available data from states, EIA [U.S. Energy Information Administration] estimates that oil production from hydraulically fractured wells now makes up about half of total U.S. crude oil production.
[400] Report: “Annual Energy Outlook 2014 with Projections to 2040.” U.S. Energy Information Administration, April 2014. <www.eia.gov>
Page ES-2:
Key results highlighted in the AEO2014 [Annual Energy Outlook] Reference and alternative cases include:
• Growing domestic production of natural gas and oil continues to reshape the U.S. energy economy, largely as a result of rising production from tight formations, but the effect could vary substantially depending on expectations about resources and technology. …
Growth in crude oil production from tight oil and shale formations supported by identification of resources and technology advances have supported a nearly fourfold increase in tight oil production from 2008, when it accounted for 12% of total U.S. crude oil production, to 2012, when it accounted for 35% of total U.S. production. …
In the Reference case, tight oil production begins to slow after 2021, contributing to a decline in total U.S. oil production through 2040. However, tight oil development is still at an early stage, and the outlook is uncertain. Changes in U.S. crude oil production depend largely on the degree to which technological advances allow production to occur in potentially high-yielding tight and shale formations.
[401] Report: “Technically Recoverable Shale Oil and Shale Gas Resources: An Assessment of 137 Shale Formations in 41 Countries Outside the United States.” U.S. Energy Information Administration, June 10, 2013. <www.eia.gov>
Executive Summary (<www.eia.gov>):
Because they have proven to be quickly producible in large volumes at a relatively low cost, tight oil and shale gas resources have revolutionized U.S. oil and natural gas production, providing 29 percent of total U.S. crude oil production and 40 percent of total U.S. natural gas production in 2012. …
… The increase in U.S. crude oil production in 2012 of 847,000 barrels per day over 2011 was largely attributable to increased production from shales and other tight resources. …
… For example, U.S. crude oil production rose by 847,000 barrels per day in 2012, compared with 2011, by far the largest growth in crude oil production in any country. Production from shales and other tight plays accounted for nearly all of this increase, reflecting both the availability of recoverable resources and favorable above-the-ground conditions for production. …
The use of horizontal drilling in conjunction with hydraulic fracturing has greatly expanded the ability of producers to profitably produce oil and natural gas from low permeability geologic formations, particularly shale formations.
[402] Article: “On the Rise.” By Thomas Helbling. International Monetary Fund Finance & Development, March 2013. Pages 34–37. <www.imf.org>
Page 34: “The surge in production is largely the result of the new ability of producers to extract oil and gas from unconventional geological formations—so-called shale rock and tight rock or sand formations. The revolution in production occurred first in natural gas and more recently in oil.”
[403] Report: “Information on Shale Resources, Development, and Environmental and Public Health Risks.” U.S. Government Accountability Office, September 5, 2012. <www.gao.gov>
Page 2: “Early drilling activity in shale formations was centered primarily on natural gas, but with the falling price of natural gas companies switched their focus to oil and natural gas liquids, which are a more valuable product.”
[404] Calculated with data from:
a) Webpage: “How Much Shale (Tight) Oil Is Produced in the United States?” U.S. Energy Information Administration. Last updated March 7, 2022. <www.eia.gov>
“The U.S. Energy Information Administration (EIA) estimates that in 2021, about 2.64 billion barrels (or about 7.22 million barrels per day) of crude oil were produced directly from tight oil resources in the United States. This was equal to about 65% of total U.S. crude oil production in 2021.”
b) Article: “Horizontally Drilled Wells Dominate U.S. Tight Formation Production.” By Jack Perrin. U.S. Energy Information Administration, June 6, 2019. <www.eia.gov>
“In 2004, horizontal wells accounted for about 15% of U.S. crude oil production in tight oil formations. By the end of 2018, that percentage had increased to 96%. … Because tight formations have very low permeability, which prevents oil and gas from moving toward the well bore, using hydraulic fracturing to increase permeability, along with horizontal drilling, is necessary for oil and gas to be produced from these formations economically.”
CALCULATION: 65% of crude oil production from tight oil formations × 96% of tight oil production from horizontal wells = 62.4% of crude oil production from horizontal wells
[405] Article: “Tight Oil Development Will Continue to Drive Future U.S. Crude Oil Production.” By Dana Van Wagener and Faouzi Aloulou. U.S. Energy Information Administration, March 28, 2019. <www.eia.gov>
“Tight oil production reached 6.5 million b/d [barrels per day] in the United States in 2018, accounting for 61% of total U.S. production. EIA projects further U.S. tight oil production growth as the industry continues to improve drilling efficiencies and reduce costs, which makes developing tight oil resources less sensitive to oil prices than in the past.”
[406] Article: “U.S. Oil Notches Record Growth.” By Keith Johnson and Russell Gold. Wall Street Journal, June 12, 2013. <online.wsj.com>
The fracking techniques that have unleashed so much crude in the U.S. haven’t yet had an impact overseas. However, recent government reports suggest that Argentina and Russia could have enormous deposits of crude oil accessible through fracking. Development of these resources has been slowed by government policies, competition from less expensive fields and a scarcity of specialized equipment.
[407] Article: “On the Rise.” By Thomas Helbling. International Monetary Fund Finance & Development, March 2013. Pages 34–37. <www.imf.org>
Page 37: “The full potential of the new resources at the global level is still unknown. Exploration and development outside the United States are only beginning.”
[408] Report: “Technically Recoverable Shale Oil and Shale Gas Resources: An Assessment of 137 Shale Formations in 41 Countries Outside the United States.” U.S. Energy Information Administration, June 10, 2013. <www.eia.gov>
Executive Summary (<www.eia.gov>):
Key positive above-the-ground advantages in the United States and Canada that may not apply in other locations include private ownership of subsurface rights that provide a strong incentive for development; availability of many independent operators and supporting contractors with critical expertise and suitable drilling rigs and, preexisting gathering and pipeline infrastructure; and the availability of water resources for use in hydraulic fracturing.
[409] Article: “German Energy Push Runs Into Problems.” By Melissa Eddy. New York Times, March 19, 2014. <www.nytimes.com>
About 11 percent of Germany’s energy is provided by natural gas, of which 35 percent comes from Russia. Despite the German government’s assurances that reserves of natural gas held in storage tanks are sufficient to ensure continued supply, there are fears of shortages should Moscow decide to retaliate to Western sanctions by reducing the flow of natural gas to the West.
Germany has almost no natural gas of its own—at least not gas that can be extracted through conventional drilling techniques.
It does have potentially promising reserves of gas in shale rock. But extraction of that shale gas through the technique known as hydraulic fracturing, or fracking, does not feature in Germany’s current plans.
[410] Article: “Shale Gas and Tight Oil Are Commercially Produced in Just Four Countries.” U.S. Energy Information Administration, February 13, 2015. <www.eia.gov>
The United States, Canada, China, and Argentina are currently the only four countries in the world that are producing commercial volumes of either natural gas from shale formations (shale gas) or crude oil from tight formations (tight oil). The United States is by far the dominant producer of both shale gas and tight oil.
Canada is the only other country to produce both shale gas and tight oil. China produces some small volumes of shale gas, while Argentina produces some small volumes of tight oil. While hydraulic fracturing techniques have been used to produce natural gas and tight oil in Australia and Russia, the volumes produced did not come from low-permeability shale formations.
[411] Email from the U.S. Energy Information Administration to Just Facts on August 13, 2019:
“Tight oil production from shale formations is still limited to the U.S., Canada and Argentina.”
[412] Email from Just Facts to the U.S. Energy Information Administration on July 30, 2020:
“Is commercial production of tight oil from shale formations is still limited to the U.S., Canada, and Argentina?”
Email from the U.S. Energy Information Administration to Just Facts on July 31, 2020:
“I believe you are correct and commercial production of tight oil and shale is still restricted to those countries. However this is not an area that we have been focusing our research efforts in recently.”
[413] Email from the U.S. Energy Information Administration to Just Facts on July 6,
2021:
“Commercial production of tight oil from shale formations is still limited to the U.S., Canada, and Argentina.”
[414] Email from Just Facts to the U.S. Energy Information Administration on August 29, 2022:
“Is commercial production of tight oil from shale formations is still limited to the U.S., Canada, and Argentina?
”Email from the U.S. Energy Information Administration to Just Facts on August 29, 2022:
“That’s correct, and most probably not very accurate. China has produced tight oil, using some fracking techniques for years. Their definition of tight oil is not what an American geologist or a petroleum engineer would consider tight.”
[415] Report: “Technically Recoverable Shale Oil and Shale Gas Resources: An Assessment of 137 Shale Formations in 41 Countries Outside the United States.” U.S. Energy Information Administration, June 10, 2013. <www.eia.gov>
Executive Summary (<www.eia.gov>):
Globally … 10 percent of estimated oil resources are in shale or tight formations. …
[I]t is important to distinguish between a technically recoverable resource, which is the focus of this report, and an economically recoverable resource. Technically recoverable resources represent the volumes of oil and natural gas that could be produced with current technology, regardless of oil and natural gas prices and production costs. Economically recoverable resources are resources that can be profitably produced under current market conditions.
[416] Report: “Annual Energy Outlook 2013 with Projections to 2040.” U.S. Energy Information Administration, April 2013. <www.osti.gov>
Page 33:
Estimates of technically recoverable resources from the rapidly developing tight oil formations are particularly uncertain and change over time as new information is gained through drilling, production, and technology experimentation. Over the past decade, as more tight and shale formations have gone into commercial production, estimates of technically and economically recoverable resources have generally increased. Technically recoverable resource estimates, however, embody many assumptions that might not prove to be true over the long term, over the entire range of tight or shale formations, or even within particular formations. For example, the tight oil resource estimates in the Reference case assume that production rates achieved in a limited portion of a given formation are representative of the entire formation, even though neighboring tight oil well production rates can vary widely. Any specific tight or shale formation can vary significantly across the formation with respect to relevant characteristics72, resulting in widely varying rates of well production. The application of refinements to current technologies, as well as new technological advancements, can also have a significant but highly uncertain impact on the recoverability of tight and shale crude oil.
Page 34:
Although initial production rates have increased over the past few years, it is too early to conclude that overall EURs [estimated ultimate recoveries] have increased and will continue to increase. Instead, producers may just be recovering the resource more quickly, resulting in a more dramatic decline in production later, with little impact on the well’s overall EUR. The decreased well spacing reflects less the capability to drill wells closer together (i.e., avoid interference) and instead more the discovery of and production from other shale plays that are not yet in commercial development. These may either be stacked in the same formation or reflect future technological innovations that would bring into production plays that are otherwise not amenable to current hydraulic fracturing technology.
Page 82: “Tight oil development is still at an early stage, and the outlook is highly uncertain. Alternative cases, including ones in which tight oil production is significantly above the Reference case projection, are examined in the ‘Issues in focus’ section of this report (see ‘Petroleum import dependence in a range of cases’).”
[417] Report: “Information on Shale Resources, Development, and Environmental and Public Health Risks.” U.S. Government Accountability Office, September 5, 2012. <www.gao.gov>
Page 21:
Overall, estimates of the size of technically recoverable shale oil resources in the United States are imperfect and highly dependent on the data, methodologies, model structures, and assumptions used. As these estimates are based on data available at a given point in time, they may change as additional information becomes available. Also these estimates depend on historical production data as a key component for modeling future supply. Because large-scale production of oil in shale formations is a relatively recent activity, their long-term productivity is largely unknown. For example, EIA [U.S. Energy Information Administration] estimated that the Monterey Shale in California may possess about 15.4 billion barrels of technically recoverable oil. However, without a longer history of production, the estimate has greater uncertainty than estimates based on more historical production data. At this time, USGS [U.S. Geological Survey] has not yet evaluated the Monterey Shale play.
[418] Report: “Assumptions to the Annual Energy Outlook 2022: Oil and Gas Supply Module.” U.S. Energy Information Administration, March 2022. <www.eia.gov>
Page 2:
A common measure of the long-term viability of U.S. domestic crude oil and natural gas as energy sources is the remaining TRR [technically recoverable resources], which consists of proved reserves4 and unproved resources.5 Estimates of TRR are highly uncertain, particularly in emerging plays where relatively few wells have been drilled. Early estimates tend to vary and shift significantly over time because new geological information is gained through additional drilling, long-term productivity is clarified for existing wells, and the productivity of new wells increases with technology improvements and better management practices. The TRR estimates that we use [U.S. Energy Information Administration] for each Annual Energy Outlook (AEO) are based on the latest available well production data and information from other federal and state governmental agencies, industries, and academia.
Page 7:
The underlying resource assumptions for the AEO Reference case is uncertain, particularly as exploration and development of tight oil continues to move into areas with little or no production history. Many wells drilled in tight or shale formations using the latest technologies have less than two years of production history, so we cannot fully ascertain the impact of recent technological advancement on the estimate of future recovery. Uncertainty also extends to the extent of formations and the number of layers in an area that could be drilled within formations. Alternative resource cases are addressed at the end of this document.
[419] Report: “Oil and Gas Supply Module of the National Energy Modeling System: Model Documentation 2014.” U.S. Energy Information Administration, July 2014. <www.eia.gov>
Page 6: “Proved reserves are the estimated quantities that analyses of geological and engineering data demonstrate with reasonable certainty to be recoverable in future years from known reservoirs under existing economic and operating conditions.”
[420] Report: “Technically Recoverable Shale Oil and Shale Gas Resources: An Assessment of 137 Shale Formations in 41 Countries Outside the United States.” U.S. Energy Information Administration, June 10, 2013. <www.eia.gov>
Executive Summary (<www.eia.gov>):
Economically recoverable resources are resources that can be profitably produced under current market conditions. The economic recoverability of oil and gas resources depends on three factors: the costs of drilling and completing wells, the amount of oil or natural gas produced from an average well over its lifetime, and the prices received for oil and gas production. Recent experience with shale gas in the United States and other countries suggests that economic recoverability can be significantly influenced by above-the-ground factors as well as by geology.
[421] Press release: “3 to 4.3 Billion Barrels of Technically Recoverable Oil Assessed in North Dakota and Montana’s Bakken Formation—25 Times More Than 1995 Estimate.” U.S. Department of the Interior, U.S. Geological Survey, April 10, 2008. <www.usgs.gov>
“Technically recoverable oil resources are those producible using currently available technology and industry practices. USGS [U.S. Geological Survey] is the only provider of publicly available estimates of undiscovered technically recoverable oil and gas resources.”
[422] Report: “Oil and Gas Supply Module of the National Energy Modeling System: Model Documentation 2014.” U.S. Energy Information Administration, July 2014. <www.eia.gov>
Page 6:
Technically recoverable resources are those volumes considered to be producible with current recovery technology and efficiency but without reference to economic viability. Technically recoverable volumes include proved reserves and inferred reserves as well as undiscovered and other unproved resources. These resources may be recoverable by techniques considered either conventional or unconventional.
[423] Report: “Technically Recoverable Shale Oil and Shale Gas Resources: An Assessment of 137 Shale Formations in 41 Countries Outside the United States.” U.S. Energy Information Administration, June 10, 2013. <www.eia.gov>
Executive Summary (<www.eia.gov>): “Technically recoverable resources represent the volumes of oil and natural gas that could be produced with current technology, regardless of oil and natural gas prices and production costs.”
[424] Report: “Annual Energy Review 2011.” U.S. Energy Information Administration, Office of Energy Statistics, September 2012. <www.eia.gov>
Page 369: “Undiscovered Recoverable Reserves (Crude Oil and Natural Gas): Those economic resources of crude oil and natural gas, yet undiscovered, that are estimated to exist in favorable geologic settings.”
[425] Webpage: “Do We Have Enough Oil Worldwide to Meet Our Future Needs?” U.S. Energy Information Administration. Last updated November 2, 2021. <www.eia.gov>
An often cited, but misleading, measurement of future resource availability is the reserves-to-production ratio, which is calculated by dividing the volume of total proved reserves by the volume of current annual consumption. Proved reserves are an accounting concept that is based on known projects, and it is not an appropriate measure for judging total resource availability in the long term. Over time, global reserves will likely increase as new technologies increase production at existing fields and as new projects are developed.
[426] Report: “International Energy Outlook 2013.” U.S. Energy Information Administration, July 25, 2013. <www.eia.gov>
Proved reserves include only estimated quantities of crude oil from known reservoirs, and therefore they are only a subset of the entire potential oil resource base. …
Proved reserves cannot provide an accurate assessment of the physical limits on future production but rather are intended to provide insight as to company-level or country-level development plans in the very near term. In fact, because of the particularly rigid requirements for the classification of resources as proved reserves, even the cumulative production levels from individual development projects may exceed initial estimates of proved reserves.
[427] Report: “Information on Shale Resources, Development, and Environmental and Public Health Risks.” U.S. Government Accountability Office, September 5, 2012. <www.gao.gov>
Page 25:
[Proved] Reserves are key information for assessing the net worth of an operator. Oil and gas companies traded on the U.S. stock exchange are required to report their reserves to the Securities and Exchange Commission. According to an EIA [U.S. Energy Information Administration] official, EIA reports a more complete measure of oil and gas reserves because it receives reports of proved reserves from both private and publically held companies.
[428] Press release: “3 to 4.3 Billion Barrels of Technically Recoverable Oil Assessed in North Dakota and Montana’s Bakken Formation—25 Times More Than 1995 Estimate.” U.S. Department of the Interior, U.S. Geological Survey, April 10, 2008. <www.usgs.gov>
A U.S. Geological Survey assessment, released April 10, shows a 25-fold increase in the amount of oil that can be recovered compared to the agency’s 1995 estimate of 151 million barrels of oil. …
Technically recoverable oil resources are those producible using currently available technology and industry practices. USGS [U.S. Geological Survey] is the only provider of publicly available estimates of undiscovered technically recoverable oil and gas resources.
New geologic models applied to the Bakken Formation, advances in drilling and production technologies, and recent oil discoveries have resulted in these substantially larger technically recoverable oil volumes. About 105 million barrels of oil were produced from the Bakken Formation by the end of 2007.
[429] Paper: “Percentage Depletion For Oil – A Policy Issue.” By Harrop A. Freeman. Indiana Law Journal, July 1, 1955. Pages 399–429. <www.repository.law.indiana.edu>
Page 427:
The existing proved American reserves of oil, that is, those known and commercially exploitable at current prices, equal eleven or twelve years of use at present rates, and the reserves of gas equal forty to fifty years. The Association of Petroleum Geologists reports that the areas of future prospective oil development in the United States are one hundred times those presently being exploited. The potential recoverable oil and reserves can further be enhanced by such factors as submarine oil and gas,103 oil from shale and tar sands,104 synthesis from coal or other substitutes, and technological improvements. The situation may also be eased by importing oil, by restricting low value uses such as fuel consumption, or by realizing atomic or other new sources of power.105
[430] Calculated with data from the report: “Annual Energy Review 2011.” U.S. Energy Information Administration, Office of Energy Statistics, September 2012. <www.eia.gov>
Page 91: “Table 4.2: Crude Oil and Natural Gas Cumulative Production and Proved Reserves, 1977–2010”
NOTE: An Excel file containing the data and calculations is available upon request.
[431] Webpage: “Paul R. Ehrlich.” Stanford University. Accessed March 15, 2019 at <ccb.stanford.edu>
President, Center for Conservation Biology, Bing Professor of Population Studies Emeritus …
Professor Ehrlich has received several honorary degrees, the John Muir Award of the Sierra Club, the Gold Medal Award of the World Wildlife Fund International, a MacArthur Prize Fellowship, the Crafoord Prize of the Royal Swedish Academy of Sciences (given in lieu of a Nobel Prize in areas where the Nobel is not given), in 1993 the Volvo Environmental Prize, in 1994 the United Nations’ Sasakawa Environment Prize, in 1995 the Heinz Award for the Environment, in 1998 the Tyler Prize for Environmental Achievement and the Dr. A. H. Heineken Prize for Environmental Sciences, in 1999 the Blue Planet Prize, in 2001 the Eminent Ecologist Award of the Ecological Society of America and the Distinguished Scientist Award of the American Institute of Biological Sciences, and in 2009 the Margalef Prize in Ecology and Environmental Sciences.
[432] Webpage: “Paul R. Ehrlich.” Stanford University, November 2018. <ccb.stanford.edu>
“Professor of Biological Sciences, Stanford University, 1966–2015 (emeritus 2016) … Bing Professor of Population Studies, Stanford University, 1977–2015 (emeritus 2016) … President—Center for Conservation Biology, 1984–present”
[433] Article: “The Book That Incited a Worldwide Fear of Overpopulation.” By Charles C. Mann. Smithsonian, January 2018. <www.smithsonianmag.com>
As 1968 began, Paul Ehrlich was an entomologist at Stanford University, known to his peers for his groundbreaking studies of the co-evolution of flowering plants and butterflies but almost unknown to the average person. That was about to change. In May, Ehrlich released a quickly written, cheaply bound paperback, The Population Bomb. Initially it was ignored. But over time Ehrlich’s tract would sell millions of copies and turn its author into a celebrity. It would become one of the most influential books of the 20th century—and one of the most heatedly attacked.
[434] Book: The End of Affluence: A Blueprint for Your Future. By Paul R. Ehrlich and Anne H. Ehrlich. Ballantine Books, 1974.
Page 49:
What Will We Do When the Pumps Run Dry?
Assuming no serious attempt is made to reduce worldwide consumption, how long will mankind’s liquid petroleum supplies last?
The US is now using a third of all the world’s petroleum extracted each year. Our energy wastage is enormous…. Furthermore, some projections indicate that by shortly after the turn of the century, Americans alone will “demand” each year more than today’s annual world production. No reasonable supply–demand scenario can be created that will meet such demand. The figures presented in the previous section clearly show that by early in the twenty-first century, the era of pumping “black gold” out of the ground to fuel industrial societies will be coming to an end.
We can be reasonably sure, then, that within the next quarter of a century mankind will be looking elsewhere than in oil wells for its main source of energy.
[435] Calculated with the dataset: “Crude Oil Including Lease Condensate Production (Mb/D).” U.S. Energy Information Administration. Accessed August 19, 2022 at <www.eia.gov>
NOTE: An Excel file containing the data and calculations is available upon request.
[436] Report: “Assumptions to the Annual Energy Outlook 2022: Oil and Gas Supply Module.” U.S. Energy Information Administration, March 2022. <www.eia.gov>
Page 2:
Key Assumptions
Domestic Oil and Natural Gas Technically Recoverable Resources
The outlook for domestic crude oil production is highly dependent on the production profile of individual wells over time, the cost of drilling and operating those wells, and the revenues generated by those wells. Every year, we re-estimate initial production (IP) rates and production decline curves, which determine estimated ultimate recovery (EUR) per well and total technically recoverable resources (TRR).3
A common measure of the long-term viability of U.S. domestic crude oil and natural gas as energy sources is the remaining TRR, which consists of proved reserves4 and unproved resources.5 Estimates of TRR are highly uncertain, particularly in emerging plays where relatively few wells have been drilled. Early estimates tend to vary and shift significantly over time because new geological information is gained through additional drilling, long-term productivity is clarified for existing wells, and the productivity of new wells increases with technology improvements and better management practices. The TRR estimates that we use for each Annual Energy Outlook (AEO) are based on the latest available well production data and information from other federal and state governmental agencies, industries, and academia.
Table 1. Technically Recoverable U.S. Crude Oil Resources as of January 1, 2020 (billion barrels) …
Total Technically Recoverable Resources … Total United States [=] 373.1 …
Note: Crude oil resources include lease condensates but do not include natural gas plant liquids or kerogen (oil shale). Resources in areas where drilling is officially prohibited are not included in this table. The estimate of 7.3 billion barrels of crude oil resources in the Northern Atlantic, Northern and Central Pacific, and within a 50-mile buffer off the Mid- and Southern Atlantic Outer Continental Shelf (OCS) is also excluded from the technically recoverable volumes because leasing is not expected in these areas.
NOTE: Although this EIA [U.S. Energy Information Administration] report does not include oil shale in its definition of crude oil, EIA sometimes includes liquid fuels produced from oil shale in its varying definitions of crude oil. For example:
Crude Oil: A mixture of hydrocarbons that exists in liquid phase in natural underground reservoirs and remains liquid at atmospheric pressure after passing through surface separating facilities. Depending upon the characteristics of the crude stream, it may also include … drip gases, and liquid hydrocarbons produced from tar sands, oil sands, gilsonite, and oil shale. [Report: “March 2018 Monthly Energy Review.” U.S. Energy Information Administration, Office of Energy Statistics, March 27, 2018. <www.eia.gov>. Pages 221–222.]
[437] Calculated with data from the report: “July 2022 Monthly Energy Review.” U.S. Energy Information Administration, Office of Energy Statistics, July 26, 2022. <www.eia.gov>
Page 61: “Table 3.1: Petroleum Overview (Thousand Barrels per Day) … Field Productiona … Crude Oilb,c … Total … 2020 Average [=] 11,283 … b Includes lease condensate.”
CALCULATIONS:
[438] Calculated with data from the report: “July 2022 Monthly Energy Review.” U.S. Energy Information Administration, Office of Energy Statistics, July 26, 2022. <www.eia.gov>
Page 61: “Table 3.1: Petroleum Overview (Thousand Barrels per Day) … Field Productiona … Crude Oilb,c … Total … 2020 Average [=] 11,283 … Trade … Net Importsh … 2020 Average [=] –635 … b Includes lease condensate.”
NOTE: The calculation below assumes that the vast bulk of net imports are crude oil, and thus, the amounts of renewable fuel and oxygenate imports are minimal. If this were not the case, U.S. crude oil reserves would last longer than the time determined in the calculation below.
CALCULATIONS:
[439] Report: “Technically Recoverable Shale Oil and Shale Gas Resources: An Assessment of 137 Shale Formations in 41 Countries Outside the United States.” U.S. Energy Information Administration, June 10, 2013. <www.eia.gov>
Executive Summary (<www.eia.gov>):
Table 2. Technically recoverable shale oil and shale gas unproved resources in the context of total world resources … Crude oil (billion barrels) … Total World … Total [=] 3,357 …
While the current report considers more shale formations than were assessed in the previous version, it still does not assess many prospective shale formations, such as those underlying the large oil fields located in the Middle East and the Caspian region. Further improvement in both the quality of the assessments and an increase the number of formations assessed should be possible over time. …
In addition to the key distinction between technically recoverable resources and economically recoverable resources that has been already discussed at some length, there are a number of additional factors outside of the scope of this report that must be considered in using its findings as a basis for projections of future production. In addition, several other exclusions were made for this report to simplify how the assessments were made and to keep the work to a level consistent with the available funding.
Some of the key exclusions for this report include:
• Tight oil produced from low permeability sandstone and carbonate formations that can often be found adjacent to shale oil formations. Assessing those formations was beyond the scope of this report.
• Coalbed methane and tight natural gas and other natural gas resources that may exist within these countries were also excluded from the assessment.
• Assessed formations without a resource estimate, which resulted when data were judged to be inadequate to provide a useful estimate. Including additional shale formations would likely increase the estimated resource.
• Countries outside the scope of the report, the inclusion of which would likely add to estimated resources in shale formations. It is acknowledged that potentially productive shales exist in most of the countries in the Middle East and the Caspian region, including those holding substantial nonshale oil and natural gas resources.
• Offshore portions of assessed shale oil and shale gas formations were excluded, as were shale oil and shale gas formations situated entirely offshore.
[440] Calculated with data from the report: “International Energy Outlook 2017.” U.S. Energy Information Administration, September 14, 2017. <www.eia.gov>
“Table G2. World crude oil production by region and country.” <www.eia.gov>
“Total World … 2013 [=] 75.9 [million barrels per day]”
CALCULATION: 3,357,000,000,000 barrels / (75,900,000 barrels per day × 365 days/year) = 121 years
[441] Article: “DOE [U.S. Department of Energy]-Funded Project Shows Promise for Tapping Vast U.S. Oil Shale Resources.” U.S. Department of Energy, Office of Fossil Energy, March 31, 2009. <energy.gov>
“The United States holds about two thirds of the world’s estimated reserves of 3.7 trillion barrels of oil shale, an amount thought to be 40 percent larger than remaining supplies of petroleum worldwide. Scientists believe that the Green River shale formation alone, in Colorado, Utah, and Wyoming, has as much as 1.1 trillion barrels of oil equivalent.”
[442] Report: “Oil Shale and Nahcolite Resources of the Piceance Basin, Colorado.” U.S. Department of the Interior, U.S. Geological Survey, Oil Shale Assessment Team, 2010. <pubs.usgs.gov>
Chapter 1: “An Assessment of In-Place Oil Shale Resources in the Green River Formation, Piceance Basin, Colorado.” By Ronald C. Johnson and others. <pubs.usgs.gov>
Page 5:
This assessment does not attempt to estimate the amount of oil that is economically recoverable, largely because there has not been an economic method developed to recover oil from Green River oil shale. In a recent report published by the RAND Corp. concerning the prospects for oil shale development in the United States, Bartis and others (2005, p. 5) state that: “Usually, estimates of recoverable resources are based on an analysis of the portion of the resources in place that can be economically exploited with available technology. Because oil shale production has not been profitable in the United States, such estimates do not yield useful information. Instead, calculations of recoverable resources have generally been based on rough estimates of the fraction of the resources in place that can be accessed and recovered, considering mining methods and processing losses.”
Previous estimates of the amount of oil shale that is technically recoverable without considering economics are 45 percent (Taylor, 1987) and 55 to 75 percent (Prien, 1974) of the oil in place using room-and-pillar mining methods, whereas estimates of technically recoverable resource using open-pit mining are as much as 80 percent of the oil in place (Taylor, 1987). At present, there are no estimates of the percent of the resource that could be recovered using the in-situ methods that are currently being developed, however, Taylor (1987) stressed that the amount of oil that can be recovered from any in-situ process depends on both the percent of oil that can be recovered from within the retort and the amount of oil left behind in the areas between retorts. There are currently no estimates of the percent of in-place oil that can be recovered using in-situ methods currently being developed.
[443] Report: “In-Place Oil Shale Resources Examined by Grade in the Major Basins of the Green River Formation, Colorado, Utah, and Wyoming.” By Justin E. Birdwell and others. U.S. Department of the Interior, U.S. Geological Survey, January 2013. <pubs.usgs.gov>
Page 1: “Oil shale in the Eocene Green River Formation—including the Piceance Basin of northwestern Colorado, the Uinta Basin of northeastern Utah, and the Greater Green River Basin of southwestern Wyoming—is the world’s largest known deposit of kerogen-rich rocks (Dyni, 2006).”
[444] Webpage: “About Oil Shale.” Oil Shale and Tar Sands Programmatic Environmental Impact Statement Information Center, U.S. Department of the Interior, Bureau of Land Management. Accessed April 7, 2018 at <www.anl.gov>
“While oil shale is found in many places worldwide, by far the largest deposits in the world are found in the United States in the Green River Formation, which covers portions of Colorado, Utah, and Wyoming.”
[445] Report: “In-Place Oil Shale Resources Examined by Grade in the Major Basins of the Green River Formation, Colorado, Utah, and Wyoming.” By Justin E. Birdwell and others. U.S. Department of the Interior, U.S. Geological Survey, January 2013. <pubs.usgs.gov>
Page 1:
Using a geology-based assessment methodology, the U.S. Geological Survey estimated a total of 4.285 trillion barrels of oil in-place in the oil shale of the three principal basins of the Eocene Green River Formation. Using oil shale cutoffs of potentially viable (15 gallons per ton) and high grade (25 gallons per ton), it is estimated that between 353 billion and 1.146 trillion barrels of the in-place resource have a high potential for development. …
The following overall values were determined for the entire Green River Formation: 1.146 trillion barrels (27 percent) of the total resource in the Green River Formation would be considered recoverable at a grade cutoff of 15 gallons of oil per ton of shale (GPT), and 353 billion barrels (8 percent) would be considered recoverable at a grade cutoff of 25 GPT. Oil shale with this oil-generating potential (≥25 GPT) is often described as high grade. …
… At the current rate of oil consumption in the United States, which is roughly 19 million barrels per day (U.S. Energy Information Administration, 2012b, high-grade Green River Formation oil shale resources represent a 50-year supply of oil. If the 15- to 25-GPT resource is included, then the prospective oil shale represents a 165-year supply of oil for the United States.
[446] Calculated with data from the report: “July 2022 Monthly Energy Review.” U.S. Energy Information Administration, Office of Energy Statistics, July 26, 2022. <www.eia.gov>
Page 61: “Table 3.1: Petroleum Overview (Thousand Barrels per Day) … Field Production … Crude Oil … Total … 2013 Average [=] 7,498 … Trade … Net Imports … 2013 Average [=] 6,237”
NOTES:
CALCULATIONS:
[447] Calculated with data from the report: “July 2022 Monthly Energy Review.” U.S. Energy Information Administration, Office of Energy Statistics, July 26, 2022. <www.eia.gov>
Page 61: “Table 3.1: Petroleum Overview (Thousand Barrels per Day) … Field Production … Crude Oil … Total … 2013 Average [=] 7,498
NOTE: The calculation below assumes that the vast bulk of net imports are crude oil, and thus, the amounts of renewable fuel and oxygenate imports are minimal. If this were not the case, U.S. crude oil reserves would last longer than the time determined in the calculations below.
CALCULATIONS:
[448] Calculated with data from the report: “International Energy Outlook 2017.” U.S. Energy Information Administration, September 14, 2017. <www.eia.gov>
“Table G2. World crude oil production by region and country, Reference Case.” <www.eia.gov>
“Total World … 2013 [=] 76.0 [million barrels per day]”
CALCULATIONS:
[449] Webpage: “About Oil Shale.” Oil Shale and Tar Sands Programmatic Environmental Impact Statement Information Center, U.S. Department of the Interior, Bureau of Land Management. Accessed April 7, 2018 at <www.anl.gov>
“More than 70% of the total oil shale acreage in the Green River Formation, including the richest and thickest oil shale deposits, is under federally owned and managed lands. Thus, the federal government directly controls access to the most commercially attractive portions of the oil shale resource base.”
[450] Calculated with data from:
a) Report: “Technically Recoverable Shale Oil and Shale Gas Resources: An Assessment of 137 Shale Formations in 41 Countries Outside the United States.” U.S. Energy Information Administration, June 10, 2013. <www.eia.gov>
Executive Summary (<www.eia.gov>) Page 3: “Table 2. Technically recoverable shale oil and shale gas unproved resources in the context of total world resources … Crude oil (billion barrels) … United States … Total [=] 223”
b) Report: “In-Place Oil Shale Resources Examined by Grade in the Major Basins of the Green River Formation, Colorado, Utah, and Wyoming.” By Justin E. Birdwell and others. U.S. Department of the Interior, U.S. Geological Survey, January 2013. <pubs.usgs.gov>
Page 1: “Using a geology-based assessment methodology, the U.S. Geological Survey estimated a total of 4.285 trillion barrels of oil in-place in the oil shale of the three principal basins of the Eocene Green River Formation. Using oil shale cutoffs of potentially viable (15 gallons per ton) and high grade (25 gallons per ton), it is estimated that between 353 billion and 1.146 trillion barrels of the in-place resource have a high potential for development. … the following overall values were determined for the entire Green River Formation: 1.146 trillion barrels (27 percent) of the total resource in the Green River Formation would be considered recoverable at a grade cutoff of 15 gallons of oil per ton of shale (GPT), and 353 billion barrels (8 percent) would be considered recoverable at a grade cutoff of 25 GPT. Oil shale with this oil-generating potential (≥25 GPT) is often described as high grade.”
c) Report: “January 2024 Monthly Energy Review.” U.S. Energy Information Administration, Office of Energy Statistics, January 29, 2024. <www.eia.gov>
Page 63: “Table 3.1: Petroleum Overview (Thousand Barrels per Day) … Field Productiona … Crude Oilb,c … Total … 2022 Average [=] 11,911 ... Trade … Net Importsh … 2022 Average [=] –1,191”
NOTE: An Excel file containing the data and calculations is available upon request.
[451] Calculated with data from:
a) Report: “Technically Recoverable Shale Oil and Shale Gas Resources: An Assessment of 137 Shale Formations in 41 Countries Outside the United States.” U.S. Energy Information Administration, June 10, 2013. <www.eia.gov>
Executive Summary (<www.eia.gov>) Page 3: “Table 2. Technically recoverable shale oil and shale gas unproved resources in the context of total world resources … Crude oil (billion barrels) … Total World … Total [=] 3,357”
b) Report: “In-Place Oil Shale Resources Examined by Grade in the Major Basins of the Green River Formation, Colorado, Utah, and Wyoming.” By Justin E. Birdwell and others. U.S. Department of the Interior, U.S. Geological Survey, January 2013. <pubs.usgs.gov>
Page 1: “Using a geology-based assessment methodology, the U.S. Geological Survey estimated a total of 4.285 trillion barrels of oil in-place in the oil shale of the three principal basins of the Eocene Green River Formation. Using oil shale cutoffs of potentially viable (15 gallons per ton) and high grade (25 gallons per ton), it is estimated that between 353 billion and 1.146 trillion barrels of the in-place resource have a high potential for development. … the following overall values were determined for the entire Green River Formation: 1.146 trillion barrels (27 percent) of the total resource in the Green River Formation would be considered recoverable at a grade cutoff of 15 gallons of oil per ton of shale (GPT), and 353 billion barrels (8 percent) would be considered recoverable at a grade cutoff of 25 GPT. Oil shale with this oil-generating potential (≥25 GPT) is often described as high grade.”
c) Report: “Crude Oil Including Lease Condensate Production (Mb/D).” U.S. Energy Information Administration. Accessed February 1, 2024 at <www.eia.gov>
“World … 2022 [=] 80,833”
NOTE: An Excel file containing the data and calculations is available upon request.
[452] Book: Fundamentals of Natural Gas. By Vivek Chandra. Pennwell, 2006. <vdoc.pub>
As a strict definition, natural gas consists of hydrocarbons that remain in the gas phase (not condensable into liquids) at 20°C and atmospheric pressure, conditions considered to be standard temperature and pressure (STP). This effectively limits the definition to components with four or fewer carbon molecules: methane (C1H4, commonly written as CH4), ethane (C2H6), propane (C3H8), and butane (C4H10). Hydrocarbons with more carbon molecules are liquid at STP conditions but may exist in gaseous phase in the reservoir. A more practical definition of natural gas includes the C5+ components that are produced with natural gas. Pentane (C5H12) begins the series that includes condensates.
[453] Entry: “room temperature.” American Heritage Dictionary of the English Language. Houghton Mifflin, 2000. <www.thefreedictionary.com>
“An indoor temperature of from 20 to 25°C (68 to 77°F).”
[454] Report: “Annual Energy Review 2011.” U.S. Energy Information Administration, Office of Energy Statistics, September 2012. <www.eia.gov>
Pages 360–362:
Methane: A colorless, flammable, odorless hydrocarbon gas (CH4), which is the major component of natural gas. It is also an important source of hydrogen in various industrial processes. …
Natural Gas: A gaseous mixture of hydrocarbon compounds, primarily methane, used as a fuel for electricity generation and in a variety of ways in buildings, and as raw material input and fuel for industrial processes. …
Natural Gas Liquids (NGL): Those hydrocarbons in natural gas that are separated from the gas as liquids through the process of absorption, condensation, adsorption, or other methods in gas processing or cycling plants. Generally such liquids consist of propane and heavier hydrocarbons and are commonly referred to as lease condensate, natural gasoline, and liquefied petroleum gases. Natural gas liquids include natural gas plant liquids (primarily ethane, propane, butane, and isobutane) and lease condensate (primarily pentanes produced from natural gas at lease separators and field facilities).
NOTE: See the next footnote for details about the classification of natural gas liquids as petroleum.
[455] Report: “Annual Energy Review 2011.” U.S. Energy Information Administration, Office of Energy Statistics, September 2012. <www.eia.gov>
Page 180: “Figure 6.2: Natural Gas Production … Volume reduction resulting from the removal of natural gas plant liquids, which are transferred to petroleum supply.”
Page 360: “Lease Condensate: A mixture consisting primarily of pentanes and heavier hydrocarbons which is recovered as a liquid from natural gas in lease separation facilities. This category excludes natural gas plant liquids, such as butane and propane, which are recovered at downstream natural gas processing plants or facilities.”
Page 364: “Petroleum: A broadly defined class of liquid hydrocarbon mixtures. Included are crude oil, lease condensate, unfinished oils, refined products obtained from the processing of crude oil, and natural gas plant liquids.”
Page 362:
Natural Gas Plant Liquids (NGPL): Those hydrocarbons in natural gas that are separated as liquids at natural gas processing plants, fractionating and cycling plants, and, in some instances, field facilities. Lease condensate is excluded. Products obtained include ethane; liquefied petroleum gases (propane, butanes, propane-butane mixtures, ethane-propane mixtures); isopentane; and other small quantities of finished products, such as motor gasoline, special naphthas, jet fuel, kerosene, and distillate fuel oil. See Natural Gas Liquids.
[456] Report: “Annual Energy Review 2011.” U.S. Energy Information Administration, Office of Energy Statistics, September 2012. <www.eia.gov>
Page 358: “Hydrocarbon: An organic chemical compound of hydrogen and carbon in the gaseous, liquid, or solid phase. The molecular structure of hydrocarbon compounds varies from the simplest (methane, a constituent of natural gas) to the very heavy and very complex.”
Page 361: “Natural Gas: A gaseous mixture of hydrocarbon compounds, primarily methane, used as a fuel for electricity generation and in a variety of ways in buildings, and as raw material input and fuel for industrial processes.”
[457] Book: Energy and the Missing Resource: A View From the Laboratory. By I. Dostrovsky. Cambridge University Press, 1988.
Pages 12–13:
[Petroleum is] formed as the breakdown products of plant organisms, mainly of marine origin, that become incorporated in sediments and are then subjected to heat under high pressures over long periods of time. … [T]he precipitated organic matter must escape oxidization by oxygen dissolved in the water. Where stagnant conditions exist, accumulation of sediments rich in organic debris may be formed. Such sediments, when compacted by extensive pressure of accumulated material, become rocks, source rocks as they are called in the petroleum industry, in which oil may be formed.
Pages 21–22: “Natural gas is formed as one of the products during the alteration of organic matter contained in sediments under the influence of heat. The process was described in connection with the genesis of oil (see Section 2.1). Recall that, beyond a fairly narrow temperature region, the main product of the decomposition of organic material is methane.”
[458] Book: Petroleum Chemistry and Refining. Edited by James G. Speight. Taylor and Francis, 1998.
Chapter 1: “The Composition of Petroleum.” By Robert B. Long and James G. Speight. Pages 1–38.
Page 6:
Petroleum is generally accepted as being formed from buried marine sediments by the action of heat and pressure. …
Marine sediment is a term used to describe the organic biomass believed to be the raw material from which petroleum is derived, and it is mixture of many types of marine organic material that collected at the bottom of the seas and then become buried by the geological action of the earth. The types of marine organic material that collected in the sediment could be bacteria, plankton, animals, fish, and marine vegetation in varying proportions in the different sediments buried at various locations around the world. …
These buried marine deposits then undergo a series of concurrent and consecutive chemical reactions collectively called diagenesis under the influence of the temperature, pressure, and long reaction times afforded by history in the earth.
[459] Article: “Feuding Over the Origins of Fossil Fuels.” By Lisa M. Pinsker. American Geological Institute Geotimes, October 2005. <www.geotimes.org>
A petroleum geochemist at the U.S. Geological Survey, [Mike] Lewan is an expert on the origins of oil, and quite familiar with an idea that has been lingering within some scientific circles for many years now: that petroleum—oil and natural gas—comes from processes deep in Earth that do not involve organic material. This idea runs contrary to the theory that has driven modern oil exploration: that petroleum comes from the heating of organic material over time in Earth’s shallower crust.
[460] Book: Energy and the Missing Resource: A View From the Laboratory. By I. Dostrovsky. Cambridge University Press, 1988.
Page 22: “This material [methane] being a gas, is very mobile and diffuses away from its point of origin until it either escapes to the atmosphere or is trapped in a suitable formation. Because the geological structures capable of trapping oil are also effective in trapping gas, the two material are often associated.”
[461] Calculated from the dataset: “U.S. Natural Gas Flow, 2021 (Trillion Cubic Feet).” U.S. Energy Information Administration, Office of Energy Statistics, April 2022. <www.eia.gov>
“trillion cubic feet … from crude oil wells 4.71 … gross withdrawals 41.49”
CALCULATION: 4.71 trillion cubic feet of gas from crude oil wells / 41.49 trillion cubic feet of gas from all wells = 11.4%
[462] Article: “Natural Gas.” Encyclopædia Britannica Ultimate Reference Suite 2004.
It was in China in 211 BC that the first known well was drilled for natural gas to reported depths of 150 metres (500 feet). The gas was burned to dry the rock salt found interbedded in the limestone. …
Natural gas was unknown in Europe until its discovery in England in 1659, and even then it did not come into wide use. Instead, gas obtained from carbonized coal (known as town gas) became the primary fuel for illuminating streets and houses throughout much of Europe from 1790 on. In North America the first commercial application of a petroleum product was the utilization of natural gas from a shallow well in Fredonia, N.Y., in 1821. The gas was distributed through a small-bore lead pipe to consumers for lighting and cooking.
[463] Article: “Natural Gas.” Encyclopædia Britannica Ultimate Reference Suite 2004.
Throughout the 19th century the use of natural gas remained localized because there was no way to transport large quantities of gas over long distances. Natural gas remained on the sidelines of industrial development, which was based primarily on coal and oil. An important breakthrough in gas-transportation technology occurred in 1890 with the invention of leakproof pipeline coupling. Nonetheless, materials and construction techniques remained so cumbersome that gas could not be used more than 160 kilometres (100 miles) from a source of supply. Thus, associated gas was mostly flared (i.e., burned at the wellhead), and nonassociated gas was left in the ground, while town gas was manufactured for use in the cities.
Long-distance gas transmission became practical during the late 1920s because of further advances in pipeline technology. From 1927 to 1931 more than 10 major transmission systems were constructed in the United States. Each of these systems was equipped with pipes having diameters of approximately 51 centimetres (20 inches) and extended more than 320 kilometres. Following World War II, a large number of even longer pipelines of increasing diameter were constructed. The fabrication of pipes having a diameter of up to 142 centimetres became possible.
[464] Textbook: The Chemistry and Technology of Petroleum (4th edition). By James G. Speight. CRC Press, 2007.
Page 139:
Natural gas presents different transportation requirement problems. Before World War II, its use was limited by the difficulty of transporting it over long distances. The gas found in oil fields was frequently burned off; and unassociated (dry) gas was usually abandoned. After the war, new steel alloys permitted the laying of large-diameter pipes for gas transport in the United States.
[465] Book: Fundamentals of Natural Gas. By Vivek Chandra. Pennwell, 2006. <vdoc.pub>
Pipelines are the most common, and usually the most economic, delivery system to transport gas from the field to the consumer. Pipelines are a fixed, long-term investment that can be uneconomic for smaller and more remote gas fields. …
The volume of gas that can be transported in a pipeline depends on two main factors: the pipeline operating pressure and pipe diameter. The maximum diameter of pipelines continues to increase every few years. As diameters of 48 in. (121 cm) become common, the industry may be approaching the practical limit to onshore pipelines. …
To handle the increasing demand, it is likely that operating pressures will increase rather than the size of the pipe. …
Increasing pressure requires larger and thicker pipes, larger compressors, and higher safety standards, all of which substantially increase the capital and operating expenses of a system.
[466] Textbook: The Chemistry and Technology of Petroleum (4th edition). By James G. Speight. CRC Press, 2007.
Page 139:
Natural gas is also transported by seagoing vessels. The gas is either transported under pressure at ambient temperatures (e.g., propane and butanes) or at atmospheric pressure, but with the cargo under refrigeration (e.g., liquefied petroleum gas). …
Natural gas is much more expensive to ship than crude oil because of its lower density. Most natural gas moves by pipeline, but in the late 1960s, tanker shipments of natural gas (LNG) began, particularly from the producing nations in the Pacific to Japan. Special alloys are required to prevent the tanks from becoming brittle at the low temperatures (–161ºC, –258ºF) required to keep the gas liquid.
[467] Calculated with data from:
a) Report: “Annual Energy Review 2011.” U.S. Energy Information Administration, Office of Energy Statistics, September 2012. <www.eia.gov>
Page 322: “Table A2. Approximate Heat Content of Petroleum Production, Imports, and Exports, Selected Years, 1949–2011 (Million Btu per Barrel) … Production … Crude Oil … 2011 [=] … 5.800”
b) Report: “Annual Energy Review 2011.” U.S. Energy Information Administration, Office of Energy Statistics, September 2012. <www.eia.gov>
Page 324: “Table A4. Approximate Heat Content of Natural Gas, Selected Years, 1949–2011 (Btu per Cubic Foot†) … Production … Marketed … 2011 [=] 1,097”
c) Webpage: “International Energy Statistics—Units.” U.S. Energy Information Administration. Accessed September 3, 2013 at <www.eia.gov>
“Volume Equivalent Conversions … [One] Barrel [=] 5.61460 Cubic Feet”
† NOTE: A cubic foot of natural gas is the “amount of natural gas contained at standard temperature and pressure (60 degrees Fahrenheit and 14.73 pounds standard per square inch) in a cube whose edges are one foot long.” [Report: “Annual Energy Review 2011.” U.S. Energy Information Administration, Office of Energy Statistics, September 2012. <www.eia.gov>. Page 353: “Cubic Foot (Natural Gas).”]
CALCULATION: (5,800,000 Btu per barrel of crude / 5.6146 cubic feet per barrel) / 1,097 Btu per cubic foot of natural gas = 942
[468] Webpage: “Gas Pricing.” By Vivek Chandra (author of Fundamentals of Natural Gas, published by Pennwell, the publisher of Oil and Gas Journal and other leading industry books and manuals). Accessed March 11, 2016 at <natgas.info>
[T]o transport … methane … requires either a pipeline, or expensive compression or liquefaction transformation….
[B]ecause natural gas is difficult to transport, natural gas prices tend to be set locally or regionally. The large majority (over 90%) of traded natural gas is transported by pipeline.
[469] Book: Fundamentals of Natural Gas. By Vivek Chandra. Pennwell, 2006. <vdoc.pub>
Though the overall percentage of gas transported as LNG [liquefied natural gas] is less than 10% of global gas trade, it is growing rapidly, involving an increasing number of buyers and sellers. …
LNG is simply an alternative method to transport methane from the producer to the consumer. Methane (CH4) gas is cooled to 161.5°C (–260°F), converting its gaseous phase into an easily transportable liquid whose volume is approximately 600 times less than the equivalent volume of methane gas. (The exact shrinkage is closer to 610 times, but 600 is commonly quoted.) …
Gas converted to LNG can be transported by ship over long distances where pipelines are neither economic nor feasible. At the receiving location, liquid methane is offloaded from the ship and heated, allowing its physical phase to return from liquid to gas. This gas is then transported to gas consumers by pipeline in the same manner as natural gas produced from a local gas field. …
Liquefaction plants are typically the most expensive element in an LNG project. Because 8%–10% of gas delivered to the plant is used to fuel the refrigeration process, overall operating costs are high, even though other costs, such as labor and maintenance, are low.
[470] Article: “Natural Gas.” Encyclopædia Britannica Ultimate Reference Suite 2004.
Throughout the 19th century the use of natural gas remained localized because there was no way to transport large quantities of gas over long distances. Natural gas remained on the sidelines of industrial development, which was based primarily on coal and oil. An important breakthrough in gas-transportation technology occurred in 1890 with the invention of leakproof pipeline coupling. Nonetheless, materials and construction techniques remained so cumbersome that gas could not be used more than 160 kilometres (100 miles) from a source of supply. Thus, associated gas was mostly flared (i.e., burned at the wellhead), and nonassociated gas was left in the ground, while town gas was manufactured for use in the cities.
[471] Textbook: The Chemistry and Technology of Petroleum (4th edition). By James G. Speight. CRC Press, 2007.
Page 139:
Natural gas presents different transportation requirement problems. Before World War II, its use was limited by the difficulty of transporting it over long distances. The gas found in oil fields was frequently burned off; and unassociated (dry) gas was usually abandoned. After the war, new steel alloys permitted the laying of large-diameter pipes for gas transport in the United States.
[472] Webpage: “Glossary.” U.S. Energy Information Administration. Accessed July 22, 2019 at <www.eia.gov>
“Vented/Flared: Gas that is disposed of by releasing (venting) or burning (flaring).”
[473] Calculated with data from:
a) Report: “Annual Energy Review 2011.” U.S. Energy Information Administration, Office of Energy Statistics, September 2012. <www.eia.gov>
Page 181: “Table 6.2: Natural Gas Production, Selected Years, 1949–2011 (Billion Cubic Feet)”
b) Webpage: “Total Energy: Energy Flow Archives.” U.S. Energy Information Administration, Office of Energy Statistics. Accessed August 24, 2022 at <www.eia.gov>
“Energy Flow Diagrams 1996–2020: Natural Gas.”
1996, 1997, 1998, 1999, 2000, 2001, 2002, 2003, 2004, 2005, 2006, 2007, 2008, 2009, 2010, 2011, 2012, 2013, 2014, 2015, 2016, 2017, 2018, 2019, 2020
c) Webpage “U.S. Natural Gas Flow, 2021.” U.S. Energy Information Administration, Office of Energy Statistics. Accessed August 24, 2022 at <www.eia.gov>
NOTE: An Excel file containing the data and calculations is available upon request.
[474] Calculated from the webpage: “Total Energy: Energy Flow Archives.” U.S. Energy Information Administration, Office of Energy Statistics. Accessed August 24, 2022 at <www.eia.gov>
“U.S. Natural Gas Flow, 2020 … Vented and Flared [=] 0.56 … Marketed Production [=] 36.18”
CALCULATION: 0.56 trillion cubic feet of vented and flared gas / 36.18 trillion cubic feet of marketed production gas = 1.5%
NOTE: Instead of calculating venting and flaring as a percentage of natural gas extraction (as in the previous footnote), marketed production is used as the denominator. This is done to provide an accurate comparator for the worldwide production data, because worldwide extraction data is not available.
[475] Calculated with data from:
a) Website: “Global Gas Flaring Data.” World Bank. Accessed August 25, 2022 at <www.worldbank.org>
“Individual Flare Sites – Gas Flaring Volumes (mln m3/yr) … Year [=] 2020 … Region [=] All … Location [=] All … Flare Size [=] All … Economy [=] All … Field Type [=] All … Flare Volume [=] 141,377.60”
b) Report: “Key World Energy Statistics 2021.” International Energy Agency, September 2021. <iea.blob.core.windows.net>
Page 15: “Producers, Net Exporters and Net Importers1 of Natural Gas …Producers … World … bcm [=] 4,014 … 2020 provisional data”
CALCULATION: 141.378 bcm flared gas / 4,014 bcm natural gas production = 3.5%
[476] Book: Fundamentals of Natural Gas. By Vivek Chandra. Pennwell, 2006. <vdoc.pub>
More than 97% of the world’s synthetic fertilizer is produced from synthetically produced ammonia. The process requires relatively high temperatures and pressures, and thus requires cheap energy to be economic. Natural gas, with its relatively cheap price, provides both the energy and the feedstock for the process, and is thus the feedstock of choice. …
Today, most large cities in North America, Europe, and Northern Asia have extensive natural gas networks supplying residential and commercial consumers with clean and reliable natural gas, primarily for space heating, water heating, and cooking. Many cities in developing countries are also installing local gas pipelines and networks.
[477] Booklet: “Energy, Powering Your World.” By M.T. Westra and S. Kuyvenhoven. Foundation for Fundamental Research on Matter, Institute for Plasma Physics, Rijnhuizen (the Netherlands), 2002. <fire.pppl.gov>
Page 17: “[G]as gives you a lot of energy for very little money. That is why it is almost always preferable to cook and heat your home with gas, if it is available.”
Page 25: “Gas is used in power plants to generate electricity, and in factories both as a fuel and as an ingredient for a variety of chemicals.”
[478] Webpage: “Gas Pricing.” By Vivek Chandra (author of Fundamentals of Natural Gas, published by Pennwell, the publisher of Oil and Gas Journal and other leading industry books and manuals). Accessed March 11, 2016 at <natgas.info>
“NGLs [natural gas liquids] are desired by global markets to produce various petrochemical products, to be blended with crude oil to make more valuable products, and can also be combusted directly.”
[479] Report: “Annual Energy Outlook 2013 with Projections to 2040.” U.S. Energy Information Administration, April 2013. <www.osti.gov>
Page 49:
The uses of NGL [natural gas liquids] are diverse. The lightest NGL component, ethane, is used almost exclusively as a petrochemical feedstock to produce ethylene, which in turn is a basic building block for plastics, packaging materials, and other consumer products. … Propane is the most versatile NGL component, with applications ranging from residential heating, to transportation fuel for forklifts, to petrochemical feedstock for propylene and ethylene production (nearly one-half of all propane use in the United States is as petrochemical feedstock). Butanes are produced in much smaller quantities and are used mostly in refining (for gasoline blending or alkylation) or as chemical feedstock. The heaviest liquids, known as pentanes plus, are used as ethanol denaturant, blendstock for gasoline, chemical feedstock, and, more recently, as diluent for the extraction and pipeline movement of heavy crude oils from Canada.
[480] Webpage: “What Are Natural Gas Liquids and How Are They Used?” U.S. Energy Information Administration, April 20, 2012. <www.eia.gov>
NGL [natural gas liquids] Attribute Summary Ethane … Ethane … End Use Products … Plastic bags; plastics; anti-freeze, detergent …
… There are many uses for NGLs, spanning nearly all sectors of the economy. NGLs are used as inputs for petrochemical plants, burned for space heat and cooking, and blended into vehicle fuel. …
Ethane occupies the largest share of NGL field production. It is used almost exclusively to produce ethylene, which is then turned into plastics. Much of the propane, by contrast, is burned for heating, although a substantial amount is used as petrochemical feedstock. A blend of propane and butane, sometimes referred to as “autogas,” is a popular fuel in some parts of Europe, Turkey, and Australia. Natural gasoline (pentanes plus) can be blended into various kinds of fuel for combustion engines, and is useful in energy recovery from wells and oil sands.
[481] Calculated with data from the report: “July 2022 Monthly Energy Review.” U.S. Energy Information Administration, Office of Energy Statistics, July 26, 2022. <www.eia.gov>
Page 7: “Table 1.3 Primary Energy Consumption by Source (Quadrillion Btu) … 2021 Total … Natural Gasc [=] 31.343 … Totalg [=] 97.331”
CALCULATION: 31.343 / 97.331 = 32.2%
[482] Calculated with data from the report: “July 2022 Monthly Energy Review.” U.S. Energy Information Administration, Office of Energy Statistics, July 26, 2022. <www.eia.gov>
Page 41: “Table 2.2. Residential Sector Energy Consumption”
Page 43: “Table 2.3. Commercial Sector Energy Consumption”
Page 45: “Table 2.4. Industrial Sector Energy Consumption”
Page 47: “Table 2.5. Transportation Sector Energy Consumption”
Page 49: “Table 2.6. Electric Power Sector Energy Consumption”
NOTE: An Excel file containing the data and calculations is available upon request.
[483] Calculated with data from:
a) Report: “July 2022 Monthly Energy Review.” U.S. Energy Information Administration, Office of Energy Statistics, July 26, 2022. <www.eia.gov>
Page 103: “(Billion Cubic Feet)”
b) Report: “Natural Gas Annual 1994 Volume 2.” U.S. Energy Information Administration, Office of Energy Statistics, November 1995. <www.eia.gov>
Pages 6–7: “Table 2. Supply and Disposition of Natural Gas in the United States, 1930–1994 (Million Cubic Feet)”
NOTE: An Excel file containing the data and calculations is available upon request.
[484] Calculated with data from:
a) Report: “July 2022 Monthly Energy Review.” U.S. Energy Information Administration, Office of Energy Statistics, July 26, 2022. <www.eia.gov>
Page 103: “Table 4.1: Natural Gas Overview (Billion Cubic Feet)”
b) Report: “Natural Gas Annual 1994 Volume 2.” U.S. Energy Information Administration, Office of Energy Statistics, November 1995. <www.eia.gov>
Pages 6–7: “Table 2. Supply and Disposition of Natural Gas in the United States, 1930–1994 (Million Cubic Feet)”
NOTE: An Excel file containing the data and calculations is available upon request.
[485] Report: “Information on Shale Resources, Development, and Environmental and Public Health Risks.” U.S. Government Accountability Office, September 5, 2012. <www.gao.gov>
Page 1:
For decades, the United States has relied on imports of oil and natural gas to meet domestic needs. As recently as 2007, the expectation was that the nation would increasingly rely on imports of natural gas to meet its growing demand. However, recent improvements in technology have allowed companies that develop petroleum resources to extract oil and natural gas from shale formations,1 known as “shale oil” and “shale gas,” respectively, which were previously inaccessible because traditional techniques did not yield sufficient amounts for economically viable production.
[486] Report: “International Energy Outlook 2013.” U.S. Energy Information Administration, July 25, 2013. <www.eia.gov>
Page 4:
In the United States, one of the keys to increasing natural gas production has been advances in the application of horizontal drilling and hydraulic fracturing technologies, which made it possible to develop the country’s vast shale gas resources and contributed to a near doubling of total U.S. technically recoverable natural gas resource estimates over the past decade.
[487] Article: “On the Rise.” By Thomas Helbling. International Monetary Fund Finance & Development, March 2013. Pages 34–37. <www.imf.org>
Page 34: “A strong rebound in gas and then oil production in the United States over the past few years has taken markets and policymakers by surprise…. The surge in production is largely the result of the new ability of producers to extract oil and gas from unconventional geological formations—so-called shale rock and tight rock or sand formations.”
[488] Webpage: “Factors Affecting Natural Gas Prices.” U.S. Energy Information Administration. Last updated October 5, 2021. <www.eia.gov>
Natural Gas Prices Are a Function of Market Supply and Demand …
Increases in natural gas supply generally result in lower natural gas prices, and decreases in supply tend to lead to higher prices. Increases in demand generally lead to higher prices, and decreases in demand tend to lead to lower prices. In turn, higher prices tend to moderate or reduce demand and encourage production, and lower prices tend to have the opposite effects. …
Because of natural gas supply infrastructure constraints and limitations in the ability of many natural gas consumers to switch fuels quickly, short-term increases in demand and/or reductions in supply may cause large changes in natural gas prices, especially during the wintertime. …
The United States produces most of the natural gas that it consumes. Annual U.S. dry natural gas production generally increased from 2005 through 2019, and U.S. natural gas prices generally decreased during the same period and have been less volatile since 2010. …
The strength of the economy influences natural gas markets. During periods of economic growth, increases in demand for goods and services from the commercial and industrial sectors may increase natural gas consumption. Economic-related increases in consumption can be particularly strong in the industrial sector, which uses natural gas as a fuel and a feedstock for making many products such as fertilizer and pharmaceuticals. …
Hurricanes and other severe weather can affect the supply of natural gas. Natural gas prices have been affected when hurricanes disrupted natural gas production in the Gulf of Mexico as in 2005 with Hurricanes Katrina and Rita. In recent years, disruptions in Gulf of Mexico production tend to affect prices less than in the past because the share of total U.S. dry natural gas production from the Gulf of Mexico has declined from about 25% in 2001 to 2% in 2020. Very cold weather can also disrupt natural gas production. If these supply disruptions occur when demand for natural gas is high, prices may increase more than expected. …
During cold months, natural gas demand for heating by residential and commercial consumers generally increases overall natural gas demand and can put upward pressure on prices. If unexpected cold or severe weather occurs, the effect on prices can intensify because supply is often unable to react quickly to short-term increases in demand. The effect of weather on natural gas prices may be greater if the natural gas transmission (pipeline) system is already operating at or near full capacity. Natural gas supplies in storage can help to cushion the impact of high demand during cold weather. …
High summer temperatures can have direct and indirect effects on natural gas prices. Hot weather tends to increase demand for air conditioning in homes and buildings, which generally increases the power sector's demand for natural gas. During high demand periods, natural gas prices on the spot market may increase sharply if natural gas supply sources are relatively low or constrained. In addition, increases in natural gas consumption by the electric power sector during the summer may lead to smaller-than-normal injections of natural gas into storage and to lower available storage volumes in the winter, which could affect prices.
[489] Report: “Information on Shale Resources, Development, and Environmental and Public Health Risks.” U.S. Government Accountability Office, September 5, 2012. <www.gao.gov>
Pages 31–32: “The growth in production of shale gas has increased the overall supply of natural gas in the U.S. energy market. Since 2007, increased shale gas production has contributed to lower prices for consumers, according to EIA [U.S. Energy Information Administration] and others.”
[490] Article: “U.S. Gas Fields Go From Bust to Boom.” By Ben Casselman. Wall Street Journal, April 30, 2009. <www.wsj.com>
But new technologies and a drilling boom have helped production rise 11% in the past two years. Now there’s a glut, which has driven prices down to a six-year low and prompted producers to temporarily cut back drilling and search for new demand. …
The weakening economy eroded demand for both oil and gas. Natural gas, unlike oil, suffered from a supply glut. U.S. gas production rose 7.2% last year…. Natural-gas prices have fallen 41% to their lowest since 2002.
[491] Report: “International Energy Outlook 2013.” U.S. Energy Information Administration, July 25, 2013. <www.eia.gov>
Page 45:
Historically, the regulation of U.S. natural gas prices was based on the cost of providing the natural gas (i.e., cost of service). Pipeline companies bought gas from producers at a regulated wellhead price, stored their gas and shipped it via their own facilities, and then sold it after transport, bundling the cost of the gas with its shipping and storage costs into a single price. By 1993, the U.S. natural gas industry had largely been deregulated. Wellhead prices were no longer set by the government, and pipeline companies could no longer bundle services but were required to offer transportation and storage services to third parties on a nondiscriminatory basis. Natural gas trade flourished, and multiple pricing points developed across the United States and Canada, the most active and publicized of which is the Henry Hub in Louisiana.
Until 2005, even with no direct linkage between oil prices and natural gas prices, the two tended to move together, with the market prices for oil (in dollars per barrel) and natural gas (in dollars per million Btu) maintaining a relatively stable ratio of around 7:1, with natural gas priced at a slight discount relative to the oil price on a Btu basis.23 However, as oil prices climbed from an average of $56 per barrel in 2005 to an average of $100 per barrel in 2008, the discount for natural gas relative to oil also grew, from the 7:1 ratio in 2005 to 11:1 in 2008. After 2008, the natural gas discount relative to oil widened further, as oil prices remained relatively high while growing U.S. shale gas production helped to weaken natural gas prices. The oil-to-gas price ratio grew to an average of more than 35:1 in 2012, with a Btu of crude oil selling for more than five times the price for a Btu of natural gas.
23 The ratio is calculated as the crude oil price in dollars per barrel divided by the natural gas price in dollars per million Btu. A ratio of around 6:1 indicates price parity between crude oil and natural gas on a Btu basis. A ratio above 6:1 indicates that the natural gas price is at a discount relative to the oil price on a Btu basis.
[492] Webpage: “Gas Pricing.” By Vivek Chandra (author of Fundamentals of Natural Gas, published by Pennwell, the publisher of Oil and Gas Journal and other leading industry books and manuals). Accessed March 11, 2016 at <natgas.info>
A large majority of crude oil is bought and sold directly or indirectly through highly liquid global markets. …
In contrast, because natural gas is difficult to transport, natural gas prices tend to be set locally or regionally. …
The graphic below divides the world gas markets into four groupings …
In the future, natural gas pricing around the world will continue to be divergent and unlinked between markets. As the LNG [liquefied natural gas] industry grows and links more and more markets, there may be some convergence at the margins—however, since a large majority of gas will continue to be transported by pipeline, the overall impact of this will be limited.
[493] Report: “Technically Recoverable Shale Oil and Shale Gas Resources: An Assessment of 137 Shale Formations in 41 Countries Outside the United States.” U.S. Energy Information Administration, June 10, 2013. <www.eia.gov>
Executive Summary (<www.eia.gov>):
EIA [Energy Information Administration] is often asked about the implications of abundant shale resources for natural gas and oil prices. Because markets for natural gas are much less globally integrated than world oil markets, the rapid growth in shale gas production since 2006 has significantly lowered natural gas prices in the United States and Canada compared to prices elsewhere and to prices that would likely have prevailed absent the shale boom.
[494] Report: “Annual Energy Outlook 2013 with Projections to 2040.” U.S. Energy Information Administration, April 2013. <www.osti.gov>
Pages 48–49: “[G]rowing natural gas production … has led to logistical problems in some areas. For example, much of the increased ethane supply in the Marcellus region is stranded because of the distance from petrochemical markets in the Gulf Coast area.”
[495] Article: “On the Rise.” By Thomas Helbling. International Monetary Fund Finance & Development, March 2013. Pages 34–37. <www.imf.org>
Page 35: “Oil markets are sufficiently integrated that prices adjust based on global demand and supply.”
[496] Report: “Rising Gasoline Prices 2012.” By Neelesh Nerurkar and Robert Pirog. Congressional Research Service, March 1, 2012. <fas.org>
Page 5: “Global developments may be difficult to understand from the U.S. perspective, where oil production is rising, demand growth remains weak, and no oil is imported from Iran. However, the market for oil is globally integrated; events anywhere can affect oil prices.”
[497] Dataset: “Natural Gas Prices (Dollars per Thousand Cubic Feet).” U.S. Energy Information Administration, July 29, 2022. <www.eia.gov>
“2021 … Imports Price [=] 3.78 … Residential Price [=] 12.24”
NOTE: After 2011, EIA [Energy Information Administration] stopped publishing the natural gas wellhead price, which provided the only national average production price of natural gas. However, according to EIA, the import price is “a pretty good predictive variable” for the wellhead price.† Hence, Just Facts is using this to approximate the production price. [† Email from the U.S. Energy Information Administration to Just Facts, July 8, 2016.]
[498] Calculated with data from:
a) Dataset: “Natural Gas Prices (Dollars per Thousand Cubic Feet).” U.S. Energy Information Administration, July 29, 2022. <www.eia.gov>
b) Dataset: “CPI—All Urban Consumers (Current Series).” U.S. Department of Labor, Bureau of Labor Statistics. Accessed February 5, 2022 at <www.bls.gov>
“Series Id: CUUR0000SA0; Series Title: All Items in U.S. City Average, All Urban Consumers, Not Seasonally Adjusted; Area: U.S. City Average; Item: All Items; Base Period: 1982–84=100”
NOTES:
[499] Report: “Annual Energy Review 2011.” U.S. Energy Information Administration, Office of Energy Statistics, September 2012. <www.eia.gov>
Page 362:
Natural Gas Wellhead Price: Price of natural gas calculated by dividing the total reported value at the wellhead by the total quantity produced as reported by the appropriate agencies of individual producing States and the U.S. Mineral Management Service. The price includes all costs prior to shipment from the lease, including gathering and compression costs, in addition to State production, severance, and similar charges.
[500] Calculated with data from the report: “July 2022 Monthly Energy Review.” U.S. Energy Information Administration, Office of Energy Statistics, July 26, 2022. <www.eia.gov>
Page 49: “Table 2.6. Electric Power Sector Energy Consumption”
NOTE: An Excel file containing the data and calculations is available upon request.
[501] Booklet: “Energy, Powering Your World.” By M.T. Westra and S. Kuyvenhoven. Foundation for Fundamental Research on Matter, Institute for Plasma Physics, Rijnhuizen (the Netherlands), 2002. <fire.pppl.gov>
Page 27:
In an electrical generator electricity is made by turning a magnet in a magnetic field. The changing magnetic field drives the electrical current. With the exception of solar cells and fuel cells (which are discussed in chapters 4 and 6), all ways of generating electricity in some way drive a generator of this type. For example, fossil fuels are used to heat water into steam, which can be used to power a steam turbine. The steam turbine then drives the electrical generator.
A gas turbine works in a similar way: when the gas is ignited and starts to burn, it expands. The expanding gas is used to power an electrical generator through a turbine. In addition, the heat of the burning gas is then used to make steam, which powers a steam turbine.
This process is called combined cycle, and it has a high efficiency. If the waste heat of the steam turbine is also used, for example by a factory or for household heating, we have a Cogeneration Plant or Combined Heat and Power Plant.
[502] Booklet: “What You Need to Know About Energy.” National Academy of Sciences, 2008. <nap.nationalacademies.org>
A typical coal-fired electrical plant might be 38% efficient, so a little more than one-third of the chemical energy content of the fuel is ultimately converted to usable electricity. …
In natural gas combined cycle, or NGCC, power plants, we now have technology that takes the waste heat from a natural gas turbine and uses it to power a steam turbine, resulting in a power plant that is as much as 60% efficient.5 Similar technologies are being developed for use in coal power plants.
[503] Calculated with data from the report: “July 2022 Monthly Energy Review.” U.S. Energy Information Administration, Office of Energy Statistics, July 26, 2022. <www.eia.gov>
Page 132: “Table 7.2b. Electricity Net Generation: Electric Power Sector (Subset of Table 7.2a; Million Kilowatthours)” <www.eia.gov>
NOTE: An Excel file containing the data and calculations is available upon request.
[504] Calculated with data from the report: “Electric Power Monthly with Data for January 2022.” U.S. Energy Information Administration, Office of Energy Statistics, March 24, 2022. <www.eia.gov>
Page 17 (of PDF): “Table 1.1. Net Generation by Energy Source: Total (All Sectors), 2012–January 2022 (Thousand Megawatthours)”
Page 18 (of PDF): “Table 1.1.A. Net Generation from Renewable Sources: Total (All Sectors), 2012–January 2022 (Thousand Megawatthours)”
NOTES:
[505] “Kansas Energy Report 2009.” Kansas Energy Council, January 7, 2009. <www.justfacts.com>
Page 26:
Electricity peak loads in Kansas are the greatest during the summer months, primarily due to the electricity needs of air-conditioning systems. …
In order to cost-effectively meet the varying demand of their customers at different times of the year and even different times of the day, most utilities maintain a diverse portfolio of electric power plants (e.g., generating units) that use a variety of fuels. These generating units can be distinguished according to the type of power they produce (firm vs. intermittent) as well as the type of load they are designed to meet (base, peak, or intermediate).
[506] Webpage: “Demand for Electricity Changes Through the Day.” U.S. Energy Information Administration, April 6, 2011. <www.eia.gov>
“Electric power systems must match generation and load in real time, with tight tolerances. As a result, both system stress and prices can vary considerably throughout the day. … Load curve shapes vary among regions and change with the season of the year.”
[507] Report: “Methods for Analyzing Electric Load Shape and Its Variability.” By P. Price. Ernest Orlando Lawrence Berkeley National Laboratory, Environmental Energy Technologies Division, May 2010. <eta-publications.lbl.gov>
Page 1:
“Whole-building electric load” is the total electrical power used by a building at a given moment. The load changes with time in response to changes in lighting levels; heating, ventilating, and air conditioning (HVAC) requirements; and uses such as computers, copy machines, and so on. The curve that represents load as a function of time, called the “load shape,” can often yield useful information. Unexpectedly high night-time loads may indicate waste (such as lights that needlessly remain on when the building is unoccupied); a change in load shape may indicate an equipment or thermostat malfunction; unexpectedly high sensitivity to outdoor temperature may indicate that excessive outdoor air is being brought into the building by the HVAC system; and so on.
[508] “Kansas Energy Report 2009.” Kansas Energy Council, January 7, 2009. <www.justfacts.com>
Page 26:
Electricity consumption (also called “load”) is divided into three categories: base, peak, and intermediate load. Base load refers to demand that occurs continuously, day and night, seven days a week. Peak load, on the other hand, refers to maximum demand that occurs within a given period of time. Intermediate load is a more generic term applied to demand that occurs between base and peak load.
[509] Webpage: “Glossary.” U.S. Energy Information Administration. Accessed July 18, 2013 at <www.eia.gov>
Peak load: the maximum load during a specified period of time.
Base load: the minimum amount of electric power delivered or required over a given period of time at a steady rate.
Base load capacity: the generating equipment normally operated to serve loads on an around-the-clock basis.
Base load plant: A plant, usually housing high-efficiency steam-electric units, which is normally operated to take all or part of the minimum load of a system, and which consequently produces electricity at an essentially constant rate and runs continuously. These units are operated to maximize system mechanical and thermal efficiency and minimize system operating costs.
[510] Report: “Methods for Analyzing Electric Load Shape and Its Variability.” By P. Price. Ernest Orlando Lawrence Berkeley National Laboratory, Environmental Energy Technologies Division, May 2010. <eta-publications.lbl.gov>
Page 22: “Figure 15: Sketch indicating five parameters that we recommend as a minimum set to characterize load shape. The value of each parameter can be calculated for each day; these values can then be summarized (e.g. average peak load, standard deviation of peak load).”
[511] Book: Fundamentals of Natural Gas. By Vivek Chandra. Pennwell, 2006. <vdoc.pub>
“The development of IPPs [Independent Power Producers] and the increased efficiency of gas-fired combined cycle plants have allowed gas to become the fuel of choice in both intermediate and peak load phases.”
[512] Report: “Annual Energy Outlook 2013 with Projections to 2040.” U.S. Energy Information Administration, April 2013. <www.osti.gov>
Page 44:
In general, [natural gas] combined-cycle units are considered to be more flexible than steam turbines. They can ramp their output up and down more easily, and their start-up and shutdown procedures involve less time and expense. However, plants that are operated more flexibly (i.e., ramping up and down and cycling on and off) often have higher maintenance requirements and higher maintenance costs.
[513] Report: “Nuclear Power’s Role in Generating Electricity.” Congressional Budget Office, May 2008. <www.cbo.gov>
Page 2: “Even though natural gas prices have increased significantly in recent years, natural gas remains the dominant source of peak capacity because power plants using that fuel are less expensive to build than coal-fired plants or nuclear reactors and easier to start up and shut down.”
[514] Webpage: “Demand for Electricity Changes Through the Day.” U.S. Energy Information Administration, April 6, 2011. <www.eia.gov>
The transition from relatively lower loads to higher loads in the morning is called the “morning ramp”. This transition can stress power systems and lead to volatile prices. … Responding to such load changes often requires using units that can start up quickly. These units can be more expensive to operate than units that stay on for long periods such as baseload units. Power prices can increase during ramping, sometimes considerably, for short periods.
[515] Report: “Nuclear Power’s Role in Generating Electricity.” Congressional Budget Office, May 2008. <www.cbo.gov>
Page 2: “Historically, most base-load capacity has been provided using coal or nuclear technologies because, once the plants have been built, low fuel costs make them relatively cheap to operate continuously.”
Page 4: “Pulverized coal power plants, which burn solid coal ignited by injected air, are by far the most common option for generating base-load electricity.”
[516] “Kansas Energy Report 2009.” Kansas Energy Council, January 7, 2009. <www.justfacts.com>
Page 27:
Power plants that are used to meet the minimum or “base load” of the system are referred to as base-load generating units; they are run continuously and operated, in general, so as to produce electricity at a constant rate. Base-load units are operated to maximize system mechanical and thermal efficiency and minimize system operating costs. Costs are minimized by operating units with the lowest fuel costs for the most hours in the year (i.e., at a high capacity factor). Generally, base-load units include nuclear, coal-fired, geothermal, hydropower, and waste-to-energy plants.63
[517] Book: Fundamentals of Natural Gas. By Vivek Chandra. Pennwell, 2006. <vdoc.pub>
Coal remains the dominant fuel for the world’s thermal electric power plants. … Coal has been the main thermal electric fuel due to its cheap price, worldwide availability, easy transport, and low-technology threshold. Coal’s biggest drawback is the pollution emitted from its combustion. …
Typically, base load power stations are large nuclear, hydroelectric, or coal-burning plants that are expensive to build, with high fixed costs. However, they are cheap to maintain and operate. They operate continuously and are difficult to switch on or off.
[518] Brief: “What Is the Role of Coal in the United States?” U.S. Energy Information Administration. Last updated July 18, 2012. <www.eia.gov>
“In 2009, coal began losing its price advantage over natural gas for electricity generation in some parts of the country, particularly in the eastern United States as a surge in natural gas production from domestic shale deposits (made possible by advances in drilling technologies) substantially reduced the price of natural gas.”
[519] Article: “On the Rise.” By Thomas Helbling. International Monetary Fund Finance & Development, March 2013. Pages 34–37. <www.imf.org>
Page 36: “The main increased usage of gas has occurred in the U.S. power sector, where the share of electricity produced with natural gas has started to rise because many power plants can switch between gas and the now relatively more expensive (and dirtier) coal.”
[520] Report: “Natural Gas-Electricity Primer.” By Randy Friedman and others. Pacific Northwest Utilities Conference Committee/Northwest Natural Gas Association Planning Task Force, August 2012. <docplayer.net>
Page 3:
In the United States, over the past decade, the single largest sector of natural gas demand growth has occurred in the area of power generation. As emissions from coal-fired power plants have come under increasing public scrutiny, more and more electric utilities and merchant power producers have turned to natural gas for new baseload and peaking generation. This trend has been accelerated in recent years, due to the boom of shale gas production, the relatively short lead time and low cost of natural gas-fired power plant construction, and the robust flexibility that natural gas-fired plants can bring to the area of Variable Energy Resource (VER) integration (i.e., wind and solar).
[521] Report: “Annual Energy Outlook 2013 with Projections to 2040.” U.S. Energy Information Administration, April 2013. <www.osti.gov>
Page 39:
Over the past 20 years, natural gas has been the go-to fuel for new electricity generation capacity. From 1990 to 2011, natural gas-fired plants accounted for 77 percent of all generating capacity additions, and many of the plants added were very efficient combined-cycle plants. However, with slow growth in electricity demand and spikes in natural gas prices between 2005 and 2008, much of the added capacity was used infrequently. Since 2009 natural gas prices have been relatively low, making efficient natural gas-fired combined-cycle plants increasingly competitive to operate in comparison with existing coal-fired plants, particularly in the Southeast and other regions where they have been used to meet demand formerly served by coal-fired plants. In 2012, as natural gas prices reached historic lows, there were many months when natural gas displacement of coal-fired generation was widespread nationally. …
At any point, short-term competition between existing coal- and gas-fired generators—i.e., the decisions determining which generators will be dispatched to generate electricity—depends largely on the relative operating costs for each type of generation, of which fuel costs are a major portion. A second aspect of competition occurs over the longer term, as developers choose which fuels and technologies to use for new capacity builds and whether or not to make mandated or optional upgrades to existing plants. The natural gas or coal share of total generation depends both on the available capacity of each fuel type (affected by the latter type of competition) and on how intensively the capacity is operated. …
In recent years, natural gas has come into dispatch-level competition with coal as the cost of operating natural gas-fired generators has neared the cost of operating coal-fired generators. A number of factors led to the growing competition, including:
• A build-out of efficient combined-cycle capacity during the early 2000s, which in general was used infrequently until recently
• Expansion of the natural gas pipeline network, reducing uncertainty about the availability of natural gas
• Gains in natural gas production from domestic shale formations that have contributed to falling natural gas prices
• Rising coal prices.
Until mid-2008, coal-fired generators were cheaper to operate than natural gas-fired generators in most applications and regions. Competition between available natural gas combined-cycle generators (NGCC) and generators burning eastern (Appalachian) and imported coal began in southeastern electric markets in 2009. Rough parity between NGCC and more expensive coal-fired plants continued until late 2011, when increased natural gas production led to a decline in the fuel price and, in the spring of 2012, a dramatic increase in competition between natural gas and even less expensive types of coal. With natural gas-fired generation increasing steadily, the natural gas share of U.S. electric power sector electricity generation was almost equal to the coal share for the first time in April 2012.
Page 41:
Coal and natural gas prices are key factors in the decision to retire a power plant, along with environmental regulations and the demand for electricity. … The interaction of fuel prices and environmental rules is a key factor in coal plant retirements. AEO2013 [Annual Energy Outlook 2013] assumes that all coal-fired plants have flue gas desulfurization equipment (scrubbers) or dry sorbent injection systems installed by 2016 to comply with the Mercury and Air Toxics Standards. Higher coal prices, lower wholesale electricity prices (often tied to natural gas prices), and reduced use may make investment in such equipment uneconomical in some cases, resulting in plant retirements. …
For new builds, natural gas and renewables generally are more competitive than coal, and concerns surrounding potential future GHG [greenhouse gas] legislation also dampen interest in new coal-fired capacity82. New capacity additions are not the most important factor in the competition between coal and natural gas for electricity generation. There is also significant dispatch-level competition in determining how intensively to operate existing coal-fired power plants versus new and existing natural gas-fired plants.
Page 44:
In addition to relative fuel prices, a number of factors influence the competition between coal-fired steam turbines and natural gas-fired combined-cycle units. One factor in the dispatch-level competition is the availability of capacity of each type. In New England, for example, competition between coal and natural gas is not discussed, because very little coal-fired capacity exists or is projected to be built in that region…. New England is located far from coal sources, and a regional cap on GHG emissions is in place, which makes investment in new coal-fired capacity unlikely. …
… Another component of operating costs not mentioned above is the cost of buying emissions allowances for plants covered by the Acid Rain Program and Clean Air Interstate Rule. In recent years, allowance prices have dropped to levels that make them essentially negligible, although for many years they were a significant component of operating costs.
[522] Report: “Annual Energy Outlook 2013 with Projections to 2040.” U.S. Energy Information Administration, April 2013. <www.osti.gov>
Page 3:
Although coal is expected to continue its important role in U.S. electricity generation, there are many uncertainties that could affect future outcomes. Chief among them are the relationship between coal and natural gas prices and the potential for policies aimed at reducing greenhouse gas (GHG) emissions. In 2012, natural gas prices were low enough for a few months for power companies to run natural gas-fired generation plants more economically than coal plants in many areas. During those months, coal and natural gas were nearly tied in providing the largest share of total electricity generation, something that had never happened before.
Page 40:
The difference between average annual prices per million Btu for natural gas and coal delivered to U.S. electric power plants narrowed substantially in 2012, so that the fuel costs of generating power from NGCC [natural gas combined cycle] units and coal steam turbines per megawatthour were essentially equal on a national average basis (Figure 26), given that combined-cycle plants are much more efficient than coal-fired plants. When the ratio of natural gas prices to coal prices is approximately 1.5 or lower, a typical natural gas-fired combined-cycle plant has lower generating costs than a typical coal-fired plant. … Because fuel prices vary by region, and because there is also considerable variation in efficiencies across the existing fleet of both coal-fired and combined-cycle plants, dispatch-level competition between coal and natural gas continues.
Page 43: “The delivered cost of coal in the [southeastern United States] region is somewhat higher than in many other regions. Central Appalachian and Illinois Basin coals must be transported by rail or barge to the Southeast, and coal from the Powder River Basin must travel great distances by rail. The region also uses some imported coal, typically along the Gulf Coast, which tends to be more expensive.”
Page 44:
In addition to relative fuel prices, a number of factors influence the competition between coal-fired steam turbines and natural gas-fired combined-cycle units. One factor in the dispatch-level competition is the availability of capacity of each type. In New England, for example, competition between coal and natural gas is not discussed, because very little coal-fired capacity exists or is projected to be built in that region…. New England is located far from coal sources, and a regional cap on GHG emissions is in place, which makes investment in new coal-fired capacity unlikely.
NOTE: The next footnote documents that natural gas is currently about 2.5 times the price of coal, which is higher than the breakeven point for being competitive with coal in generating baseload power.
[523] Calculated with data from the report: “July 2022 Monthly Energy Review.” U.S. Energy Information Administration, Office of Energy Statistics, July 26, 2022. <www.eia.gov>
Page 169: “Table 9.9. Cost of Fossil-Fuel Receipts at Electric Generating Plants (Dollars per Million Btu, Including Taxes)”
NOTES:
[524] Article: “Natural Gas-Fired Power Plants Are Being Added and Used More in PJM Interconnection.” U.S. Energy Information Administration, October 17, 2018. <www.eia.gov>
Higher capacity factors for natural gas-fired combined-cycle generators in recent years also indicate a fundamental shift in day-to-day operations of these power plants. Natural gas-fired generators were traditionally used as either intermediate load following (cycling) or peaking resources. In recent years, however, combined-cycle power plants have become more competitive with coal-fired plants for baseload operations and have led to increasing retirements of coal plants.
[525] Article: “U.S. Natural Gas Consumption Sets New Record in 2019.” U.S. Energy Information Administration, March 3, 2020. <www.eia.gov>
Natural gas continues to account for the largest share of electricity generation after first surpassing coal-fired generation on an annual basis in 2016. In 2019, natural gas accounted for 38% of total electricity generation, followed by 23% for coal and 20% for nuclear. New natural gas generation capacity additions have continued to displace coal-fired power plants; about 5% of the total existing U.S. coal-fired capacity was retired in 2019. …
The electric power sector has been shifting toward natural gas in the past decade because of competitive natural gas prices and power plant technology improvements.
[526] Article: “More Power Generation Came From Natural Gas in First Half of 2020 Than First Half of 2019.” By Stephen York and Mark Morey. U.S. Energy Information Administration, August 12, 2020. <www.eia.gov>
Natural gas-fired generation in the Lower 48 states increased nearly 55,000 gigawatthours (GWh), or 9%, in the first half of 2020 compared with the first half of 2019. …
Coal-fired generation absorbed most of the decrease in electrical load in the first half of 2020, registering a 138,000 GWh (30%) decline in output. Because of historically low natural gas prices so far in 2020, coal-fired generation this year has been uneconomical in most regions compared with natural gas-fired generation, leading to price-driven coal-to-natural gas fuel switching. …
Coal-to-natural gas switching was most prominent in the PJM Interconnection (PJM), which covers an area stretching from New Jersey to Illinois, and the Midcontinent Independent System Operator (MISO), which primarily includes areas in the Midwest. PJM and MISO together account for about 35% of the total Lower 48 states’ electric power generation. In both interconnections, competition exists between natural gas and coal as generation fuels, so relative shifts in fuel prices can influence the type of power plant that is dispatched.
… In addition, coal-fired generation remains reasonably competitive in ERCOT [Electric Reliability Council of Texas] because power plants have access to low-cost subbituminous coal from Wyoming’s Powder River Basin and to lignite—the lowest quality of coal—produced at mines near several plants.
Capacity additions have also contributed to the growth in natural gas-fired generation. According to the Electric Power Monthly, about 18,000 megawatts (MW) of net capacity from new combined-cycle natural gas turbine plants has entered service since 2018. Output from these highly efficient plants has been steadily ramping up and helping to drive increases in generation.
[527] Report: “Short-Term Energy Outlook.” U.S. Energy Information Administration, August 2022. <www.eia.gov>
Page 2:
U.S. consumption of natural gas in our forecast averages 85.2 Bcf/d in 2022, up 3% from 2021. Consumption in the electric power sector continues to increase as a result of limited switching from natural gas-fired generators to coal-fired generators for power generation, despite elevated natural gas prices. In addition, rising U.S. natural gas consumption reflects increased consumption in the residential and commercial sectors as a result of colder temperatures on average in 2022 than in 2021. We forecast that natural gas consumption will average 83.8 Bcf/d in 2023, about 1.3 Bcf/d (2%) lower than in 2022.
[528] Booklet: “Energy, Powering Your World.” By M.T. Westra and S. Kuyvenhoven. Foundation for Fundamental Research on Matter, Institute for Plasma Physics, Rijnhuizen (the Netherlands), 2002. <fire.pppl.gov>
Page 27:
In an electrical generator electricity is made by turning a magnet in a magnetic field. The changing magnetic field drives the electrical current. With the exception of solar cells and fuel cells (which are discussed in chapters 4 and 6), all ways of generating electricity in some way drive a generator of this type. For example, fossil fuels are used to heat water into steam, which can be used to power a steam turbine. The steam turbine then drives the electrical generator.
A gas turbine works in a similar way: when the gas is ignited and starts to burn, it expands. The expanding gas is used to power an electrical generator through a turbine. In addition, the heat of the burning gas is then used to make steam, which powers a steam turbine.
This process is called combined cycle, and it has a high efficiency. If the waste heat of the steam turbine is also used, for example by a factory or for household heating, we have a Cogeneration Plant or Combined Heat and Power Plant.
[529] Report: “Annual Energy Outlook 2013 with Projections to 2040.” U.S. Energy Information Administration, April 2013. <www.osti.gov>
Page 40:
The difference between average annual prices per million Btu for natural gas and coal delivered to U.S. electric power plants narrowed substantially in 2012, so that the fuel costs of generating power from NGCC [natural gas combined cycle] units and coal steam turbines per megawatthour were essentially equal on a national average basis (Figure 26), given that combined-cycle plants are much more efficient than coal-fired plants. When the ratio of natural gas prices to coal prices is approximately 1.5 or lower, a typical natural gas-fired combined-cycle plant has lower generating costs than a typical coal-fired plant.
[530] Booklet: “What You Need to Know About Energy.” National Academy of Sciences, 2008. <nap.nationalacademies.org>
A typical coal-fired electrical plant might be 38% efficient, so a little more than one-third of the chemical energy content of the fuel is ultimately converted to usable electricity. …
In natural gas combined cycle, or NGCC [natural gas combined cycle], power plants, we now have technology that takes the waste heat from a natural gas turbine and uses it to power a steam turbine, resulting in a power plant that is as much as 60% efficient.5 Similar technologies are being developed for use in coal power plants.
[531] Calculated with data from the report: “July 2022 Monthly Energy Review.” U.S. Energy Information Administration, Office of Energy Statistics, July 26, 2022. <www.eia.gov>
Page 169: “Table 9.9. Cost of Fossil-Fuel Receipts at Electric Generating Plants (Dollars per Million Btua, Including Taxes)”
NOTE: An Excel file containing the data and calculations is available upon request.
[532] Dataset: “U.S. Energy Consumption by Source and Sector, 2021 (Quadrillion Btu).” U.S. Energy Information Administration, Office of Energy Statistics, April 2022. <www.eia.gov>
“Natural Gas … Transportation [=] 4%”
[533] Report: “Information on Shale Resources, Development, and Environmental and Public Health Risks.” U.S. Government Accountability Office, September 5, 2012. <www.gao.gov>
Pages 31–32:
The growth in production of shale gas has increased the overall supply of natural gas in the U.S. energy market. Since 2007, increased shale gas production has contributed to lower prices for consumers…. These lower prices create incentives for wider use of natural gas in other industries. For example, several reports by government, industry, and others have observed that if natural gas prices remain low, natural gas is more likely to be used to power cars and trucks in the future.
[534] Article: “On the Rise.” By Thomas Helbling. International Monetary Fund Finance & Development, March 2013. Pages 34–37. <www.imf.org>
Page 36:
But in the longer term, there is potential for other industries to switch to natural gas—even transportation, because natural gas can be used in internal combustion engines, which now rely mainly on refined petroleum products such as gasoline or diesel fuel. …
If there is widespread substitution of natural gas for petroleum products, global oil markets would be affected. The price incentives are there. On an energy-equivalent basis, natural gas prices are a fraction of gasoline or diesel prices in the United States. The price incentives are reinforced by the prospective abundance of natural gas.
[535] Article: “U.S. Gas Fields Go From Bust to Boom.” By Ben Casselman. Wall Street Journal, April 30, 2009. <online.wsj.com>
Mr. [T. Boone] Pickens has spent millions promoting an energy plan that aims to, among other things, convert thousands of big-rig trucks to run on natural gas. Mr. Pickens has large investments in natural gas and stands to benefit if his plan is adopted. In TV ads, Internet videos and speeches, he emphasizes a different goal: reducing U.S. dependence on foreign oil. …
Some environmentalists have embraced Mr. Pickens’s plan as a way to fight climate change. Carl Pope, executive director of the Sierra Club, says he sees natural gas as a “bridge fuel” that could help the U.S. burn less coal and oil until renewable sources of energy are ready to take over. …
Some environmental groups, including the Natural Resources Defense Council, have argued that natural gas is better used to replace coal for power generation, and that cars should run on electricity generated by the sun, wind and natural gas.
[536] Book: Fundamentals of Natural Gas. By Vivek Chandra. Pennwell, 2006. <vdoc.pub>
“Studies indicate that vehicles operating on natural gas versus conventional fuels such as gasoline and diesel fuels can reduce CO [carbon monoxide] output by 90% to 97% and CO2 [carbon dioxide] by 25%. The switch can also significantly reduce NOX [nitrogen oxides] emissions, as well as nonhydrocarbon emissions and particulates.”
[537] Article: “Oil Prices: What to Make of the Volatility.” By Clifford Krauss. New York Times, June 14, 2017. <www.nytimes.com>
Over the last two and a half years, the oil industry has experienced its deepest downturn since at least the 1990s. …
Executives say they think it will be years before oil returns to $90 or $100 a barrel, which was pretty much the norm until the price collapse in late 2014.
[538] Article: “Honda Civic Hybrid, Natural-Gas Models Eliminated After 2015.” By John Voelcker. Green Car Reports, June 16, 2015. <www.greencarreports.com>
[T]wo members of today’s Civic lineup won’t survive into the new generation: the Honda Civic Hybrid, and the Honda Civic Natural Gas.
Honda executive vice-president John Mendel revealed that both models would be discontinued in a business update briefing for media yesterday. …
He … said Honda will cancel the Civic Natural Gas model (nee Civic GL).
The elimination is due to a combination of low gasoline prices—which have eliminated the price advantage of natural gas in many markets—and a lack of interest on the part of consumers.
[539] Article: “Honda to Discontinue CNG and Hybrid Civic Models.” By Mike Ramsey. Wall Street Journal, June 15, 2015. <www.wsj.com>
Mr. Mendel [executive vice president of American Honda] said the company has sold about 16,000 Civic CNG [compressed natural gas] models since 1998. “We tried and tried and tried, but we just didn’t see the uptake,” he said.
The recent decline in gasoline prices has reduced the price advantage of natural gas. Plus, he said, the scarcity of refueling stations became too much of a sales hurdle.
[540] Book: Fundamentals of Natural Gas. By Vivek Chandra. Pennwell, 2006. <vdoc.pub>
“Though the benefits of natural gas as a transport fuel are well-known, growth in direct natural gas usage in the transportation sector has been slow to materialize. … Fuel supply infrastructure around the world heavily favors reliance on traditional liquid fuels, making conversion to natural gas difficult.”
[541] Article: “U.S. Gas Fields Go From Bust to Boom.” By Ben Casselman. Wall Street Journal, April 30, 2009. <online.wsj.com>
“Energy Secretary Steven Chu and some other policy makers have expressed doubts about the practicality of retrofitting hundreds of thousands of service stations to offer natural gas.”
[542] Article: “On the Rise.” By Thomas Helbling. International Monetary Fund Finance & Development, March 2013. Pages 34–37. <www.imf.org>
Page 36: “A switch to greater use of natural gas typically involves investment, which is attractive only if natural gas prices remain relatively lower over the life of a project.”
[543] Review: “2012 Honda Civic Natural Gas.” By Michael Austin. Car and Driver, March 2012. <www.caranddriver.com>
[T]here are large sections of Michigan without any CNG [compressed natural gas] filling stations, a pattern echoed throughout the country…. That means the Civic CNG, from a practical standpoint, can only be operated on a 200-mile tether from your local filling station (or your own pump, if you’re a fleet owner) unless you live in CNG-heavy areas such as the Eastern Seaboard or California.
[544] Report: “A Primer on Alternative Transportation Fuels.” By Timothy Coffey. National Defense University, Center for Technology and National Security Policy, September 2010. <apps.dtic.mil>
Page 25:
Table 6. Energy content and chemical composition of several energy sources referenced to gasoline. The bracket < > indicates the average chemical formula. (Source: modified from Coffey et al.7)
[545] Webpage: “Few Transportation Fuels Surpass the Energy Densities of Gasoline and Diesel.” U.S. Energy Information Administration, February 14, 2013. <www.eia.gov>
Energy density and the cost, weight, and size of onboard energy storage are important characteristics of fuels for transportation. Fuels that require large, heavy, or expensive storage can reduce the space available to convey people and freight, weigh down a vehicle (making it operate less efficiently), or make it too costly to operate, even after taking account of cheaper fuels. Compared to gasoline and diesel, other options may have more energy per unit weight, but none have more energy per unit volume.
On an equivalent energy basis, motor gasoline (which contains up to 10% ethanol) was estimated to account for 99% of light-duty vehicle fuel consumption in 2012. Over half of the remaining 1% was from diesel; all other fuels combined for less than half of 1%. The widespread use of these fuels is largely explained by their energy density and ease of onboard storage, as no other fuels provide more energy within a given unit of volume.
The chart above compares energy densities (both per unit volume and per unit weight) for several transportation fuels that are available throughout the United States. The data points represent the energy content per unit volume or weight of the fuels themselves, not including the storage tanks or other equipment that the fuels require. For instance, compressed fuels require heavy storage tanks, while cooled fuels require equipment to maintain low temperatures.
[546] Review: “2012 Honda Civic Natural Gas.” By Michael Austin. Car and Driver, March 2012. <www.caranddriver.com>
“It’s a Honda Civic that runs on compressed natural gas (CNG). In fact, it’s the only factory-built CNG car in the country available to nonfleet customers.”
[547] Webpage: “Civic Natural Gas—Frequently Asked Questions.” American Honda Motor Company. Accessed September 4, 2013 at <automobiles.honda.com>
“In fact, the Civic Natural Gas is the cleanest internal-combustion vehicle ever tested by the U.S. Environmental Protection Agency2. … 2 Tier-2, Bin-2 and ILEV [inherently low emission vehicle] certification as of December 2013.”
[548] Calculated with data from:
a) Review: “2012 Honda Civic NG.” By Wayne Cunningham. CNET, May 11, 2012. <reviews.cnet.com>
“A Civic EX-L goes an average of 422 miles on a full tank, while the Natural Gas version can only go, on average, 248 miles after its tanks have been topped off.”
b) Review: “2012 Honda Civic Natural Gas.” By Michael Austin. Car and Driver, March 2012. <www.caranddriver.com>
“In energy equivalence, the Civic CNG [compressed natural gas] holds about eight gasoline gallons’ worth of fuel. Honda lists a conservative range estimate of 220 miles.”
CALCULATIONS:
[549] Calculated with data from:
a) Webpage: “Civic – Engineering.” American Honda Motor Company. Accessed September 4, 2013 at <automobiles.honda.com>
“EX … Horsepower @ rpm (SAE [Society of Automotive Engineers] net) [=] 140 @ 6500”
b) Webpage: “Civic Natural Gas—Engineering.” American Honda Motor Company. Accessed September 4, 2013 at <automobiles.honda.com>
“Horsepower @ rpm (SAE net) [=] 110 @ 6500”
CALCULATION: (140 – 110) / 140 = 21%
[550] Calculated with data from:
a) Webpage: “Civic – Engineering.” American Honda Motor Company. Accessed September 4, 2013 at <automobiles.honda.com>
“EX … Torque (lb-ft @ rpm) [=] 128 @ 4300”
b) Webpage: “Civic Natural Gas—Engineering.” American Honda Motor Company. Accessed September 4, 2013 at <automobiles.honda.com>
“Torque (lb-ft @ rpm) [=] 106 @ 4300”
CALCULATION: (128 – 106) / 128 = 17%
[551] Calculated with data from:
a) Webpage: “Civic – Engineering.” American Honda Motor Company. Accessed September 4, 2013 at <automobiles.honda.com>
“EX … Cargo Volume (cu. ft.) [=] 12.5”
b) Webpage: “Civic Natural Gas—Engineering.” American Honda Motor Company. Accessed September 4, 2013 at <automobiles.honda.com>
“Cargo Volume (cu. ft.) [=] 6.1”
CALCULATION: (12.5 – 6.1) / 12.5 = 51%
[552] Review: “2012 Honda Civic Natural Gas.” By Michael Austin. Car and Driver, March 2012. <www.caranddriver.com>
“Honda charges $5,650 more than for a similarly equipped Civic EX, or $26,925.”
CALCULATION: ($26,925 – ($26,925 – $5650)) / ($26,925 – $5650) = 27%
[553] Calculated with data from:
a) Webpage: “Civic Natural Gas—Engineering.” American Honda Motor Company. Accessed September 4, 2013 at <automobiles.honda.com>
b) Webpage: “Civic—Engineering.” American Honda Motor Company. Accessed September 4, 2013 at <automobiles.honda.com>
c) “Clean Cities Alternative Fuel Price Report.” U.S. Department of Energy, August 1, 2013. <www.afdc.energy.gov>
NOTE: An Excel file containing the data and calculations is available upon request.
[554] Calculated with data from:
a) Webpage: “Civic—EPA Mileage Ratings3/Fuel.” American Honda Motor Company. Accessed March 14, 2016 at <automobiles.honda.com>
b) Webpage: “Build Your Civic Sedan.” American Honda Motor Company. Accessed March 14, 2016 at <automobiles.honda.com>
c) Webpage: “Civic Natural Gas—Specifications.” American Honda Motor Company. Accessed March 14, 2016 at <automobiles.honda.com>
d) “Clean Cities Alternative Fuel Price Report, January 2015.” U.S. Department of Energy, March 17, 2015. <www.afdc.energy.gov>
e) “Clean Cities Alternative Fuel Price Report, April 2015.” U.S. Department of Energy, May 28, 2015. <www.afdc.energy.gov>
f) “Clean Cities Alternative Fuel Price Report, July 2015.” U.S. Department of Energy, July 31, 2015. <www.afdc.energy.gov>
g) “Clean Cities Alternative Fuel Price Report, October 2015.” U.S. Department of Energy, December 10, 2015. <www.afdc.energy.gov>
NOTE: An Excel file containing the data and calculations is available upon request.
[555] Article: “Honda Civic Hybrid, Natural-Gas Models Eliminated After 2015.” By John Voelcker. Green Car Reports, June 16, 2015. <www.greencarreports.com>
[T]wo members of today’s Civic lineup won’t survive into the new generation: the Honda Civic Hybrid, and the Honda Civic Natural Gas.
Honda executive vice-president John Mendel revealed that both models would be discontinued in a business update briefing for media yesterday. …
He … said Honda will cancel the Civic Natural Gas model (nee Civic GL).
The elimination is due to a combination of low gasoline prices—which have eliminated the price advantage of natural gas in many markets—and a lack of interest on the part of consumers.
The Civic Natural Gas, which is assembled on the same line as other North American Civics, has sold at an annual rate of just 700 cars in recent years.
Mendel expressed some frustration over the car’s fate.
“Honda has promoted CNG [compressed natural gas] for many years, but customer demand remains quite small,” he said, “and there appears to be no real appetite on the part of competitors or policymakers to promoting it.”
“That, plus the negligible price different, mean that consumer demand just hadn’t developed as Honda hoped—and there seems little likelihood that the situation will change in coming years.”
[556] Webpage: “Fundamentals of Natural Gas: An International Perspective (2nd edition).” Pennwell Books. Accessed August 24, 2022 at <www.pennwellbooks.com>
Vivek Chandra is the CEO and Founder of Texas LNG [liquified natural gas]….
Mr. Chandra’s extensive 28+ years international gas experience includes roles as independent LNG consultant, senior commercial executive with an Australian energy company, development of gas projects in the Middle East, and diverse experiences with ARCO in the United States, including Alaska, and offshore field engineering with Schlumberger in SE Asia, Middle East and US. He has worked on commercial matters with LNG import, LNG export, as well as gas pipeline export projects.
He has degrees in Geophysical Engineering, Energy Management, Petroleum Economics and in Commercial Law. He is teaches the popular “Natural Gas Dynamics” executive course which has been held over 28 times in 6 continents as well as an online completed by over 200 students, and has developed mobile apps for the natural gas industry.
[557] Webpage: “Gas Usage.” By Vivek Chandra. Accessed April 12, 2018 at <natgas.info>
Natural gas holds the greatest promise as a fuel for fleet vehicles that refuel at a central location, such as transit buses, short-haul delivery vehicles, taxis, government cars, and light trucks. There are currently approximately 65,000 natural gas vehicles (NGVs) in operation in the United States using CNG [compressed natural gas] and LNG [liquefied natural gas] as their main fuels. There are an estimated 10–20 million vehicles around the world that use CNG and LPG [liquefied petroleum gas] as their primary fuel. Notable countries are (Argentina, Pakistan, Brazil, Italy, India, Iran, US (for CNG) and Italy, Australia and Japan (for LPG vehicles).
[558] Webpage: “Civic Natural Gas—Frequently Asked Questions.” American Honda Motor Company. Accessed March 17, 2016 at <automobiles.honda.com>
Because of moisture and other contaminants inherent in some natural gas supplies, and the inability of some home refueling systems to adequately dry the gas and remove contaminants, Honda does not currently recommend home refueling….
If your vehicle needs repair and, after being examined by an authorized Honda Civic Natural Gas automobile dealer, is found to have contamination in the fuel system or damage to the fuel system as a result of using sub-standard natural gas, your warranty claim for repairs may be denied.
[559] Report: “Information on Shale Resources, Development, and Environmental and Public Health Risks.” U.S. Government Accountability Office, September 5, 2012. <www.gao.gov>
Page 5: “Oil and natural gas are found in a variety of geologic formations. Conventional oil and natural gas are found in deep, porous rock or reservoirs and can flow under natural pressure to the surface after drilling.”
[560] Article: “On the Rise.” By Thomas Helbling. International Monetary Fund Finance & Development, March 2013. Pages 34–37. <www.imf.org>
Page 35: “Oil and gas have long been produced from what are now called ‘conventional sources’: wells are drilled into the earth’s surface, and pressure that is naturally present in the field—possibly with help from pumps—is used to bring the fuel to the surface.”
[561] Report: “Information on Shale Resources, Development, and Environmental and Public Health Risks.” U.S. Government Accountability Office, September 5, 2012. <www.gao.gov>
Page 1: “Shale is a sedimentary rock that is predominantly composed of consolidated clay-sized particles.”
Pages 5–6:
In contrast to the free-flowing resources found in conventional formations, the low permeability of some formations, including shale, means that oil and gas trapped in the formation cannot move easily within the rock. … [T]o extract shale oil and gas from the rock, fluids and proppants (usually sand or ceramic beads used to hold fractures open in the formation) are injected under high pressure to create and maintain fractures to increase permeability, thus allowing oil or gas to be extracted. Other formations, such as coalbed methane formations and tight sandstone formations,12 may also require stimulation to allow oil or gas to be extracted.13 …
The process to develop shale oil and gas is similar to the process for conventional onshore oil and gas, but shale formations may rely on the use of horizontal drilling and hydraulic fracturing—which may or may not be used on conventional wells.
12 Conventional sandstone has well-connected pores, but tight sandstone has irregularly distributed and poorly connected pores. Due to this low connectivity or permeability, gas trapped within tight sandstone is not easily produced.
13 For coalbed methane formations, the reduction in pressure needed to extract gas is achieved through dewatering. As water is pumped out of the coal seams, reservoir pressure decreases, allowing the natural gas to release (desorb) from the surface of the coal and flow through natural fracture networks into the well.
[562] Article: “On the Rise.” By Thomas Helbling. International Monetary Fund Finance & Development, March 2013. Pages 34–37. <www.imf.org>
Page 35:
Other geological structures in the United States—shale rock and tight sand formations—have long been known to contain oil and gas. But the fuels are trapped in these formations and cannot be extracted in the same way as from conventional sources. Instead, producers use a combination of horizontal drilling and hydraulic fracturing, or “fracking,” during which fluids are injected under high pressure to break up the formations and release trapped fossil fuels.
[563] Report: “Technically Recoverable Shale Oil and Shale Gas Resources: An Assessment of 137 Shale Formations in 41 Countries Outside the United States.” U.S. Energy Information Administration, June 10, 2013. <www.eia.gov>
Executive Summary (<www.eia.gov>):
Within the United States, the oil and natural gas industry typically refers to tight oil production rather than shale oil production, because it is a more encompassing and accurate term with respect to the geologic formations producing oil at any particular well. EIA [U.S. Energy Information Administration] has adopted this convention, and develops estimates of tight oil production and resources in the United States that include, but are not limited to, production from shale formations.
[564] Report: “Annual Energy Review 2011.” U.S. Energy Information Administration, Office of Energy Statistics, September 2012. <www.eia.gov>
Page 89: “Table 4.1 Technically Recoverable Crude Oil and Natural Gas Resource Estimates, 2009 … Tight Gas … Natural gas produced from a non-shale formation with extremely low permeability.”
[565] Report: “Drilling Sideways—A Review of Horizontal Well Technology and Its Domestic Application.” U.S. Energy Information Administration, April 1993. <www.eia.gov>
Page 1:
A widely accepted definition of what qualifies as horizontal drilling has yet to be written. The following combines the essential components of two previously published definitions:1
Horizontal drilling is the process of drilling and completing, for production, a well that begins as a vertical or inclined linear bore which extends from the surface to a subsurface location just above the target oil or gas reservoir called the “kickoff point,” then bears off on an arc to intersect the reservoir at the “entry point,” and, thereafter, continues at a near-horizontal attitude tangent to the arc, to substantially or entirely remain within the reservoir until the desired bottom hole location is reached.
Most oil and gas reservoirs are much more extensive in their horizontal (areal) dimensions than in their vertical (thickness) dimension. By drilling that portion of a well which intersects such a reservoir parallel to its plane of more extensive dimension, horizontal drilling’s immediate technical objective is achieved. That objective is to expose significantly more reservoir rock to the wellbore surface than would be the case with a conventional vertical well penetrating the reservoir perpendicular to its plane of more extensive dimension (Figure 1). The desire to attain this immediate technical objective is almost always motivated by the intended achievement of more important objectives (such as avoidance of water production) related to specific physical characteristics of the target reservoir.
Pages 4–5:
Even when drilling technique has been optimized for a target, the expected financial benefits of horizontal drilling must at least offset the increased well costs before such a project will be undertaken. In successful horizontal drilling applications, the “offset or better” happens due to the occurrence of one or more of a number of factors.
First, operators often are able to develop a reservoir with a sufficiently smaller number of horizontal wells, since each well can drain a larger rock volume about its bore than a vertical well could. When this is the case, per well proved reserves are higher than for a vertical well. An added advantage relative to the environmental costs or land use problems that may pertain in some situations is that the aggregate surface “footprint” of an oil or gas recovery operation can be reduced by use of horizontal wells.
Second, a horizontal well may produce at rates several times greater than a vertical well, due to the increased wellbore surface area within the producing interval. For example, in the Austin Chalk reservoir of Texas’ Giddings Field, under equal pressure conditions, horizontal completions of 500 to 2,200 foot HD [horizontal displacement] produce at initial rates 2½ to 7 times higher than vertical completions.7 Chairman Robert Hauptfuhrer of Oryx Energy Co. noted that “Our costs in the [Austin] chalk now are 50 percent more than a vertical well, but we have three to five or more times the daily production and reserves than a vertical well.”8 A faster producing rate translates financially to a higher rate of return on the horizontal project than would be achieved by a vertical project.
Third, use of a horizontal well may preclude or significantly delay the onset of production problems (interferences) that engender low production rates, low recovery efficiencies, and/or premature well abandonment, reducing or even eliminating, as a result of their occurrence, return on investment and total return.
[566] Report: “Technically Recoverable Shale Oil and Shale Gas Resources: An Assessment of 137 Shale Formations in 41 Countries Outside the United States.” U.S. Energy Information Administration, June 10, 2013. <www.eia.gov>
Page 18: “One reason why 3,000-to-5,000-foot horizontal laterals are employed in the United States is to increase the likelihood that a portion of the horizontal lateral will be sufficiently productive to make the well profitable.”
[567] Webpage: “Development of Radar Navigation and Radio Data Transmission for Microhole Coiled Tubing Bottomhole Assemblies.” U.S. Department of Energy, National Energy Technology Laboratory. Accessed August 27, 2013 at <www.netl.doe.gov>
[568] Report: “Drilling Sideways—A Review of Horizontal Well Technology and Its Domestic Application.” U.S. Energy Information Administration, April 1993. <www.eia.gov>
Page vii:
Horizontal drilling technology achieved commercial viability during the late 1980’s. Its successful employment, particularly in the Bakken Shale of North Dakota and the Austin Chalk of Texas, has encouraged testing of it in many domestic geographic regions and geologic situations. …
… the commercial viability of horizontal wells for production of natural gas has not been well demonstrated yet, although some horizontal wells have been used to produce coal seam gas.
Page viii:
An offset to the benefits provided by successful horizontal drilling is its higher cost. But the average cost is going down. By 1990, the cost premium associated with horizontal wells had shrunk from the 300-percent level experienced with some early experimental wells to an annual average of 17 percent. Learning curves are apparent, as indicated by incurred costs, as new companies try horizontal drilling and as companies move to new target reservoirs. It is probable that the cost premium associated with horizontal drilling will continue to decline, leading to its increased use.
Pages 7–8:
The modern concept of non-straight line, relatively short-radius drilling, dates back at least to September 8, 1891, when the first U.S. patent for the use of flexible shafts to rotate drilling bits was issued to John Smalley Campbell (Patent Number 459,152). While the prime application described in the patent was dental, the patent also carefully covered use of his flexible shafts at much larger and heavier physical scales “… such, for example, as those used in engineer’s shops for drilling holes in boiler-plates or other like heavy work. The flexible shafts or cables ordinarily employed are not capable of being bent to and working at a curve of very short radius …”
The first recorded true horizontal oil well, drilled near Texon, Texas, was completed in 1929.9 Another was drilled in 1944 in the Franklin Heavy Oil Field, Venango County, Pennsylvania, at a depth of 500 feet.10 China tried horizontal drilling as early as 1957, and later the Soviet Union tried the technique.11 Generally, however, little practical application occurred until the early 1980’s, by which time the advent of improved downhole drilling motors and the invention of other necessary supporting equipment, materials, and technologies, particularly downhole telemetry equipment, had brought some kinds of applications within the imaginable realm of commercial viability.
Early Commercial Horizontal Wells
Tests, which indicated that commercial horizontal drilling success could be achieved in more than isolated instances, were carried out between 1980 and 1983 by the French firm Elf Aquitaine in four horizontal wells drilled in three European fields: the Lacq Superieur Oil Field (2 wells) and the Castera Lou Oil Field, both located in southwestern France, and the Rospo Mare Oil Field, located offshore Italy in the Mediterranean Sea. In the latter instance, output was very considerably enhanced.12 Early production well drilling using horizontal techniques was subsequently undertaken by British Petroleum in Alaska’s Prudhoe Bay Field, in a successful attempt to minimize unwanted water and gas intrusions into the Sadlerochit reservoir.13
The Recent Growth of Commercial Horizontal Drilling Taking a cue from these initial successes, horizontal drilling has been undertaken with increasing frequency by more and more operators. They and the drilling and service firms that support them have expanded application of the technology to many additional types of geological and reservoir engineering factor-related drilling objectives. Domestic horizontal wells have now been planned and completed in at least 57 counties or offshore areas located in or off 20 States.
Horizontal drilling in the United States has thus far been focused almost entirely on crude oil applications. In 1990, worldwide, more than 1,000 horizontal wells were drilled. Some 850 of them were targeted at Texas’ Upper Cretaceous Austin Chalk Formation alone.
Page 23: “As noted early on, most domestic horizontal wells have thus far been drilled in search of, or to produce, crude oil. There is no physical reason why they should not also be targeted for natural gas.”
[569] Article: “On the Rise.” By Thomas Helbling. International Monetary Fund Finance & Development, March 2013. Pages 34–37. <www.imf.org>
Page 35: “[During fracking] fluids are injected under high pressure to break up the formations and release trapped fossil fuels.”
[570] Report: “Information on Shale Resources, Development, and Environmental and Public Health Risks.” U.S. Government Accountability Office, September 5, 2012. <www.gao.gov>
Page 1: “[Hydraulic fracturing is] a process that injects a combination of water, sand, and chemical additives under high pressure to create and maintain fractures in underground rock formations that allow oil and natural gas to flow….”
Page 5: “[T]o extract shale oil and gas from the rock, fluids and proppants (usually sand or ceramic beads used to hold fractures open in the formation) are injected under high pressure to create and maintain fractures to increase permeability, thus allowing oil or gas to be extracted.”
Pages 9–13:
The next stage in the development process is stimulation of the shale formation using hydraulic fracturing. Before operators or service companies perform a hydraulic fracture treatment of a well, a series of tests may be conducted to ensure that the well, wellhead equipment, and fracturing equipment can safely withstand the high pressures associated with the fracturing process. Minimum requirements for equipment pressure testing can be determined by state regulatory agencies for operations on state or private lands. In addition, fracturing is conducted below the surface of the earth, sometimes several thousand feet below, and can only be indirectly observed. Therefore, operators may collect subsurface data—such as information on rock stresses20 and natural fault structures—needed to develop models that predict fracture height, length, and orientation prior to drilling a well. The purpose of modeling is to design a fracturing treatment that optimizes the location and size of induced fractures and maximizes oil or gas production.
To prepare a well to be hydraulically fractured, a perforating tool may be inserted into the casing and used to create holes in the casing and cement. Through these holes, fracturing fluid—that is injected under high pressures—can flow into the shale….
Fracturing fluids are tailored to site specific conditions, such as shale thickness, stress, compressibility, and rigidity. As such, the chemical additives used in a fracture treatment vary. Operators may use computer models that consider local conditions to design site-specific hydraulic fluids. The water, chemicals, and proppant used in fracturing fluid are typically stored on-site in separate tanks and blended just before they are injected into the well. Figure 3 provides greater detail about some chemicals commonly used in fracturing.
Figure 3: Examples of Common Ingredients Found in Fracturing Fluid
The operator pumps the fracturing fluid into the wellbore at pressures high enough to force the fluid through the perforations into the surrounding formation—which can be shale, coalbeds, or tight sandstone—expanding existing fractures and creating new ones in the process. After the fractures are created, the operator reduces the pressure. The proppant stays in the formation to hold open the fractures and allow the release of oil and gas. Some of the fracturing fluid that was injected into the well will return to the surface (commonly referred to as flowback) along with water that occurs naturally in the oil- or gas-bearing formation—collectively referred to as produced water. The produced water is brought to the surface and collected by the operator, where it can be stored on-site in impoundments, injected into underground wells, transported to a wastewater treatment plant, or reused by the operator in other ways.21 Given the length of horizontal wells, hydraulic fracturing is often conducted in stages, where each stage focuses on a limited linear section and may be repeated numerous times.
Once a well is producing oil or natural gas, equipment and temporary infrastructure associated with drilling and hydraulic fracturing operations is no longer needed and may be removed, leaving only the parts of the infrastructure required to collect and process the oil or gas and ongoing produced water. Operators may begin to reclaim the part of the site that will not be used by restoring the area to predevelopment conditions. Throughout the producing life of an oil or gas well, the operator may find it necessary to periodically restimulate the flow of oil or gas by repeating the hydraulic fracturing process. The frequency of such activity depends on the characteristics of the geologic formation and the economics of the individual well. If the hydraulic fracturing process is repeated, the site and surrounding area will be further affected by the required infrastructure, truck transport, and other activity associated with this process.
20 Stresses in the formation generally define a maximum and minimum stress direction that influence the direction a fracture will grow.
21 Underground injection is the predominant practice for disposing of produced water. In addition to underground injection, a limited amount of produced water is managed by discharging it to surface water, storing it in surface impoundments, and reusing it for irrigation or hydraulic fracturing.
[571] Report: “Information on Shale Resources, Development, and Environmental and Public Health Risks.” U.S. Government Accountability Office, September 5, 2012. <www.gao.gov>
Page 7:
1940s Hydraulic fracturing first introduced to the petroleum industry.
1947 The first experimental hydraulic fracturing treatment conducted in Grant County, Kansas.
1949 The first commercial hydraulic fracturing treatment conducted in Stephens County, Oklahoma.
1950s Hydraulic fracturing becomes a commercially accepted process.
1955 More than 100,000 individual hydraulic fracturing treatments performed.
Late 1970s and early 1980s Shale formations, such as the Barnett in Texas and Marcellus in Pennsylvania, are known but believed to have essentially zero permeability and thus are not considered economic. Federally sponsored research seeks to improve ways to extract gas from unconventional formations, such as shale.
1980s to early 1990s Mitchell Energy combines larger fracture designs, rigorous reservoir characterization, horizontal drilling, and lower cost approaches to hydraulic fracturing to make the Barnett Shale economic.
[572] Article: “U.S. Gas Fields Go From Bust to Boom.” By Ben Casselman. Wall Street Journal, April 30, 2009. <online.wsj.com>
In the 1980s, Texas oilman George Mitchell began trying to produce gas from a formation near Fort Worth, Texas, known as the Barnett Shale. He pumped millions of gallons of water at high pressure down the well, cracking open the rock and allowing gas to flow to the surface.
Oklahoma City-based Devon Energy Corp. bought Mr. Mitchell’s company in 2002. It combined his methods with a technique for drilling straight down to gas-bearing rock, then turning horizontally to stay within the formation. Devon’s first horizontal wells produced about three times as much gas as traditional vertical wells.
[573] Report: “Technically Recoverable Shale Oil and Shale Gas Resources: An Assessment of 137 Shale Formations in 41 Countries Outside the United States.” U.S. Energy Information Administration, June 10, 2013. <www.eia.gov>
Executive Summary (<www.eia.gov>):
The advent of large-scale shale gas production did not occur until around 2000 when shale gas production became a commercial reality in the Barnett Shale located in north-central Texas. As commercial success of the Barnett Shale became apparent, other companies started drilling wells in this formation so that by 2005, the Barnett Shale alone was producing almost half a trillion cubic feet per year of natural gas.
[574] Article: “U.S. Gas Fields Go From Bust to Boom.” By Ben Casselman. Wall Street Journal, April 30, 2009. <online.wsj.com>
In the 1980s, Texas oilman George Mitchell began trying to produce gas from a formation near Fort Worth, Texas, known as the Barnett Shale. He pumped millions of gallons of water at high pressure down the well, cracking open the rock and allowing gas to flow to the surface.
Oklahoma City-based Devon Energy Corp. bought Mr. Mitchell’s company in 2002. It combined his methods with a technique for drilling straight down to gas-bearing rock, then turning horizontally to stay within the formation. Devon’s first horizontal wells produced about three times as much gas as traditional vertical wells.
[575] Report: “Information on Shale Resources, Development, and Environmental and Public Health Risks.” U.S. Government Accountability Office, September 5, 2012. <www.gao.gov>
Page 1:
For decades, the United States has relied on imports of oil and natural gas to meet domestic needs. As recently as 2007, the expectation was that the nation would increasingly rely on imports of natural gas to meet its growing demand. However, recent improvements in technology have allowed companies that develop petroleum resources to extract oil and natural gas from shale formations,1 known as “shale oil” and “shale gas,” respectively, which were previously inaccessible because traditional techniques did not yield sufficient amounts for economically viable production.
Page 2: “Early drilling activity in shale formations was centered primarily on natural gas, but with the falling price of natural gas companies switched their focus to oil and natural gas liquids, which are a more valuable product.”
Page 6:
The process to develop shale oil and gas is similar to the process for conventional onshore oil and gas, but shale formations may rely on the use of horizontal drilling and hydraulic fracturing—which may or may not be used on conventional wells. Horizontal drilling and hydraulic fracturing are not new technologies, as seen in figure 1, but advancements, refinements, and new uses of these technologies have greatly expanded oil and gas operators’ abilities to use these processes to economically develop shale oil and gas resources. For example, the use of multistage hydraulic fracturing within a horizontal well has only been widely used in the last decade.15
15 Hydraulic fracturing is often conducted in stages. Each stage focuses on a limited linear section and may be repeated numerous times.
[576] Calculated with data from the report: “July 2022 Monthly Energy Review.” U.S. Energy Information Administration, Office of Energy Statistics, July 26, 2022. <www.eia.gov>
Page 103: “Table 4.1: Natural Gas Overview (Billion Cubic Feet)”
NOTE: An Excel file containing the data and calculations is available upon request.
[577] Report: “International Energy Outlook 2013.” U.S. Energy Information Administration, July 25, 2013. <www.eia.gov>
Page 4:
In the United States, one of the keys to increasing natural gas production has been advances in the application of horizontal drilling and hydraulic fracturing technologies, which made it possible to develop the country’s vast shale gas resources and contributed to a near doubling of total U.S. technically recoverable natural gas resource estimates over the past decade.
[578] Report: “Technically Recoverable Shale Oil and Shale Gas Resources: An Assessment of 137 Shale Formations in 41 Countries Outside the United States.” U.S. Energy Information Administration, June 10, 2013. <www.eia.gov>
Executive Summary (<www.eia.gov>):
Because they have proven to be quickly producible in large volumes at a relatively low cost, tight oil and shale gas resources have revolutionized U.S. oil and natural gas production, providing 29 percent of total U.S. crude oil production and 40 percent of total U.S. natural gas production in 2012. …
The use of horizontal drilling in conjunction with hydraulic fracturing has greatly expanded the ability of producers to profitably produce oil and natural gas from low permeability geologic formations, particularly shale formations.
[579] Calculated with data from:
a) Webpage: “How Much Shale Gas Is Produced in the United States?” U.S. Energy Information Administration. Last updated March 15, 2022. <www.eia.gov>
“The U.S. Energy Information Administration (EIA) estimates that in 2021, U.S. dry shale gas production was about 26.8 trillion cubic feet (Tcf) and equal to about 79% of total U.S. dry natural gas production in 2021.”
b) Article: “Horizontally Drilled Wells Dominate U.S. Tight Formation Production.” By Jack Perrin. U.S. Energy Information Administration, June 6, 2019. <www.eia.gov>
“[H]orizontal wells made up about 14% of U.S. natural gas production in shale formations in 2004 and increased to 97% in 2018. … Drilling horizontally, parallel to the geologic layers in tight formations, allows producers to access more of the oil- and natural gas-bearing rock than drilling vertically. This increased exposure allows additional hydraulic fracturing with greater water volumes and pounds of proppant (small, solid particles, usually sand or a manmade granular solid of similar size).”
CALCULATION: 79% of gas production from shale × 97% of shale gas production from horizontal wells = 77% of natural gas production from horizontal wells
[580] Webpage: “Natural Gas Explained: Where Our Natural Gas Comes From.” U.S. Energy Information Administration. Last updated July 8, 2022. <www.eia.gov>
U.S. dry natural gas production in 2020 was about 33.5 trillion cubic feet (Tcf), an average of about 91.5 billion cubic feet per day and the second-highest annual amount recorded. Most of the production increases since 2005 are the result of horizontal drilling and hydraulic fracturing techniques, notably in shale, sandstone, carbonate, and other tight geologic formations. Natural gas is produced from onshore and offshore natural gas and oil wells and from coal beds.
[581] Article: “On the Rise.” By Thomas Helbling. International Monetary Fund Finance & Development, March 2013. Pages 34–37. <www.imf.org>
Page 36:
Natural gas abundance potentially extends even beyond the United States. A recent study by the U.S. Geological Survey concluded that significant shale gas resources might also be available in other countries, including China and Argentina. But as with unconventional oil production in other countries, it is too early to assess whether the successes in U.S. shale gas production can be replicated elsewhere.
[582] Report: “Technically Recoverable Shale Oil and Shale Gas Resources: An Assessment of 137 Shale Formations in 41 Countries Outside the United States.” U.S. Energy Information Administration, June 10, 2013. <www.eia.gov>
Executive Summary (<www.eia.gov>):
Key positive above-the-ground advantages in the United States and Canada that may not apply in other locations include private ownership of subsurface rights that provide a strong incentive for development; availability of many independent operators and supporting contractors with critical expertise and suitable drilling rigs and, preexisting gathering and pipeline infrastructure; and the availability of water resources for use in hydraulic fracturing.
[583] Article: “Shale Gas and Tight Oil Are Commercially Produced in Just Four Countries.” U.S. Energy Information Administration, February 13, 2015. <www.eia.gov>
The United States, Canada, China, and Argentina are currently the only four countries in the world that are producing commercial volumes of either natural gas from shale formations (shale gas) or crude oil from tight formations (tight oil). The United States is by far the dominant producer of both shale gas and tight oil.
Canada is the only other country to produce both shale gas and tight oil. China produces some small volumes of shale gas, while Argentina produces some small volumes of tight oil. While hydraulic fracturing techniques have been used to produce natural gas and tight oil in Australia and Russia, the volumes produced did not come from low-permeability shale formations.
[584] Email from the U.S. Energy Information Administration to Just Facts on August 13, 2019:
“Shale gas production from shale formations is still limited to the U.S., Canada, Argentina and China.”
[585] Email from Just Facts to the U.S. Energy Information Administration on July 30, 2020:
“Is commercial production of tight oil from shale formations is still limited to the U.S., Canada, and Argentina?”
Email from the U.S. Energy Information Administration to Just Facts on July 31, 2020:
“I believe you are correct and commercial production of tight oil and shale is still restricted to those countries. However this is not an area that we have been focusing our research efforts in recently.”
[586] Email from the U.S. Energy Information Administration to Just Facts on July 6, 2021:
“Commercial production of natural gas from shale formations is still limited to the U.S., Canada, China and Argentina. … <www.eia.gov>†”
NOTE: † Article: “China Adds Incentives for Domestic Natural Gas Production as Imports Increase.” By Faouzi Aloulou and Victoria Zaretskaya. U.S. Energy Information Administration, October 23, 2019. “In June 2019, the Chinese government introduced a subsidy program that established new incentives for production of natural gas from tight formations…. Production of tight gas, shale gas, and coalbed methane collectively accounted for 41% of China’s total domestic natural gas production in 2018.”
[587] Email from Just Facts to the U.S. Energy Information Administration on September 1, 2022:
Is the following still accurate? “Commercial production of natural gas from shale formations is still limited to the U.S., Canada, China and Argentina.”
Email from the U.S. Energy Information Administration to Just Facts on September 1, 2022:
The statement below [above] is correct. I wouldn’t say accurate, though. Some companies in many countries beyond the US, Canada, China and Argentina who are currently producing shale gas, may have used hydro fracking and horizontal drilling to produce shale gas from low-permeability formations while developing tight gas. Saudi Aramco comes to mind.
[588] Report: “Technically Recoverable Shale Oil and Shale Gas Resources: An Assessment of 137 Shale Formations in 41 Countries Outside the United States.” U.S. Energy Information Administration, June 10, 2013. <www.eia.gov>
Executive Summary (<www.eia.gov>):
Globally, 32 percent of the total estimated natural gas resources are in shale formations….
[I]t is important to distinguish between a technically recoverable resource, which is the focus of this report, and an economically recoverable resource. Technically recoverable resources represent the volumes of oil and natural gas that could be produced with current technology, regardless of oil and natural gas prices and production costs. Economically recoverable resources are resources that can be profitably produced under current market conditions.
[589] Report: “International Energy Outlook 2013.” U.S. Energy Information Administration, July 25, 2013. <www.eia.gov>
Page 4:
In the United States, one of the keys to increasing natural gas production has been advances in the application of horizontal drilling and hydraulic fracturing technologies, which made it possible to develop the country’s vast shale gas resources and contributed to a near doubling of total U.S. technically recoverable natural gas resource estimates over the past decade.
[590] Report: “Information on Shale Resources, Development, and Environmental and Public Health Risks.” U.S. Government Accountability Office, September 5, 2012. <www.gao.gov>
Pages 21–25:
The amount of technically recoverable shale gas resources in the United States has been estimated by a number of organizations, including EIA [U.S. Energy Information Administration], USGS [U.S. Geological Survey], and the Potential Gas Committee…. Their estimates were as follows:
• in 2012, EIA estimated the amount of technically recoverable shale gas in the United States at 482 trillion cubic feet.27 This represents an increase of 280 percent from EIA’s 2008 estimate.
• in 2011, USGS reported that the total of its estimates for the shale formations the agency evaluated in all previous years28 shows the amount of technically recoverable shale gas in the United States at about 336 trillion cubic feet. This represents an increase of about 600 percent from the agency’s 2006 estimate.
• in 2011, the Potential Gas Committee estimated the amount of technically recoverable shale gas in the United States at about 687 trillion cubic feet.29 This represents an increase of 240 percent from the Committee’s 2007 estimate. …
In 2012, EIA reduced its estimate of technically recoverable shale gas in the Marcellus Shale by about 67 percent. According to EIA officials, the decision to revise the estimate was based primarily on the availability of new production data, which was highlighted by the release of the USGS estimate. In 2011, EIA used data from a contractor to estimate that the Marcellus Shale possessed about 410 trillion cubic feet of technically recoverable gas. After EIA released its estimates in 2011, USGS released its first estimate of technically recoverable gas in the Marcellus in almost 10 years. USGS estimated that there were 84 trillion cubic feet of natural gas in the Marcellus—which was 40 times more than its previous estimate reported in 2002 but significantly less than EIA’s estimate. In 2012, EIA announced that it was revising its estimate of the technically recoverable gas in the Marcellus Shale from 410 to 141 trillion cubic feet. …
In addition to the estimates from the three organizations we reviewed, operators and energy forecasting consultants prepare their own estimates of technically recoverable shale gas to plan operations or for future investment. In September 2011, the National Petroleum Council aggregated data on shale gas resources from over 130 industry, government, and academic groups and estimated that approximately 1,000 trillion cubic feet of shale gas is available for production domestically. In addition, private firms that supply information to the oil and gas industry conduct assessments of the total amount of technically recoverable natural gas. For example, ICF International, a consulting firm that provides information to public- and private-sector clients, estimated in March 2012 that the United States possesses about 1,960 trillion cubic feet of technically recoverable shale gas. …
As with estimates for technically recoverable shale oil, estimates of the size of technically recoverable shale gas resources in the United States are also highly dependent on the data, methodologies, model structures, and assumptions used and may change as additional information becomes available. … As a result, production rates achieved to date may not be representative of future production rates across the formation. EIA reports that experience to date shows production rates from neighboring shale gas wells can vary by as much as a factor of 3 and that production rates for different wells in the same formation can vary by as much as a factor of 10. Most gas companies estimate that production in a given well will drop sharply after the first few years and then level off, continuing to produce gas for decades, according to the Sustainable Investments Institute and the Investor Responsibility Research Center Institute.
[591] Report: “Assumptions to the Annual Energy Outlook 2022: Oil and Gas Supply Module.” U.S. Energy Information Administration, March 2022. <www.eia.gov>
Page 2:
A common measure of the long-term viability of U.S. domestic crude oil and natural gas as energy sources is the remaining TRR [technically recoverable resources], which consists of proved reserves4 and unproved resources.5 Estimates of TRR are highly uncertain, particularly in emerging plays where relatively few wells have been drilled. Early estimates tend to vary and shift significantly over time because new geological information is gained through additional drilling, long-term productivity is clarified for existing wells, and the productivity of new wells increases with technology improvements and better management practices. The TRR estimates that we use [U.S. Energy Information Administration] for each Annual Energy Outlook (AEO) are based on the latest available well production data and information from other federal and state governmental agencies, industries, and academia.
Page 7:
The underlying resource assumptions for the AEO Reference case is uncertain, particularly as exploration and development of tight oil continues to move into areas with little or no production history. Many wells drilled in tight or shale formations using the latest technologies have less than two years of production history, so we cannot fully ascertain the impact of recent technological advancement on the estimate of future recovery. Uncertainty also extends to the extent of formations and the number of layers in an area that could be drilled within formations. Alternative resource cases are addressed at the end of this document.
[592] Report: “Oil and Gas Supply Module of the National Energy Modeling System: Model Documentation 2014.” U.S. Energy Information Administration, July 2014. <www.eia.gov>
Page 6: “Proved reserves are the estimated quantities that analyses of geological and engineering data demonstrate with reasonable certainty to be recoverable in future years from known reservoirs under existing economic and operating conditions.”
[593] Report: “Technically Recoverable Shale Oil and Shale Gas Resources: An Assessment of 137 Shale Formations in 41 Countries Outside the United States.” U.S. Energy Information Administration, June 10, 2013. <www.eia.gov>
Executive Summary (<www.eia.gov>):
Economically recoverable resources are resources that can be profitably produced under current market conditions. The economic recoverability of oil and gas resources depends on three factors: the costs of drilling and completing wells, the amount of oil or natural gas produced from an average well over its lifetime, and the prices received for oil and gas production. Recent experience with shale gas in the United States and other countries suggests that economic recoverability can be significantly influenced by above-the-ground factors as well as by geology.
[594] Press release: “3 to 4.3 Billion Barrels of Technically Recoverable Oil Assessed in North Dakota and Montana’s Bakken Formation—25 Times More Than 1995 Estimate.” U.S. Department of the Interior, U.S. Geological Survey, April 10, 2008. <www.usgs.gov>
“Technically recoverable oil resources are those producible using currently available technology and industry practices. USGS [U.S. Geological Survey] is the only provider of publicly available estimates of undiscovered technically recoverable oil and gas resources.”
[595] Report: “Oil and Gas Supply Module of the National Energy Modeling System: Model Documentation 2014.” U.S. Energy Information Administration, July 2014. <www.eia.gov>
Page 6:
Technically recoverable resources are those volumes considered to be producible with current recovery technology and efficiency but without reference to economic viability. Technically recoverable volumes include proved reserves and inferred reserves as well as undiscovered and other unproved resources. These resources may be recoverable by techniques considered either conventional or unconventional.
[596] Report: “Technically Recoverable Shale Oil and Shale Gas Resources: An Assessment of 137 Shale Formations in 41 Countries Outside the United States.” U.S. Energy Information Administration, June 10, 2013. <www.eia.gov>
Executive Summary (<www.eia.gov>): “Technically recoverable resources represent the volumes of oil and natural gas that could be produced with current technology, regardless of oil and natural gas prices and production costs.”
[597] Report: “Annual Energy Review 2011.” U.S. Energy Information Administration, Office of Energy Statistics, September 2012. <www.eia.gov>
Page 369: “Undiscovered Recoverable Reserves (Crude Oil and Natural Gas): Those economic resources of crude oil and natural gas, yet undiscovered, that are estimated to exist in favorable geologic settings.”
[598] Webpage: “Do We Have Enough Oil Worldwide to Meet Our Future Needs?” U.S. Energy Information Administration. Last updated November 2, 2021. <www.eia.gov>
An often cited, but misleading, measurement of future resource availability is the reserves-to-production ratio, which is calculated by dividing the volume of total proved reserves by the volume of current annual consumption. Proved reserves are an accounting concept that is based on known projects, and it is not an appropriate measure for judging total resource availability in the long term. Over time, global reserves will likely increase as new technologies increase production at existing fields and as new projects are developed.
[599] Report: “International Energy Outlook 2013.” U.S. Energy Information Administration, July 25, 2013. <www.eia.gov>
Proved reserves include only estimated quantities of crude oil from known reservoirs, and therefore they are only a subset of the entire potential oil resource base. …
Proved reserves cannot provide an accurate assessment of the physical limits on future production but rather are intended to provide insight as to company-level or country-level development plans in the very near term. In fact, because of the particularly rigid requirements for the classification of resources as proved reserves, even the cumulative production levels from individual development projects may exceed initial estimates of proved reserves.
[600] Report: “Information on Shale Resources, Development, and Environmental and Public Health Risks.” U.S. Government Accountability Office, September 5, 2012. <www.gao.gov>
Page 25:
[Proved] Reserves are key information for assessing the net worth of an operator. Oil and gas companies traded on the U.S. stock exchange are required to report their reserves to the Securities and Exchange Commission. According to an EIA [U.S. Energy Information Administration] official, EIA reports a more complete measure of oil and gas reserves because it receives reports of proved reserves from both private and publically held companies.
[601] Press release: “3 to 4.3 Billion Barrels of Technically Recoverable Oil Assessed in North Dakota and Montana’s Bakken Formation—25 Times More Than 1995 Estimate.” U.S. Department of the Interior, U.S. Geological Survey, April 10, 2008. <www.usgs.gov>
A U.S. Geological Survey assessment, released April 10, shows a 25-fold increase in the amount of oil that can be recovered compared to the agency’s 1995 estimate of 151 million barrels of oil. …
Technically recoverable oil resources are those producible using currently available technology and industry practices. USGS [U.S. Geological Survey] is the only provider of publicly available estimates of undiscovered technically recoverable oil and gas resources.
New geologic models applied to the Bakken Formation, advances in drilling and production technologies, and recent oil discoveries have resulted in these substantially larger technically recoverable oil volumes. About 105 million barrels of oil were produced from the Bakken Formation by the end of 2007.
[602] Calculated with data from the report: “Annual Energy Review 2011.” U.S. Energy Information Administration, Office of Energy Statistics, September 2012. <www.eia.gov>
Page 91: “Table 4.2: Crude Oil and Natural Gas Cumulative Production and Proved Reserves, 1977–2010”
NOTE: An Excel file containing the data and calculations is available upon request.
[603] Report: “Assumptions to the Annual Energy Outlook 2022: Oil and Gas Supply Module.” U.S. Energy Information Administration, March 2022. <www.eia.gov>
Page 2:
Key Assumptions
Domestic Oil and Natural Gas Technically Recoverable Resources
The outlook for domestic crude oil production is highly dependent on the production profile of individual wells over time, the cost of drilling and operating those wells, and the revenues generated by those wells. Every year, we re-estimate initial production (IP) rates and production decline curves, which determine estimated ultimate recovery (EUR) per well and total technically recoverable resources (TRR).3
A common measure of the long-term viability of U.S. domestic crude oil and natural gas as energy sources is the remaining TRR, which consists of proved reserves4 and unproved resources.5 Estimates of TRR are highly uncertain, particularly in emerging plays where relatively few wells have been drilled. Early estimates tend to vary and shift significantly over time because new geological information is gained through additional drilling, long-term productivity is clarified for existing wells, and the productivity of new wells increases with technology improvements and better management practices. The TRR estimates that we use for each Annual Energy Outlook (AEO) are based on the latest available well production data and information from other federal and state governmental agencies, industries, and academia.
Page 3:
Table 2. Technically Recoverable U.S. Dry Natural Gas Resources as of January 1, 2020 …
Total technically recoverable resources, trillion cubic feet … Total U.S. [=] 2,925.8 …
Notes: Resources in other areas where drilling is officially prohibited are not included. The estimate of 32.9 trillion cubic feet of natural gas resources in the Northern Atlantic, Northern and Central Pacific, and within a 50-mile buffer off the Mid- and Southern Atlantic Outer Continental Shelf (OCS) is also excluded from the technically recoverable volumes because leasing is not expected in these areas.
[604] Calculated with data from the report: “July 2022 Monthly Energy Review.” U.S. Energy Information Administration, Office of Energy Statistics, July 26, 2022. <www.eia.gov>
Page 103: “Table 4.1 Natural Gas Overview (Billion Cubic Feet) … 2020 … Dry Gas Productiond … Total [=] 33,485 … d Marketed production (wet) minus NGPL [natural gas plant liquids] production.”
CALCULATION: 2,925,800,000,000,000 technically recoverable cubic feet / 33,485,000,000,000 dry gas production per year = 87 years
[605] Calculated with data from the report: “July 2022 Monthly Energy Review.” U.S. Energy Information Administration, Office of Energy Statistics, July 26, 2022. <www.eia.gov>
Page 103: “Table 4.1 Natural Gas Overview (Billion Cubic Feet) … 2020 … Supplemental Gaseous Fuelse [=] 63 … Consumptionh [=] 30,477”
Page 108: “Note 3. Supplemental Gaseous Fuels. Supplemental gaseous fuels are any substances that, introduced into or commingled with natural gas, increase the volume available for disposition. Such substances include, but are not limited to, propane‐air, refinery gas, coke oven gas, still gas, manufactured gas, biomass gas, and air or inert gases added for Btu stabilization.”
CALCULATION: 2,925,800,000,000,000 technically recoverable cubic feet / (30,477,000,000,000 cubic feet of consumption per year – 63,000,000,000 cubic feet of supplemental gaseous fuels) = 96 years
[606] Calculated with data from the report: “Technically Recoverable Shale Oil and Shale Gas Resources: An Assessment of 137 Shale Formations in 41 Countries Outside the United States.” U.S. Energy Information Administration, June 10, 2013. <www.eia.gov>
Pages 2–3:
As shown in Table 1, estimates in the updated report taken in conjunction with EIA’s [U.S. Energy Information Administration’s] own assessment of resources within the United States indicate technically recoverable resources of … 7,299 trillion cubic feet of world shale gas resources. …
Although the shale resource estimates presented in this report will likely change over time as additional information becomes available, it is evident that shale resources that were until recently not included in technically recoverable resources constitute a substantial share of overall global technically recoverable oil and natural gas resources. … The shale gas resources assessed in this report, combined with EIA’s prior estimate of U.S. shale gas resources, add approximately 47 percent to the 15,583 trillion cubic feet of proved and unproven nonshale technically recoverable natural gas resources. Globally, 32 percent of the total estimated natural gas resources are in shale formations….
Page 17:
Some of the key exclusions for this report include:
• Tight oil produced from low permeability sandstone and carbonate formations that can often be found adjacent to shale oil formations. Assessing those formations was beyond the scope of this report.
• Coalbed methane and tight natural gas and other natural gas resources that may exist within these countries were also excluded from the assessment.
• Assessed formations without a resource estimate, which resulted when data were judged to be inadequate to provide a useful estimate. Including additional shale formations would likely increase the estimated resource.
• Countries outside the scope of the report, the inclusion of which would likely add to estimated resources in shale formations. It is acknowledged that potentially productive shales exist in most of the countries in the Middle East and the Caspian region, including those holding substantial nonshale oil and natural gas resources.
• Offshore portions of assessed shale oil and shale gas formations were excluded, as were shale oil and shale gas formations situated entirely offshore.
CALCULATION: 7,299 trillion cubic feet of shale gas + 15,583 trillion cubic feet of nonshale gas = 22,882
[607] Calculated with the dataset: “Natural Gas.” U.S. Energy Information Administration. Accessed February 2, 2024 at <www.eia.gov>
“Dry natural gas production (bcf) … World … 2021 [=] 144,193”
CALCULATION: 22,882 trillion cubic feet of technically recoverable natural gas / 144.193 trillion cubic feet of natural gas production per year = 159 years
[608] Article: “Potential of Gas Hydrates Is Great, but Practical Development Is Far Off.” U.S. Energy Information Administration, November 7, 2012. <www.eia.gov>
Methane hydrates (or gas hydrates) are cage-like lattices of water molecules containing methane, the chief constituent of natural gas. …
According to the United States Geological Survey, the world’s gas hydrates may contain more organic carbon than the world’s coal, oil, and other forms of natural gas combined. Estimates of the naturally occurring gas hydrate resource vary from 10,000 trillion cubic feet to more than 100,000 trillion cubic feet of natural gas.
[609] Calculated with data from the report: “International Energy Outlook 2017.” U.S. Energy Information Administration, September 14, 2017. <www.eia.gov>
“Table I1. World total natural gas production by region.” <www.eia.gov>
“2012 … Total World [trillion cubic feet] [=] 119.4”
CALCULATION: 10,000–100,000 trillion cubic feet of technically recoverable natural gas hydrate / 119.4 trillion cubic feet of natural gas production per year = 84–837 years
[610] Article: “Potential of Gas Hydrates Is Great, but Practical Development Is Far Off.” U.S. Energy Information Administration, November 7, 2012. <www.eia.gov>
Methane hydrates (or gas hydrates) are cage-like lattices of water molecules containing methane, the chief constituent of natural gas. They may represent one of the world’s largest reservoirs of carbon-based fuel. However, with abundant availability of natural gas from conventional and shale resources, there is no economic incentive to develop gas hydrate resources, and no commercial-scale technologies to exploit them have been demonstrated.
Gas hydrates can be found under arctic permafrost, as well as beneath the ocean floor. They can also form during drilling and production operations. So far, gas hydrates have provided more problems than solutions. The formation of gas hydrates in deepwater production can hinder operations; managing or preventing their formation in deepwater oil and gas wells and pipelines has been a challenge for many decades, and addressing the existence of gas hydrates is a major part of planning for deepwater drilling and production. However, at some point in the future, gas hydrates could be a potential source of natural gas. …
… The U.S. Department of Energy recently selected 14 gas hydrate research projects to receive funding, building on a successful test in early 2012 in which a steady flow of natural gas was extracted from gas hydrates on Alaska’s North Slope. Japan is also conducting research on producing gas hydrates from deepwater basins near its shores.
[611] Report: “Annual Energy Review 2011.” U.S. Energy Information Administration, Office of Energy Statistics, September 2012. <www.eia.gov>
Page 351: “Coal: A readily combustible black or brownish-black rock whose composition, including inherent moisture, consists of more than 50 percent by weight and more than 70 percent by volume of carbonaceous material.”
[612] Entry: “coal.” American Heritage Science Dictionary. Houghton Mifflin, 2005. <www.thefreedictionary.com>
A dark-brown to black solid substance formed from the compaction and hardening of fossilized plant parts in the presence of water and in the absence of air. Carbonaceous material accounts for more than 50 percent of coal’s weight and more than 70 percent of its volume. Coal is widely used as a fuel, and its combustion products are used as raw material for a variety of products including cement, asphalt, wallboard and plastics.
[613] Article: “Coal.” Encyclopædia Britannica Ultimate Reference Suite 2004.
“Different varieties of coal arise because of differences in the kinds of plant material (coal type), degree of coalification (coal rank), and range of impurities (coal grade).”
[614] Brief: “What Is the Role of Coal in the United States?” U.S. Energy Information Administration. Last updated July 18, 2012. <www.eia.gov>
Different types of coal have different characteristics including sulfur content, mercury content, and heat energy content. Heat content is used to group coal into four distinct categories, known as ranks: anthracite, bituminous, subbituminous, and lignite (generally in decreasing order of heat content).
There are far more bituminous coal mines in the United States than the other ranks (over 90% of total mines), but subbituminous mines (located predominantly in Wyoming and Montana) produce more coal because their average size is much larger.
[615] Report: “Annual Energy Review 2011.” U.S. Energy Information Administration, Office of Energy Statistics, September 2012. <www.eia.gov>
Page 349:
Anthracite: the highest rank of coal; used primarily for residential and commercial space heating. It is a hard, brittle, and black lustrous coal, often referred to as hard coal, containing a high percentage of fixed carbon and a low percentage of volatile matter. The moisture content of fresh-mined anthracite generally is less than 15 percent. The heat content of anthracite ranges from 22 to 28 million Btu per short ton on a moist, mineral-matter-free basis. The heat content of anthracite consumed in the United States averages 25 million Btu per short ton, on the as-received basis (i.e., containing both inherent moisture and mineral matter). Note: Since the 1980’s, anthracite refuse or mine waste has been used for steam-electric power generation. This fuel typically has a heat content of 15 million Btu per short ton or less.
Page 350:
Bituminous Coal: A dense coal, usually black, sometimes dark brown, often with well-defined bands of bright and dull material, used primarily as fuel in steam-electric power generation, with substantial quantities also used for heat and power applications in manufacturing and making coke. Bituminous coal is the most abundant coal in active U.S. mining regions. Its moisture content usually is less than 20 percent. The heat content of bituminous coal ranges from 21 to 30 million Btu per short ton on a moist, mineral-matter-free basis. The heat content of bituminous coal consumed in the United States averages 24 million Btu per short ton, on the as-received basis (i.e., containing both inherent moisture and mineral matter).
Page 351: “Coal Rank: the classification of coals according to their degree of progressive alteration from lignite to anthracite. In the United States, the standard ranks of coal include lignite, subbituminous coal, bituminous coal, and anthracite and are based on fixed carbon, volatile matter, heating value, and agglomerating (or caking) properties.”
Page 360:
Lignite: the lowest rank of coal, often referred to as brown coal, used almost exclusively as fuel for steam-electric power generation. It is brownish-black and has a high inherent moisture content, sometimes as high as 45 percent. The heat content of lignite ranges from 9 to 17 million Btu per short ton on a moist, mineral-matter-free basis. The heat content of lignite consumed in the United States averages 13 million Btu per short ton, on the as-received basis (i.e., containing both inherent moisture and mineral matter).
Page 368:
Subbituminous Coal: A coal whose properties range from those of lignite to those of bituminous coal and used primarily as fuel for steam-electric power generation. It may be dull, dark brown to black, soft and crumbly, at the lower end of the range, to bright, jet black, hard, and relatively strong, at the upper end. Subbituminous coal contains 20 to 30 percent inherent moisture by weight. The heat content of subbituminous coal ranges from 17 to 24 million Btu per short ton on a moist, mineral-matter-free basis. The heat content of subbituminous coal consumed in the United States averages 17 to 18 million Btu per short ton, on the as-received basis (i.e., containing both inherent moisture and mineral matter).
[616] Article: “Carbon Dioxide Emission Factors for Coal.” By B.D. Hong and E. R. Slatick. U.S. Energy Information Administration Quarterly Coal Report, January–April 1994. <www.eia.gov>
The amount of heat emitted during coal combustion depends largely on the amounts of carbon, hydrogen, and oxygen present in the coal and, to a lesser extent, on the sulfur content. Hence, the ratio of carbon to heat content depends on these heat-producing components of coal, and these components vary by coal rank.
Carbon, by far the major component of coal, is the principal source of heat, generating about 14,500 British thermal units (Btu) per pound. The typical carbon content for coal (dry basis) ranges from more than 60 percent for lignite to more than 80 percent for anthracite. Although hydrogen generates about 62,000 Btu per pound, it accounts for only 5 percent or less of coal and not all of this is available for heat because part of the hydrogen combines with oxygen to form water vapor. The higher the oxygen content of coal, the lower its heating value.3 This inverse relationship occurs because oxygen in the coal is bound to the carbon and has, therefore, already partially oxidized the carbon, decreasing its ability to generate heat. The amount of heat contributed by the combustion of sulfur in coal is relatively small, because the heating value of sulfur is only about 4,000 Btu per pound, and the sulfur content of coal generally averages 1 to 2 percent by weight.4 Consequently, variations in the ratios of carbon to heat content of coal are due primarily to variations in the hydrogen content.
[617] Report: “Annual Energy Review 2011.” U.S. Energy Information Administration, Office of Energy Statistics, September 2012. <www.eia.gov>
Page 351: “Coal … is formed from plant remains that have been compacted, hardened, chemically altered, and metamorphosed by heat and pressure over geologic time.”
[618] Booklet: “Energy, Powering Your World.” By M.T. Westra and S. Kuyvenhoven. Foundation for Fundamental Research on Matter, Institute for Plasma Physics, Rijnhuizen (the Netherlands), 2002. <fire.pppl.gov>
Page 5:
People in China used coal as early as 3000 years ago, and there is evidence that Romans in England used coal for cooking in A.D. 100–200. …
When people in Europe discovered how useful coal was for heating, they quickly began to search for it, and they found it all around. By 1660, coal in England had become a booming business, and coal was exported around the world. Although English cities became very polluted by all the coal burning, the English preferred to put up with it, as they needed their wood for making charcoal. Charcoal was needed in large quantities for iron smelting, and the processing of other metals. Wood was also used in large quantities to build naval warships. …
By this time, [around 1700] most of Europe and especially England had cut down most of their forests. As they came to rely on coal for fuel, the demand for coal grew quickly.
[619] Article: “Coal.” Encyclopædia Britannica Ultimate Reference Suite 2004.
Coal was used commercially by the Chinese long before it was utilized in Europe. Although no authentic record is available, coal from the Fu-shun mine in northeastern China may have been employed to smelt copper as early as 1000 BC. …
Coal cinders found among Roman ruins in England suggest that the Romans were familiar with its use before AD 400. The first documented proof that coal was mined in Europe was provided by the monk Reinier of Liège, who wrote (about 1200) of black earth very similar to charcoal used by metalworkers. Many references to coal mining in England, Scotland, and the European continent began to appear in the writings of the 13th century. Coal was, however, used only on a limited scale until the early 18th century when Abraham Darby of England and others developed methods of using coke made from coal in blast furnaces and forges. Successive metallurgical and engineering developments—most notably the invention of the coal-burning steam engine by James Watt—engendered an almost insatiable demand for coal.
[620] Report: “bp Statistical Review of World Energy 2022.” BP, June 29, 2022. <www.bp.com>
Page 51: “Electricity Generation by Fuel* … Terawatt-hours… 2021 … Total World … Oil [=] 720.3 … Natural Gas [=] 6518.5 … Coal [=] 10244.0 … Nuclear energy [=] 2800.3 … Hydroelectric [=] 4273.8 … Renewables [=] 3657.2 … Other‡ [=] 252.2 … Total [=] 28466.3”
[621] Book: Fundamentals of Natural Gas. By Vivek Chandra. Pennwell, 2006. <vdoc.pub>
“Coal remains the dominant fuel for the world’s thermal electric power plants. … Coal has been the main thermal electric fuel due to its cheap price, worldwide availability, easy transport, and low-technology threshold.”
[622] Calculated with data from the webpage: “Coal Explained: Data & Statistics.” U.S. Energy Information Administration. Last updated October 19, 2021. <www.eia.gov>
|
Coal Consumption by End-Use Sector |
|
|
Electric Power Sector |
436,524 thousand short tons |
|
Other Industrial |
25,584 thousand short tons |
|
Coke Plants |
14,414 thousand short tons |
|
Commercial |
793 thousand short tons |
CALCULATIONS:
[623] Brief: “What Is the Role of Coal in the United States?” U.S. Energy Information Administration. Last updated July 18, 2012. <www.eia.gov>
“Besides its role in generating electricity, coal also has industrial applications in cement making and conversion to coke for the smelting of iron ore at blast furnaces to make steel. A small amount of coal is also burned to heat commercial, military, and institutional facilities, and an even smaller amount is used to heat homes.”
[624] Study guide: “Coal.” U.S. Department of Energy, February, 24, 2010. <energy.gov>
Page 2:
Coal is also used in the industrial and manufacturing industries. The steel industry, for example, uses large amounts of coal. The coal is baked in hot furnaces to make coke, which is used to smelt iron ore into the iron needed for making steel. The very high temperatures created from the use of coke gives steel the strength and flexibility needed for making bridges, buildings, and automobiles.
Coal’s heat and by-products are also used to make a variety of products. For example, methanol and ethylene—ingredients in coal that can be separated out—can be used to make plastics, tar, synthetic fibers, fertilizers, and medicines.
[625] Article: “Coal.” Encyclopædia Britannica Ultimate Reference Suite 2004.
“Coal is an abundant natural resource that can be used as a source of energy, as a chemical feedstock from which numerous synthetic compounds (e.g., dyes, oils, waxes, pharmaceuticals, and pesticides) can be derived, and in the production of coke for metallurgical processes.”
[626] Report: “Annual Energy Review 2011.” U.S. Energy Information Administration, Office of Energy Statistics, September 2012. <www.eia.gov>
Page 352:
Coke, Coal: A solid carbonaceous residue derived from low-ash, low-sulfur bituminous coal from which the volatile constituents are driven off by baking in an oven at temperatures as high as 2,000 degrees Fahrenheit so that the fixed carbon and residual ash are fused together. Coke is used as a fuel and as a reducing agent in smelting iron ore in a blast furnace. Coke from coal is gray, hard, and porous and has a heating value of 24.8 million Btu per short ton.
[627] Report: “International Energy Outlook 2016.” U.S. Energy Information Administration, May 2016. <www.eia.gov>
Pages 81–83:
Many countries, particularly among the developed OECD [Organization for Economic Co-operation and Development] nations are pursuing policies and regulations intended to increase the pressure on generators to reduce greenhouse gas emissions from electric power plants by decreasing the use of fossil fuels. As a result, the role of coal as a dominant fuel for electric power plants is being reduced. Since the last forecast cycle, there have been significant revisions to national clean energy policies to reduce emissions, including China’s target of 15% renewable electricity by 2020,164 the European Union’s 2030 Energy Framework objectives,165 and India’s megawatts-to-gigawatts renewable energy commitment.166 The IEO2016 [International Energy Outlook 2016] Reference case analysis incorporates many updated targets that reflect the revised regulations and national energy policies that affect renewable energy. (See later sections for region- or fuel-specific revisions.) The effect of the recently finalized Clean Power Plan (CPP) regulations in the United States is not included in the IEO2016 Reference case, but its effects are considered in discussions, tables, and figures throughout the report, based on U.S. Energy Information Administration (EIA) analysis of the proposed rule, which had similar elements.
[628] Calculated with data from the report: “International Energy Outlook 2019.” U.S. Energy Information Administration. September 24, 2019. <www.eia.gov>
“Reference Case Projection Tables (2018–2050), Electricity Capacity and Generation.” <www.eia.gov>
NOTE: An Excel file containing the data and calculations is available upon request.
[629] Calculated with data from the report: “bp Statistical Review of World Energy 2022.” BP, June 29, 2022. <www.bp.com>
Page 51: “Electricity Generation by Fuel* … Terawatt-hours… 2021 … Total World … Oil [=] 720.3 … Natural Gas [=] 6518.5 … Coal [=] 10244.0 … Nuclear energy [=] 2800.3 … Hydroelectric [=] 4273.8 … Renewables [=] 3657.2 … Other‡ [=] 252.2 … Total [=] 28466.3”
CALCULATION: 10,244.0 / 28,466.3 = 36%
[630] Book: Fundamentals of Natural Gas. By Vivek Chandra. Pennwell, 2006. <vdoc.pub>
“Coal remains the dominant fuel for the world’s thermal electric power plants. … Coal has been the main thermal electric fuel due to its cheap price, worldwide availability, easy transport, and low-technology threshold.”
[631] Calculated with data from the report: “July 2022 Monthly Energy Review.” U.S. Energy Information Administration, Office of Energy Statistics, July 26, 2022. <www.eia.gov>
Page 7: “Table 1.3 Primary Energy Consumption by Source (Quadrillion Btu) … 2021 Total … Coal [=] 10.547 … Totalg [=] 97.331”
CALCULATION: 10.547 / 97.331 = 10.8%
[632] Calculated with data from the report: “July 2022 Monthly Energy Review.” U.S. Energy Information Administration, Office of Energy Statistics, July 26, 2022. <www.eia.gov>
Page 41: “Table 2.2. Residential Sector Energy Consumption”
Page 43: “Table 2.3. Commercial Sector Energy Consumption”
Page 45: “Table 2.4. Industrial Sector Energy Consumption”
Page 47: “Table 2.5. Transportation Sector Energy Consumption”
Page 49: “Table 2.6. Electric Power Sector Energy Consumption”
NOTE: An Excel file containing the data and calculations is available upon request.
[633] Report: “Electric Power Annual 2020.” U.S. Energy Information Administration, Assistant Administrator for Energy Statistics, October 29, 2021. Updated 3/10/22. <www.eia.gov>
Page 66 (of PDF):
Table 4.1. Count of Electric Power Industry Power Plants, by Sector, by Predominant Energy Sources Within Plant, 2010 through 2020 … Total (All Sectors) … 2020 … Coal [=] 284 …
Notes: the number of power plants for each energy source is the number of sites for which the respective energy source was reported as the most predominant energy source for at least one of its generators. If all generators for a site have the same energy source reported as the most predominant, that site will be counted once under that energy source. However, if the most predominant energy source is not the same for all generators within a site, the site is counted more than once, based on the number of most predominant energy sources for generators at a site. In general, this table translates the number of generators by energy source into the number of sites represented by the generators for an energy source. Therefore, the count for Total (All Sectors) above is the sum of the counts for each sector by energy source and does not necessarily represent unique sites. In addition, changes to predominant energy sources and status codes from year to year may result in changes to previously-posted data.
Page 70 (of PDF):
Table 4.3. Existing Capacity by Energy Source, 2020 (Megawatts) … Energy Source … Coal … Number of Generators [=] 599 …
Notes: Coal includes anthracite, bituminous, subbituminous, lignite, and waste coal; coal synfuel and refined coal; and beginning in 2011, coal-derived synthesis gas.
[634] Booklet: “Energy, Powering Your World.” By M.T. Westra and S. Kuyvenhoven. Foundation for Fundamental Research on Matter, Institute for Plasma Physics, Rijnhuizen (the Netherlands), 2002. <fire.pppl.gov>
Page 27:
In an electrical generator electricity is made by turning a magnet in a magnetic field. The changing magnetic field drives the electrical current. With the exception of solar cells and fuel cells (which are discussed in chapters 4 and 6), all ways of generating electricity in some way drive a generator of this type. For example, fossil fuels are used to heat water into steam, which can be used to power a steam turbine. The steam turbine then drives the electrical generator.
A gas turbine works in a similar way: when the gas is ignited and starts to burn, it expands. The expanding gas is used to power an electrical generator through a turbine. In addition, the heat of the burning gas is then used to make steam, which powers a steam turbine.
This process is called combined cycle, and it has a high efficiency. If the waste heat of the steam turbine is also used, for example by a factory or for household heating, we have a Cogeneration Plant or Combined Heat and Power Plant.
[635] Booklet: “What You Need to Know About Energy.” National Academy of Sciences, 2008. <nap.nationalacademies.org>
A typical coal-fired electrical plant might be 38% efficient, so a little more than one-third of the chemical energy content of the fuel is ultimately converted to usable electricity. …
In natural gas combined cycle, or NGCC, power plants, we now have technology that takes the waste heat from a natural gas turbine and uses it to power a steam turbine, resulting in a power plant that is as much as 60% efficient.5 Similar technologies are being developed for use in coal power plants.
[636] Calculated with data from the report: “July 2022 Monthly Energy Review.” U.S. Energy Information Administration, Office of Energy Statistics, July 26, 2022. <www.eia.gov>
Page 49: “Table 2.6. Electric Power Sector Energy Consumption”
NOTE: An Excel file containing the data and calculations is available upon request.
[637] Calculated with data from the report: “July 2022 Monthly Energy Review.” U.S. Energy Information Administration, Office of Energy Statistics, July 26, 2022. <www.eia.gov>
Page 132: “Table 7.2b. Electricity Net Generation: Electric Power Sector (Subset of Table 7.2a; Million Kilowatthours)” <www.eia.gov>
NOTE: An Excel file containing the data and calculations is available upon request.
[638] Calculated with data from the report: “Electric Power Monthly with Data for January 2022.” U.S. Energy Information Administration, Office of Energy Statistics, March 24, 2022. <www.eia.gov>
Page 17 (of PDF): “Table 1.1. Net Generation by Energy Source: Total (All Sectors), 2012–January 2022 (Thousand Megawatthours)”
Page 18 (of PDF): “Table 1.1.A. Net Generation from Renewable Sources: Total (All Sectors), 2012–January 2022 (Thousand Megawatthours)”
NOTES:
[639] Report: “July 2022 Monthly Energy Review.” U.S. Energy Information Administration, Office of Energy Statistics, July 26, 2022. <www.eia.gov>
Page 119: “Table 6.1 Coal Overview (Thousand Short Tons) … 2021 … Productiona [=] R577,450 … Net Importsc [=] –79,727 …Consumption [=] 545,671 … R = Revised.”
[640] Entry: “ton.” American Heritage Science Dictionary. Houghton Mifflin, 2005. Updated in 2009. <www.thefreedictionary.com>
“A unit of weight equal to 2,000 pounds (0.907 metric ton or 907.18 kilograms). Also called net ton, short ton.”
[641] Brief: “What Is the Role of Coal in the United States?” U.S. Energy Information Administration. Last updated July 18, 2012. <www.eia.gov>
“In 2009, coal began losing its price advantage over natural gas for electricity generation in some parts of the country, particularly in the eastern United States as a surge in natural gas production from domestic shale deposits (made possible by advances in drilling technologies) substantially reduced the price of natural gas.”
[642] Report: “Natural Gas-Electricity Primer.” By Randy Friedman and others. Pacific Northwest Utilities Conference Committee/Northwest Natural Gas Association Planning Task Force, August 2012. <docplayer.net>
Page 3: “As emissions from coal-fired power plants have come under increasing public scrutiny, more and more electric utilities and merchant power producers have turned to natural gas for new baseload and peaking generation.”
[643] Report: “Annual Energy Outlook 2013 with Projections to 2040.” U.S. Energy Information Administration, April 2013. <www.osti.gov>
Page 39:
Since 2009 natural gas prices have been relatively low, making efficient natural gas-fired combined-cycle plants increasingly competitive to operate in comparison with existing coal-fired plants, particularly in the Southeast and other regions where they have been used to meet demand formerly served by coal-fired plants. In 2012, as natural gas prices reached historic lows, there were many months when natural gas displacement of coal-fired generation was widespread nationally. …
At any point, short-term competition between existing coal- and gas-fired generators—i.e., the decisions determining which generators will be dispatched to generate electricity—depends largely on the relative operating costs for each type of generation, of which fuel costs are a major portion. A second aspect of competition occurs over the longer term, as developers choose which fuels and technologies to use for new capacity builds and whether or not to make mandated or optional upgrades to existing plants. The natural gas or coal share of total generation depends both on the available capacity of each fuel type (affected by the latter type of competition) and on how intensively the capacity is operated. …
In recent years, natural gas has come into dispatch-level competition with coal as the cost of operating natural gas-fired generators has neared the cost of operating coal-fired generators. A number of factors led to the growing competition, including:
• A build-out of efficient combined-cycle capacity during the early 2000s, which in general was used infrequently until recently
• Expansion of the natural gas pipeline network, reducing uncertainty about the availability of natural gas
• Gains in natural gas production from domestic shale formations that have contributed to falling natural gas prices
• Rising coal prices.
Until mid-2008, coal-fired generators were cheaper to operate than natural gas-fired generators in most applications and regions. Competition between available natural gas combined-cycle generators (NGCC) and generators burning eastern (Appalachian) and imported coal began in southeastern electric markets in 2009. Rough parity between NGCC and more expensive coal-fired plants continued until late 2011, when increased natural gas production led to a decline in the fuel price and, in the spring of 2012, a dramatic increase in competition between natural gas and even less expensive types of coal. With natural gas-fired generation increasing steadily, the natural gas share of U.S. electric power sector electricity generation was almost equal to the coal share for the first time in April 2012.
Page 41:
Coal and natural gas prices are key factors in the decision to retire a power plant, along with environmental regulations and the demand for electricity. … The interaction of fuel prices and environmental rules is a key factor in coal plant retirements. AEO2013 [Annual Energy Outlook 2013] assumes that all coal-fired plants have flue gas desulfurization equipment (scrubbers) or dry sorbent injection systems installed by 2016 to comply with the Mercury and Air Toxics Standards. Higher coal prices, lower wholesale electricity prices (often tied to natural gas prices), and reduced use may make investment in such equipment uneconomical in some cases, resulting in plant retirements. …
For new builds, natural gas and renewables generally are more competitive than coal, and concerns surrounding potential future GHG [greenhouse gas] legislation also dampen interest in new coal-fired capacity82. New capacity additions are not the most important factor in the competition between coal and natural gas for electricity generation. There is also significant dispatch-level competition in determining how intensively to operate existing coal-fired power plants versus new and existing natural gas-fired plants.
Page 44:
In addition to relative fuel prices, a number of factors influence the competition between coal-fired steam turbines and natural gas-fired combined-cycle units. One factor in the dispatch-level competition is the availability of capacity of each type. In New England, for example, competition between coal and natural gas is not discussed, because very little coal-fired capacity exists or is projected to be built in that region…. New England is located far from coal sources, and a regional cap on GHG emissions is in place, which makes investment in new coal-fired capacity unlikely. …
… Another component of operating costs not mentioned above is the cost of buying emissions allowances for plants covered by the Acid Rain Program and Clean Air Interstate Rule. In recent years, allowance prices have dropped to levels that make them essentially negligible, although for many years they were a significant component of operating costs.
[644] Article: “Coal-Heavy Indianapolis Getting a New Combined Cycle Plant.” By Thomas Overton. POWER, June 3, 2013. <www.powermag.com>
“The 341-MW coal-fired plant, which first came online in 1949, will shut down in March 2016. IPL [Indianapolis Power & Light] had concluded that replacing the plant made more economic sense than trying to bring it into compliance with Environmental Protection Agency (EPA) emissions regulations.”
[645] Calculated with data from the report: “July 2022 Monthly Energy Review.” U.S. Energy Information Administration, Office of Energy Statistics, July 26, 2022. <www.eia.gov>
Page 119: “Table 6.1: Coal Overview (Thousand Short Tons)”
NOTE: An Excel file containing the data and calculations is available upon request.
[646] Report: “Annual Coal Report 2020.” U.S. Energy Information Administration, Independent Statistics & Analysis, October 2021. <www.eia.gov>
Page 58:
Table 31. Average Sales Price of Coal by State and Coal Rank, 2020
(dollars per short ton) …
U.S. Total … Total [=] 31.41
[647] Report: “Annual Energy Review 2011.” U.S. Energy Information Administration, Office of Energy Statistics, September 2012. <www.eia.gov>
Page 351: “Captive Coal: Coal produced to satisfy the needs of the mine owner, or of a parent, subsidiary, or other affiliate of the mine owner (for example, steel companies and electricity generators), rather than for open market sale. See Open Market Coal.”
Page 357:
Free on Board (F.O.B.): A sales transaction in which the seller makes the product available for pick up at a specified port or terminal at a specified price and the buyer pays for the subsequent transportation and insurance.
Free on Board (F.O.B.) Rail/Barge Price: the free on board price of coal at the point of first sale. It excludes freight or shipping and insurance costs.
Page 363: “Open Market Coal: Coal sold in the open market, i.e., coal sold to companies other than the reporting company’s parent company or an operating subsidiary of the parent company. See Captive Coal.”
[648] Calculated with data from:
a) Report: “Annual Energy Review 2011.” U.S. Energy Information Administration, Office of Energy Statistics, September 2012. <www.eia.gov>
Page 71: “Table 3.2. Value of Fossil Fuel Production, Selected Years, 1949–2011 (Billion Dollars)”
b) Report: “Annual Energy Review 2011.” U.S. Energy Information Administration, Office of Energy Statistics, September 2012. <www.eia.gov>
Page 201: “Table 7.2. Coal Production, Selected Years, 1949–2011 (Million Short Tons)”
c) Report: “Annual Energy Review 2011.” U.S. Energy Information Administration, Office of Energy Statistics, September 2012. <www.eia.gov>
Page 215: “Table 7.9. Coal Prices, Selected Years, 1949–2011 (Dollars Per Short Ton)”
d) “Annual Coal Reports 2008–2020.” U.S. Energy Information Administration. Accessed August 30, 2022 at <www.eia.gov>
“Table 31. Average Sales Price of Coal by State and Coal Rank (Dollars Per Short Ton).”
2008, 2009, 2010, 2011, 2012, 2013, 2014, 2015, 2016, 2017, 2018, 2019, 2020
e) Dataset: “CPI—All Urban Consumers (Current Series).” U.S. Department of Labor, Bureau of Labor Statistics. Accessed February 5, 2022 at <www.bls.gov>
“Series Id: CUUR0000SA0; Series Title: All Items in U.S. City Average, All Urban Consumers, Not Seasonally Adjusted; Area: U.S. City Average; Item: All Items; Base Period: 1982–84=100”
NOTES: An Excel file containing the data and calculations is available upon request.
[649] “Kansas Energy Report 2009.” Kansas Energy Council, January 7, 2009. <www.justfacts.com>
Page 26:
Electricity peak loads in Kansas are the greatest during the summer months, primarily due to the electricity needs of air-conditioning systems. …
In order to cost-effectively meet the varying demand of their customers at different times of the year and even different times of the day, most utilities maintain a diverse portfolio of electric power plants (e.g., generating units) that use a variety of fuels. These generating units can be distinguished according to the type of power they produce (firm vs. intermittent) as well as the type of load they are designed to meet (base, peak, or intermediate).
[650] Webpage: “Demand for Electricity Changes Through the Day.” U.S. Energy Information Administration, April 6, 2011. <www.eia.gov>
“Electric power systems must match generation and load in real time, with tight tolerances. As a result, both system stress and prices can vary considerably throughout the day. … Load curve shapes vary among regions and change with the season of the year.”
[651] Report: “Methods for Analyzing Electric Load Shape and Its Variability.” By P. Price. Ernest Orlando Lawrence Berkeley National Laboratory, Environmental Energy Technologies Division, May 2010. <eta-publications.lbl.gov>
Page 1:
“Whole-building electric load” is the total electrical power used by a building at a given moment. The load changes with time in response to changes in lighting levels; heating, ventilating, and air conditioning (HVAC) requirements; and uses such as computers, copy machines, and so on. The curve that represents load as a function of time, called the “load shape,” can often yield useful information. Unexpectedly high night-time loads may indicate waste (such as lights that needlessly remain on when the building is unoccupied); a change in load shape may indicate an equipment or thermostat malfunction; unexpectedly high sensitivity to outdoor temperature may indicate that excessive outdoor air is being brought into the building by the HVAC system; and so on.
[652] “Kansas Energy Report 2009.” Kansas Energy Council, January 7, 2009. <www.justfacts.com>
Page 26:
Electricity consumption (also called “load”) is divided into three categories: base, peak, and intermediate load. Base load refers to demand that occurs continuously, day and night, seven days a week. Peak load, on the other hand, refers to maximum demand that occurs within a given period of time. Intermediate load is a more generic term applied to demand that occurs between base and peak load.
[653] Webpage: “Glossary.” U.S. Energy Information Administration. Accessed July 18, 2013 at <www.eia.gov>
Peak load: the maximum load during a specified period of time.
Base load: the minimum amount of electric power delivered or required over a given period of time at a steady rate.
Base load capacity: the generating equipment normally operated to serve loads on an around-the-clock basis.
Base load plant: A plant, usually housing high-efficiency steam-electric units, which is normally operated to take all or part of the minimum load of a system, and which consequently produces electricity at an essentially constant rate and runs continuously. These units are operated to maximize system mechanical and thermal efficiency and minimize system operating costs.
[654] Report: “Methods for Analyzing Electric Load Shape and Its Variability.” By P. Price. Ernest Orlando Lawrence Berkeley National Laboratory, Environmental Energy Technologies Division, May 2010. <eta-publications.lbl.gov>
Page 22: “Figure 15: Sketch indicating five parameters that we recommend as a minimum set to characterize load shape. The value of each parameter can be calculated for each day; these values can then be summarized (e.g. average peak load, standard deviation of peak load).”
[655] Report: “Nuclear Power’s Role in Generating Electricity.” Congressional Budget Office, May 2008. <www.cbo.gov>
Page 2: “Historically, most base-load capacity has been provided using coal or nuclear technologies because, once the plants have been built, low fuel costs make them relatively cheap to operate continuously.”
Page 4: “Pulverized coal power plants, which burn solid coal ignited by injected air, are by far the most common option for generating base-load electricity.”
[656] “Kansas Energy Report 2009.” Kansas Energy Council, January 7, 2009. <www.justfacts.com>
Page 27:
Power plants that are used to meet the minimum or “base load” of the system are referred to as base-load generating units; they are run continuously and operated, in general, so as to produce electricity at a constant rate. Base-load units are operated to maximize system mechanical and thermal efficiency and minimize system operating costs. Costs are minimized by operating units with the lowest fuel costs for the most hours in the year (i.e., at a high capacity factor). Generally, base-load units include nuclear, coal-fired, geothermal, hydropower, and waste-to-energy plants.63
[657] Book: Fundamentals of Natural Gas. By Vivek Chandra. Pennwell, 2006. <vdoc.pub>
Coal remains the dominant fuel for the world’s thermal electric power plants. … Coal has been the main thermal electric fuel due to its cheap price, worldwide availability, easy transport, and low-technology threshold. Coal’s biggest drawback is the pollution emitted from its combustion. …
Typically, base load power stations are large nuclear, hydroelectric, or coal-burning plants that are expensive to build, with high fixed costs. However, they are cheap to maintain and operate. They operate continuously and are difficult to switch on or off.
[658] Book: Fundamentals of Natural Gas. By Vivek Chandra. Pennwell, 2006. <vdoc.pub>
“The development of IPPs [Independent Power Producers] and the increased efficiency of gas-fired combined cycle plants have allowed gas to become the fuel of choice in both intermediate and peak load phases.”
[659] Report: “Annual Energy Outlook 2013 with Projections to 2040.” U.S. Energy Information Administration, April 2013. <www.osti.gov>
Page 44:
In general, [natural gas] combined-cycle units are considered to be more flexible than steam turbines. They can ramp their output up and down more easily, and their start-up and shutdown procedures involve less time and expense. However, plants that are operated more flexibly (i.e., ramping up and down and cycling on and off) often have higher maintenance requirements and higher maintenance costs.
[660] Report: “Nuclear Power’s Role in Generating Electricity.” Congressional Budget Office, May 2008. <www.cbo.gov>
Page 2: “Even though natural gas prices have increased significantly in recent years, natural gas remains the dominant source of peak capacity because power plants using that fuel are less expensive to build than coal-fired plants or nuclear reactors and easier to start up and shut down.”
[661] Webpage: “Demand for Electricity Changes Through the Day.” U.S. Energy Information Administration, April 6, 2011. <www.eia.gov>
The transition from relatively lower loads to higher loads in the morning is called the “morning ramp”. This transition can stress power systems and lead to volatile prices. … Responding to such load changes often requires using units that can start up quickly. These units can be more expensive to operate than units that stay on for long periods such as baseload units. Power prices can increase during ramping, sometimes considerably, for short periods.
[662] Brief: “What Is the Role of Coal in the United States?” U.S. Energy Information Administration. Last updated July 18, 2012. <www.eia.gov>
“In 2009, coal began losing its price advantage over natural gas for electricity generation in some parts of the country, particularly in the eastern United States as a surge in natural gas production from domestic shale deposits (made possible by advances in drilling technologies) substantially reduced the price of natural gas.”
[663] Article: “On the Rise.” By Thomas Helbling. International Monetary Fund Finance & Development, March 2013. Pages 34–37. <www.imf.org>
Page 36: “The main increased usage of gas has occurred in the U.S. power sector, where the share of electricity produced with natural gas has started to rise because many power plants can switch between gas and the now relatively more expensive (and dirtier) coal.”
[664] Report: “Natural Gas-Electricity Primer.” By Randy Friedman and others. Pacific Northwest Utilities Conference Committee/Northwest Natural Gas Association Planning Task Force, August 2012. <docplayer.net>
Page 3:
In the United States, over the past decade, the single largest sector of natural gas demand growth has occurred in the area of power generation. As emissions from coal-fired power plants have come under increasing public scrutiny, more and more electric utilities and merchant power producers have turned to natural gas for new baseload and peaking generation. This trend has been accelerated in recent years, due to the boom of shale gas production, the relatively short lead time and low cost of natural gas-fired power plant construction, and the robust flexibility that natural gas-fired plants can bring to the area of Variable Energy Resource (VER) integration (i.e., wind and solar).
[665] Report: “Annual Energy Outlook 2013 with Projections to 2040.” U.S. Energy Information Administration, April 2013. <www.osti.gov>
Page 39:
Over the past 20 years, natural gas has been the go-to fuel for new electricity generation capacity. From 1990 to 2011, natural gas-fired plants accounted for 77 percent of all generating capacity additions, and many of the plants added were very efficient combined-cycle plants. However, with slow growth in electricity demand and spikes in natural gas prices between 2005 and 2008, much of the added capacity was used infrequently. Since 2009 natural gas prices have been relatively low, making efficient natural gas-fired combined-cycle plants increasingly competitive to operate in comparison with existing coal-fired plants, particularly in the Southeast and other regions where they have been used to meet demand formerly served by coal-fired plants. In 2012, as natural gas prices reached historic lows, there were many months when natural gas displacement of coal-fired generation was widespread nationally. …
At any point, short-term competition between existing coal- and gas-fired generators—i.e., the decisions determining which generators will be dispatched to generate electricity—depends largely on the relative operating costs for each type of generation, of which fuel costs are a major portion. A second aspect of competition occurs over the longer term, as developers choose which fuels and technologies to use for new capacity builds and whether or not to make mandated or optional upgrades to existing plants. The natural gas or coal share of total generation depends both on the available capacity of each fuel type (affected by the latter type of competition) and on how intensively the capacity is operated. …
In recent years, natural gas has come into dispatch-level competition with coal as the cost of operating natural gas-fired generators has neared the cost of operating coal-fired generators. A number of factors led to the growing competition, including:
• A build-out of efficient combined-cycle capacity during the early 2000s, which in general was used infrequently until recently
• Expansion of the natural gas pipeline network, reducing uncertainty about the availability of natural gas
• Gains in natural gas production from domestic shale formations that have contributed to falling natural gas prices
• Rising coal prices.
Until mid-2008, coal-fired generators were cheaper to operate than natural gas-fired generators in most applications and regions. Competition between available natural gas combined-cycle generators (NGCC) and generators burning eastern (Appalachian) and imported coal began in southeastern electric markets in 2009. Rough parity between NGCC and more expensive coal-fired plants continued until late 2011, when increased natural gas production led to a decline in the fuel price and, in the spring of 2012, a dramatic increase in competition between natural gas and even less expensive types of coal. With natural gas-fired generation increasing steadily, the natural gas share of U.S. electric power sector electricity generation was almost equal to the coal share for the first time in April 2012.
Page 41:
Coal and natural gas prices are key factors in the decision to retire a power plant, along with environmental regulations and the demand for electricity. … The interaction of fuel prices and environmental rules is a key factor in coal plant retirements. AEO2013 [Annual Energy Outlook 2013] assumes that all coal-fired plants have flue gas desulfurization equipment (scrubbers) or dry sorbent injection systems installed by 2016 to comply with the Mercury and Air Toxics Standards. Higher coal prices, lower wholesale electricity prices (often tied to natural gas prices), and reduced use may make investment in such equipment uneconomical in some cases, resulting in plant retirements. …
For new builds, natural gas and renewables generally are more competitive than coal, and concerns surrounding potential future GHG [greenhouse gas] legislation also dampen interest in new coal-fired capacity82. New capacity additions are not the most important factor in the competition between coal and natural gas for electricity generation. There is also significant dispatch-level competition in determining how intensively to operate existing coal-fired power plants versus new and existing natural gas-fired plants.
Page 44:
In addition to relative fuel prices, a number of factors influence the competition between coal-fired steam turbines and natural gas-fired combined-cycle units. One factor in the dispatch-level competition is the availability of capacity of each type. In New England, for example, competition between coal and natural gas is not discussed, because very little coal-fired capacity exists or is projected to be built in that region…. New England is located far from coal sources, and a regional cap on GHG emissions is in place, which makes investment in new coal-fired capacity unlikely. …
… Another component of operating costs not mentioned above is the cost of buying emissions allowances for plants covered by the Acid Rain Program and Clean Air Interstate Rule. In recent years, allowance prices have dropped to levels that make them essentially negligible, although for many years they were a significant component of operating costs.
[666] Report: “Annual Energy Outlook 2013 with Projections to 2040.” U.S. Energy Information Administration, April 2013. <www.osti.gov>
Page 3:
Although coal is expected to continue its important role in U.S. electricity generation, there are many uncertainties that could affect future outcomes. Chief among them are the relationship between coal and natural gas prices and the potential for policies aimed at reducing greenhouse gas (GHG) emissions. In 2012, natural gas prices were low enough for a few months for power companies to run natural gas-fired generation plants more economically than coal plants in many areas. During those months, coal and natural gas were nearly tied in providing the largest share of total electricity generation, something that had never happened before.
Page 40:
The difference between average annual prices per million Btu for natural gas and coal delivered to U.S. electric power plants narrowed substantially in 2012, so that the fuel costs of generating power from NGCC [natural gas combined cycle] units and coal steam turbines per megawatthour were essentially equal on a national average basis (Figure 26), given that combined-cycle plants are much more efficient than coal-fired plants. When the ratio of natural gas prices to coal prices is approximately 1.5 or lower, a typical natural gas-fired combined-cycle plant has lower generating costs than a typical coal-fired plant. … Because fuel prices vary by region, and because there is also considerable variation in efficiencies across the existing fleet of both coal-fired and combined-cycle plants, dispatch-level competition between coal and natural gas continues.
Page 43: “The delivered cost of coal in the [southeastern United States] region is somewhat higher than in many other regions. Central Appalachian and Illinois Basin coals must be transported by rail or barge to the Southeast, and coal from the Powder River Basin must travel great distances by rail. The region also uses some imported coal, typically along the Gulf Coast, which tends to be more expensive.”
Page 44:
In addition to relative fuel prices, a number of factors influence the competition between coal-fired steam turbines and natural gas-fired combined-cycle units. One factor in the dispatch-level competition is the availability of capacity of each type. In New England, for example, competition between coal and natural gas is not discussed, because very little coal-fired capacity exists or is projected to be built in that region…. New England is located far from coal sources, and a regional cap on GHG emissions is in place, which makes investment in new coal-fired capacity unlikely.
NOTE: The next footnote documents that natural gas is currently about 2.5 times the price of coal, which is higher than the breakeven point for being competitive with coal in generating baseload power.
[667] Calculated with data from the report: “July 2022 Monthly Energy Review.” U.S. Energy Information Administration, Office of Energy Statistics, July 26, 2022. <www.eia.gov>
Page 169: “Table 9.9. Cost of Fossil-Fuel Receipts at Electric Generating Plants (Dollars per Million Btu, Including Taxes)”
NOTES:
[668] Article: “Natural Gas-Fired Power Plants Are Being Added and Used More in PJM Interconnection.” U.S. Energy Information Administration, October 17, 2018. <www.eia.gov>
Higher capacity factors for natural gas-fired combined-cycle generators in recent years also indicate a fundamental shift in day-to-day operations of these power plants. Natural gas-fired generators were traditionally used as either intermediate load following (cycling) or peaking resources. In recent years, however, combined-cycle power plants have become more competitive with coal-fired plants for baseload operations and have led to increasing retirements of coal plants.
[669] Article: “U.S. Natural Gas Consumption Sets New Record in 2019.” U.S. Energy Information Administration, March 3, 2020. <www.eia.gov>
Natural gas continues to account for the largest share of electricity generation after first surpassing coal-fired generation on an annual basis in 2016. In 2019, natural gas accounted for 38% of total electricity generation, followed by 23% for coal and 20% for nuclear. New natural gas generation capacity additions have continued to displace coal-fired power plants; about 5% of the total existing U.S. coal-fired capacity was retired in 2019. …
The electric power sector has been shifting toward natural gas in the past decade because of competitive natural gas prices and power plant technology improvements.
[670] Article: “More Power Generation Came From Natural Gas in First Half of 2020 Than First Half of 2019.” By Stephen York and Mark Morey. U.S. Energy Information Administration, August 12, 2020. <www.eia.gov>
Natural gas-fired generation in the Lower 48 states increased nearly 55,000 gigawatthours (GWh), or 9%, in the first half of 2020 compared with the first half of 2019. …
Coal-fired generation absorbed most of the decrease in electrical load in the first half of 2020, registering a 138,000 GWh (30%) decline in output. Because of historically low natural gas prices so far in 2020, coal-fired generation this year has been uneconomical in most regions compared with natural gas-fired generation, leading to price-driven coal-to-natural gas fuel switching. …
Coal-to-natural gas switching was most prominent in the PJM Interconnection (PJM), which covers an area stretching from New Jersey to Illinois, and the Midcontinent Independent System Operator (MISO), which primarily includes areas in the Midwest. PJM and MISO together account for about 35% of the total Lower 48 states’ electric power generation. In both interconnections, competition exists between natural gas and coal as generation fuels, so relative shifts in fuel prices can influence the type of power plant that is dispatched.
… In addition, coal-fired generation remains reasonably competitive in ERCOT [Electric Reliability Council of Texas] because power plants have access to low-cost subbituminous coal from Wyoming’s Powder River Basin and to lignite—the lowest quality of coal—produced at mines near several plants.
Capacity additions have also contributed to the growth in natural gas-fired generation. According to the Electric Power Monthly, about 18,000 megawatts (MW) of net capacity from new combined-cycle natural gas turbine plants has entered service since 2018. Output from these highly efficient plants has been steadily ramping up and helping to drive increases in generation.
[671] Report: “Short-Term Energy Outlook.” U.S. Energy Information Administration, May 2021. <www.eia.gov>
Pages 3–4:
We expect the share of electric power generated from natural gas in the United States will average 35% in both 2021 and 2022, down from 39% in 2020. The forecast share for natural gas as a generation fuel declines in response to an 85% increase in the average delivered natural gas price for electricity generators, from an average $2.39/MMBtu [million British thermal units] in 2020 to an average $4.41/MMBtu in 2021. As a result of the higher expected natural gas prices, the forecast share of generation from coal rises from 20% in 2020 to 24% this year and to 23% next year. …
We expect U.S. coal production to total 582 million short tons (MMst) in 2021, 43 MMst (8%) more than in 2020. The increase in coal production is primarily driven by rising use of coal for electricity generation in response to rising natural gas prices. Recent strikes in Appalachia metallurgical coal mines likely limited production increases in April, but we do not expect them to significantly affect production through the rest of 2021. In 2022, we expect coal production to grow by an additional 23 MMst (4%).
[672] Booklet: “Energy, Powering Your World.” By M.T. Westra and S. Kuyvenhoven. Foundation for Fundamental Research on Matter, Institute for Plasma Physics, Rijnhuizen (the Netherlands), 2002. <fire.pppl.gov>
Page 27:
In an electrical generator electricity is made by turning a magnet in a magnetic field. The changing magnetic field drives the electrical current. With the exception of solar cells and fuel cells (which are discussed in chapters 4 and 6), all ways of generating electricity in some way drive a generator of this type. For example, fossil fuels are used to heat water into steam, which can be used to power a steam turbine. The steam turbine then drives the electrical generator.
A gas turbine works in a similar way: when the gas is ignited and starts to burn, it expands. The expanding gas is used to power an electrical generator through a turbine. In addition, the heat of the burning gas is then used to make steam, which powers a steam turbine.
This process is called combined cycle, and it has a high efficiency. If the waste heat of the steam turbine is also used, for example by a factory or for household heating, we have a Cogeneration Plant or Combined Heat and Power Plant.
[673] Report: “Annual Energy Outlook 2013 with Projections to 2040.” U.S. Energy Information Administration, April 2013. <www.osti.gov>
Page 40:
The difference between average annual prices per million Btu for natural gas and coal delivered to U.S. electric power plants narrowed substantially in 2012, so that the fuel costs of generating power from NGCC [natural gas combined cycle] units and coal steam turbines per megawatthour were essentially equal on a national average basis (Figure 26), given that combined-cycle plants are much more efficient than coal-fired plants. When the ratio of natural gas prices to coal prices is approximately 1.5 or lower, a typical natural gas-fired combined-cycle plant has lower generating costs than a typical coal-fired plant.
[674] Booklet: “What You Need to Know About Energy.” National Academy of Sciences, 2008. <nap.nationalacademies.org>
A typical coal-fired electrical plant might be 38% efficient, so a little more than one-third of the chemical energy content of the fuel is ultimately converted to usable electricity. …
In natural gas combined cycle, or NGCC, power plants, we now have technology that takes the waste heat from a natural gas turbine and uses it to power a steam turbine, resulting in a power plant that is as much as 60% efficient.5 Similar technologies are being developed for use in coal power plants.
[675] Calculated with data from the report: “July 2022 Monthly Energy Review.” U.S. Energy Information Administration, Office of Energy Statistics, July 26, 2022. <www.eia.gov>
Page 169: “Table 9.9. Cost of Fossil-Fuel Receipts at Electric Generating Plants (Dollars per Million Btu, Including Taxes)”
NOTE: An Excel file containing the data and calculations is available upon request.
[676] Study guide: “Coal.” U.S. Department of Energy, February, 24, 2010. <energy.gov>
Pages 2–3:
Surface mining accounts for about 60 percent of the coal produced in the United States. It is used mostly in the West where huge coal deposits lie near the surface and can be up to 100 feet thick.
In surface mining, bulldozers clear and level the mining area. Topsoil is removed and stored for later use in the land reclamation process. Specially designed machines—draglines, or large shovels—clear away the overburden (material overlaying coal that must be removed before mining can commence) to expose the coal bed. Smaller shovels load the coal into large trucks that remove the coal from the pit.
Before mining begins, coal companies must post bonds for each acre of land to be mined to assure that it will be properly reclaimed. In the reclamation process, first the overburden, then the soils are replaced and the area restored as nearly as possible to its original contours. Since 1977, more than 2 million acres of coal mine lands have been reclaimed in this manner.
Where coal seams are too deep or the land is too hilly for surface mining, coal miners must go underground to extract the coal. Most underground mining takes place east of the Mississippi, especially in the Appalachian mountain states and is used to produce about 30 percent of U.S. coal today.
[677] Dataset: “Coal Fatalities for 1900 Through 2020.” U.S. Department of Labor, Mine Safety and Health Administration. Accessed April 20, 2021 at <arlweb.msha.gov>
“Coal Fatalities for 1900 Through 2020 … Please Note: Office workers included starting in 1973. … Year [=] 2020 … Fatalities [=] 5”
[678] Article: “Coal.” Encyclopædia Britannica Ultimate Reference Suite 2004.
Mining operations are hazardous. Each year hundreds of coal miners lose their lives or are seriously injured. Major mine hazards include roof falls, rock bursts, and fires and explosions. The latter result when flammable gases (such as methane) trapped in the coal are released during mining operations and accidentally are ignited. Promising research in the extraction of methane from coal beds prior to mining is expected to lead to safer mines and provide a source of natural gas that has been wasted for so long. Also, the repeated inhalation of coal dust over extended periods of time can result in serious health problems, as, for example, anthracosis (commonly called black lung disease).
[679] Study guide: “Coal.” U.S. Department of Energy, February, 24, 2010. <energy.gov>
Page 3: “Underground mining today is highly mechanized.”
[680] Webpage: “Injury Trends in Mining.” U.S. Department of Labor, Mine Safety and Health Administration. Accessed September 8, 2013 at <www.msha.gov>
Since the earliest days of mining, the job of digging coal and other useful minerals out of the earth has been considered one of the world’s most dangerous occupations. During the twentieth century, public concern about the toll of deaths, injuries and destruction in mine accidents prompted passage of much-needed safety legislation and intensified the search for safer methods and improved training practices and technology.
Today, mine safety and health legislation and advances in technology and training have reduced mining deaths and injuries from earlier high levels. However, any mining death or injury is still unacceptable.
[681] Dataset: “Coal Fatalities for 1900 Through 2020.” U.S. Department of Labor, Mine Safety and Health Administration. Accessed April 20, 2021 at <arlweb.msha.gov>
NOTE: An Excel file containing the data is available upon request.
[682] Article: “Coal.” Encyclopædia Britannica Ultimate Reference Suite 2004.
Coal mines and coal-preparation plants caused much environmental damage in the past. Surface areas exposed during mining, as well as coal and rock waste (which were often dumped indiscriminately), weathered rapidly, producing abundant sediment and soluble chemical products such as sulfuric acid and iron sulfates. Nearby streams became clogged with sediment, iron oxides stained rocks, and “acid mine drainage” caused marked reductions in the numbers of plants and animals living in the vicinity. Potentially toxic elements, leached from the exposed coal and adjacent rocks, were released into the environment. Since the 1970s, however, stricter laws have significantly reduced the environmental damage caused by coal mining.
[683] Webpage: “Coal Explained: How Much Coal is Left.” U.S. Energy Information Administration. Last updated October 19, 2021. <www.eia.gov>
As of December 31, 2020, estimates of total world proved recoverable reserves of coal were about 1,156 billion short tons (or about 1.16 trillion short tons), and five countries had about 75% of the world’s proved coal reserves.
The top five countries and their percentage share of world proved coal reserves as of 12/31/2020:
• United States—22%
• Russia—15%
• Australia—14%
• China—14%
• India—10%
[684] Study Guide: “Coal.” U.S. Department of Energy, February, 24, 2010. <energy.gov>
Page 1:
Coal is the most plentiful fuel in the fossil family. The United States has more coal reserves than any other country in the world. In fact, one-fourth of all known coal in the world is in the United States, with large deposits located in 38 states. The United States has almost as much energy in coal that can be mined as the rest of the world has in oil that can be pumped from the ground.
[685] Calculated with data from report: “Annual Coal Report 2020.” U.S. Energy Information Administration, Independent Statistics & Analysis, October 2021. <www.eia.gov>
Page 24: “Table 15. Recoverable Coal Reserves at Producing Mines, Estimated Recoverable Reserves, and Demonstrated Reserve Base by Mining Method, 2020 (million short tons) … Total … Estimated Recoverable Reserves … U.S. Total [=] 251,539”
Pages x–xi: “Table ES1. Coal Production, 1949–2020 (short tons) … Total1 … 2020 [=] 535,434,354”
Pages 47–48: “Table 26. U.S. Coal Consumption by End Use Sector, Census Division, and State, 2020 and 2019 (thousand short tons) … Total … 2020 … U.S. Total [=] 476,693”
CALCULATIONS:
[686] Webpage: “Coal Explained: How Much Coal is Left.” U.S. Energy Information Administration. Last updated October 19, 2021. <www.eia.gov>
“Based on U.S. coal production in 2020, of about 0.535 billion short tons, the recoverable coal reserves would last about 470 years, and recoverable reserves at producing mines would last about 25 years. The actual number of years that those reserves will last depends on changes in production and reserves estimates.”
[687] Calculated with data from:
a) Report: “Annual Energy Review 2011.” U.S. Energy Information Administration, Office of Energy Statistics, September 2012. <www.eia.gov>
Page 103: “Table 4.8: Coal Demonstrated Reserve Base, January 1, 2011 ... Notes: ... These coal resources are not totally recoverable. Net recoverability with current mining technologies ranges from 0 percent (in far northern Alaska) to more than 90 percent. Fifty-four percent of the demonstrated reserve base of coal in the United States is estimated to be recoverable.”
b) Report: “Annual Coal Report 2022.” U.S. Energy Information Administration, October 2023. <www.eia.gov>
Pages x–xi: “Table ES1. Coal Production, 1949–2022”
Page 23: “Table 15. Recoverable Coal Reserves at Producing Mines, Estimated Recoverable Reserves, and Demonstrated Reserve Base by Mining Method, 2022”
NOTE: An Excel file containing the data and calculations is available upon request.
[688] Report: “Annual Energy Review 2011.” U.S. Energy Information Administration, Office of Energy Statistics, September 2012. <www.eia.gov>
Pages 353–354:
Demonstrated Reserve Base (Coal): A collective term for the sum of coal in both measured and indicated resource categories of reliability, representing 100 percent of the in-place coal in those categories as of a certain date. Includes beds of bituminous coal and anthracite 28 or more inches thick and beds of subbituminous coal 60 or more inches thick that can occur at depths of as much as 1,000 feet. Includes beds of lignite 60 or more inches thick that can be surface mined. Includes also thinner and/or deeper beds that currently are being mined or for which there is evidence that they could be mined commercially at a given time. Represents that portion of the identified coal resource from which reserves are calculated.
[689] Webpage: “Glossary.” U.S. Energy Information Administration. Accessed July 18, 2013 at <www.eia.gov>
“Estimated Recoverable Reserves (coal): An estimate of coal reserves, based on a demonstrated reserve base, adjusted for assumed accessibility and recovery factors, and does not include any specific economic feasibility criteria.”
[690] Calculated with data from:
a) Dataset: “Coal and Coke: Coal Reserves.” U.S. Energy Information Administration. Accessed February 5, 2024 at <www.eia.gov>
“Coal reserves (million st [short tons]) … World … 2021 [=] 1,161,182”
b) Dataset: “Coal and Coke: Production.” U.S. Energy Information Administration. Accessed February 5, 2024 at <www.eia.gov>
“World … Production … Coal (Mst [thousand short tons]) … 2021 [=] 9,435,569”
CALCULATION: 1,161,182,000,000 short tons of coal reserves / 9,435,569,000 short tons of coal production per year = 123 years
[691] Webpage: “Coal and Coke: Notes & Sources, Table Notes.” U.S. Energy Information Administration. Accessed February 5, 2024 at <www.eia.gov>
Coal Reserves
Data are as of December 31 of the previous full year. Data for the United States are from the U.S. Energy Information Administration.
U.S. coal rank estimates are based partly on British thermal units and may not match precisely borderline geologic ranks. Further, data in this table may represent different base years. Data for the United States represent recoverable coal estimates as of January 1 of the most recent full year. Data for other countries are as of the most recent period for which data are available. The U.S. Energy Information Administration does not certify the international reserves data but reproduces the information as a matter of convenience for the reader.
Data for other countries are from The Federal Institute for Geoscience and Natural Resources (BGR), a technical and scientific agency of the Federal Ministry for Economic Affairs and Energy (BMWi). BGR estimates the geological inventory of coal reserves by providing reliable assessments of reserves and resources.
[692] Booklet: “Energy, Powering Your World.” By M.T. Westra and S. Kuyvenhoven. Foundation for Fundamental Research on Matter, Institute for Plasma Physics, Rijnhuizen (the Netherlands), 2002. <fire.pppl.gov>
Page 27:
In an electrical generator electricity is made by turning a magnet in a magnetic field. The changing magnetic field drives the electrical current. With the exception of solar cells and fuel cells (which are discussed in chapters 4 and 6), all ways of generating electricity in some way drive a generator of this type. For example, fossil fuels are used to heat water into steam, which can be used to power a steam turbine. The steam turbine then drives the electrical generator. … [T]he heat released by nuclear reactions can be used in the same way.
Page 29:
So far we have been dealing with fossil fuels and chemical combustion. In that case atoms rearrange themselves into new molecules in which they are more tightly bound, and energy is released. Such a rearrangement is also possible among the elementary particles—the protons and neutrons—that constitute the nucleus of atoms. In this case, the energy which is set free in each individual process is millions of times larger, and the total amount of material passing through a power plant based on this principle is correspondingly thousands of times smaller. …
Nuclear fission … is maintained by a chain reaction. Every nucleus which splits produces also a number of neutrons—for the typically used reaction of Uranium-235, on the average about 2.4—which each can again trigger the fission of another nucleus.
[693] Report: “Annual Energy Review 2011.” U.S. Energy Information Administration, Office of Energy Statistics, September 2012. <www.eia.gov>
“Nuclear Electric Power Plant: A single-unit or multi-unit facility in which heat produced in one or more reactors by the fissioning of nuclear fuel is used to drive one or more steam turbines.”
[694] Report: “Annual Energy Review 2011.” U.S. Energy Information Administration, Office of Energy Statistics, September 2012. <www.eia.gov>
Page 369:
Uranium: A heavy, naturally radioactive, metallic element (atomic number 92). Its two principally occurring isotopes are uranium-235 and uranium-238. Uranium-235 is indispensable to the nuclear industry because it is the only isotope existing in nature, to any appreciable extent, that is fissionable by thermal neutrons. Uranium-238 is also important because it absorbs neutrons to produce a radioactive isotope that subsequently decays to the isotope plutonium-239, which also is fissionable by thermal neutrons. …
Uranium Ore: Rock containing uranium mineralization in concentrations that can be mined economically, typically one to four pounds of U3O8 (uranium oxide) per ton or 0.05 percent to 0.2 percent U3O8
[695] Webpage: “Periodic Table of Elements: Uranium.” Los Alamos National Laboratory. Updated by Dr. David Hobart on July 23, 2013. <periodic.lanl.gov>
Uranium is the heaviest naturally-occurring element available in large quantities. The heavier “transuranic” elements are either man-made or they exist only as trace quantities in uranium ore deposits as activation products. Uranium occurs naturally in low concentrations of a few parts per million in soil, rock and water, and is commercially extracted from uranium-bearing minerals. Uranium, not as rare as once thought, is now considered to be more plentiful than mercury, antimony, silver, or cadmium, and is about as abundant as molybdenum or arsenic. It occurs in numerous natural minerals such as pitchblende, uraninite, carnotite, autunite, uranophane, and tobernite. It is also found in phosphate rocks, lignite, monazite sands, and is recovered commercially from these sources. The United States Department of Energy purchases uranium in the form of acceptable U3O8 concentrates. This incentive program has greatly increased the known uranium reserves.
[696] Webpage: “Case Files: Enrico Fermi.” Franklin Institute. Accessed April 18, 2018 at <www.fi.edu>
On December 2, 1942, Fermi managed the historic operation, directing the gradual removal of the control rods and monitoring the consequent increases in radioactivity. … [A]t 3:20 in the afternoon the last control rod had been carefully withdrawn in one-foot increments when Fermi gave the final instruction to remove it completely. All monitoring instruments showed rising radioactivity—the controlled nuclear fission chain reaction had been achieved!
[697] Booklet: “Energy, Powering Your World.” By M.T. Westra and S. Kuyvenhoven. Foundation for Fundamental Research on Matter, Institute for Plasma Physics, Rijnhuizen (the Netherlands), 2002. <fire.pppl.gov>
Page 7: “[I]n 1954, the first nuclear-powered electricity power plant opened in the USSR [Union of Soviet Socialist Republics].”
[698] Article: “Uranium.” Encyclopædia Britannica Ultimate Reference Suite 2004.
“One pound of uranium yields as much energy as three million pounds of coal.”
[699] Calculated with data from the report: “July 2022 Monthly Energy Review.” U.S. Energy Information Administration, Office of Energy Statistics, July 26, 2022. <www.eia.gov>
Page 7: “Table 1.3. Primary Energy Consumption by Source (Quadrillion Btu)”
NOTE: An Excel file containing the data and calculations is available upon request.
[700] Calculated with data from the report: “July 2022 Monthly Energy Review.” U.S. Energy Information Administration, Office of Energy Statistics, July 26, 2022. <www.eia.gov>
Page 131: “Table 7.2a. Electricity Net Generation: Total (All Sectors)”
NOTE: An Excel file containing the data and calculations is available upon request.
[701] “Kansas Energy Report 2009.” Kansas Energy Council, January 7, 2009. <www.justfacts.com>
Page 26:
Electricity peak loads in Kansas are the greatest during the summer months, primarily due to the electricity needs of air-conditioning systems. …
In order to cost-effectively meet the varying demand of their customers at different times of the year and even different times of the day, most utilities maintain a diverse portfolio of electric power plants (e.g., generating units) that use a variety of fuels. These generating units can be distinguished according to the type of power they produce (firm vs. intermittent) as well as the type of load they are designed to meet (base, peak, or intermediate).
[702] Webpage: “Demand for Electricity Changes Through the Day.” U.S. Energy Information Administration, April 6, 2011. <www.eia.gov>
“Electric power systems must match generation and load in real time, with tight tolerances. As a result, both system stress and prices can vary considerably throughout the day. … Load curve shapes vary among regions and change with the season of the year.”
[703] Report: “Methods for Analyzing Electric Load Shape and Its Variability.” By P. Price. Ernest Orlando Lawrence Berkeley National Laboratory, Environmental Energy Technologies Division, May 2010. <eta-publications.lbl.gov>
Page 1:
“Whole-building electric load” is the total electrical power used by a building at a given moment. The load changes with time in response to changes in lighting levels; heating, ventilating, and air conditioning (HVAC) requirements; and uses such as computers, copy machines, and so on. The curve that represents load as a function of time, called the “load shape,” can often yield useful information. Unexpectedly high night-time loads may indicate waste (such as lights that needlessly remain on when the building is unoccupied); a change in load shape may indicate an equipment or thermostat malfunction; unexpectedly high sensitivity to outdoor temperature may indicate that excessive outdoor air is being brought into the building by the HVAC system; and so on.
[704] “Kansas Energy Report 2009.” Kansas Energy Council, January 7, 2009. <www.justfacts.com>
Page 26:
Electricity consumption (also called “load”) is divided into three categories: base, peak, and intermediate load. Base load refers to demand that occurs continuously, day and night, seven days a week. Peak load, on the other hand, refers to maximum demand that occurs within a given period of time. Intermediate load is a more generic term applied to demand that occurs between base and peak load.
[705] Webpage: “Glossary.” U.S. Energy Information Administration. Accessed July 18, 2013 at <www.eia.gov>
Peak load: the maximum load during a specified period of time.
Base load: the minimum amount of electric power delivered or required over a given period of time at a steady rate.
Base load capacity: the generating equipment normally operated to serve loads on an around-the-clock basis.
Base load plant: A plant, usually housing high-efficiency steam-electric units, which is normally operated to take all or part of the minimum load of a system, and which consequently produces electricity at an essentially constant rate and runs continuously. These units are operated to maximize system mechanical and thermal efficiency and minimize system operating costs.
[706] Report: “Methods for Analyzing Electric Load Shape and Its Variability.” By P. Price. Ernest Orlando Lawrence Berkeley National Laboratory, Environmental Energy Technologies Division, May 2010. <eta-publications.lbl.gov>
Page 22: “Figure 15: Sketch indicating five parameters that we recommend as a minimum set to characterize load shape. The value of each parameter can be calculated for each day; these values can then be summarized (e.g. average peak load, standard deviation of peak load).”
[707] Report: “Nuclear Power’s Role in Generating Electricity.” Congressional Budget Office, May 2008. <www.cbo.gov>
Page 2: “Historically, most base-load capacity has been provided using coal or nuclear technologies because, once the plants have been built, low fuel costs make them relatively cheap to operate continuously.”
Page 4: “Pulverized coal power plants, which burn solid coal ignited by injected air, are by far the most common option for generating base-load electricity.”
[708] “Kansas Energy Report 2009.” Kansas Energy Council, January 7, 2009. <www.justfacts.com>
Page 27:
Power plants that are used to meet the minimum or “base load” of the system are referred to as base-load generating units; they are run continuously and operated, in general, so as to produce electricity at a constant rate. Base-load units are operated to maximize system mechanical and thermal efficiency and minimize system operating costs. Costs are minimized by operating units with the lowest fuel costs for the most hours in the year (i.e., at a high capacity factor). Generally, base-load units include nuclear, coal-fired, geothermal, hydropower, and waste-to-energy plants.63
[709] Book: Fundamentals of Natural Gas. By Vivek Chandra. Pennwell, 2006. <vdoc.pub>
Coal remains the dominant fuel for the world’s thermal electric power plants. … Coal has been the main thermal electric fuel due to its cheap price, worldwide availability, easy transport, and low-technology threshold. Coal’s biggest drawback is the pollution emitted from its combustion. …
Typically, base load power stations are large nuclear, hydroelectric, or coal-burning plants that are expensive to build, with high fixed costs. However, they are cheap to maintain and operate. They operate continuously and are difficult to switch on or off.
[710] Report: “Nuclear Waste Management: Key Attributes, Challenges and Costs for the Yucca Mountain Repository and Two Potential Alternatives.” U.S. Government Accountability Office, November 2009. <www.gao.gov>
Page 5:
Nuclear waste is long-lived and very hazardous—without protective shielding, the intense radioactivity of the waste can kill a person within minutes or cause cancer months or even decades after exposure.3 Thus, careful management is required to isolate it from humans and the environment. …
3 For the purposes of our report, nuclear waste includes both spent nuclear fuel—fuel that has been withdrawn from a nuclear reactor following irradiation—and high-level radioactive waste—generally the material resulting from the reprocessing of spent nuclear fuel. Nuclear waste—specifically spent nuclear fuel—is also very thermally hot. As the radioactive elements in spent nuclear fuel decay, they give off heat. However, according to DOE [U.S. Department of Energy] data, a spent nuclear fuel assembly can lose nearly 80 percent of its heat 5 years after it has been removed from a reactor and about 95 percent of its heat after 100 years.
Pages 11–12:
Reprocessing nuclear waste could potentially reduce, but not eliminate, the amount of waste for disposal. In reprocessing, usable uranium and plutonium are recovered from spent nuclear fuel and are used to make new fuel rods. However, current reprocessing technologies separate weapons usable plutonium and other fissionable materials from the spent nuclear fuel, raising concerns about nuclear proliferation by terrorists or enemy states. Although the United States pioneered the reprocessing technologies used by other countries, such as France and Russia, presidents Gerald Ford and Jimmy Carter ended government support for commercial reprocessing in the United States in 1976 and 1977, respectively, primarily due to proliferation concerns. Although President Ronald Reagan lifted the ban on government support in 1981, the nation has not embarked on any reprocessing program due to proliferation and cost concerns—the Congressional Budget Office recently reported that current reprocessing technologies are more expensive than direct disposal of the waste in a geologic repository.9 DOE’s Fuel Cycle Research and Development program is currently performing research in reprocessing technologies that would not separate out weapons usable plutonium, but it is not certain whether these technologies will become cost-effective.10
Page 14: “[D]isposal is the only alternative for some DOE and commercial nuclear waste—even if the United States decided to reprocess the waste—because it contains nuclear waste residues that cannot be used as nuclear reactor fuel. This nuclear waste has no safe, long-term alternative other than disposal….”
[711] Booklet: “Energy, Powering Your World.” By M.T. Westra and S. Kuyvenhoven. Foundation for Fundamental Research on Matter, Institute for Plasma Physics, Rijnhuizen (the Netherlands), 2002. <fire.pppl.gov>
Pages 29–30:
[T]he products of the fission reaction emit radiation and produce heat. Also the neutrons produced in the reaction can cause other atoms of the structure or the fuel to become radioactive. These materials have to be handled therefore with great care, and kept in a location where they cannot come into contact with human beings or the food chain for a very long period (some parts for 10,000s of years). … the fact that the fission products continue to emit heat also means that one has to provide cooling, even after the fission reaction has stopped and the power plant has shut down.
[712] Webpage: “Spent Fuel Storage in Pools and Dry Casks, Key Points and Questions & Answers.” U.S. Nuclear Regulatory Commission. Last reviewed/updated April 13, 2015. <www.nrc.gov>
Spent fuel continues to generate heat because of radioactive decay of the elements inside the fuel. After the fission reaction is stopped and the reactor is shut down, the products left over from the fuel’s time in the reactor are still radioactive and emit heat as they decay into more stable elements. Although the heat production drops rapidly at first, heat is still generated many years after shutdown. …
What about security? How do you know terrorists won’t use all of this waste against us?
For spent fuel, as with reactors, the NRC [Nuclear Regulatory Commission] sets security requirements and licensees are responsible for providing the protection. We constantly remain aware of the capabilities of potential adversaries and threats to facilities, material, and activities, and we focus on physically protecting and controlling spent fuel to prevent sabotage, theft, and diversion. Some key features of these protection programs include intrusion detection, assessment of alarms, response to intrusions, and offsite assistance when necessary. Over the last 20 years, there have been no radiation releases that have affected the public. There have also been no known or suspected attempts to sabotage spent fuel casks or storage facilities. The NRC responded to the terrorist attacks on September 11, 2001, by promptly requiring security enhancements for spent fuel storage, both in spent fuel pools and dry casks.
[713] Webpage: “Backgrounder on Dirty Bombs.” U.S. Nuclear Regulatory Commission. Last reviewed/updated February 24, 2020. <www.nrc.gov>
A “dirty bomb” is a type of “radiological dispersal device” [RDD] that combines a conventional explosive, such as dynamite, with radioactive material. The terms dirty bomb and RDD are often used interchangeably. Most RDDs would not release enough radiation to kill people or cause severe illness—the conventional explosive itself would be more harmful to people than the radioactive material. However, an RDD explosion could create fear and panic, contaminate property and require potentially costly cleanup.
A dirty bomb is not a nuclear bomb. A nuclear bomb creates an explosion that is millions of times more powerful than a dirty bomb. The cloud of radiation from a nuclear bomb could spread thousands of square miles, whereas a dirty bomb’s radiation could be dispersed within a few blocks or miles of the explosion. A dirty bomb is not a “weapon of mass destruction” but a “weapon of mass disruption,” where contamination and anxiety are the major objectives.
[714] Webpage: “Processing of Used Nuclear Fuel.” World Nuclear Association. Updated November 2015. <www.world-nuclear.org>
A key, nearly unique, characteristic of nuclear energy is that used fuel may be reprocessed to recover fissile and fertile materials in order to provide fresh fuel for existing and future nuclear power plants. Several European countries, Russia and Japan have had a policy to reprocess used nuclear fuel, although government policies in many other countries have not yet come round to seeing used fuel as a resource rather than a waste.
Over the last 50 years the principal reason for reprocessing used fuel has been to recover unused plutonium, along with less immediately useful unused uranium, in the used fuel elements and thereby close the fuel cycle, gaining some 25% to 30% more energy from the original uranium in the process. This contributes to national energy security. A secondary reason is to reduce the volume of material to be disposed of as high-level waste to about one-fifth. In addition, the level of radioactivity in the waste from reprocessing is much smaller and after about 100 years falls much more rapidly than in used fuel itself.
These are all considerations based on current power reactors, but moving to fourth-generation fast neutron reactors in the late 2020s changes the outlook dramatically, and means that not only used fuel from today’s reactors but also the large stockpiles of depleted uranium (from enrichment plants, about 1.5 million tonnes in 2015) become a fuel source. Uranium mining will become much less significant.
Another major change relates to wastes. In the last decade interest has grown in recovering all long-lived actinides* together (i.e. with plutonium) so as to recycle them in fast reactors so that they end up as short-lived fission products. This policy is driven by two factors: reducing the long-term radioactivity in high-level wastes, and reducing the possibility of plutonium being diverted from civil use—thereby increasing proliferation resistance of the fuel cycle. If used fuel is not reprocessed, then in a century or two the built-in radiological protection will have diminished, allowing the plutonium to be recovered for illicit use (though it is unsuitable for weapons due to the non-fissile isotopes present).
* Actinides are elements 89 to 103, actinium to lawrencium, including thorium, protactinium and uranium as well as transuranics, notably neptunium, plutonium, americium, cerium and californium. The minor actinides in used fuel are all except uranium and plutonium.
[715] Article: “Nuclear Fuel Recycling Could Offer Plentiful Energy.” By Louise Lerner. Argonne National Laboratory, June 22, 2012. <www.anl.gov>
To get used fuel ready to put back into a reactor, however, it needs some processing. This has been done for decades in other countries using a technique called PUREX [plutonium uranium redox extraction], which has its roots in 1940s U.S. research to separate plutonium out of used fuel. The problem with PUREX is the risk that the process could be diverted to extract weapons-grade plutonium, a concern that prompted then-president Jimmy Carter to ban PUREX reprocessing in 1978.
[716] Report: “Commercial Nuclear Waste: Effects of a Termination of the Yucca Mountain Repository Program and Lessons Learned.” U.S. Government Accountability Office, April 2011. <www.gao.gov>
Page 37: “Members of community and academic groups, including the National Academy of Sciences, told us that some members of the public incorrectly equate spent nuclear fuel with nuclear weapons. They associate spent fuel with images of mushroom clouds from the detonation of a nuclear warhead, when in fact spent nuclear fuel cannot explode.”
[717] Webpage: “Backgrounder on Plutonium.” U.S. Nuclear Regulatory Commission. Last reviewed/updated May 01, 2017. <www.nrc.gov>
Over 1500 metric tons of plutonium have been produced world wide, some for weapons use, and most of the rest as a by-product of electricity production. It is important to note that the plutonium produced as a by-product in a nuclear power reactor is created in its many isotopic forms, including Pu-239, Pu-240, Pu-241, and Pu-242. This is known as “reactor-grade” plutonium. In contrast, “weapons-grade” plutonium contains almost pure (over 90%) Pu-239. Plutonium-239 is created in a reactor that is specially designed and operated to produce Pu-239 from uranium.
With the end of the Cold War, the United States and the former Soviet Union began dismantling thousands of nuclear weapons which has resulted in a surplus of highly enriched uranium and plutonium. To dispose of this surplus and protect against it falling into the wrong hands, the U.S. has plans to mix the plutonium with uranium to make mixed oxide (MOX) fuel for power reactors. The intent of the MOX fuel program is to irradiate the so called “weapons-grade” plutonium, converting it to “reactor-grade”, which will make the plutonium no longer suitable for use in advanced nuclear weapons. There would be no reprocessing or subsequent reuse of the MOX spent fuel. The fuel would be disposed of in a waste repository along with other high-level nuclear waste.
[718] Report: “Nuclear Power’s Role in Generating Electricity.” Congressional Budget Office, May 2008. <www.cbo.gov>
Page 10: “Nuclear plant operators are required to set aside funds to cover the cost of decommissioning—that is, safely shutting down a nuclear reactor at the end of its useful life.”
[719] Report: “Federal Financial Interventions and Subsidies in Energy Markets 1999: Primary Energy.” U.S. Energy Information Administration, September 1999. <www.justfacts.com>
Page 3:
Historically, there have been a class of future liabilities characterized by large, but uncertain, future costs for such actions as remediating leaking underground storage tanks, cleaning up oil spills, shutting down retired nuclear power plants, or paying health benefits for coal miners with black lung disease. Policymakers have feared that if private firms were assigned liability for these future costs, they might fail to make adequate current provision today, and then evade the costs in the future through bankruptcy. Alternatively, there might be health or environmental liabilities for which no current responsible party could be identified.
The public policy response to this situation has taken two forms:
• The Government assigns liability to private firms, but requires them to make payments into public or private trust funds to assure that funds will be available to meet future liabilities.
• The Government assumes legal responsibility for the liability, but levies an excise tax on the products of the industry deemed responsible and accrues the monies into a public trust fund, which is dedicated to meeting future liabilities.
Page 40:
These “off-budget” trust funds are fundamentally different from the “on-budget” trust funds described above: the liability for decommissioning expenses continues to lie with the power plant owner, and not with the Federal Government. Thus, the Federal Government has not assumed any new liabilities but merely required the private sector to make arrangements to meet an important future private liability. Consequently, an off-budget trust fund cannot be considered a subsidy, either positive or negative, in a narrow definition of the term. Rather, the fund is Federal intervention that imposes costs on a particular industry. Off-budget approaches represent a method of dealing with the problems of internalizing social costs.
[720] Report: “Federal Energy Subsidies: Direct and Indirect Interventions in Energy Markets.” U.S. Energy Information Administration, November 1992. <www.justfacts.com>
Page 39:
The most prominent example of such an “off-budget” trust fund is the Nuclear Regulatory Commission (NRC) rulemaking on the decommissioning of nuclear power plants.63 Each nuclear power plant operator is required to create and place in a trust fund no less than $105 million for each pressurized water reactor in service and $135 million for each boiling water reactor (both in 1986 dollars).64 Each nuclear operator is required to undertake a site-specific decommissioning study at least 5 years prior to a planned decommissioning, and to provide any additional funds needed to cover the anticipated decommissioning cost prior to the date of actual decommissioning.
Nuclear operators recover their trust fund contributions through an increase in electricity rates, which is functionally similar to an excise tax. State and local regulators may impose additional funding requirements on nuclear operators and regulate the conditions under which decommissioning costs can be recovered through higher rates.
[721] Audit report: “Department of Energy’s Nuclear Waste Fund’s Fiscal Year 2012 Financial Statements.” U.S. Department of Energy, Office of Inspector General, Office of Audits & Inspections, November 28, 2012. <energy.gov>
Page 12:
The Nuclear Waste Policy Act of 1982 (NWPA) was signed into law on January 7, 1983. The NWPA establishes a framework for the financing, siting, licensing, operating and decommissioning of one or more mined geologic repositories for the Nation’s spent nuclear fuel (SNF) and high-level radioactive waste (HLW) which is to be carried out by the Department of Energy (Department or DOE).
[722] Report: “Nuclear Waste Management: Key Attributes, Challenges and Costs for the Yucca Mountain Repository and Two Potential Alternatives.” U.S. Government Accountability Office, November 2009. <www.gao.gov>
Pages 2–3:
Under the Nuclear Waste Policy Act of 1982 (NWPA), as amended, DOE [U.S. Department of Energy] was to evaluate one or more national geologic repositories that would be designated to permanently store commercial spent nuclear fuel and DOE-managed spent nuclear fuel and high-level waste. …
… The repository is intended to isolate nuclear waste from humans and the environment for thousands of years, long enough for its radioactivity to decay to near natural background levels. NWPA set January 31, 1998, as the date for DOE to start accepting nuclear waste for disposal.
Pages 5–6:
[T]he National Academy of Sciences first endorsed the concept of nuclear waste disposal in deep geologic formations in a 1957 report to the U.S. Atomic Energy Commission, which has since been articulated by experts as the safest and most secure method of permanent disposal.4 However, progress toward developing a geologic repository was slow until NWPA was enacted in 1983. Citing the potential risks of the accumulating amounts of nuclear waste, NWPA required the federal government to take responsibility for the disposition of nuclear waste and required DOE to develop a permanent geologic repository to protect public health and safety and the environment for current and future generations. Specifically, the act required DOE to study several locations around the country for possible repository sites and develop a contractual relationship with industry for disposal of the nuclear waste. The Congress amended NWPA in 1987 to restrict scientific study and characterization of a possible repository to only Yucca Mountain.
Page 7:
To pay the nuclear power industry’s share of the cost for the Yucca Mountain repository, NWPA established the Nuclear Waste Fund, which is funded by a fee of one mill (one-tenth of a cent) per kilowatt-hour of nuclear-generated electricity that the federal government collects from electric power companies. DOE reported that, at the end of fiscal year 2008, the Nuclear Waste Fund contained $22 billion, with an additional $1.9 billion projected to be added in 2009. DOE receives money from the Nuclear Waste Fund through congressional appropriations. Additional funding for the repository comes from an appropriation which provides for the disposal cost of DOE-managed spent nuclear fuel and high-level waste.
Page 12:
The general consensus of the international scientific community is that geologic disposal is the preferred long-term nuclear waste management alternative. Finland, Sweden, Canada, France, and Switzerland have decided to construct geologic disposal facilities, but none have yet completed any such facility, although DOE reports that Finland and Sweden have announced plans to begin emplacement operations in 2020 and 2023, respectively. Moreover, some countries employ a mix of complementary storage alternatives in their national waste management strategies, including on-site storage, consolidated interim storage, reprocessing, and geologic disposal. For example, Sweden plans to rely on on-site storage until the waste cools enough to move it to a centralized storage facility, where the waste will continue to cool and decay for an additional 30 years. This waste will then be placed in a geologic repository for disposal. France reprocesses the spent nuclear fuel, recycling usable portions as new fuel and storing the remainder for eventual disposal.
[723] Report: “Federal Energy Subsidies: Direct and Indirect Interventions in Energy Markets.” U.S. Energy Information Administration, November 1992. <www.justfacts.com>
Page 33: “[A]pproximately $600 million of user fees are collected [per year] from nuclear power producers to fund the development of nuclear waste disposal facilities.”
Page 35: “Concerns about the safety, health, and environmental effects of the disposal of nuclear wastes and controversies associated with the siting of nuclear waste disposal facilities led to the assumption of leadership by the Federal Government in developing appropriate facilities.”
[724] Report: “Challenges of Electric Power Industry Restructuring for Fuel Suppliers.” U.S. Energy Information Administration, September 1998. <www.eia.gov>
Page 35:
Under the Nuclear Waste Policy Act of 1982, as amended, the U.S. Department of Energy (DOE) is to provide for the ultimate disposal of spent fuel waste. To fund the DOE’s contractual obligations, each nuclear utility pays an ongoing fee, in addition to a one-time payment to cover disposal of fuel utilized prior to April 7, 1983. The annual fee is currently 1 mill per kilowatthour of net electricity generated and sold; it is included in the fuel expenses reported to the Federal Energy Regulatory Commission. Also, owners of nuclear power plants are required by the U.S. Nuclear Regulatory Commission to place funds into an external trust to provide for the cost of decommissioning the radioactive portions of plant and equipment. Thus, the costs incurred to ensure that nuclear waste does not contaminate the environment are included, or “internalized,” in the cost of nuclear power.
[725] Report: “Nuclear Power’s Role in Generating Electricity.” Congressional Budget Office, May 2008. <www.cbo.gov>
Page 19: “The cost of disposing of the used (spent) fuel generated by nuclear fission is currently unique to that fuel source. … CBO’s [Congressional Budget Office’s] levelized cost estimate for nuclear power includes a $1 per megawatt hour charge to cover the cost of such disposal.”
[726] Report: “Nuclear Waste Management: Key Attributes, Challenges and Costs for the Yucca Mountain Repository and Two Potential Alternatives.” U.S. Government Accountability Office, November 2009. <www.gao.gov>
Page 2: “NWPA [Nuclear Waste Policy Act of 1982] was amended in 1987 to direct DOE [U.S. Department of Energy] to evaluate only the Yucca Mountain site.”
[727] Report: “Yucca Mountain: Information on Alternative Uses of the Site and Related Challenges.” U.S. Government Accountability Office, September 2011. <www.gao.gov>
Page 1:
The Yucca Mountain site comprises 230 square miles of federal land, including Yucca Mountain.1 The site is located in a remote area of the Mojave Desert in southern Nevada. …
1 For the purposes of this report, we have defined the Yucca Mountain site to include the location expected to house the potential nuclear waste repository as well as the surrounding lands that were withdrawn or on which rights were reserved for site investigation. Our definition of the Yucca Mountain site includes lands that DOE [U.S. Department of Energy] did not include in its license application for a nuclear waste repository at Yucca Mountain.
[728] “Report of the Workshop on Extreme Ground Motions at Yucca Mountain.” By T.C. Hanks and others. U.S. Department of the Interior, U.S. Geological Survey, August 23–25, 2004. <pubs.usgs.gov>
[729] Report: “Nuclear Waste Management: Key Attributes, Challenges and Costs for the Yucca Mountain Repository and Two Potential Alternatives.” U.S. Government Accountability Office, November 2009. <www.gao.gov>
Pages 7–8:
NWPA [Nuclear Waste Policy Act of 1982] caps nuclear waste that can be disposed of at the Yucca Mountain repository at 70,000 metric tons until a second repository is available. However, the nation has already accumulated about 70,000 metric tons of nuclear waste at current reactor sites and DOE [U.S. Department of Energy] facilities. Without a change in the law to raise the cap or to allow the construction of a second repository, DOE can dispose of only the current nuclear waste inventory. The nation will have to develop a strategy for an additional 83,000 metric tons of waste expected to be generated if NRC [Nuclear Regulatory Commission] issues 20-year license extensions to all of the currently operating nuclear reactors.5 This amount does not include any nuclear waste generated by new reactors or future defense activities, or greater than class C nuclear waste.6 According to DOE and industry studies, three to four times the 70,000 metric tons—and possibly more—could potentially be disposed safely in Yucca Mountain, which could address current and some future waste inventories, potentially delaying the need for a second repository for several generations.
[730] Report: “Commercial Nuclear Waste: Effects of a Termination of the Yucca Mountain Repository Program and Lessons Learned.” U.S. Government Accountability Office, April 2011. <www.gao.gov>
Page 6: “The nation’s inventory of over 65,000 metric tons of commercial spent nuclear fuel—enough to fill a football field nearly 15 feet deep—consists mostly of spent nuclear fuel removed from commercial power reactors.”
Page 7: “[S]pent nuclear fuel … [consists] of thumbnail size pellets filling 12- to 14-foot rods bound together in assemblies.”
[731] Webpage: “What is the Yucca Mountain Repository?” U.S. Environmental Protection Agency. Last updated October 19, 2021. <www.epa.gov>
“The Yucca Mountain repository is the proposed spent nuclear fuel (SNF) and high-level radioactive waste (HLW) repository where both types of radioactive waste could be disposed. … It is statutorily limited to containing 70,000 metric tons of spent nuclear fuel and high-level waste, unless a second repository opens during its operational lifetime.”
[732] Calculated with data from the webpage: “CURIE [Centralized Used Fuel Resource for Information Exchange] Map.” Oak Ridge National Laboratory, U.S. Department of Energy. Accessed August 30, 2022 at <curie.ornl.gov>
“Total Mass (MTU [Metric Tonne Unit]) in Storage in 2021, Shutdown [=] 8,081.6, Operating [=] 80,166.6”
CALCULATIONS:
[733] Report: “Yucca Mountain: Information on Alternative Uses of the Site and Related Challenges.” U.S. Government Accountability Office, September 2011. <www.gao.gov>
Page 9:
The primary feature on the Yucca Mountain site consists of two large tunnels that DOE [U.S. Department of Energy] bored into and underneath Yucca Mountain (see fig. 3).11 The main tunnel is U-shaped with two entrances—the north portal and the south portal—and is about 5 miles long and 25 feet in diameter. Another 2-mile tunnel branches off of the main tunnel. Each of these tunnels includes minor spurs and alcoves used to house equipment and conduct experiments. A DOE report indicates that the rock surrounding the tunnel has high structural integrity enabling the tunnel to be self-supported by the existing rock structure, whereas most tunnels require additional support. There are railroad tracks inside the tunnel designed to move equipment and personnel along the length of the tunnel, but these tracks may need repair before they can be used again. DOE officials told us the tunnels are subject to some radon gas emissions and silica dust, which requires use of a ventilation system.
11 The construction of the main Yucca Mountain tunnel was estimated at about $400 million between fiscal years 1994 and 1997, in then-year dollars.
[734] Article: “Yucca Mountain: No Light at Tunnel’s End?” By David Applegate. Geotimes, July 1997. <www.geotimes.org>
Why should a facility for scientific studies require such a large tunnel? The answer, known all along, is that if the tests conducted in this exploratory facility prove Yucca Mountain a suitable site, then this same tunnel would be the main tunnel for the actual repository—the tunnel through which up to 70,000 metric tons of commercial spent-fuel rods and high-level defense wastes would travel for entombment.
[735] Report: “Yucca Mountain: The Most Studied Real Estate on the Planet.” U.S. Senate Committee on Environment and Public Works, Majority Staff, March 2006. <www.epw.senate.gov>
Page 6: “In 1998, DOE [U.S. Department of Energy] completed a second 2-mile cross drift tunnel to facilitate additional experiments in the potential repository host rock.”
[736] Report: “Nuclear Waste Management: Key Attributes, Challenges and Costs for the Yucca Mountain Repository and Two Potential Alternatives.” U.S. Government Accountability Office, November 2009. <www.gao.gov>
Page 2 (of PDF): “The Nuclear Waste Policy Act of 1982, as amended, requires the Department of Energy (DOE) to dispose of the waste in a geologic repository at Yucca Mountain, about 100 miles northwest of Las Vegas, Nevada.”
Page 2: “In 2002, the president recommended and the Congress approved the Yucca Mountain site as the nation’s geologic repository.”
Page 13:
The Yucca Mountain repository—mandated by NWPA [Nuclear Waste Policy Act of 1982], as amended—would provide a permanent nuclear waste management solution for the nation’s current inventory of about 70,000 metric tons of waste. According to DOE and industry studies, the repository potentially could be a disposal site for three to four times that amount of waste. … Our analysis of DOE’s cost projections found that the Yucca Mountain repository would cost from $41 billion to $67 billion (in 2009 present value) for disposing of 153,000 metric tons of nuclear waste.11 Most of these costs are up-front capital costs. However, once the Yucca Mountain repository is closed—in 2151 for our 153,000-metric-ton model—it is not expected to incur any significant additional costs, according to DOE.
Page 13: “The Yucca Mountain repository—mandated by NWPA, as amended … lacks the support of the [Obama] administration and the state of Nevada, and faces regulatory and other challenges.”
Page 16: “… NWPA still requires DOE to pursue geologic disposal at Yucca Mountain.”
[737] Report: “Yucca Mountain: The Most Studied Real Estate on the Planet.” U.S. Senate Committee on Environment and Public Works, Majority Staff, March 2006. <www.epw.senate.gov>
Pages 8–9:
Between May and August of 2001, DOE [U.S. Department of Energy] issued two science reports17, each containing thousands of pages of information, summarizing the 15 year site characterization effort and solicited public comment on those reports over a period that extended to December. During this period DOE held 66 public hearings and sent 6,000 letters to individuals, corporations, and groups requesting comments.18 By February of 2002 DOE had considered and responded to all 17,000 comments received and, on February 14, the Secretary of Energy recommended the Yucca Mountain site to the President.19
As evidence of the scientific basis for going forward with the Yucca Mountain site, the Secretary’s recommendation contained a comprehensive 850 page Science and Engineering Report20 providing extensive detail on the work conducted at Yucca Mountain and an even more voluminous Environmental Impact Statement21 showing that the recommended repository would have little to no adverse effect on future populations or the environment. The Secretary in the following statement summarized this work:
After over 20 years of research and billions of dollars of carefully planned and reviewed scientific field work, the Department has found that a repository at Yucca Mountain brings together the location, natural barriers, and design elements most likely to protect the health and safety of the public, including those Americans living in the immediate vicinity, now and long into the future.22
The President approved the Secretary’s recommendation. In April of 2002, the Governor of the State of Nevada, as provided for by the NWPA [Nuclear Waste Policy Act of 1982], vetoed this decision. In the NWPA’s unprecedented procedure for assuring that any site decision received thorough and fair consideration, the Governor’s veto could only be overridden by a majority vote in both houses of Congress. For three months Yucca Mountain was hotly debated in Congress, in committee hearings and on the floor of the House and Senate. In the end, Congress agreed with the President and voted to override the Nevada Governor’s veto by an overwhelming bipartisan majority—306–117 in the House and 60–39 in the Senate. In July 2002, the President signed this approval into law as the Yucca Mountain Development Act (YMDA).
By the time the YMDA was enacted, DOE had spent $7.1 billion on the evaluation of multiple sites, detailed study of Yucca Mountain, the preparation and defense of the site recommendation, and related waste acceptance and transportation planning activities. In the three years since, DOE has spent another $1.5 billion preparing a Yucca Mountain license application and continuing to work on its plans for the transportation to and acceptance of nuclear waste at Yucca Mountain. The Department will spend additional billions of dollars defending its application in the exhaustive NRC [Nuclear Regulatory Commission] licensing process and completing its transportation and waste acceptance plans before construction of the repository can begin.
[738] Memorandum: “State Laws Limiting the Construction of New Nuclear Power Plants.” By David L. Lovell. Wisconsin Legislative Council, November 29, 2006. <legis.wisconsin.gov>
Page 2:
Minnesota is the only state that completely prohibits new nuclear power plants. Its statute states simply, “the commission may not issue a certificate of need for a new nuclear-powered electric generating plant.” In addition, Minnesota requires that a certificate for the addition of on-site spent fuel storage for a facility seeking a license extension must “address the impacts of continued operations over the period for which approval is sought.”
Page 3:
Eleven states, including Wisconsin, require that the regulatory commission make findings regarding the potential for disposal of spent nuclear fuel. The wording of the required findings vary considerably, and in significant ways. Several states require only that the federal government has identified and approved “a demonstrated (or demonstrable) technology or means for the disposal of high-level radioactive nuclear waste” (California, Connecticut, Illinois, and Kentucky).
A number of states require findings that a disposal facility exists and is accepting waste (Massachusetts, Maine, Oregon, West Virginia, and Wisconsin). Oregon requires a finding that “an adequate repository for the disposal of [spent fuel] has been licensed”; it specifies that the facility be for the “terminal disposition [of the waste] with or without provision for retrieval for reprocessing.” Maine requires further that such facilities are “in full conformity with the technology” approved by the federal government. West Virginia requires that the facility have been in operation for 24 months. Wisconsin is the only state of those discussed in this Memo to allow consideration of facilities outside of the United States.
Two states do not refer to federal approval or operation of a facility, but require findings of a more descriptive nature. Montana requires a finding that, among other things, “the radioactive materials from such nuclear facilities can be contained with no reasonable chance … of intentional or unintentional escape or diversion of such materials into the natural environment …” by any cause, including acts of God. New Jersey requires a finding that “the proposed method for disposal of radioactive waste material to be produced or generated by the facility will be safe, conforms to standards established by the Nuclear Regulatory Commission and will effectively remove danger to life and the environment from such waste material.”
[739] Article: “Californians Consider a Future Without a Nuclear Plant for a Neighbor.” By Ian Lovett. New York Times, July 25, 2013. <www.nytimes.com>
“But today, attitudes toward nuclear energy in California are different. State law bans the permitting of new nuclear facilities until the federal government built a permanent disposal site for nuclear waste, which effectively amounts to a moratorium on new plants.”
[740] Report: “Nuclear Waste Management: Key Attributes, Challenges and Costs for the Yucca Mountain Repository and Two Potential Alternatives.” U.S. Government Accountability Office, November 2009. <www.gao.gov>
Page 14:
The construction of a geologic repository at Yucca Mountain would provide a permanent solution for nuclear waste that could allow the government to begin taking possession of the nuclear waste in the near term—about 10 to 30 years. The nuclear power industry sees this as an important consideration in obtaining the public support necessary to build new nuclear power reactors. The industry is interested in constructing new nuclear power reactors because, among other reasons, of the growing demand for electricity and pressure from federal and state governments to reduce reliance on fossil fuels and curtail carbon emissions. Some electric power companies see nuclear energy as an important option for noncarbon emitting power generation. According to NRC [Nuclear Regulatory Commission], 18 electric power companies have filed license applications to construct 29 new nuclear reactors.13 Nuclear industry representatives, however, have expressed concerns that investors and the public will not support the construction of new nuclear power reactors without a final safe and secure disposition pathway for the nuclear waste, particularly if that waste is generated and stored near major waterways or urban centers. Moreover, having a permanent disposal option may allow reactor operators to thin-out spent nuclear fuel assemblies from densely packed spent fuel pools, potentially reducing the risk of harm to humans or the environment in the event of an accident, natural disaster, or terrorist event.
[741] Report: “Nuclear Waste Management: Key Attributes, Challenges and Costs for the Yucca Mountain Repository and Two Potential Alternatives.” U.S. Government Accountability Office, November 2009. <www.gao.gov>
Page 3: “In June 2008, DOE [U.S. Department of Energy] submitted a license application to the Nuclear Regulatory Commission (NRC) for approval to construct the repository. In July 2008, DOE reported that its best achievable date for opening the repository, if it receives NRC approval, is in 2020.”
Pages 6–7:
After the Congress approved Yucca Mountain as a suitable site for the development of a permanent nuclear waste repository in 2002, DOE began preparing a license application for submittal to NRC, which has regulatory authority over commercial nuclear waste management facilities. DOE submitted its license application to NRC in June 2008, and NRC accepted the license application for review in September 2008. NWPA [Nuclear Waste Policy Act of 1982] requires NRC to complete its review of DOE’s license application for the Yucca Mountain repository in 3 years, although a fourth year is allowed if NRC deems it necessary and complies with certain reporting requirements.
[742] Report: “Nuclear Waste Management: Key Attributes, Challenges and Costs for the Yucca Mountain Repository and Two Potential Alternatives.” U.S. Government Accountability Office, November 2009. <www.gao.gov>
Page 3:
In March 2009, the Secretary of Energy testified that the [Obama] administration planned to terminate the Yucca Mountain repository. Since then, the administration has announced plans to study alternatives to geologic disposal at Yucca Mountain before making a decision on a future nuclear waste management strategy, which the administration said could include reprocessing or other complementary strategies.
Page 13: “The Yucca Mountain repository—mandated by NWPA [Nuclear Waste Policy Act of 1982], as amended … lacks the support of the [Obama] administration and the state of Nevada, and faces regulatory and other challenges.”
[743] Report: “Commercial Nuclear Waste: Effects of a Termination of the Yucca Mountain Repository Program and Lessons Learned.” U.S. Government Accountability Office, April 2011. <www.gao.gov>
Pages 11–13:
DOE’s [the Department of Energy’s] decision to terminate the Yucca Mountain repository program was made for policy reasons, not technical or safety reasons.14 In a June 2010 letter to us, the Acting Principal Deputy Director of OCRWM [the Department of Energy’s Office of Civilian Radioactive Waste Management], responding on behalf of the Secretary, stated that the Secretary’s decision was based on a proposed change of department policy for managing spent nuclear fuel. He did not, however, cite any technical concerns or safety issues related to the Yucca Mountain repository. The Acting Principal Deputy Director explained that the Secretary believes there are better solutions that can achieve a broader national consensus to the nation’s spent fuel and nuclear waste storage needs than Yucca Mountain, although he did not cite any. He went on to say that the Secretary has repeatedly stated his conclusions that Yucca Mountain has not proven to be a workable option for a permanent repository for high-level waste and spent nuclear fuel and that the technical and scientific context is significantly different today than it was at the time of the 1983 enactment of the NWPA [Nuclear Waste Policy Act].
DOE also filed a reply before NRC’s [the Nuclear Regulatory Commission’s] Atomic Safety and Licensing Board, which provided additional information about the reasoning for attempting to withdraw its license application. Specifically, the reply explained that “the Secretary’s judgment is not that Yucca Mountain is unsafe or that there are flaws in the license application, but rather that it is not a workable option and that alternatives will better serve the public interest.”
DOE established a Blue Ribbon Commission to conduct a comprehensive review of policies for managing the back end of the nuclear fuel cycle, including alternatives for the storage, processing, and disposal of spent nuclear fuel, high-level waste, and materials derived from nuclear activities. The commission, however, is not to evaluate individual sites for a repository, including Yucca Mountain, a position made clear by the Secretary of Energy in public statements.15 …
NRC officials stated that no new technical or safety issues related to the Yucca Mountain repository had been reported to them since DOE submitted its license application in 2008. In its June 29, 2010, ruling on DOE’s motion to withdraw its license application, NRC’s Atomic Safety and Licensing Board stated that the NWPA provided the Secretary of Energy with an opportunity to report any reasons that the Yucca Mountain site was not suitable prior to submitting its license application, but DOE reported no such issues. According to the board, the NWPA required DOE to submit a license application and NRC to rule on its merits by approving or disapproving the issuance of a construction authorization, the first authorization required in the license application process.17 Many DOE and NRC officials, scientists, and industry representatives we spoke with told us that completing the license review process and obtaining NRC findings on the technical merits of the license application would provide valuable information that could be applied to future efforts, even if Yucca Mountain was not pursued as a repository.
[744] Report: “Commercial Nuclear Waste: Effects of a Termination of the Yucca Mountain Repository Program and Lessons Learned.” U.S. Government Accountability Office, April 2011. <www.gao.gov>
Pages 14–15:
DOE [U.S. Department of Energy] undertook an ambitious set of steps to dismantle the Yucca Mountain repository program. However, concerns have been raised about DOE’s expedited procedures for disposing of property from the program, and its documentation of these procedures was limited. In addition, DOE did not consistently follow federal policy and guidance for planning or assessing risks of the shutdown. Some of these steps to dismantle the program will likely hinder progress if the license application review process resumes—should NRC [Nuclear Regulatory Commission] or the courts require it.
Amid a backdrop of uncertainty concerning the status and future of the Yucca Mountain repository license review process, DOE undertook an ambitious schedule to terminate the repository program and dismantle OCRWM [the Department of Energy’s Office of Civilian Radioactive Waste Management] and the Yucca Mountain repository program by September 30, 2010, when funding would have ended under the President’s budget proposal. Starting in February 2010, DOE redirected the remaining fiscal year 2010 OCRWM budget to fund closeout activities; hired a contractor to archive project documents, such as those supporting the license application; eliminated the jobs of all federal employees working on the project; terminated project activities carried out by contractors, including national laboratory scientists; terminated leases for office space; transferred dozens of truckloads of office equipment and computers to other DOE facilities and local schools; and closed most of its 500 contracts and subcontracts.18 DOE officials told us that DOE met its September 30, 2010, deadline for closure and believed that despite the difficult task, the shutdown was orderly. However, while OCRWM’s Yucca Mountain project activities have ceased, several termination tasks are still ongoing, such as disposing of federal property and closing down contracts and subcontracts. These tasks have been divided among various DOE programs, including the National Nuclear Security Administration, the Office of Environmental Management, the Office of Legacy Management, the Office of Nuclear Energy, and the Office of General Counsel.
DOE has undertaken extensive efforts to preserve data related to its licensing efforts, as well as other scientific information relevant to the storage or disposal of high-level waste and spent nuclear fuel. The Federal Records Act requires the heads of federal agencies to preserve certain data and gives authority to the National Archives and Records Administration to determine which types of documents should be archived. DOE stated that, consistent with the Federal Records Act, it is preserving millions of documents related to the licensing effort at Yucca Mountain, as well as scientific information related to the storage and disposal of high-level waste and spent nuclear fuel. First, DOE has been maintaining a collection of 3.6 million documents pertaining to its license application in its Licensing Support Network Collection, a database of key licensing documents accessible through NRC’s Web site. NRC’s Atomic Safety and Licensing Board recently highlighted the importance of preserving those documents, and DOE officials stated that they were committed to preserving them. A DOE official in charge of managing DOE’s Licensing Support Network collection stated that DOE plans on maintaining it through the NRC’s Web site until the courts have resolved the issues surrounding DOE’s motion to withdraw its license application, then for 100 years after that. It is not clear, however, who will be responsible for preserving the Licensing Support Network or whether it will continue to be accessible by scientists and the public, particularly in light of budget pressures and changing priorities that may occur over the next century. A February 18, 2011, memo from NRC’s Licensing Support Network Administrator to members of the Atomic Safety and Licensing Board, however, stated that, under the Administration’s budget proposal for fiscal year 2012, the NRC’s Licensing Support Network faces a shutdown as of October 1, 2011. The memo went on to say that, when the Licensing Support Network Web site is shut down, the parties’ document collections will no longer be electronically accessible by others and suggested alternatives that NRC may consider, which may limit the public’s or scientists’ access to the document collections.
18 DOE stated that, as of December 2010, it had closed over 400 of the contracts and subcontracts, but that the DOE Inspector General has identified at least $175 million in prior-year costs that still need to be resolved and stated that DOE needs to ensure that the closeout process is managed effectively and that all disallowed costs are settled and funds recouped. (See: Office of the Inspector General for DOE, Special Report: Resolution of Questioned, Unresolved, and Potentially Unallowable Costs Incurred in Support of the Yucca Mountain Project (Washington, D.C.: July 2010)). In addition, DOE identified at least $9.4 million in costs for close-out activities since September 30, 2010, which includes $8.6 million in employee benefits. Although activities for key contracts were terminated, the contracts themselves are still in place, in part, to ensure that certain benefits—such as pensions—are continued.
Page 16:
In contrast to the data preservation efforts, efforts to retain Yucca Mountain project staff were minimal. Staff were encouraged to seek other employment and given no incentive to stay with OCRWM to assist with the shutdown. Some DOE and contractor officials told us that retaining key staff during the shutdown process would have been helpful. Nevertheless, the roughly 180 federal staff at OCRWM were all told in March 2010 that their positions would be eliminated by September 30, and they began leaving as soon as they found alternate employment, placing increasing stress on the remaining staff to effectively complete an orderly shutdown. In addition, 60 scientists and engineers who were contractors from Sandia National Laboratories were assigned to other projects. This raised questions among some former site officials we spoke with about whether an orderly shut down had actually been achieved.
DOE also took steps to dispose of large volumes of federal property in office buildings in Las Vegas and in storage containers and warehouses at the Yucca Mountain site. Most of the property in Las Vegas consisted of office furniture and computers, but the property at the Yucca Mountain site varied, including scientific and construction equipment, such as water monitoring equipment and tractors.
Page 22:
The loss of staff with experience at Yucca Mountain could hinder the license review if the process is resumed because DOE plays an important role in defending the license application. DOE has taken extensive efforts to preserve data from the Yucca Mountain project. However, experienced and trained staff are also necessary if DOE is to successfully carry out this role.
Pages 42–43:
… DOE has dismantled its repository effort at Yucca Mountain and has taken steps that make the shutdown difficult to reverse. DOE focused on a rapid dismantlement because the administration ended funding on September 30, 2010. Amid uncertainty over whether it had the authority to terminate the Yucca Mountain repository program, DOE terminated the program without formally assessing the risks stemming from the shutdown, including the possibility that it might have to resume the repository effort. Without a formal risk assessment, DOE cannot be assured that it is aware of any risks it is still facing from the shutdown, such as from missed opportunities to preserve institutional knowledge that may be needed in future efforts. Furthermore, as more time passes without a plan for resuming the licensing process at Yucca Mountain, DOE may find it increasingly difficult to resume the process if it reconsiders its decision or is compelled to do so. For example, DOE may find it increasingly hard to gather staff with previous experience at Yucca Mountain, since over time more will retire, relocate, or change careers. Without an adequate closeout plan that included a risk assessment, DOE has left itself vulnerable to losses in both experienced staff and physical property. When DOE eliminated experienced staff, it did not tap them for lessons learned that could be helpful for future efforts. Furthermore, DOE did not complete an inventory of OCRWM property before it closed out the Yucca Mountain site and does not know if equipment was stolen, even though some of its storage sites were breached. Nor did DOE demonstrate that it fully documented the return of any proceeds from sales of OCRWM to the Nuclear Waste Fund. Until these issues are resolved, DOE remains vulnerable to losses and may not be able to ensure it has appropriately managed federal property and funds.
The potential termination of Yucca Mountain also has consequences beyond DOE. On the one hand, it could offer a chance for the nation to reconsider its approach to nuclear waste management, assess emerging technologies, and possibly develop new technologies. On the other hand, termination would once again defer the permanent disposal of some of the nation’s most hazardous materials. In doing so, it would essentially restart the search for a permanent solution. DOE has begun this process by charging the Blue Ribbon Commission with evaluating nuclear waste management and disposal alternatives. The commission has not been charged with siting a new repository, the process around which so much opposition has been focused. It is not clear what the nature of the Commission’s recommendations will be and whether they will endorse a particular final disposal pathway. What is clear, however, is that developing and implementing any alternative to Yucca Mountain will likely involve considerable time and cost.
[745] Report: “Commercial Nuclear Waste: Effects of a Termination of the Yucca Mountain Repository Program and Lessons Learned.” U.S. Government Accountability Office, April 2011. <www.gao.gov>
Page 10:
Since 1983, DOE [U.S. Department of Energy] has spent nearly $15 billion10 to evaluate potential nuclear waste repository sites, evaluate the Yucca Mountain site in more depth, and develop and submit the license application for it. About 65 percent of this expenditure, or about $9.5 billion, came from the Nuclear Waste Fund, established under NWPA [Nuclear Waste Policy Act] to pay industry’s share of the cost for the Yucca Mountain repository and funded by a fee of one-tenth of a cent per kilowatt-hour of nuclear-generated electricity. The federal government collects this fee from electric power companies, and the fund balance is currently estimated at about $25 billion.11 The approximately $5 billion in additional costs for repository development activities came from other congressional appropriations.
[746] Statement: “The Federal Government’s Responsibilities and Liabilities Under the Nuclear Waste Policy Act.” Congressional Budget Office, July 27, 2010. <www.cbo.gov>
Pages 2–3:
Table 1 summarizes the government’s receipts and disbursements related to the nuclear waste disposal program from 1983 through the end of fiscal year 2009. During that time, $31.0 billion was credited to the Nuclear Waste Fund. That amount includes fees paid by the nuclear industry totaling $17.1 billion as well as $13.8 billion from intragovernmental transfers of interest credited to the fund. Cumulative expenditures from the fund during that period totaled about $7.3 billion, mostly for analyses related to the waste disposal program and for initial design work by DOE [U.S. Department of Energy] on the Yucca Mountain facility. The NRC [Nuclear Regulatory Commission] and other federal entities also received modest appropriations from the fund for work related to the program, leaving an unspent balance of $23.6 billion at the end of fiscal year 2009. CBO [Congressional Budget Office] estimates that in 2010, another $2.0 billion will be credited to the fund—nearly $800 million from fees and the rest from interest. Expenditures in 2010 will total $0.2 billion, bringing the fund’s end-of-year balance to $25.4 billion, CBO estimates.
[747] Report: “Commercial Nuclear Waste: Effects of a Termination of the Yucca Mountain Repository Program and Lessons Learned.” U.S. Government Accountability Office, April 2011. <www.gao.gov>
Page 10:
Since 1983, DOE [U.S. Department of Energy] has spent nearly $15 billion10 to evaluate potential nuclear waste repository sites, evaluate the Yucca Mountain site in more depth, and develop and submit the license application for it. About 65 percent of this expenditure, or about $9.5 billion, came from the Nuclear Waste Fund, established under NWPA [Nuclear Waste Policy Act] to pay industry’s share of the cost for the Yucca Mountain repository and funded by a fee of one-tenth of a cent per kilowatt-hour of nuclear-generated electricity. The federal government collects this fee from electric power companies, and the fund balance is currently estimated at about $25 billion.11 The approximately $5 billion in additional costs for repository development activities came from other congressional appropriations.
[748] Calculated with data from the webpage: “CURIE [Centralized Used Fuel Resource for Information Exchange] Map.” Oak Ridge National Laboratory, U.S. Department of Energy. Accessed August 30, 2022 at <curie.ornl.gov>
“Total Mass (MTU [Metric Tonne Unit]) in Storage in 2021, Shutdown [=] 8,081.6, Operating [=] 80,166.6”
CALCULATION: 8,081.6 + 80,166.6 = 88,248.2
[749] Report: “Nuclear Energy: Overview of Congressional Issues.” Congressional Research Service, November 16, 2018. Updated 10/20/2021. <crsreports.congress.gov>
Page 4: “[T]he vast majority of U.S. commercial spent fuel remains at the nuclear plants where it was generated—estimated at 86,000 metric tons at the end of 2020 and increasing at the rate of about 2,200 metric tons per year.14”
[750] Report: “Commercial Nuclear Waste: Effects of a Termination of the Yucca Mountain Repository Program and Lessons Learned.” U.S. Government Accountability Office, April 2011. <www.gao.gov>
Page 6: “The nation’s inventory of over 65,000 metric tons of commercial spent nuclear fuel—enough to fill a football field nearly 15 feet deep—consists mostly of spent nuclear fuel removed from commercial power reactors.”
Page 7: “[S]pent nuclear fuel … [consists] of thumbnail size pellets filling 12- to 14-foot rods bound together in assemblies.”
[751] Report: “Nuclear Waste Management: Key Attributes, Challenges and Costs for the Yucca Mountain Repository and Two Potential Alternatives.” U.S. Government Accountability Office, November 2009. <www.gao.gov>
Page 3: “Delays in the Yucca Mountain repository have resulted in a need for continued storage of the waste onsite, leaving industry uncertain regarding the licensing of new nuclear power reactors and the nation uncertain regarding a final disposition of the waste.”
Page 8:
Nuclear waste has continued to accumulate at the nation’s commercial and DOE [U.S. Department of Energy] nuclear facilities over the past 60 years. Facility managers must actively manage the nuclear waste by continually isolating, confining, and monitoring it to keep humans and the environment safe. Most spent nuclear fuel is stored at reactor sites, immersed in pools of water designed to cool and isolate it from the environment. With nowhere to dispose of the spent nuclear fuel, the racks holding spent fuel in the pools have been rearranged to allow for more dense storage of assemblies. Even with this re-racking, spent nuclear fuel pools are reaching their capacities. Some critics have expressed concern about the remote possibility of an overcrowded spent nuclear fuel pool releasing large amounts of radiation if an accident or other event caused the pool to lose water, potentially leading to a fire that could disperse radioactive material. As reactor operators have run out of space in their spent nuclear fuel pools, they have turned in increasing number to dry cask storage systems that generally consist of stainless steel canisters placed inside larger stainless steel or concrete casks. (See fig. 3.) NRC [Nuclear Regulatory Commission] requires protective shielding, routine inspections and monitoring, and security systems to isolate the nuclear waste to protect humans and the environment.
[752] Webpage: “Spent Fuel Storage in Pools and Dry Casks, Key Points and Questions & Answers.” U.S. Nuclear Regulatory Commission. Last reviewed/updated March 25, 2013. <www.nrc.gov>
All U.S. nuclear power plants store spent nuclear fuel in “spent fuel pools.” These pools are robust constructions made of reinforced concrete several feet thick, with steel liners. The water is typically about 40 feet deep, and serves both to shield the radiation and cool the rods. …
As the pools near capacity, utilities move some of the older spent fuel into “dry cask” storage. Fuel is typically cooled at least 5 years in the pool before transfer to cask. NRC [Nuclear Regulatory Commission] has authorized transfer as early as 3 years; the industry norm is about 10 years. …
As of November 2010, there were 63 “independent spent fuel storage installations” (or ISFSIs) licensed to operate at 57 sites in 33 states. … Over 1400 casks are stored in these independent facilities. …
There are currently 10 decommissioned nuclear power reactors at 9 sites with no other nuclear operations. According to a 2008 Department of Energy report to Congress, approximately 2800 metric tons of spent fuel is stored at these nine sites. As of the writing of that report, seven of the sites had independent spent fuel storage installations, or ISFSIs. Two additional sites had approximately 1000 metric tons of spent fuel remaining in pool storage.
[753] Report: “Nuclear Waste Management: Key Attributes, Challenges and Costs for the Yucca Mountain Repository and Two Potential Alternatives.” U.S. Government Accountability Office, November 2009. <www.gao.gov>
Pages 15–16:
The Yucca Mountain repository would help the government fulfill its obligation under NWPA [Nuclear Waste Policy Act] to electric power companies and ratepayers to take custody of the commercial spent nuclear fuel and provide a permanent repository using the Nuclear Waste Fund. When DOE [the Department of Energy] missed its 1998 deadline to begin taking custody of the waste, owners of spent fuel with contracts for disposal services filed lawsuits asking the courts to require DOE to fulfill its statutory and contractual obligations by taking custody of the waste. Though a court decided that it would not order DOE to begin taking custody of the waste, the courts have, in subsequent cases, ordered the government to compensate the utilities for the cost of storing the waste. DOE projected that, based on a 2020 date for beginning operations at Yucca Mountain, the government’s liabilities from the 71 lawsuits filed by electric power companies could sum to about $12.3 billion, though the outcome of pending and future litigation could substantially affect the ultimate total liability.15 DOE estimates that the federal government’s future liabilities will average up to $500 million per year. Furthermore, continued delays in DOE’s ability to take custody of the waste could result in additional liabilities. Some experts noted that without immediate plans for a permanent repository, reactor operators and ratepayers may demand that the Nuclear Waste Fund be refunded.16 …
In July 2009 letters to DOE, the Nuclear Energy Institute and the National Association of Regulatory Utility Commissioners raised concerns that, despite the announced termination of Yucca Mountain, DOE still intended on collecting fees for the Nuclear Waste Fund.19 The letters requested that DOE suspend collection of payments to the Nuclear Waste Fund. Some states have raised similar concerns and legislators have introduced legislation that could hold payments to the Nuclear Waste Fund until DOE begins operating a federal repository.20
Nevertheless, NWPA still requires DOE to pursue geologic disposal at Yucca Mountain. If the administration continues the licensing process for Yucca Mountain, DOE would face a variety of other challenges in licensing and constructing the repository. Many of these challenges—though unique to Yucca Mountain—might also apply in similar form to other future repositories, should they be considered.
[754] Calculated with data from the report: “Agency Financial Report: Fiscal Year 2021.” U.S. Department of Energy, November 15, 2021. <www.energy.gov>
Page 102:
In accordance with the NWPA [Nuclear Waste Policy Act], the Department entered into more than 69 Standard Contracts with utilities in which, in return for payment of fees into the NWF [Nuclear Waste Fund], the Department agreed to begin disposal of SNF [spent nuclear fuel] by January 31, 1998. Because the Department has no facility available to receive SNF under the NWPA, it has been unable to begin disposal of the utilities’ SNF as required by the contracts. Significant litigation claiming damages for partial breach of contract has ensued as a result of this delay.
To date, 43 suits have been settled involving utilities that collectively own 81 percent of the nuclear reactors subject to litigation for partial breach of contract. Under the terms of the settlements, the Judgment Fund, 31 U.S.C. 1304, paid $6.5 billion as of September 30, 2021 to the settling utilities for delay damages they have incurred through September 30, 2021. In addition, 67 cases have been resolved by 59 final unappealable judgments and eight voluntary withdrawals with no damages. Eight of the unappealable judgments resulted in an award of no damages by the trial court and the 51 remaining cases resulted in a total of $2.5 billion in damages that have been paid by the Judgment Fund as of September 30, 2021.
CALCULATION: $6.5 billion in settlements + $2.5 billion in damages = $9.0 billion
[755] Report: “Agency Financial Report: Fiscal Year 2021.” U.S. Department of Energy, November 15, 2021. <www.energy.gov>
Pages 102–103:
To date, 43 suits have been settled involving utilities that collectively own 81 percent of the nuclear reactors subject to litigation for partial breach of contract. Under the terms of the settlements, the Judgment Fund, 31 U.S.C. 1304, paid $6.5 billion as of September 30, 2021 to the settling utilities for delay damages they have incurred through September 30, 2021. In addition, 67 cases have been resolved by 59 final unappealable judgments and eight voluntary withdrawals with no damages. Eight of the unappealable judgments resulted in an award of no damages by the trial court and the 51 remaining cases resulted in a total of $2.5 billion in damages that have been paid by the Judgment Fund as of September 30, 2021.
An additional 17 cases remain pending the Court of Federal Claims. Liability is probable in these cases, and in many of these cases orders have already been entered establishing the Government’s liability and the only outstanding issue to be litigated is the amount of damages to be awarded. Over two decades ago, the industry was reported to estimate that damages for all utilities with which the Department has contracts ultimately would be at least $50 billion. The Department believed that the industry estimate was highly inflated. At that time the disposition of cases that had either been settled or subject to a judgment in the trial court suggested that the Government’s ultimate liability was likely to be significantly less than that estimate. The Government is not aware of any industry update of the old $50 billion estimate or how the original estimate was derived. Accordingly, the Department uses settlements as the basis for estimating the Government‘s aggregate SNF [spent nuclear fuel] litigation. The Department’s SNF litigation liability is updated to include the effects of final judgments and settlements as well as payments to date from the Judgment Fund. Additional payments under these settled and adjudicated cases may be made if the utilities incur additional costs resulting from the Department's delay in acceptance of SNF. The Department believes its assumptions and methodology provide a reasonable basis for the contingent liability estimate. Based on these settlement estimates, the total liability estimate as of September 30, 2021 was $39.9 billion. After deducting the cumulative amount paid of $9.0 billion as of September 30, 2021 under these settlements and as a result of final judgments, the remaining liability is estimated to be approximately $30.9 billion. Under current law, any damages or settlements in this litigation will be paid out of the Judgment Fund. The Department’s contingent liability estimate for SNF litigation is reported net of amounts paid to date from the Judgment Fund.
The Department previously reported several developments that made it difficult to reasonably predict the amount of the Government's spent nuclear fuel litigation liability. The previous Administration requested funds for the Yucca Mountain licensing proceeding in the FY 2018, 2019, and 2020 Budget Requests. However, no appropriations were received. In the FY 2021 Budget Request, the prior administration took a different approach and did not request any funds for the Yucca Mountain licensing proceeding but did request appropriated funds to develop and implement a consolidated interim storage program as part of a new, yet to be developed, integrated plan. The Consolidated Appropriations Act for 2021 appropriated $20 million for the Department to proceed with planning for one or more federal consolidated interim storage facilities using a consent-based approach.
The current Administration began planning activities for a consent-based approach to implementation of one or more consolidated interim storage facilities in the near term, followed by a repository some years after. In the FY 2022 Budget Request, the Administration requested additional funds to work collaboratively with the public, communities, stakeholders, and governments at the Tribal, State, and local levels and intends to pursue a consent-based approach to site an interim storage facility or facilities and permanent disposal. As the Department intends to fulfill its contractual obligations upon the acceptance of spent nuclear fuel and high-level radioactive waste for transport from the reactor facilities, a preliminary operational date of the consolidated interim storage facility or facilities is factored into the liability calculation. The liability estimate assumes Congress amending the NWPA [Nuclear Waste Policy Act] and providing adequate ongoing appropriations.
[756] Ruling: Aiken County v. State of Nevada. U.S. Court of Appeals for the District of Columbia Circuit. August 13, 2013. Decided 2–1. Majority: Kavanaugh, Randolph. Dissenting: Garland. <www.scag.gov>
Pages 2–3:
Opinion for the Court filed by Circuit Judge Kavanaugh, with whom Senior Circuit Judge Randolph joins except as to Part III.
Concurring opinion filed by Senior Circuit Judge Randolph.
Dissenting opinion filed by Chief Judge Garland.
Kavanaugh, Circuit Judge: This case raises significant questions about the scope of the Executive’s authority to disregard federal statutes. The case arises out of a longstanding dispute about nuclear waste storage at Yucca Mountain in Nevada. The underlying policy debate is not our concern. The policy is for Congress and the President to establish as they see fit in enacting statutes, and for the President and subordinate executive agencies (as well as relevant independent agencies such as the Nuclear Regulatory Commission) to implement within statutory boundaries. Our more modest task is to ensure, in justiciable cases, that agencies comply with the law as it has been set by Congress. Here, the Nuclear Regulatory Commission has continued to violate the law governing the Yucca Mountain licensing process. We therefore grant the petition for a writ of mandamus.
Page 3:
This case involves the Nuclear Waste Policy Act, which was passed by Congress and then signed by President Reagan in 1983. That law provides that the Nuclear Regulatory Commission “shall consider” the Department of Energy’s license application to store nuclear waste at Yucca Mountain and “shall issue a final decision approving or disapproving” the application within three years of its submission. 42 U.S.C. § 10134(d). The statute allows the Commission to extend the deadline by an additional year if it issues a written report explaining the reason for the delay and providing the estimated time for completion. Id. § 10134(d), (e)(2).
In June 2008, the Department of Energy submitted its license application to the Nuclear Regulatory Commission. As recently as Fiscal Year 2011, Congress appropriated funds to the Commission so that the Commission could conduct the statutorily mandated licensing process. Importantly, the Commission has at least $11.1 million in appropriated funds to continue consideration of the license application.
But the statutory deadline for the Commission to complete the licensing process and approve or disapprove the Department of Energy’s application has long since passed. Yet the Commission still has not issued the decision required by statute. Indeed, by its own admission, the Commission has no current intention of complying with the law. Rather, the Commission has simply shut down its review and consideration of the Department of Energy’s license application.
Page 4:
Since 2010, petitioners have sought a writ of mandamus requiring the Commission to comply with the law and to resume processing the Department of Energy’s pending license application for Yucca Mountain. Mandamus is an extraordinary remedy that takes account of equitable considerations. The writ may be granted “to correct transparent violations of a clear duty to act.” …
In 2011, a prior panel of this Court indicated that, if the Commission failed to act on the Department of Energy’s license application within the deadlines specified by the Nuclear Waste Policy Act, mandamus likely would be appropriate.
Page 5:
But a majority of the Court also made clear that, given the current statutory language and the funds available to the Commission, the Commission was violating federal law by declining to further process the license application. And the Court’s majority further indicated that the mandamus petition eventually would have to be granted if the Commission did not act or Congress did not enact new legislation either terminating the Commission’s licensing process or otherwise making clear that the Commission may not expend funds on the licensing process.
Page 22:
Our decision today rests on the constitutional authority of Congress, and the respect that the Executive and the Judiciary properly owe to Congress in the circumstances here. To be sure, if Congress determines in the wake of our decision that it will never fund the Commission’s licensing process to completion, we would certainly hope that Congress would step in before the current $11.1 million is expended, so as to avoid wasting that taxpayer money. And Congress, of course, is under no obligation to appropriate additional money for the Yucca Mountain project. Moreover, our decision here does not prejudge the merits of the Commission’s consideration or decision on the Department of Energy’s license application, or the Commission’s consideration or decision on any Department of Energy attempt to withdraw the license application. But unless and until Congress authoritatively says otherwise or there are no appropriated funds remaining, the Nuclear Regulatory Commission must promptly continue with the legally mandated licensing process.
[757] Report: “Backgrounder on Licensing Yucca Mountain.” U.S. Nuclear Regulatory Commission, June 2018. <www.nrc.gov>
Page 1:
The Nuclear Regulatory Commission [NRC] received an application from the Department of Energy (DOE) on June 3, 2008, for a license to construct the nation’s first geologic repository for high-level nuclear waste at Yucca Mountain, Nevada. The NRC’s role is to assess whether the proposed facility meets NRC’s regulatory requirements. The NRC staff’s technical review, documented in its Safety Evaluation Report, is one part of this licensing process. The process also includes hearings before the NRC’s Atomic Safety and Licensing Board, which will adjudicate challenges by a number of parties to the technical and legal aspects of the DOE application, and the Commission’s review of contested and uncontested issues.
On March 3, 2010, DOE filed a motion with the Board asking to withdraw its application. The Board denied that request on June 29, 2010.
On appeal, the Commission found itself evenly divided on whether to overturn or uphold the Board’s decision. During this time period, Congress had reduced funding for the NRC’s review of the application, with no funds appropriated for fiscal year 2012 (and none in subsequent years). Recognizing the budgetary limitations, the Commission directed the Board to complete case management activities by the end of September 2011, and the Board suspended the adjudicatory proceeding on September 30. At the same time, the NRC staff also completed orderly closure of its Yucca Mountain technical review activities. As part of this work, the NRC staff prepared three technical evaluation reports on DOE’s application.
The D.C. Circuit Court of Appeals in August 2013 ordered the NRC to resume its review using existing funds from previous appropriations.
[758] “Safety Evaluation Report Related to Disposal of High-Level Radioactive Wastes in a Geologic Repository at Yucca Mountain, Nevada: Repository Safety after Permanent Closure (Volume 3).” U.S. Nuclear Regulatory Commission, Office of Nuclear Material Safety and Safeguards, October 2014. <pbadupws.nrc.gov>
Page xxi:
In particular, this SER [Safety Evaluation Report] Volume 3 documents the results of the NRC staff’s evaluation to determine whether the proposed repository design for Yucca Mountain complies with the performance objectives and requirements that apply after the repository is permanently closed. These performance objectives and requirements can be found in NRC’s [Nuclear Regulatory Commission’s] regulations at 10 CFR [Code of Federal Regulations] Part 63, Subparts E and L. The NRC staff’s safety evaluation considers the proposed geologic repository’s multiple barriers, both natural and engineered (manmade); and the performance assessments (including model abstractions) used for the individual protection, the separate groundwater protection, and the human intrusion evaluations.
Pages xxii–xxiii:
To answer the question, “What can happen?” after the repository is closed, DOE [Department of Energy] considered a wide range of specific features (e.g., geologic rock types, waste package materials), events (e.g., earthquakes, volcanic activity), and processes (e.g., corrosion of metal waste packages, sorption of radionuclides on rock surfaces) for possible inclusion in (or exclusion from) its Total System Performance Assessment (TSPA) model. Once specific features, events, and processes (FEPs) were selected for inclusion in the TSPA model, DOE then used these FEPs to postulate a range of credible, future scenarios. A scenario is a well-defined sequence of events and processes, which can be interpreted as an outline of one possible future condition of the repository system. Therefore, scenario analysis identifies the possible ways in which the repository environment could evolve so that a representation of the system can be developed to estimate the range of credible potential consequences. After the FEPs are selected and used to postulate scenarios, similar scenarios are grouped into scenario classes, which are screened for use in the TSPA model. The goal of the scenario analysis is to ensure that no important aspect of the potential high-level waste repository is overlooked in the evaluation of its safety.
Page xxiv:
2.0 Sections of the Postclosure Review
2.1 Multiple Barriers …
A system of multiple barriers is intended to ensure that the repository system is robust and is not wholly dependent on a single barrier. The repository performance objectives in 10 CFR 63.113 require that a geologic repository contain both natural barriers and an engineered barrier system.
The NRC staff has reviewed the SAR [Safety Analysis Report] and other information submitted in support of the license application and finds, with reasonable expectation, that an engineered barrier system has been designed that, working in combination with natural barriers, satisfies the requirements of 10 CFR 63.113(a) and 10 CFR 63.115(a–c).
Page xxiv:
2.2 Scenarios in DOE’s Total System Performance Assessment …
This SER section provides the NRC staff’s evaluation of the scenario analysis used to support DOE’s TSPA model. A scenario analysis is generally composed of four parts (Nuclear Energy Agency, 2001aa). First, a scenario analysis identifies FEPs relevant to the geologic repository system. Second, in a process known as screening, the scenario analysis evaluates and identifies FEPs for exclusion from or inclusion into the performance assessment calculations. Third, included FEPs are considered to form scenarios and scenario classes (i.e., related scenarios) from a reduced set of events. Fourth, the scenario classes are screened for implementation into the TSPA model. Limits on performance assessments are defined in 10 CFR 63.342 including the conditions for exclusion of FEPs on the basis of probability or consequence.
The NRC staff has reviewed the SAR and other information submitted in support of the license application, which includes information required by 10 CFR 63.21(c)(1) and (9), and finds, with reasonable expectation, that relevant requirements of 10 CFR 63.114 and 10 CFR 63.342 are satisfied.
SER Section 2.2.1.2.2 Identification of Events with Probabilities Greater Than 10−8 Per Year
This SER section provides the NRC staff’s evaluation of information on event probability used to support DOE’s TSPA model calculations. The performance assessment used to demonstrate compliance with the individual protection standard for the proposed Yucca Mountain repository must consider events that have at least 1 chance in 100 million per year of occurring. To address this requirement, DOE identified and described those events that exceeded this probability threshold (10−8 per year).
The NRC staff reviewed the SAR and other information submitted in support of the license application, which includes information required by 10 CFR 63.21(c)(1) and (9), and finds, with reasonable expectation, that the relevant requirements of 10 CFR 63.114 and 10 CFR 63.342 are satisfied.
Pages xxv–xxx:
2.3 Model Abstractions in DOE’s Total System Performance Assessment …
SER Section 2.2.1.3.1 Degradation of Engineered Barriers
This SER section provides the NRC staff’s evaluation of the chemical degradation of the drip shields and waste packages that would be emplaced in the repository drifts. Chemical degradation is primarily associated with the effect of corrosion processes on the metal surfaces of the drip shields and the waste package outer barriers. The NRC staff’s evaluation of the corrosion processes focuses on the following: long-term passive film stability (i.e., passivity), general corrosion, localized corrosion, stress corrosion cracking, early failure, and abstraction and integration of evaluated processes. The drip shields and the waste packages are engineered barriers, a subset of the EBS [engineered barrier system]. The general functions of the EBS are to (i) prevent or significantly reduce the amount of water that contacts the waste, (ii) prevent or significantly reduce the rate at which radionuclides are released from the waste, and (iii) prevent or significantly reduce the rate at which radionuclides are released from the EBS to the Lower Natural Barrier. The complete EBS consists of the emplacement drifts, the drip shields, the waste packages, the naval spent nuclear fuel structure, the waste forms and waste package internal components, and emplacement pallets and inverts.
The NRC staff has reviewed the SAR and other information submitted in support of the license application, which includes information required by 10 CFR 63.21(c)(3),(9),(10) and (15), and finds, with reasonable expectation, that the relevant requirements of 10 CFR 63.114 and 63.342 are satisfied regarding the abstraction of degradation of engineered barriers in the TSPA model.
SER Section 2.2.1.3.2 Mechanical Disruption of Engineered Barriers
This SER section provides the NRC staff’s evaluation of the mechanical disruption of the engineered barrier system (EBS) which includes, emplacement drifts, drip shields, waste packages, waste forms, waste form internals, waste package pallets, and emplacement drift inverts. Mechanical disruption of EBS components could generally result from external loads generated by accumulating rock rubble. Rubble accumulation can result from processes such as (i) degrading emplacement drifts due to thermal loads, (ii) time-dependent natural weakening of rocks, and (iii) effects of seismic events (vibratory ground motion or fault displacements). During seismic events, rubble loads on EBS components can increase as the accumulated rock rubble is shaken.
The NRC staff has reviewed SAR Section 2.3.4 and other information submitted in support of the license application, which includes information required by 10 CFR 63.21(c) (1)–(3), (9), (10), (15), and (19) related to mechanical and structural performance of EBS components, and finds, with reasonable expectation, that the relevant requirements of 10 CFR 63.114 and 63.342 are satisfied regarding the abstraction of mechanical disruption of engineered barriers in the performance assessment.
SER Section 2.2.1.3.3 Quantity and Chemistry of Water Contacting Engineered Barriers and Waste Forms
This SER section provides the NRC staff’s evaluation of DOE’s abstraction of the repository drift system that may alter the chemical composition and volume of water contacting the drip shield and waste package surfaces. It focuses on key features, events and processes that address (i) the chemistry of water entering the drifts, (ii) the chemistry of water in the drifts (tunnels), and (iii) the quantity of water in contact with the EBS. These three abstraction topics provide input to model the features and performance of the EBS (e.g., drip shields and waste packages) and their contributions to barrier functions. The range of testing environments was derived from a range of potential starting water compositions and from knowledge of near-field and in-drift processes that alter these compositions.
The NRC staff has reviewed the SAR and other information submitted in support of the license application, which includes information required by 10 CFR 63.21(c)(1), (9), (10) and (15), and finds, with reasonable expectation, that the relevant requirements of 10 CFR 63.114 and 63.342 are satisfied regarding the abstraction of the quantity and chemistry of water contacting engineered barriers and waste forms.
SER Section 2.2.1.3.4 Radionuclide Release Rates and Solubility Limits
This SER section provides the NRC staff’s evaluation of analytical models and the processes that could result in water transport of radionuclides out of the EBS, including the waste packages and the emplacement inverts, and into the unsaturated zone (the rock mass directly below the repository horizon and above the water table). The NRC staff’s evaluation focuses on the following: in-package chemical and physical environment, waste form degradation, concentration limits, availability and effectiveness of colloids, and engineered barrier system radionuclide transport. The EBS and the transport pathway within the drift (repository tunnel) are the initial barriers to radionuclide release. If a waste package is breached and water enters the waste package, the radionuclides contained in the package may be released from the EBS.
The NRC staff has reviewed the SAR and other information submitted in support of the license application, which includes information required by 10 CFR 63.21(c)(3),(9),(15), and finds, with reasonable expectation, that the relevant requirements of 10 CFR 63.114 and 63.342 are satisfied regarding the abstraction of radionuclide release rates and solubility limits.
SER Section 2.2.1.3.5 Climate and Infiltration
This SER section provides the NRC staff’s evaluation of the representation of climate and infiltration. This evaluation considers the reduction of water flux from precipitation to net infiltration. Because of the generally vertical movement of percolating water through the unsaturated zone in DOE’s representation of the natural system, water entering the unsaturated zone at the ground surface (infiltration) is the only source for deep percolation water in the unsaturated zone at and below the proposed repository.
The NRC staff has reviewed the SAR and other information submitted in support of the license application, which includes information required by 10 CFR 63.21(c)(1), (9),(10),(15), and finds, with reasonable expectation, that the relevant requirements of 10 CFR 63.114, 63.305, and 63.342 are satisfied regarding the abstraction of climate and infiltration.
SER Section 2.2.1.3.6 Unsaturated Zone Flow
This SER section provides the NRC staff’s evaluation of the abstraction of groundwater flow in the portion of the repository system above the water table (i.e., the unsaturated zone). Water percolating through the unsaturated zone above the repository (i.e., Upper Natural Barrier) may enter drifts, providing the means to interact with and potentially corrode the waste packages. Water percolating through the unsaturated zone below the repository (i.e., Lower Natural Barrier) also provides a flow pathway for transporting radionuclides downward to the water table. Once radionuclides pass below the water table, they may subsequently move laterally within the saturated zone to the accessible environment.
The NRC staff has reviewed the SAR and other information submitted in support of the license application, which includes information required by 10 CFR 63.21(c)(1), (9), (10), (15), and (19), and finds, with reasonable expectation, that the relevant requirements of 10 CFR 63.114 and 10 CFR 63.342 are satisfied regarding the abstraction of unsaturated zone flow, thermal conditions in the host rock, and in-drift thermohydrological conditions excluding conditions for the engineered components.
SER Section 2.2.1.3.7 Radionuclide Transport in the Unsaturated Zone
This SER section provides the NRC staff’s evaluation of the model abstraction for transport of radionuclides in the unsaturated zone. The NRC staff’s evaluation focuses on (i) advection, because most of the radionuclide mass is carried through the unsaturated zone by water flowing downwards to the water table; (ii) sorption, because sorption in porous media in the southern half of the repository area has the largest overall effect on slowing radionuclide transport in the unsaturated zone; (iii) matrix diffusion in fractured rock, because matrix diffusion coupled with sorption slows radionuclide transport in the northern half of the repository area; (iv) colloid-associated transport, because radionuclides attached to colloids may travel relatively unimpeded through the unsaturated zone; and (v) radioactive decay and ingrowth, because these processes affect the quantities of radionuclides released from the unsaturated zone over time.
The NRC staff has reviewed the SAR and other information submitted in support of the license application, which includes information required by 10 CFR 63.21(c)(1), (9), (10), and (15), and finds, with reasonable expectation, that the relevant requirements of 10 CFR 63.114 and 63.342 are satisfied regarding the abstraction of radionuclide transport in the unsaturated zone.
SER Section 2.2.1.3.8 Flow Paths in the Saturated Zone
This SER section provides the NRC staff’s evaluation of the representation of flow paths in the saturated zone (i.e., the direction and magnitude of water movement in the saturated zone). Flow paths in the saturated zone provide the pathway for releases of radionuclides to migrate from the saturated zone below the repository to the accessible environment [approximately 18 km (11 mi) south of the repository]. The magnitude (specific discharge) of water flow is used to determine the velocity of water moving through the saturated zone.
The NRC staff has reviewed the SAR and other information submitted in support of the license application, which includes information required by 10 CFR 63.21(c)(1), (9), (10), (15), and (19), and finds, with reasonable expectation, that the relevant requirements of 10 CFR 63.114 and 10 CFR 63.342 are satisfied regarding the abstraction of flow paths in the saturated zone.
SER Section 2.2.1.3.9 Radionuclide Transport in the Saturated Zone
This SER section provides the NRC staff’s evaluation of the model abstraction for transport of radionuclides in the saturated zone. The NRC staff’s technical review focuses on (i) how DOE represented the geological, hydrological, and geochemical features of the saturated zone in a framework for modeling the transport processes; (ii) how DOE integrated the saturated zone transport abstraction with other TSPA model abstractions for performance assessment calculations; and (iii) how DOE included and supported the important transport processes of advection and dispersion, sorption, matrix diffusion, colloid-associated transport, and radioactive decay and ingrowth in the saturated zone radionuclide transport abstraction.
The NRC staff reviewed the SAR and other information submitted in support of the license application, which includes information required by 10 CFR 63.21(c)(1), (9), and (15), and finds, with reasonable expectation, that the relevant requirements of 10 CFR 63.114 and 63.342 are satisfied regarding the abstraction of radionuclide transport in the saturated zone.
SER Section 2.2.1.3.10 Igneous Disruption of Waste Packages
This SER section provides the NRC staff’s evaluation of models for the potential consequences of disruptive igneous activity at Yucca Mountain if basaltic magma rising through the Earth’s crust intersects and enters a repository drift or drifts (DOE’s igneous intrusion modeling case) or enters a drift and later erupts to the surface through one or more conduits (DOE’s volcanic eruption modeling case). The proposed Yucca Mountain repository site lies in a region that has experienced sporadic volcanic events in the past few million years, such that the applicant previously determined the probability of future igneous activity at the site to exceed 1 × 10⁻⁸ per year. The NRC staff’s technical review evaluates subsurface igneous processes (i.e., intrusion of magma into repository drifts, waste package damage, and formation of conduits to the surface), which involves entrainment of waste into the conduit and toward the surface. These processes control the amount of radionuclides that can be released during a potential igneous event.
The NRC staff reviewed the SAR and other information submitted in support of the license application, which includes information required by 10 CFR 63.21(c)(1), (9), and (15), and finds, with reasonable expectation that the relevant requirements of 10 CFR 63.114 and 63.342 are satisfied regarding the abstraction of igneous disruption of waste packages.
SER Section 2.2.1.3.12 Concentration of Radionuclides in Groundwater
This SER section provides the NRC staff’s evaluation of the concentration of radionuclides in groundwater extracted by pumping and used in the annual water demand. Radionuclides transported through the saturated zone via groundwater to the accessible environment may be available for extraction by a pumping well. The reasonably maximally exposed individual (RMEI) is assumed to use well water with average concentrations of radionuclides and has an annual water demand of 3,000 acre-ft [3.7 × 10⁹ L].
The NRC staff has reviewed the SAR and other information submitted in support of the license application relevant to the concentration of radionuclides in groundwater, and finds, with reasonable expectation, that the requirements of 10 CFR 63.312(c) are satisfied. The applicant adequately demonstrated that the RMEI uses well water with average concentrations of radionuclides by dividing the annual mass fluxes of radionuclides reaching the accessible environment boundary by the annual water use of 3,000 acre-ft [3.7 × 10⁹ L].
SER Section 2.2.1.3.13 Airborne Transport and Redistribution of Radionuclides
This SER section provides the NRC staff’s evaluation of the volcanic ash exposure scenario and the groundwater exposure scenario. First, this SER section provides the NRC staff’s evaluation of the airborne transport and deposition of radionuclides expelled by a potential future volcanic eruption and the subsequent redistribution of those radionuclides in soil. Second, this SER section evaluates redistribution of radionuclides in soil that arrive in the accessible environment through groundwater transport.
The NRC staff has reviewed the SAR and other information submitted in support of the license application, which includes information required by 10 CFR 63.21(c)(1),(9), and (15), and finds, with reasonable expectation, that the relevant requirements of 10 CFR 63.114, 63.305, and 63.342 are satisfied regarding the abstraction of airborne transport and redistribution of radionuclides.
SER Section 2.2.1.3.14 Biosphere Characteristics
This SER section provides the NRC staff’s evaluation of the model used to calculate biosphere transport and the annual dose to the RMEI. The biosphere model calculates the transport of radionuclides within the biosphere through a variety of exposure pathways (e.g., soil, food, water, air) and applies dosimetry modeling to convert the RMEI exposures into annual dose. Exposure pathways in the biosphere model are based on assumptions about residential and agricultural uses of the water and indoor and outdoor activities. These pathways include ingestion, inhalation, and direct exposure to radionuclides deposited to soil from irrigation. Ingestion pathways include drinking contaminated water, eating crops irrigated with contaminated water, eating food products produced from livestock raised on contaminated feed and water, eating farmed fish raised in contaminated water, and inadvertently ingesting soil. Inhalation pathways include breathing resuspended soil, aerosols from evaporative coolers, and radon gas and its decay products.
The NRC staff has reviewed the SAR and other information submitted in support of the license application, which includes information required by 10 CFR 63.21(c)(1), and finds, with reasonable expectation, that the requirements in 10 CFR 63.305, 63.311(b), and relevant requirements of 10 CFR 63.114, 63.312, and 63.342 are satisfied regarding the biosphere characteristics.
Pages xxx–xxxi:
2.4 TSPA Model Calculations …
This SER section provides the NRC staff’s evaluation of the applicant’s compliance with the individual protection standards. Section 63.311 requires that the average annual dose must not exceed 0.15 mSv/yr [15 mrem/yr] during the initial 10,000 years following disposal and not exceed 1.0 mSv/yr [100 mrem/yr] after 10,000 years up to 1 million years. The performance assessment used for the individual protection calculation considers both likely and unlikely events and the radiological exposure pathways.
The NRC staff has reviewed the SAR and the other information submitted in support of the license application, which includes the information required by 10 CFR 63.21(c)(11), and finds, with reasonable expectation, that the requirements of 10 CFR 63.113(b) are satisfied.
SER Section 2.2.1.4.2 Demonstration of Compliance with the Human Intrusion Standard
This SER section provides the NRC staff’s evaluation of the applicant’s compliance with the human intrusion standard. The human intrusion standard in Section 63.321 requires the applicant to determine the earliest time after disposal that the waste packages would degrade sufficiently so that a human intrusion from exploratory groundwater drilling could occur without recognition by the drillers. Section 63.321(b) requires that the average annual dose must not exceed 0.15 mSv/yr [15 mrem/yr] during the initial 10,000 years after disposal and not exceed 1.0 mSv/year [100 mrem/yr] after 10,000 years up to 1 million years. The performance assessment used for the human intrusion calculation considers likely events and the radiological exposure pathways.
The NRC staff has reviewed the SAR and the other information submitted in support of the license application, which includes the information required by 10 CFR 63.21(c)(13), and finds, with reasonable expectation, that the requirements of 10 CFR 63.113(d) are satisfied.
ER Section 2.2.1.4.3 Demonstration of Compliance with Separate Groundwater Protection Standards
This SER section provides the NRC staff’s evaluation of the applicant’s compliance with the groundwater protection standard. The NRC’s regulations provide separate standards to protect the groundwater resources in the vicinity of Yucca Mountain and specify the approach for estimating the concentration of radionuclides in groundwater. The groundwater protection standards provide for different limits, depending on the radionuclide. There are three distinct groups of radionuclides with the following limits: (i) radionuclides that are characterized as alpha emitters (e.g., Np-237) are grouped, and the combined concentration must be less than 15 pCi/L (this group explicitly excludes radon and uranium); (ii) radionuclides that are characterized as beta- and photon-emitting radionuclides (e.g., I-129, Tc-99) are grouped together, and the combined concentration cannot result in a dose exceeding 0.04 mSv [4 mrem] per year to the whole body or any organ, on the basis of drinking 2 L [0.53 gal] of water per day at the combined concentration; and (iii) the combined concentration of Ra-226 and Ra-228 cannot exceed a concentration of 5 pCi/L. The performance assessment used for the separate groundwater protection calculation considers likely events and the drinking water exposure pathway.
The NRC staff has reviewed the SAR and other information submitted in support of the license application, which includes information required by 10 CFR 63.21(c)(12), and finds with reasonable expectation, that the requirements of 10 CFR 63.113(c) are satisfied.
SER Section 2.5.4 Expert Elicitation
SER Section 2.5.4 provides the NRC staff’s evaluation of the three expert elicitations DOE used in support of its SAR. Expert elicitations were conducted in the areas of seismic hazard (SAR Section 2.2.2.1), igneous activity (SAR Section 1.1.6.2, Section 2.2.2.2, and Section 2.3.11), and saturated zone flow and transport (SAR Section 2.3.9.2).
The NRC staff has reviewed the SAR and other information submitted in support of the license application, and finds, with reasonable expectation, that the requirement in 10 CFR 63.21(c)(19) is satisfied.
Page xxxi:
3.0 Conclusions
The NRC staff has reviewed and evaluated the DOE’s Safety Analysis Report, Chapter 2: Repository Safety After Permanent Closure and the other information submitted in support of its license application and has found that DOE submitted applicable information required by 10 CFR 63.21. The NRC staff has also found with reasonable expectation, that (i) the proposed Yucca Mountain repository design meets the applicable performance objectives in Subpart E, including the requirement that the repository be composed of multiple barriers and (ii) based on performance assessment evaluations that are in compliance with applicable regulatory requirements, meets the 10 CFR Part 63, Subpart L limits for individual protection, human intrusion, and separate standards for protection of groundwater.
[759] Report: “Backgrounder on Licensing Yucca Mountain.” U.S. Nuclear Regulatory Commission, June 2018. <www.nrc.gov>
Page 1:
The NRC [Nuclear Regulatory Commission] staff completed the five-volume Safety Evaluation Report in January 2015.
Pages 2–3:
In the Safety Evaluation Report, the NRC staff found that DOE’s [Department of Energy’s] license application met the regulatory requirements for the proposed repository, with two exceptions: DOE had not obtained certain land withdrawal and water rights necessary for construction and operation of the repository. The NRC staff therefore recommended that the Commission not authorize construction of the repository until, among other things, these regulations were met, and a supplement to DOE’s environmental impact statement was completed. After DOE declined to complete the supplement and deferred to the NRC, the Commission directed the NRC staff to develop the supplement. This supplement was completed and published in early 2016.
[760] Final report: “Supplement to the U.S. Department of Energy’s Environmental Impact Statement for a Geologic Repository for the Disposal of Spent Nuclear Fuel and High-Level Radioactive Waste at Yucca Mountain, Nye County, Nevada.” U.S. Nuclear Regulatory Commission, Office of Nuclear Material Safety and Safeguards, May 2016. <www.nrc.gov>
Page iii:
This “Supplement to the Department of Energy’s Environmental Impact Statement for a Geologic Repository for the Disposal of Spent Nuclear Fuel and High-Level Radioactive Waste at Yucca Mountain, Nye County, Nevada” (supplement) evaluates the potential environmental impacts on groundwater and impacts associated with the discharge of any contaminated groundwater to the ground surface due to potential releases from a geologic repository for spent nuclear fuel and high-level radioactive waste at Yucca Mountain, Nye County, Nevada. This supplements the U.S. Department of Energy’s (DOE’s) 2002 “Final Environmental Impact Statement for a Geologic Repository for the Disposal of Spent Nuclear Fuel and High-Level Radioactive Waste at Yucca Mountain, Nye County, Nevada” and 2008 “Final Supplemental Environmental Impact Statement for a Geologic Repository for the Disposal of Spent Nuclear Fuel and High-Level Radioactive Waste at Yucca Mountain, Nye County, Nevada,” in accordance with the findings and scope outlined in the U.S. Nuclear Regulatory Commission (NRC) staff’s 2008 “Adoption Determination Report for the U.S. Department of Energy’s Environmental Impact Statements for the Proposed Geologic Repository at Yucca Mountain.”
This supplement describes the affected environment and assesses the potential environmental impacts with respect to potential contaminant releases from the repository that could be transported through the volcanic-alluvial aquifer in Fortymile Wash and the Amargosa Desert, and to the Furnace Creek/Middle Basin area of Death Valley. This supplement evaluates the potential radiological and nonradiological impacts—over a one million year period—on the aquifer environment, soils, ecology, and public health, as well as the potential for disproportionate impacts on minority or low-income populations. In addition, this supplement assesses the potential for cumulative impacts associated with other past, present, or reasonably foreseeable future actions. The NRC staff finds that each of the potential direct, indirect, and cumulative impacts on the resources evaluated in this supplement would be SMALL.
[761] Report: “America First: A Budget Blueprint to Make America Great Again.” White House, Office of Management and Budget, March 2017. <www.whitehouse.gov>
Page 19:
The President’s 2018 Budget:
• Provides $120 million to restart licensing activities for the Yucca Mountain nuclear waste repository and initiate a robust interim storage program. These investments would accelerate progress on fulfilling the Federal Government’s obligations to address nuclear waste, enhance national security, and reduce future taxpayer burden.
[762] Article: “US Fiscal 2018 Budget Approved.” World Nuclear News, March 23, 2018. <www.world-nuclear-news.org>
Senators today approved the Consolidated Appropriations Act 2018, which appropriates some $1.3 trillion of US treasury funds and covers the period to 30 September, by 65 votes to 32. The House of Representatives yesterday approved the act by 256 votes to 167. The bill, which the White House yesterday described as “a win for the American people”, can now go to President Donald Trump for signature.
The USD1.2 billion for nuclear energy approved by Congress is significantly more than the USD703 million in the president’s fiscal 2018 budget request for the Department of Energy [DOE]. However, requests for appropriations by both the DOE and the US Nuclear Regulatory Commission (NRC) to restart licensing activities for the Yucca Mountain nuclear waste repository and establish an interim storage programme for used nuclear fuel are not included in the final version.
[763] Report: “Efficient, Effective, Accountable: An American Budget.” White House, Office of Management and Budget, February 2018. <www.whitehouse.gov>
Page 45:
The President’s 2019 Budget: …
The Budget also reflects the critical role DOE [U.S. Department of Energy] has in protecting the safety and security of the American people, including by ensuring that nuclear and radiological materials worldwide remain secured against theft by those who might use them against the U.S. homeland or U.S. interests abroad. The Budget funds the modernization of nuclear weapons and ensures that the U.S. nuclear force is second-to-none. The Budget ensures continued progress on cleaning up sites contaminated from nuclear weapons production, and energy R&D [research and development]. The Budget also continues support for a robust interim storage program and the licensing of the Yucca Mountain geologic repository, demonstrating the Administration’s commitment to nuclear waste management.
[764] Article: “USA Budgets $50 Million for Yucca Mountain.” World Nuclear News, February 13, 2018. <www.world-nuclear-news.org>
The US Nuclear Regulatory Commission's (NRC) proposed budget for fiscal 2019 includes nearly $50 million for work related to the proposed Yucca Mountain repository. President Donald Trump’s FY2019 budget request for the Department of Energy (DOE) includes $120 million for Yucca Mountain and an interim storage programme for used nuclear fuel. …
Some $2.515 billion of the DOE budget is earmarked for energy and related programmes—$1.9 billion less than was enacted for FY2018. This includes $120 million for the restart of NRC licensing activities at Yucca Mountain and the establishment of an interim storage program to develop a capability for earlier acceptance of spent nuclear fuel.
[765] Report: “Department of Energy FY 2019 Congressional Budget Request.” U.S. Department of Energy, Office of Chief Financial Officer, March 2018. <www.energy.gov>
Page 419:
Highlights of the FY 2019 Budget Request The Yucca Mountain and Interim Storage programs’ Program Direction request supports 83 federal staff and associated activities. The program requires a significant commitment of human capital to assure consistency with federal policies and strategies in the planning, engagement, responsiveness, and the adaptation of plans that address changing and dynamic conditions. The Budget Request includes additional staffing for the program office to ensure there is appropriate guidance and oversight throughout the program. Of the 83 funded staff, 53 will be re-aligned from staff currently funded by other DOE [Department of Energy] Program Direction budgets. 30 new staff members will be hired to provide additional Yucca Mountain license application support activities. Funding in Program Direction is allocated between Yucca Mountain licensing activities and development of a consolidated interim storage program as shown in the table below.
|
($ in Thousands) |
|||
|
Yucca Mountain |
Interim Storage |
Total |
|
|
Yucca Mountain |
90,400 |
90,400 |
|
|
Interim Storage |
6,600 |
6,600 |
|
|
Program Direction |
19,600 |
3,400 |
23,000 |
|
Total |
110,000 |
10,000 |
120,000 |
[766] Report: “A Budget for a Better America.” White House, Office of Management and Budget, March 2019. <www.whitehouse.gov>
The Budget addresses the challenges that face the Nation and reflects the critical role DOE [Department of Energy] has in protecting the safety and security of the American people, including by ensuring that nuclear and radiological materials worldwide remain secured against theft by those who might use them against the U.S. homeland or U.S. interests abroad. The Budget also funds the modernization of nuclear weapons and ensures that the U.S. nuclear force remains superior in the world. In addition, the Budget ensures continued progress on cleaning up sites contaminated from nuclear weapons production and nuclear energy R&D [research and development]. The Budget also demonstrates the Administration’s commitment to nuclear waste management by supporting the implementation of a robust interim storage program and restarting the Nuclear Regulatory Commission licensing proceeding for the Yucca Mountain geologic repository.
[767] Article: “US Budget Request Supports Yucca Mountain.” World Nuclear News, March 12, 2019. <www.world-nuclear-news.org>
“The US Administration's budget request for fiscal 2020, which begins on 1 October, seeks to restart the US Nuclear Regulatory Commission (NRC) licensing procedure for the Yucca Mountain geologic repository, and also provides for the regulator to prepare for licensing advanced reactors.”
[768] Report: “Department of Energy FY 2020 Congressional Budget Request.” U.S. Department of Energy, Office of Chief Financial Officer, March 2019. <www.energy.gov>
Page 409:
The Yucca Mountain and Interim Storage programs’ PD [Program Direction] Budget Request supports 83 federal staff and associated activities. The program requires a significant commitment of human capital to assure consistency with federal policies and strategies in the planning, engagement, responsiveness, and the adaptation of plans that address changing and dynamic conditions. The Budget Request includes additional staffing for the program office to ensure there is appropriate guidance and oversight throughout the program.
In FY2020, funding in PD is allocated between Yucca Mountain site licensing activities and development of a consolidated interim storage program as shown in the table below.
|
($ in Thousands) |
|||
|
Yucca Mountain |
Interim Storage |
Total |
|
|
Yucca Mountain |
86,484 |
0 |
86,484 |
|
Interim Storage |
0 |
6,516 |
6,516 |
|
Program Direction |
19,600 |
3,400 |
23,000 |
|
Total |
106,084 |
9,916 |
116,000 |
[769] Public Law 115-141: “Consolidated Appropriations Act, 2018.” 115th U.S. Congress (2017–2018). Signed into law by Donald J. Trump on March 23, 2018. <www.congress.gov>
“Latest Action: 03/28/2018 Became Public Law No: 115-141”
[770] Public Law 116-6: “Consolidated Appropriations Act, 2019.” 116th U.S. Congress (2019–2020). Signed into law by Donald J. Trump on February 15, 2019. <www.congress.gov>
“Latest Action: 02/15/2019 Became Public Law No: 116-6”
[771] Public Law 116-94: “Further Consolidated Appropriations Act, 2020.” 116th U.S. Congress (2019–2020). Signed into law by Donald J. Trump on December 20, 2019. <www.congress.gov>
[772] Report: “Energy and Water Development: FY2021 Appropriations.” Congressional Research Service. Updated March 25, 2021. <crsreports.congress.gov>
Page 11:
The Trump Administration’s FY2021 budget request did not include new funding for a proposed underground nuclear waste repository at Yucca Mountain, NV, after the Administration’s funding requests for the repository were not approved by Congress in the previous three fiscal years. Those requests had included funding for DOE [U.S. Department of Energy] to pursue an NRC [U.S. Nuclear Regulatory Commission] license for the repository and for NRC to consider DOE’s license application. Although no FY2021 funding was requested for licensing and developing Yucca Mountain, the Administration sought $27.5 million to develop nuclear waste central interim storage capacity. “Funding is primarily dedicated to performing activities that would lay the groundwork necessary to ensure near-term deployment of interim storage to ensure safe and effective consolidation and temporary storage of nuclear waste,” according to DOE’s budget justification. Funding for the program was to come from the Nuclear Waste Fund, which holds fees and interest paid by the nuclear power industry for waste management.22 The House approved the Administration’s request but specified that only $7.5 million come from the Nuclear Waste Fund.
The Senate Appropriations Committee majority draft bill also included $27.5 million (but within Nuclear Energy rather than as a separate account) for the development of consolidated interim nuclear spent fuel storage facilities. Up to $10 million of that amount could have been used to contract for spent fuel management, including storage by a private company. The Senate draft also included an authorization (Sec. 306) for DOE to conduct a pilot program for interim spent nuclear fuel storage at a site selected with the consent of the host state, local governments, and Indian tribes. Similar language had been included in previous Senate Appropriations Committee Energy and Water Development appropriations bills but not enacted.
The Consolidated Appropriations Act, 2021 provided $27.5 million for Nuclear Waste Disposal, of which $20 million was directed to be used for interim storage and $7.5 million (from the Nuclear Waste Fund) for Nuclear Waste Fund oversight activities. The Senate draft proposal for an interim storage pilot program was not enacted.
[773] Public Law 116-260: “Consolidated Appropriations Act, 2021.” 116th U.S. Congress (2019–2020). Signed into law by Donald J. Trump on December 27, 2020. <www.congress.gov>
“For Department of Energy expenses necessary for nuclear waste disposal activities to carry out the purposes of the Nuclear Waste Policy Act of 1982, Public Law 97-425, as amended, including interim storage activities, $27,500,000, to remain available until expended, of which $7,500,000 shall be derived from the Nuclear Waste Fund.”
[774] Article: “Energy Secretary: ‘Yucca Mountain Will Not Be a Storage Place for Nuclear Waste.’ ” By David Charns. CBS 8 News Now, June 10, 2021. <www.8newsnow.com>
During her visit to southern Nevada on Thursday, U.S. Secretary of Energy Jennifer Granholm said plans to use Yucca Mountain as a nuclear storage waste facility are off the table. …
During her visit Thursday, Granholm said a commission set up under the Obama administration was tasked with finding the right community to house the spent fuel.
“We’re beginning that process now,” Granholm told the I-Team’s David Charns. “The bottom line for Nevada is that Yucca Mountain will not be a storage place for nuclear waste.”
[775] Webpage: “Answers to Frequently Asked Questions.” United Nations Scientific Committee on the Effects of Atomic Radiation. Accessed September 8, 2022 at <www.unscear.org>
Radiation is a natural phenomenon. The earth itself is composed of minerals that contain the naturally occurring radioactive elements uranium and thorium. This presence creates a field of radiation, which varies from place to place depending on the local geology. Cosmic radiation from the sun and from outer space also continually penetrates the earth’s atmosphere adding to this field that represents a source of external exposure. The inert radioactive gas, radon, is created by the uranium and thorium in the soil; it percolates through the soil, and concentrates in the indoor air of buildings. Inhalation of radon gas leads to internal exposure to radiation, which varies significantly from place to place depending on the nature of the buildings and local geology. In addition, small amounts of other naturally occurring radioactive materials are present in foodstuffs and water and contribute to internal exposure. The external and internal exposure together deliver a small dose of radiation to everyone on the planet, known as background radiation. In addition to radiation dose received from natural sources of background radiation, a number of human activities enhance exposure, e.g. flying at altitude (greater levels of cosmic radiation), medical uses of radiation, the generation of nuclear energy, and other industrial uses of radiation or radioactive material.
A measure of the total radiation dose received is expressed in the unit sievert (Sv) or fractions according to the metric system: a millisievert (mSv) is one-thousandth of a sievert; a microsievert (µSv) is one-millionth of a sievert. The rate of accumulation is expressed as dose rate or dose accumulated per unit time e.g. In units of microsieverts per hour (µSv/h). A direct measurement can be made of radiation dose rates from sources external to the body in microsieverts per hour. The dose received by a person is the given by the dose rate multiplied by the time of exposure. …
The annual doses in millisieverts (mSv) due to natural sources of radiation are summarized below:
|
Source or Mode |
Annual Average Dose (Msv) |
Typical Range of Annual Dose (Msv) |
Comments |
|
Inhalation (radon gas) |
1.26 |
0.2–10 |
Dose is much higher in some homes. |
|
External terrestrial |
0.48 |
0.3–1 |
Dose is higher in some places. |
|
Ingestion |
0.29 |
0.2–1 |
|
|
Cosmic radiation |
0.39 |
0.3–1 |
Dose increases with altitude. |
|
Total natural |
2.4 |
1–13 |
Sizable population groups receive 10–20 mSv annually. |
[776] Paper: “Low-Dose Radiation Exposure and Carcinogenesis.” By Keiji Suzuki and Shunichi Yamashita. Japanese Journal of Clinical Oncology, May 28, 2012. Pages 563–568. <jjco.oxfordjournals.org>
Page 564:
The quantity used to refer to the amount of ionizing radiation is absorbed dose, which is defined as the energy absorbed per unit mass. The unit of absorbed dose is gray (Gy), and 1 Gy equals 1 joule of energy absorbed per kilogram of matter. As different types of radiation produce different biological effects, equivalent dose, which is the product of absorbed dose and radiation-weighting factor, is introduced. The unit of equivalent dose is sievert (Sv). Finally, effective dose is used to limit health risks involved in radiation exposure. Effective dose is the sum of all of the weighted equivalent doses in all the tissues and organs exposed. Since different tissues have different radiation sensitivities, tissue-weighting factors are used to calculate weighted equivalent doses. Thus, if the effective dose is used for radiation exposure, radiation health effects are the same between external and internal exposure. The unit of effective dose is also sievert (Sv).
[777] Report: “Environmental Consequences of the Chernobyl Accident and Their Remediation: Twenty Years of Experience.” Chernobyl Forum, Expert Group on Environment, April 2006. <www-pub.iaea.org>
Page 11: “For comparison, a worldwide average lifetime dose from natural background radiation is about 170 mSv, with a typical range of 70–700 mSv in various regions of the world.”
NOTE: The Chernobyl Forum is an organization staffed by the International Atomic Energy Agency, World Health Organization, U.N. Development Programme, Food and Agriculture Organization, U.N. Environment Programme, U.N. Office for the Coordination of Humanitarian Affairs, U.N. Scientific Committee on the Effects of Atomic Radiation, World Bank, and the governments of Belarus, the Russian Federation, and Ukraine.
[778] “EPA’s Report on the Environment.” U.S. Environmental Protection Agency, 2008. <ofmpub.epa.gov>
Page 2–73: “The link between some common indoor air pollutants and health effects is very well established. Radon is a known human carcinogen and is the second leading cause of lung cancer.”
Page 2–74: “Radon is a radioactive gas. It comes from the decay of uranium that is naturally occurring and commonly present in rock and soils. … Each year, radon is associated with an estimated 21,100 lung cancer deaths in the U.S., with smokers at an increased risk; radon is the second leading cause of lung cancer after smoking, and 14.4 percent of lung cancer deaths in the U.S. are believed to be radon-related (U.S. EPA, 2003).”
[779] Paper: “Very High Background Radiation Areas of Ramsar, Iran: Preliminary Biological Studies.” By M. Ghiassi-nejad and others. Health Physics, January 2002. Pages 87–93. <www.probeinternational.org>
Page 87:
People in some areas of Ramsar, a city in northern Iran, receive an annual radiation absorbed dose from background radiation that is up to 260 mSv y-1, substantially higher than the 20 mSv y-1 that is permitted for radiation workers. Inhabitants of Ramsar have lived for many generations in these high background areas. Cytogenetic studies show no significant differences between people in the high background compared to people in normal background areas. …
The high background radiation in the “hot” areas of Ramsar is primarily due to the presence of very high amounts of 226Ra and its decay products, which are brought to the Earth’s surface by hot springs. Groundwater is heated by subsurface geologic activity and passes through relatively young and uraniferous igneous rock. Radium is dissolved from the rocks by hot ground water.
Pages 90–91:
Although there is not yet solid epidemiological information, most local physicians in Ramsar report anecdotally there is no increase in the incidence rates of cancer or leukemia in their area (Mortazavi 2002). The life span of HBRA [high background radiation areas] residents also appears no different than that in residents of nearby NBRAs [normal background radiation areas], although this information is, again, anecdotal at this time. Such findings, if confirmed, are in keeping with the results of previous studies of HBRA residents and radiation workers (for example, Ikushima 1999; Chen and Wei 1991; Smith and Doll 1981).
Page 93:
Given the apparent lack of ill effects among observed populations of these high dose rate areas, these data suggest that current dose limits may be overly conservative. However, the available data do not yet seem sufficient to cause national or international advisory bodies to change their current conservative radiation protection recommendations; for this to happen more definitive data are needed (Roth and others 1996).
Radio-epidemiological studies of the residents of high background areas, such as Ramsar, will provide useful supporting data. The population in the high background areas of Ramsar is estimated to be about 2,000 persons. To obtain statistically reliable results, a long-term study will be needed to provide sufficient person-years of observation. The life span of residents of the high background areas of Ramsar should be a part of future long-term studies. In time, we plan to extend our study to include residents of Iran living in other areas that, while not as high-dose as Ramsar, are still well above the global average radiation dose. We feel that these factors will make it possible to examine a wider portion of the dose-response curve than is possible in any other location on Earth.
[780] Webpage: “Answers to Frequently Asked Questions.” United Nations Scientific Committee on the Effects of Atomic Radiation. Accessed September 8, 2022 at <www.unscear.org>
The doses received by persons from artificial sources of radiation are summarized below:
|
Source or Mode |
Typical Dose (mSv) |
|
10 hour aeroplane flight |
0.03 |
|
Chest x-ray |
0.05 |
|
CT scan |
10 |
|
Annual dose from natural background |
2.4 |
|
Annual dose to nuclear worker |
1 |
|
Annual cosmic radiation at sea level |
0.4 |
|
Annual cosmic radiation Mexico City (2,300m) |
0.8 |
|
Chernobyl recovery workers in 1986 |
150 |
[781] Report: “Environmental Consequences of the Chernobyl Accident and Their Remediation: Twenty Years of Experience.” Chernobyl Forum, Expert Group on Environment, April 2006. <www-pub.iaea.org>
Page 102: “Table 5.2. Effective Doses in 2000 From Natural and Human Sources … Worldwide average annual per cap[ita] effective dose (mSv) … Nuclear power production [=] 0.0002 … Has increased with expansion of the nuclear programme but decreased with improved practice.”
[782] Paper: “Low-Dose Radiation Exposure and Carcinogenesis.” By Keiji Suzuki and Shunichi Yamashita. Japanese Journal of Clinical Oncology, May 28, 2012. Pages 563–568. <jjco.oxfordjournals.org>
Page 564:
The quantity used to refer to the amount of ionizing radiation is absorbed dose, which is defined as the energy absorbed per unit mass. The unit of absorbed dose is gray (Gy), and 1 Gy equals 1 joule of energy absorbed per kilogram of matter. As different types of radiation produce different biological effects, equivalent dose, which is the product of absorbed dose and radiation-weighting factor, is introduced. The unit of equivalent dose is sievert (Sv). Finally, effective dose is used to limit health risks involved in radiation exposure. Effective dose is the sum of all of the weighted equivalent doses in all the tissues and organs exposed. Since different tissues have different radiation sensitivities, tissue-weighting factors are used to calculate weighted equivalent doses. Thus, if the effective dose is used for radiation exposure, radiation health effects are the same between external and internal exposure. The unit of effective dose is also sievert (Sv). …
Although it was not described more in detail, such low-dose rate exposure should be treated as totally different from high-dose rate or acute exposure. For example, acute 100 mGy [milligray] of radiation induces four DSBs [DNA double-strand breaks] per cell at once, while 100 mGy per year creates approximately one DSB in a cell out of 2400 cells/h.
[783] Webpage: “Answers to Frequently Asked Questions.” United Nations Scientific Committee on the Effects of Atomic Radiation. Accessed September 8, 2022 at <www.unscear.org>
When radiation passes through material, it causes ionization which can damage chemical structures. If the material in question is biological material (such as the cells that make up human organs and tissues) and if the damage occurs to critical chemicals within the cells (such as the DNA molecules making up the chromosomes within the cell nucleus), the cell itself can be damaged. It should be noted that the cell and the DNA are undergoing physical and chemical damage all the time (e.g. from temperature fluctuations and oxidation processes). However the cell and DNA have mechanisms to repair damage. The radiation damage will usually be repaired by these normal cell repair processes; or the cell may be sacrificed. This is of not significance if the repair is successful or if the number of cells killed is not large. However it is possible also that the DNA may be misrepaired; in the majority of cases, such mutated cells will also die. However there is a small possibility that the cell survives and the mutation in the DNA is replicated as the cell divides. This can be the start of a multi-step process that could eventually lead to formation of a cancer.
These various possible effects at the molecular, cellular and tissue level influence the overall outcome of a person exposed to radiation. The severity of any immediate effect will depend on the total amount of exposure to radiation within a given period of time-termed the radiation dose. If a person is exposed to very high levels of radiation for a significant period of time and the accumulated dose is high, a large number of cells can be killed. This represents serious injury to the exposed person (e.g. skin burns, hair loss, sterility, damage to the blood-producing systems and the immune system). Depending on the dose, the exposed person can recover from the injuries, particularly if good medical treatment is made available quickly. But at very high doses, recovery is not possible, leading to death over days or weeks.
At lower doses of radiation, below the levels associated with early onset of injury and death due to cell-killing, an exposed population may show an increased incidence of certain types of cancer, years to decades later, compared with populations that were not exposed. …
|
Indicative Dose Range (Msv) |
Effects on Human Health (Including Unborn Child) |
|
Up to 10 |
No direct evidence of human health effects |
|
10–1,000 |
No early effects; increased incidence of certain cancers in exposed populations at higher doses |
|
1,000–10,000 |
Radiation sickness (risk of death); increased incidence of certain cancers in exposed populations |
|
Above 10,000 |
Fatal always |
[784] Paper: “Low-Dose Radiation Exposure and Carcinogenesis.” By Keiji Suzuki and Shunichi Yamashita. Japanese Journal of Clinical Oncology, May 28, 2012. Pages 563–568. <jjco.oxfordjournals.org>
Page 565:
The most informative epidemiological study of the survivors of the atomic bombings at Hiroshima and Nagasaki has been conducted by the Radiation Effects Research Foundation (RERF). The Life Span Study (LSS) is based upon large numbers of persons with various whole-body doses42. … In the dose range 0–150 mSv, the excess risk of solid cancer seems to be linear; however, there is no statistically significant elevation in risk at doses below 100 mSv. …
The A-bomb survivors received higher external doses over a short period, which is in contrast to the other populations receiving low-dose radiation over long periods.
Page 566:
[T]he association between thyroid cancer and medical exposure was implicated in the early 1950s…. A pooled analysis of seven studies with organ doses to individual subjects was conducted in 199561. It included five cohort studies (atomic bomb survivors, children treated for tinea capitis, children irradiated for enlarged tonsils and infants irradiated for an enlarged thymus gland) and two case–control studies (patients with cervical cancer and childhood cancer). … An elevated risk of thyroid cancer was observed at doses as small as 100 mGy; however, it was no longer statistically significant below this level.
[785] Booklet: “Chernobyl’s Legacy: Health, Environmental and Socio-Economic Impacts and Recommendations to the Governments of Belarus, the Russian Federation and Ukraine (2nd revised version).” Chernobyl Forum, April 2006. <www-pub.iaea.org>
Page 7:
The accident at the Chernobyl nuclear power plant in 1986 was the most severe in the history of the nuclear power industry, causing a huge release of radionuclides over large areas of Belarus, Ukraine and the Russian Federation. Now, 20 years later, UN [United Nations] Agencies and representatives of the three countries have reviewed the health, environmental and socio-economic consequences.
NOTE: The Chernobyl Forum is an organization staffed by the International Atomic Energy Agency, World Health Organization, U.N. Development Programme, Food and Agriculture Organization, U.N. Environment Programme, U.N. Office for the Coordination of Humanitarian Affairs, U.N. Scientific Committee on the Effects of Atomic Radiation, World Bank, and the governments of Belarus, the Russian Federation, and Ukraine
[786] Report: “Environmental Consequences of the Chernobyl Accident and Their Remediation: Twenty Years of Experience.” Chernobyl Forum, Expert Group on Environment, April 2006. <www-pub.iaea.org>
Page 142: “FIG. 7.1. the destroyed reactor after the accident in 1986.”
[787] News release: “Chernobyl: The True Scale of the Accident.” World Health Organization, International Atomic Energy Agency, and United Nations Development Program, September 5, 2005. <www.who.int>
The new numbers are presented in a landmark digest report, “Chernobyl’s Legacy: Health, Environmental and Socio-Economic Impacts,” just released by the Chernobyl Forum. The digest, based on a three-volume, 600-page report and incorporating the work of hundreds of scientists, economists and health experts, assesses the 20-year impact of the largest nuclear accident in history. The Forum is made up of 8 UN [United Nations] specialized agencies, including the International Atomic Energy Agency (IAEA), World Health Organization (WHO), United Nations Development Programme (UNDP), Food and Agriculture Organization (FAO), United Nations Environment Programme (UNEP), United Nations Office for the Coordination of Humanitarian Affairs (UN-OCHA), United Nations Scientific Committee on the Effects of Atomic Radiation (UNSCEAR), and the World Bank, as well as the governments of Belarus, the Russian Federation and Ukraine.
NOTE: The volumes of this digest report are as follows:
1) Report: “Heath Effects of the Chernobyl Accident and Special Health Care Programmes.” Chernobyl Forum, Expert Group on Health, 2006. <whqlibdoc.who.int>
2) Report: “Environmental Consequences of the Chernobyl Accident and Their Remediation: Twenty Years of Experience.” Chernobyl Forum, Expert Group on Environment, April 2006. <www-pub.iaea.org>
3) Booklet: “Chernobyl’s Legacy: Health, Environmental and Socio-Economic Impacts and Recommendations to the Governments of Belarus, the Russian Federation and Ukraine (2nd revised version).” Chernobyl Forum, April 2006. <www-pub.iaea.org>
[788] News release: “Chernobyl: The True Scale of the Accident.” World Health Organization, International Atomic Energy Agency, and United Nations Development Program, September 5, 2005. <www.who.int>
“Approximately 1,000 on-site reactor staff and emergency workers were heavily exposed to high-level radiation on the first day of the accident; among the more than 200,000 emergency and recovery operation workers exposed during the period from 1986–1987, an estimated 2,200 radiation-caused deaths can be expected during their lifetime.”
[789] News release: “Chernobyl: The True Scale of the Accident.” World Health Organization, International Atomic Energy Agency, and United Nations Development Program, September 5, 2005. <www.who.int>
What impact did Chernobyl and the aftermath have on local communities?
More than 350,000 people have been relocated away from the most severely contaminated areas, 116,000 of them immediately after the accident. Even when people were compensated for losses, given free houses and a choice of resettlement location, the experience was traumatic and left many with no employment and a belief that they have no place in society. Surveys show that those who remained or returned to their homes coped better with the aftermath than those who were resettled. Tensions between new and old residents of resettlement villages also contributed to the ostracism felt by the newcomers. The demographic structure of the affected areas became skewed since many skilled, educated and entrepreneurial workers, often younger, left the areas leaving behind an older population with few of the skills needed for economic recovery.
[790] News release: “Chernobyl: The True Scale of the Accident.” World Health Organization, International Atomic Energy Agency, and United Nations Development Program, September 5, 2005. <www.who.int>
“An estimated five million people currently live in areas of Belarus, Russia and Ukraine that are contaminated with radionuclides due to the accident; about 100,000 of them live in areas classified in the past by government authorities as areas of ‘strict control.’ The existing ‘zoning’ definitions need to be revisited and relaxed in light of the new findings.”
[791] News release: “Chernobyl: The True Scale of the Accident.” World Health Organization, International Atomic Energy Agency, and United Nations Development Program, September 5, 2005. <www.who.int>
How much radiation were people exposed to as a result of the accident?
With the exception of on-site reactor staff and emergency workers exposed on 26 April, most recovery operation workers and those living in contaminated territories received relatively low whole body radiation doses, comparable to background radiation levels and lower than the average doses received by residents in some parts of the world having high natural background radiation levels.
[792] News release: “Chernobyl: The True Scale of the Accident.” World Health Organization, International Atomic Energy Agency, and United Nations Development Program, September 5, 2005. <www.who.int>
A total of up to 4000 people could eventually die of radiation exposure from the Chernobyl nuclear power plant (NPP) accident nearly 20 years ago, an international team of more than 100 scientists has concluded.
As of mid-2005, however, fewer than 50 deaths had been directly attributed to radiation from the disaster, almost all being highly exposed rescue workers, many who died within months of the accident but others who died as late as 2004.
[793] News release: “Chernobyl: The True Scale of the Accident.” World Health Organization, International Atomic Energy Agency, and United Nations Development Program, September 5, 2005. <www.who.int>
“About 4,000 cases of thyroid cancer, mainly in children and adolescents at the time of the accident, have resulted from the accident’s contamination and at least nine children died of thyroid cancer; however the survival rate among such cancer victims, judging from experience in Belarus, has been almost 99%.”
[794] News release: “Chernobyl: The True Scale of the Accident.” World Health Organization, International Atomic Energy Agency, and United Nations Development Program, September 5, 2005. <www.who.int>
A total of up to 4000 people could eventually die of radiation exposure from the Chernobyl nuclear power plant (NPP) accident nearly 20 years ago, an international team of more than 100 scientists has concluded.
As of mid-2005, however, fewer than 50 deaths had been directly attributed to radiation from the disaster, almost all being highly exposed rescue workers, many who died within months of the accident but others who died as late as 2004. …
The estimated 4,000 casualties may occur during the lifetime of about 600,000 people under consideration. As about quarter of them will eventually die from spontaneous cancer not caused by Chernobyl radiation, the radiation-induced increase of about 3% will be difficult to observe. However, in the most highly exposed cohorts of emergency and recovery operation workers, some increase in particular cancers (e.g., leukemia) has already been observed.
[795] News release: “Chernobyl: The True Scale of the Accident.” World Health Organization, International Atomic Energy Agency, and United Nations Development Program, September 5, 2005. <www.who.int>
Have there been or will there be any inherited or reproductive effects?
Because of the relatively low doses to residents of contaminated territories, no evidence or likelihood of decreased fertility has been seen among males or females. Also, because the doses were so low, there was no evidence of any effect on the number of stillbirths, adverse pregnancy outcomes, delivery complications or overall health of children. A modest but steady increase in reported congenital malformations in both contaminated and uncontaminated areas of Belarus appears related to better reporting, not radiation.
[796] News release: “Chernobyl: The True Scale of the Accident.” World Health Organization, International Atomic Energy Agency, and United Nations Development Program, September 5, 2005. <www.who.int>
“Persistent myths and misperceptions about the threat of radiation have resulted in ‘paralyzing fatalism’ among residents of affected areas.”
[797] News release: “Chernobyl: The True Scale of the Accident.” World Health Organization, International Atomic Energy Agency, and United Nations Development Program, September 5, 2005. <www.who.int>
“Poverty, ‘lifestyle’ diseases now rampant in the former Soviet Union and mental health problems pose a far greater threat to local communities than does radiation exposure.”
[798] Report: “Environmental Consequences of the Chernobyl Accident and Their Remediation: Twenty Years of Experience.” Chernobyl Forum, Expert Group on Environment, April 2006. <www-pub.iaea.org>
Pages 12–13:
The Chernobyl nuclear accident in April 1986 occurred not in a desert or ocean but in a territory with a temperate climate and flourishing flora and fauna. Both acute radiation effects (radiation death of plants and animals, loss of reproduction, etc.) and long term effects (change of biodiversity, cytogenetic anomalies, etc.) have been observed in the affected areas. Biota located in the area nearest to the source of the radioactive release, the 30 km [19 mile] zone or Chernobyl exclusion zone (CEZ), were most affected. …
… At present, traces of adverse radiation effects on biota can hardly be found in the near vicinity of the radiation source (a few kilometres from the damaged reactor), and on the rest of the territory both wild plants and animals are flourishing because of the removal of the major natural stressor: humans. …
Radiation from radionuclides released by the Chernobyl accident caused numerous acute adverse effects in the biota located in the areas of highest exposure (i.e. up to a distance of a few tens of kilometres from the release point). Beyond the CEZ, no acute radiation induced effects on biota have been reported.
The environmental response to the Chernobyl accident was a complex interaction among radiation dose, dose rate and its temporal and spatial variations, and the radiosensitivities of the different taxons. Both individual and population effects caused by radiation induced cell death have been observed in plants and animals as follows:
(a) Increased mortality of coniferous plants, soil invertebrates and mammals;
(b) Reproductive losses in plants and animals;
(c) Chronic radiation syndrome in animals (mammals, birds, etc.).
No adverse radiation induced effects have been reported in plants and animals exposed to a cumulative dose of less than 0.3 Gy during the first month after the radionuclide fallout.
Following the natural reduction of exposure levels due to radionuclide decay and migration, populations have been recovering from the acute radiation effects. By the next growing season after the accident, the population viability of plants and animals substantially recovered as a result of the combined effects of reproduction and immigration. A few years were needed for recovery from the major radiation induced adverse effects in plants and animals.
The acute radiobiological effects observed in the Chernobyl accident area are consistent with radiobiological data obtained in experimental studies or observed in natural conditions in other areas affected by ionizing radiation. Thus rapidly developing cell systems, such as meristems of plants and insect larvae, were predominantly affected by radiation. At the organism level, young plants and animals were found to be the most sensitive to the acute effects of radiation.
Genetic effects of radiation, in both somatic and germ cells, were observed in plants and animals in the CEZ during the first few years after the accident. Both in the CEZ and beyond, different cytogenetic anomalies attributable to radiation continue to be reported from experimental studies performed on plants and animals. Whether the observed cytogenetic anomalies have any detrimental biological significance is not known.
The recovery of affected biota in the CEZ has been confounded by the overriding response to the removal of human activities (e.g. termination of agricultural and industrial activities and the accompanying environmental pollution in the most affected area). As a result, the populations of many plants and animals have expanded, and the present environmental conditions have had a positive impact on the biota in the CEZ.
[799] Summary report: “March 11, 2011 Japan Earthquake and Tsunami.” National Oceanic & Atmospheric Administration, National Geophysical Data Center. Updated March 2015. <www.ngdc.noaa.gov>
Page 1 (of PDF):
The 11 March 2011 magnitude 9.0 Honshu, Japan earthquake (38.297 N, 142.372 E, depth 30 km) generated a tsunami that was observed all over the Pacific region and caused tremendous devastation locally*. The National Police Agency of Japan reports that as of February 2015, there are 15,890 deaths and 2,590 missing and presumed deaths; and 6,152 injuries in 12 Japanese prefectures. The tsunami also caused one death in Papua, Indonesia and one death in Klamath River, California. The earthquake and tsunami caused $220 billion damage in Japan and resulted in a nuclear disaster with an International Atomic Energy Agency (IAEA) rating of 7 at the Fukushima I (Daiichi) Nuclear Power station. The tsunami also caused $30 million damage in Hawaii; $55 million damage to marine facilities in California; and $6 million in losses to the fishing industry in Tongoy, Chile over 16,000 km from the source. This was the first time observational evidence from satellites linked a tsunami to ice-shelf calving in Antarctica.
This is the fourth largest earthquake in the world and the largest in Japan since instrumental recordings began in 1900. The earthquake generated the deadliest tsunami since the 2004 magnitude 9.1 Northern Sumatra earthquake and tsunami caused nearly 230,000 deaths and $10 billion in damage. This is the most devastating earthquake to occur in Japan since the 1995 Kobe earthquake caused over 5,500 deaths and the deadliest tsunami since the 1993 Hokkaido earthquake generated a tsunami which was responsible for over 200 deaths.
[800] Article: “Japan Earthquake and Tsunami of 2011.” By Kenneth Pletcher and others. Encyclopædia Britannica. Accessed September 16, 2013 at <www.britannica.com>
The event began with a powerful earthquake off the northeastern coast of Honshu, Japan’s main island, which caused widespread damage on land and initiated a series of large tsunami waves that devastated many coastal areas of the country, most notably in the Tohoku region (northeastern Honshu). …
Ultimately, the official total for the number of those confirmed dead or listed as missing from the disaster was about 18,500, although other estimates gave a final toll of at least 20,000. …
… [I]nundation by the tsunami waves damaged the backup generators at some of those plants, most notably at the Fukushima Daiichi (“Number One”) plant…. With power gone, the cooling systems failed in three reactors within the first few days of the disaster, and their cores subsequently overheated, leading to partial meltdowns of the fuel rods. (Some plant workers, however, attributed at least one partial meltdown to coolant-pipe bursts caused by the earthquake’s ground vibrations.) Melted material fell to the bottom of the containment vessels in reactors 1 and 2 and burned sizable holes through the floor of each vessel, which partially exposed the nuclear material in the cores. Explosions resulting from the buildup of pressurized hydrogen gas in the outer containment buildings enclosing reactors 1, 2, and 3, along with a fire touched off by rising temperatures in spent fuel rods stored in reactor 4, led to the release of significant levels of radiation from the facility in the days and weeks following the earthquake.
[801] Calculated with data from: “Sources, Effects and Risks of Ionizing Radiation—Report to the General Assembly, Volume 1, Scientific Annex A: Levels and Effects of Radiation Exposure Due to the Nuclear Accident After the 2011 Great East-Japan Earthquake and Tsunami.” United Nations Scientific Committee on the Effects of Atomic Radiation, October 2014. <www.unscear.org>
Page 10:
No radiation-related deaths or acute diseases have been observed among the workers and general public exposed to radiation from the accident. …
The doses to the general public, both those incurred during the first year and estimated for their lifetimes, are generally low or very low. No discernible increased incidence of radiation-related health effects are expected among exposed members of the public or their descendants. …
For adults in Fukushima Prefecture, the Committee estimates average lifetime effective doses to be of the order of 10 mSv or less, and first-year doses to be one third to one half of that. While risk models by inference suggest increased cancer risk, cancers induced by radiation are indistinguishable at present from other cancers. Thus, a discernible increase in cancer incidence in this population that could be attributed to radiation exposure from the accident is not expected. An increased risk of thyroid cancer in particular can be inferred for infants and children. The number of infants that may have received thyroid doses of 100 mGy is not known with confidence; cases exceeding the norm are estimated by model calculations only, and in practice they are difficult to verify by measurement.
Pages 66–67:
Up to the end of October 2012, a total of 24,832 workers were reported to have been involved in mitigation and other activities on the site and were occupationally exposed to radiation; of these, about 15% were employed by TEPCO [Tokyo Electric Power Company], with the remainder employed by contractors and subcontractors. …
The data indicate that 34% of the workforce received cumulative doses greater than 10 mSv, and that 0.7% of the workforce (corresponding to 173 individuals, mainly TEPCO workers) received cumulative doses greater than 100 mSv. Six TEPCO workers received cumulative doses greater than 250 mSv. …
The highest reported effective dose was 679 mSv for the TEPCO worker who also had received the highest reported committed effective dose due to internal exposure (590 mSv).
Page 74:
Generally and in the absence of better available information, assumptions were made that would have tended to overestimate the doses to members of the public. This may particularly have been the case for estimating doses due to ingestion of radionuclides and not being able to take account of protective measures because of lack of information on their degree of implementation. Some direct in vivo measurements of activity in the thyroid (a particularly important factor for those exposed as children or infants when considering the risk of thyroid cancer later in life) and whole-body counting also indicated that the Committee’s estimates were somewhat higher than the doses implied by these measurements. Nevertheless, it cannot be excluded that some individuals incurred doses somewhat higher than those estimated by the Committee. …
For workers, uncertainties were mainly related to exposures in the early phase of the accident. At that time, monitoring was impaired by the shortage of dosimeters, and thyroid monitoring was not performed until later.
Page 211:
Up until 31 October 2012, a total of 24,832 occupationally exposed workers (“radiation workers37”) had been involved in mitigation and other activities at the Fukushima Daiichi Nuclear Power Station (FDNPS). In addition, a few hundred emergency workers were deployed on the FDNPS site: these included fire-fighters, police and Self-Defence Force workers.
Page 218:
Table D4. Numbers of occupationally exposed FDNPS workers with cumulative effective doses for the period from March 2011 to 31 October 2012 in each dose band … Cumulative dose (mSv) … Over 250 … Total [=] 6 … 200–<250 … Total [=] 3 … 150–<200 … Total [=] 26 … 100–<150 … Total [=] 138 … 10 or less … Total [=] 16162 … Maximum … Total [=] 678.80
Page 253:
From an estimate of absorbed dose of 50 mGy to the thyroid of infants, and assuming that the risk of thyroid cancer could be extrapolated down to these dose ranges using a linear dose–response function, a relative lifetime risk of thyroid cancer due to the exposure over the baseline risk could be inferred to be about 1.3. … Furthermore, direct measurements of radioiodine content in the thyroid have suggested that actual doses to the thyroid for some individuals might be lower than the average doses estimated by the Committee using environmental measurements and modelling, although there are some questions about how representative the thyroid measurements generally were. …
The Committee estimated that the doses to the thyroid varied considerably among individuals, indicatively from about 2 to 3 times higher or lower than the average for a district. It considered that fewer than a thousand children might have received absorbed doses to the thyroid that exceeded 100 mGy and ranged up to about 150 mGy. The risk of thyroid cancer for this group could be expected to be increased. However, it would be difficult, if not impossible, to identify precisely those individuals with the highest exposure, and risks at these low doses have not been convincingly demonstrated;… Information on dose distribution and uncertainties was not sufficient for the Committee to draw firm conclusions as to whether any potential increased incidence of thyroid cancer would be discernible among those exposed to higher thyroid doses during infancy and childhood.
CALCULATION: 6 workers with doses over 250 mSv + 3 with doses 200–<250 mSv + 26 with doses 150–<200 mSv + 138 with doses 100–<150 mSv = 173 workers with doses of 100 mSv or more
[802] “Developments Since the 2013 UNSCEAR [United Nations Scientific Committee on the Effects of Atomic Radiation] Report on the Levels and Effects of Radiation Exposure Due to the Nuclear Accident Following the Great East-Japan Earthquake and Tsunami: A 2015 White Paper to Guide the Scientific Committee’s Future Programme of Work.” United Nations Scientific Committee on the Effects of Atomic Radiation, October 12, 2015. <www.unscear.org>
Page v:
Following its assessment of the levels and effects of radiation exposure due to the accident after the 2011 great east-Japan earthquake and tsunami, as presented in its 2013 report to the General Assembly (A/68/46) and the supporting detailed scientific annex,2 the Committee had put in place arrangements for follow-up activities to enable it to remain abreast of additional information as it was published in the scientific literature. …
The Committee identified a large number of new publications that had become available between the time it conducted its assessment and the end of 2014, and systematically appraised about 80 of those in the lead-up to its sixty-second session. More than half of those 80 publications corroborated one or another of the major assumptions made by the Committee in its 2013 report. None of them challenged the report’s major assumptions or affected its main findings, while some needed further analysis or more conclusive evidence from additional research.
[803] Report: “Backgrounder on the Three Mile Island Accident.” U.S. Nuclear Regulatory Commission, June 2018. <www.nrc.gov>
Page 1:
The Three Mile Island Unit 2 [TMI-2] reactor, near Middletown, Pa., partially melted down on March 28, 1979. This was the most serious accident in U.S. commercial nuclear power plant operating history, although its small radioactive releases had no detectable health effects on plant workers or the public. Its aftermath brought about sweeping changes involving emergency response planning, reactor operator training, human factors engineering, radiation protection, and many other areas of nuclear power plant operations. It also caused the NRC [Nuclear Regulatory Commission] to tighten and heighten its regulatory oversight. All of these changes significantly enhanced U.S. reactor safety.
A combination of equipment malfunctions, design-related problems and worker errors led to TMI-2’s partial meltdown and very small off-site releases of radioactivity.
[804] Webpage: “Radiation Doses in Perspective.” U.S. Environmental Protection Agency, July 6, 2012. <www.epa.gov>
“In the U.S., doses are most commonly reported in millirem (mrem). A millirem is one thousandth of a rem (1000 mrem = 1 rem).”
[805] Report: “Backgrounder on the Three Mile Island Accident.” U.S. Nuclear Regulatory Commission, June 2018. <www.nrc.gov>
Page 2:
The approximately 2 million people around TMI-2 [Three Mile Island-Reactor 2] during the accident are estimated to have received an average radiation dose of only about 1 millirem [0.01 mSv] above the usual background dose. To put this into context, exposure from a chest X-ray is about 6 millirem [0.06 mSv] and the area’s natural radioactive background dose is about 100–125 millirem [1–1.25 mSv] per year for the area. The accident’s maximum dose to a person at the site boundary would have been less than 100 [1 mSv] millirem above background.
[806] Article: “Long-Term Follow-Up of the Residents of the Three Mile Island Accident Area: 1979–1998.” By Evelyn O. Talbott and others. Environmental Health Perspectives, March 2003. Pages 341–348. <www.ncbi.nlm.nih.gov>
Page 343:
Estimated maximum and likely whole-body gamma radiation doses for the TMI [Three Mile Island] cohort are presented in Figures 1 and 2, respectively. The average maximum gamma dose was 24.6 mrem (0.25 mSv) per individual, with approximately 18% of the TMI cohort exposed to over 40 mrem (0.4 mSv) maximum gamma radiation (approximately three chest X-rays). The average likely gamma radiation dose was 10.4 mrem (0.10 mSv), with approximately 13% of the cohort exposed to over 20 mrem (0.20 mSv). Less than 2.1% of the cohort received the highest levels of estimated maximum or likely gamma radiation (Talbott et al. 2000a).
[807] Report: “Backgrounder on the Three Mile Island Accident.” U.S. Nuclear Regulatory Commission, June 2018. <www.nrc.gov>
Page 2:
The NRC [Nuclear Regulatory Commission] conducted detailed studies of the accident’s radiological consequences, as did the Environmental Protection Agency, the Department of Health, Education and Welfare (now Health and Human Services), the Department of Energy, and the Commonwealth of Pennsylvania. Several independent groups also conducted studies. …
In the months following the accident, although questions were raised about possible adverse effects from radiation on human, animal, and plant life in the TMI [Three Mile Island] area, none could be directly correlated to the accident. Thousands of environmental samples of air, water, milk, vegetation, soil, and foodstuffs were collected by various government agencies monitoring the area. Very low levels of radionuclides could be attributed to releases from the accident. However, comprehensive investigations and assessments by several well respected organizations, such as Columbia University and the University of Pittsburgh, have concluded that in spite of serious damage to the reactor, the actual release had negligible effects on the physical health of individuals or the environment.
[808] Article: “Long-Term Follow-Up of the Residents of the Three Mile Island Accident Area: 1979–1998.” By Evelyn O. Talbott and others. Environmental Health Perspectives, March 2003. Pages 341–348. <www.ncbi.nlm.nih.gov>
Page 348:
In conclusion, the mortality surveillance of this cohort, with a total of almost 20 years of follow-up, provides no consistent evidence that radioactivity released during the TMI [Three Mile Island] accident (estimated maximum and likely gamma exposure) has had a significant impact on the mortality experience of this cohort through 1998. Slight increases in overall mortality and overall cancer mortality persist. The findings of increased risk of LHT for males for maximum gamma exposure and in females for background gamma are of interest and merit continued surveillance to determine if the trend continues. With the exception of breast cancer risk and all lymphatic and hematopoietic tissue (LHT) and maximum gamma exposure, no apparent trends were seen with any of the radiation exposure variables. The slight trend for female breast cancer and likely gamma exposure seen in the earlier update is no longer evident.
[809] Report: “Nuclear Energy Policy.” By Mark Holt. Congressional Research Service, October 15, 2014. <www.fas.org>
Page 14:
In terms of public health consequences, the safety record of the U.S. nuclear power industry in comparison with other major commercial energy technologies has been excellent. During more than 3,500 reactor-years of operation in the United States,61 the only incident at a commercial nuclear power plant that might lead to any deaths or injuries to the public has been the Three Mile Island accident, in which more than half the reactor core melted.62 A study of 32,000 people living within five miles of the reactor when the accident occurred found no significant increase in cancer rates through 1998, although the authors noted that some potential health effects “cannot be definitively excluded.”63
61 Nuclear Energy Institute, viewed September 16, 2014, <resources.nei.org>
62 Nuclear Regulatory Commission, “Backgrounder on the Three Mile Island Accident,” April 25, 2014, <www.nrc.gov>
63 Evelyn O. Talbott and others, “Long Term Follow-Up of the Residents of the Three Mile Island Accident Area: 1979–1998,” Environmental Health Perspectives, March 2003, pp. 341–348, <www.ncbi.nlm.nih.gov>
[810] Report: “Annual Energy Review 2011.” U.S. Energy Information Administration, Office of Energy Statistics, September 2012. <www.eia.gov>
Page 350: “Biomass: Organic nonfossil material of biological origin constituting a renewable energy source.”
[811] Report: “Annual Energy Review 2011.” U.S. Energy Information Administration, Office of Energy Statistics, September 2012. <www.eia.gov>
Page 370: “Wood and Wood-Derived Fuels: Wood and products derived from wood that are used as fuel, including round wood (cord wood), limb wood, wood chips, bark, sawdust, forest residues, charcoal, paper pellets, railroad ties, utility poles, black liquor, red liquor, sludge wood, spent sulfite liquor, and other wood-based solids and liquids.”
[812] Report: “Challenges of Electric Power Industry Restructuring for Fuel Suppliers.” U.S. Energy Information Administration, September 1998. <www.eia.gov>
Page 81:
Biomass produced 75 percent of non-hydroelectric renewable electricity in 1997, with wood comprising the largest component of biomass energy. … [W]ood and wood waste … are the principal biomass products used to produce electricity. Their use is greatest in the forest products industry, which consumes about 85 percent of all wood and wood waste used for energy and is the second-largest consumer of electricity in the industrial sector (Figure 23)….184 Electric utilities have historically relied on fossil fuels and consumed very little biomass. Of the more than 500 U.S. biomass power production facilities (with total capability near 10 gigawatts), fewer than 20 are owned or operated by electric utilities.
Almost all industrial firms that generate biomass-based electricity do so to achieve multiple objectives. First, most of these firms are producing biomass-related products185 and have waste streams (e.g., pulping liquor) available as (nearly) free fuel. This makes the cost of self-generation cheaper in many cases than purchasing electricity. Despite the fact that the Forest Products Industry self-generates a substantial portion of its electricity demand, its sizable power requirements leave plenty of room for additional competitively priced self-generation, if such is possible. Second, combusting waste to generate electricity also solves otherwise substantial waste disposal problems. Thus, the net cost of generation is much lower to the forest products industry than it would be if its generating facilities were used only to produce electricity, because a sizable waste disposal cost is being avoided. The use of waste-based fuel by some industrial generators to reduce waste disposal costs while simultaneously providing power is an example of synergy among industrial production, environmental concerns, and energy production.
NOTE: For time-series data on wood biomass usage in the U.S., see the forthcoming graph.
[813] Booklet: “Energy, Powering Your World.” By M.T. Westra and S. Kuyvenhoven. Foundation for Fundamental Research on Matter, Institute for Plasma Physics, Rijnhuizen (the Netherlands), 2002. <fire.pppl.gov>
Page 38: “Something like 80% of the total energy demand in the developing world is covered by biomass energy, mostly in the form of firewood.”
[814] Report: “Biofuels Issues and Trends.” U.S. Energy Information Administration, October, 2012. <www.eia.gov>
Page 1: “Biofuels is a collective term for liquid fuels derived from renewable sources, including ethanol, biodiesel, and other renewable liquid fuels.”
[815] Report: “Annual Energy Review 2011.” U.S. Energy Information Administration, Office of Energy Statistics, September 2012. <www.eia.gov>
Page 350:
Biodiesel: A fuel typically made from soybean, canola, or other vegetable oils; animal fats; and recycled grease. It can serve as a substitute for petroleum-derived diesel fuel or distillate fuel oil. For U.S. Energy Information Administration reporting, it is a fuel composed of mono-alkyl esters of long chain fatty acids derived from vegetable oils or animal fats, designated B100, and meeting the requirements of ASTM (American Society for Testing & Materials) D 6751.
Biofuels: Liquid fuels and blending components produced from biomass (plant) feedstocks, used primarily for transportation. See Biodiesel and Fuel Ethanol.
Page 354: “Denaturant: Petroleum, typically pentanes plus or conventional motor gasoline, added to fuel ethanol to make it unfit for human consumption. Fuel ethanol is denatured, usually prior to transport from the ethanol production facility, by adding 2 to 5 volume percent denaturant. See Fuel Ethanol and Fuel Ethanol Minus Denaturant.”
Page 357:
Fuel Ethanol: Ethanol intended for fuel use. Fuel ethanol in the United States must be anhydrous (less than 1 percent water). Fuel ethanol is denatured (made unfit for human consumption), usually prior to transport from the ethanol production facility, by adding 2 to 5 volume percent petroleum, typically pentanes plus or conventional motor gasoline. Fuel ethanol is used principally for blending in low concentrations with motor gasoline as an oxygenate or octane enhancer. In high concentrations, it is used to fuel alternative-fuel vehicles specially designed for its use. See Alternative-Fuel Vehicle, Denaturant, E85 [a mixture of 70–85% ethanol and 15–30% gasoline], Ethanol, Fuel Ethanol Minus Denaturant, and Oxygenates.
[816] Report: “The Impact of Ethanol Use on Food Prices and Greenhouse-Gas Emissions.” Congressional Budget Office, April 2009. <www.cbo.gov>
Page 2:
Ethanol is produced from some form of sugar and can be readily derived from sugar crops, most notably sugarcane and sugar beets. In the United States, however, the potential to grow sugar crops as a feedstock (that is, the raw material) for ethanol production is limited; growing conditions are not as favorable here as in Brazil, for example, which has a thriving ethanol industry based on sugarcane.5 As a result, almost all of the ethanol that is commercially produced in the United States (which is known as corn or conventional ethanol) is derived from cornstarch, or the corn kernel.
[817] Report: “Annual Energy Review 2011.” U.S. Energy Information Administration, Office of Energy Statistics, September 2012. <www.eia.gov>
Page 350:
Biomass Waste: Organic nonfossil material of biological origin that is a byproduct or a discarded product. “Biomass waste” includes municipal solid waste from biogenic sources, landfill gas, sludge waste, agricultural crop byproducts, straw, and other biomass solids, liquids, and gases; but excludes wood and wood-derived fuels (including black liquor), biofuels feedstock, biodiesel, and fuel ethanol. Note: EIA [U.S. Energy Information Administration] “biomass waste” data also include energy crops grown specifically for energy production, which would not normally constitute waste.
[818] Booklet: “Energy, Powering Your World.” By M.T. Westra and S. Kuyvenhoven. Foundation for Fundamental Research on Matter, Institute for Plasma Physics, Rijnhuizen (the Netherlands), 2002. <fire.pppl.gov>
Page 38: “[A]naerobic digestion … produces methane gas, also appropriately called biogas. The process is a kind of fermentation, in which bacteria break down the biomass into smaller components. The fermentation is anaerobic, which means “without oxygen”, and it generates heat. Landfills, where municipal waste is dumped, also create biogas that can be used as fuel.”
[819] Article: “Tapping Power From Trash.” By John Rather. New York Times, September 14, 2008. <www.nytimes.com>
“[P]ower from landfill methane exceeds solar power in New York and New Jersey, and landfill methane in those states and in Connecticut powers generators that produce a total of 169 megawatts of electricity—almost as much as a small conventional generating station. The methane also provides 16.7 million cubic feet of gas daily for heating and other direct uses.”
[820] Book: Wood as an Energy Resource. By David A. Tillman. Academic Press, 1978.
Page 1: “That wood and other combustible renewable resources were mankind’s first energy sources, preceding even the use of wind and water power, is well documented.”
Page 2:
The control of fire is considered by Kahn and others to be a cornerstone in human development.1,2 It achieved success in both domestic and commercial applications. By about 5400 BC the smelting of copper and lead with wood and charcoal was being performed. …
Wood thus became the primary fuel for early civilizations. …
Except for meeting the requirements of mechanical energy during the Middle Ages, wood remained the primary fuel employed. By that time, however, several forces arose that have affected its utilization ever since.
[821] Book: Advances in Biotechnology. Edited by Pankaj K. Bhowmik and others. Bentham Books, 2009.
Chapter 11: “Progress and Recent Trends in Biofuel with Special Focus on Microbes.” By Rachana Jain and others. Pages 256–278.
Pages 257–258:
Use of biomass as a fuel is not a new concept. … The energy crisis revolved around finding a replacement for the diminishing supply of whale oil, which was commonly used as a lamp oil until 1859 when ethanol was developed as an alternative fuel before the discovery of petroleum by Edwin Drake8. By the late 1830s, ethanol blended with turpentine (refined from pine trees) was used to replace the more expensive whale oil. During this time Samuel Morey invented the internal combustion engine (US patent 4378 issued April 1, 1820) using a combination of ethanol and turpentine as a fuel. … Unfortunately, Morey was unable to find an investor to further develop the internal combustion engine. However, in the 1860s the German inventor Nikolaus August Otto rediscovered the internal combustion engine using ethanol as fuel….
The term “biodiesel” was first coined in 19889, but the history of using vegetable oil in place of diesel as a fuel dates back to 1900. The root of what eventually became known as “biodiesel” extends back to the discovery of the diesel engine by Rudolf Diesel. The first demonstration of the diesel engine was at the 1900 World’s Fair … using peanut oil.
[822] Calculated with data from the report: “July 2022 Monthly Energy Review.” U.S. Energy Information Administration, Office of Energy Statistics, July 26, 2022. <www.eia.gov>
Page 7: “Table 1.3. Primary Energy Consumption by Source (Quadrillion Btu)”
Page 179: “Table 10.1. Renewable Energy Production and Consumption by Source (Trillion Btu)”
NOTE: An Excel file containing the data and calculations is available upon request.
[823] Calculated with data from the report: “July 2022 Monthly Energy Review.” U.S. Energy Information Administration, Office of Energy Statistics, July 26, 2022. <www.eia.gov>
Page 45: “Table 2.4. Industrial Sector Energy Consumption (Trillion Btu) … End-Use Energy Consumptiona … Primary Consumptionb … Renewable Energyd … 2021 … Biomass [=] 2,313 … Total [=] R 32,105 … R=Revised.”
CALCULATION: 2,313 / 32,105 = 7.2%
[824] Report: “Challenges of Electric Power Industry Restructuring for Fuel Suppliers.” U.S. Energy Information Administration, September 1998. <www.eia.gov>
Page 81:
Biomass produced 75 percent of non-hydroelectric renewable electricity in 1997, with wood comprising the largest component of biomass energy. … [W]ood and wood waste … are the principal biomass products used to produce electricity. Their use is greatest in the forest products industry, which consumes about 85 percent of all wood and wood waste used for energy and is the second-largest consumer of electricity in the industrial sector (Figure 23).184 Electric utilities have historically relied on fossil fuels and consumed very little biomass. Of the more than 500 U.S. biomass power production facilities (with total capability near 10 gigawatts), fewer than 20 are owned or operated by electric utilities.
Almost all industrial firms that generate biomass-based electricity do so to achieve multiple objectives. First, most of these firms are producing biomass-related products185 and have waste streams (e.g., pulping liquor) available as (nearly) free fuel. This makes the cost of self-generation cheaper in many cases than purchasing electricity. Despite the fact that the Forest Products Industry self-generates a substantial portion of its electricity demand, its sizable power requirements leave plenty of room for additional competitively priced self-generation, if such is possible. Second, combusting waste to generate electricity also solves otherwise substantial waste disposal problems. Thus, the net cost of generation is much lower to the forest products industry than it would be if its generating facilities were used only to produce electricity, because a sizable waste disposal cost is being avoided. The use of waste-based fuel by some industrial generators to reduce waste disposal costs while simultaneously providing power is an example of synergy among industrial production, environmental concerns, and energy production.
[825] Calculated with data from the report: “July 2022 Monthly Energy Review.” U.S. Energy Information Administration, Office of Energy Statistics, July 26, 2022. <www.eia.gov>
Page 47: “Table 2.5. Transportation Sector Energy Consumption (Trillion Btu) … End-Use Energy Consumptiona … Primary Consumptionb … Renewable Energyc … 2021 … Biomass [=] 1,477 … Total [=] 26,933”
CALCULATION: 1,477 / 26,933 = 5.5%
[826] Calculated with data from the report: “July 2022 Monthly Energy Review.” U.S. Energy Information Administration, Office of Energy Statistics, July 26, 2022. <www.eia.gov>
Page 41: “Table 2.2. Residential Sector Energy Consumption (Trillion Btu) … End-Use Energy Consumptiona … Primary Consumptionb … Renewable Energyc … 2021 … Biomass [=] 464 … Total [=] R 20,884 … R=Revised.”
CALCULATION: 464 / 20,884 = 2.21%
[827] Calculated with data from the report: “July 2022 Monthly Energy Review.” U.S. Energy Information Administration, Office of Energy Statistics, July 26, 2022. <www.eia.gov>
Page 43: “Table 2.3. Commercial Sector Energy Consumption … … End-Use Energy Consumptiona … Primary Consumptionb … Renewable Energyd … 2021 … Biomass [=] 147… Total [=] R 17,410 … R=Revised.”
CALCULATION: 147 / 17,410 = 0.8%
[828] Report: “Biofuels: Challenges to the Transportation, Sale, and Use of Intermediate Ethanol Blends.” U.S. Government Accountability Office, June 2011. <www.gao.gov>
Page 2 (of PDF): “The most common U.S. biofuel is ethanol, typically produced from corn in the Midwest, transported by rail, and blended with gasoline as E10 (10 percent ethanol).”
[829] Final rule: “Regulation of Fuels and Fuel Additives: 2013 Renewable Fuel Standards (Part II).” Federal Register, August 15, 2013. <www.gpo.gov>
Page 49798: “As described in the NPRM [Notice of Proposed Rulemaking], we recognize that ethanol will likely continue to predominate in the renewable fuel pool in the near future….”
[830] Book: Biofuels Production. Edited by Vikash Babu and others. Scrivener Publishing/John Wiley & Sons, 2014.
Chapter 8: “Bioethanol Production Processes.” By Mohammed J. Taherzadeh and others.
“Ethanol, with more than 86 billion liters produced in 2011, is the dominant biofuel in the global fuel market.”
[831] Report: “Information on Likely Program Effects on Gasoline Prices and Greenhouse Gas Emissions.” U.S. Government Accountability Office, May 2019. <www.gao.gov>
Page 1 (of PDF): “The most common biofuel currently produced in the United States is corn-starch ethanol, distilled from the sugars in corn.”
[832] Webpage: “Biofuels Explained: Biodiesel, Renewable Diesel, and Other Biofuels.” U.S. Energy Information Administration. Last updated June 29, 2022. <www.eia.gov>
“In 2020, biodiesel was second to fuel ethanol as the most produced and consumed biofuel in the United States”
[833] Dataset: “Biofuels.” U.S. Energy Information Administration. Accessed September 1, 2022 at <www.eia.gov>
“2019 … World … Production (Mb/d) [=] 2,690 … Fuel Ethanol (Mb/d) [=] 1,886”
[834] Report: “The Impact of Ethanol Use on Food Prices and Greenhouse-Gas Emissions.” Congressional Budget Office, April 2009. <www.cbo.gov>
Page 2:
The federal government has supported the development and use of ethanol since the late 1970s through programs that subsidize the production of ethanol, impose tariffs on ethanol imports, and mandate particular amounts of consumption. Those programs provide support because, when the two fuels are assessed on the basis of their energy content, ethanol has often been more expensive than gasoline to produce in the United States. …
The Production Subsidy
Since 1978, firms that blend ethanol with gasoline have received a tax incentive from the federal government. The incentive has been adjusted periodically; today, ethanol blenders receive a tax credit of 45 cents for each gallon of ethanol blended into the supply of gasoline. The subsidy has helped keep ethanol competitive with gasoline, even when prices for corn are high (see Box 1). In 2007, the cost of the credit in forgone federal tax revenues was $3 billion.7
Import Tariffs
The production subsidy for ethanol applies to both domestic and imported ethanol, but the United States charges importers of ethanol a tariff of 54 cents per gallon and an ad valorem tariff of 2.5 percent of the value of the imported ethanol. (Prices for ethanol sold in the United States fluctuated between $1.61 and $2.90 per gallon in 2008, resulting in ad valorem tariffs that ranged from 4 cents to 7 cents per gallon.)8 The two tariffs effectively offset the production subsidy for imported ethanol unless the imports arrive duty-free. The United States imports a relatively small amount of ethanol duty-free from countries that participate in the Caribbean Basin Initiative: an annual amount equal to as much as 7 percent of the nation’s ethanol consumption over the previous 12-month period ending on the preceding September 30.9
In 2007, domestic production accounted for about 95 percent of the U.S. ethanol supply. Imports amounting to approximately 330 million gallons accounted for the rest.10 (Half of that imported ethanol came from Brazil, either directly or indirectly, on a duty-free basis, through a Caribbean nation.) The Energy Information Administration (EIA) has estimated that imports of ethanol remained about the same in 2008 as in 2007.
[835] Report: “The Impact of Ethanol Use on Food Prices and Greenhouse-Gas Emissions.” Congressional Budget Office, April 2009. <www.cbo.gov>
Page 3:
The Energy Policy Act of 2005 laid out a schedule of mandates through 2012 for increasing the amount of biofuels used in the United States.11 The Energy Independence and Security Act of 2007 [EISA] expanded the mandates and extended them through 2022 (see Figure 1). Under those laws, federal mandates requiring the use of biofuels are intended to encourage the domestic production of ethanol and other biofuels; the mandates also seek to generate increasingly large reductions in greenhouse-gas emissions from the transportation sector.12
Specifically, those mandates require usage of biofuels in the United States to be at least 20.5 billion gallons annually by 2015, or more than double the country’s usage in 2008. Of that total, not more than 15 billion gallons may be refined from cornstarch. By 2022, the total amount of biofuels used (including conventional and cellulosic ethanol as well as biodiesel and other advanced biofuels) must be at least 36 billion gallons. …
12 EISA directed the Environmental Protection Agency to issue rules that ensured that biofuels would be sold or introduced into commerce in the United States, but it also gave the agency discretion to relax the standards if they were shown to result in severe economic or environmental harm to any state or region.
[836] Final rule: “Regulation of Fuels and Fuel Additives: 2013 Renewable Fuel Standards (Part II).” Federal Register, August 15, 2013. <www.gpo.gov>
Pages 49823–49824:
The renewable fuel standards are expressed as volume percentages and are used by each refiner, blender, or importer to determine their renewable volume obligations (RVO). Since there are four separate standards under the RFS2 [Renewable Fuel Standard, Energy Independence and Security Act of 2007] program, there are likewise four separate RVOs applicable to each obligated party. Each standard applies to the sum of all gasoline and diesel produced or imported. The applicable percentage standards are set so that if every obligated party meets the percentages, then the amount of renewable fuel, cellulosic biofuel, biomass-based diesel, and advanced biofuel used will meet the volumes required on a nationwide basis.
[837] Public Law 110-140: “Energy Independence and Security Act of 2007.” 110th U.S. Congress. Signed into law by George W. Bush on December 19, 2007. <www.gpo.gov>
Pages 31–33:
(I) Renewable Fuel—For the purpose of subparagraph (A), the applicable volume of renewable fuel for the calendar years 2006 through 2022 shall be determined in accordance with the following table:
|
Calendar Year |
Applicable Volume of Renewable Fuel (in Billions of Gallons) |
|
2006 |
4 |
|
2007 |
4.7 |
|
2008 |
9 |
|
2009 |
11.1 |
|
2010 |
12.95 |
|
2011 |
13.95 |
|
2012 |
15.2 |
|
2013 |
16.55 |
|
2014 |
18.15 |
|
2015 |
20.5 |
|
2016 |
22.25 |
|
2017 |
24 |
|
2018 |
26 |
|
2019 |
28 |
|
2020 |
30 |
|
2021 |
33 |
|
2022 |
36 |
(II) Advanced Biofuel—For the purpose of subparagraph (A), of the volume of renewable fuel required under subclause (I), the applicable volume of advanced biofuel for the calendar years 2009 through 2022 shall be determined in accordance with the following table:
|
Calendar Year |
Applicable Volume of Advanced Biofuel (in Billions of Gallons) |
|
2009 |
0.6 |
|
2010 |
0.95 |
|
2011 |
1.35 |
|
2012 |
2 |
|
2013 |
2.75 |
|
2014 |
3.75 |
|
2015 |
5.5 |
|
2016 |
7.25 |
|
2017 |
9 |
|
2018 |
11 |
|
2019 |
13 |
|
2020 |
15 |
|
2021 |
18 |
|
2022 |
21 |
(III) Cellulosic Biofuel—For the purpose of subparagraph (A), of the volume of advanced biofuel required under subclause (II), the applicable volume of cellulosic biofuel for the calendar years 2010 through 2022 shall be determined in accordance with the following table:
|
Calendar Year |
Applicable Volume of Cellulosic Biofuel (in Billions of Gallons) |
|
2010 |
0.1 |
|
2011 |
0.25 |
|
2012 |
0.5 |
|
2013 |
1 |
|
2014 |
1.75 |
|
2015 |
3 |
|
2016 |
4.25 |
|
2017 |
5.5 |
|
2018 |
7 |
|
2019 |
8.5 |
|
2020 |
10.5 |
|
2021 |
13.5 |
|
2022 |
16 |
(IV) Biomass-Based Diesel—For the purpose of subparagraph (A), of the volume of advanced biofuel required under subclause (II), the applicable volume of biomass-based diesel for the calendar years 2009 through 2012 shall be determined in accordance with the following table:
|
Calendar Year |
Applicable Volume of Biomass-Based Diesel (in Billions of Gallons) |
|
2009 |
0.5 |
|
2010 |
0.65 |
|
2011 |
0.8 |
|
2012 |
1 |
(ii) Other Calendar Years.—For the purposes of subparagraph (A), the applicable volumes of each fuel specified in the tables in clause (i) for calendar years after the calendar years specified in the tables shall be determined by the Administrator, in coordination with the Secretary of Energy and the Secretary of Agriculture, based on a review of the implementation of the program during calendar years specified in the tables, and an analysis of—
(I) the impact of the production and use of renewable fuels on the environment, including on air quality, climate change, conversion of wetlands, ecosystems, wildlife habitat, water quality, and water supply;
(II) the impact of renewable fuels on the energy security of the United States;
(III) the expected annual rate of future commercial production of renewable fuels, including advanced biofuels in each category (cellulosic biofuel and biomass-based diesel);
(IV) the impact of renewable fuels on the infrastructure of the United States, including deliverability of materials, goods, and products other than renewable fuel, and the sufficiency of infrastructure to deliver and use renewable fuel;
(V) the impact of the use of renewable fuels on the cost to consumers of transportation fuel and on the cost to transport goods; and
(VI) the impact of the use of renewable fuels on other factors, including job creation, the price and supply of agricultural commodities, rural economic development, and food prices.
[838] Article: “Ethanol Blend Wall: Are We There Yet?” U.S. Energy Information Administration, November 23, 2011. <www.eia.gov>
Over the last decade, the growth in ethanol production and consumption in the United States has been largely policy-driven, most notably through the RFS [Renewable Fuel Standard] and the Volumetric Ethanol Excise Tax Credit (VEETC), also known as the “Blender’s Tax Credit,” which has a current value of 45 cents per gallon of ethanol blended with U.S. gasoline, or 4.5 cents per gallon of gasoline containing 10-percent ethanol (E10). As a result, U.S. ethanol production has grown rapidly, increasing from 106,000 barrels per day (bbl/d) in 2000 to as high as 925,000 bbl/d in November 2010.
[839] Paper: “Fuel Miles and the Blend Wall: Costs and Emissions From Ethanol Distribution in the United States.” By Bret Strogen and others. Environmental Science & Technology, April 16, 2012. Pages 5285–5293. <www.ncbi.nlm.nih.gov>
Page 5285: “From 1991 to 2009, U.S. production of ethanol increased 10-fold, largely due to government programs motivated by climate change, energy security, and economic development goals.”
[840] Calculated with data from:
a) Dataset: “U.S. Product Supplied of Finished Motor Gasoline (Thousand Barrels per Day).” U.S. Energy Information Administration, Office of Energy Statistics, August 31, 2022. <www.eia.gov>
b) Report: “Report: “July 2022 Monthly Energy Review.” U.S. Energy Information Administration, Office of Energy Statistics, July 26, 2022. <www.eia.gov>
Page 183: “Table 10.3: Fuel Ethanol Overview.”
NOTE: An Excel file containing the data and calculations is available upon request.
[841] Webpage: “Glossary.” U.S. Energy Information Administration. Accessed July 18, 2013 at <www.eia.gov>
Gasohol: A blend of finished motor gasoline containing alcohol (generally ethanol but sometimes methanol) at a concentration between 5.7 percent and 10 percent by volume.
Motor gasoline (finished): A complex mixture of relatively volatile hydrocarbons with or without small quantities of additives, blended to form a fuel suitable for use in spark-ignition engines. Motor gasoline, as defined in ASTM [American Society for Testing and Materials] Specification D 4814 or Federal Specification VV-G-1690C, is characterized as having a boiling range of 122 to 158 degrees Fahrenheit at the 10 percent recovery point to 365 to 374 degrees Fahrenheit at the 90 percent recovery point. Motor Gasoline includes conventional gasoline; all types of oxygenated gasoline, including gasohol; and reformulated gasoline, but excludes aviation gasoline. Note: Volumetric data on blending components, such as oxygenates, are not counted in data on finished motor gasoline until the blending components are blended into the gasoline.
[842] Article: “Ethyl Alcohol.” Encyclopædia Britannica Ultimate Reference Suite 2004.
Also called ethanol, grain alcohol, or alcohol the most important member of a class of organic compounds that are given the general name alcohols; its molecular formula is C2H5OH. It is the intoxicating ingredient of many beverages produced by fermentation. …
Pure ethanol is a colourless, flammable liquid (boiling point 78.5° C [173.3° F]) with an agreeable ethereal odour and a burning taste. Ethanol is toxic, affecting the central nervous system. Moderate amounts stimulate the mind and relax the muscles, but larger amounts impair coordination and judgment, finally producing coma and death. It is an addictive drug for some persons, leading to the disease alcoholism.
[843] Report: “Annual Energy Review 2011.” U.S. Energy Information Administration, Office of Energy Statistics, September 2012. <www.eia.gov>
Page 354: “Denaturant: Petroleum, typically pentanes plus or conventional motor gasoline, added to fuel ethanol to make it unfit for human consumption. Fuel ethanol is denatured, usually prior to transport from the ethanol production facility, by adding 2 to 5 volume percent denaturant.”
[844] Book: Biorefineries: For Biomass Upgrading Facilities. By Ayhan Demirbas. Springer-Verlag, 2010.
Page 96: “Ethanol has a higher octane number (108), broader flammability limits, higher flame speeds and higher heats of vaporization than gasoline.”
[845] Book: Automotive Light Vehicle: Level 1. Jones & Bartlett Learning, 2014.
Page 88: “On the positive side, with ethanol’s, and especially methanol’s, higher octane ratings, vehicle operators are impressed with improved torque and horsepower over much of the engine speed range.”
[846] Report: “A Primer on Alternative Transportation Fuels.” By Timothy Coffey. National Defense University, Center for Technology and National Security Policy, September 2010. <apps.dtic.mil>
Page 25:
Table 6. Energy content and chemical composition of several energy sources referenced to gasoline. The bracket < > indicates the average chemical formula. (Source: modified from Coffey and others.7)
[847] Report: “Biofuels: Challenges to the Transportation, Sale, and Use of Intermediate Ethanol Blends.” U.S. Government Accountability Office, June 2011. <www.gao.gov>
Page 6: “Because a gallon of ethanol contains only about two-thirds the energy of a gallon of gasoline, the use of E85 [a mixture of 70–85% ethanol and 15–30% gasoline] results in an approximately 25 percent reduction in fuel economy.”
[848] Webpage: “Few Transportation Fuels Surpass the Energy Densities of Gasoline and Diesel.” U.S. Energy Information Administration, February 14, 2013. <www.eia.gov>
Energy density and the cost, weight, and size of onboard energy storage are important characteristics of fuels for transportation. Fuels that require large, heavy, or expensive storage can reduce the space available to convey people and freight, weigh down a vehicle (making it operate less efficiently), or make it too costly to operate, even after taking account of cheaper fuels. Compared to gasoline and diesel, other options may have more energy per unit weight, but none have more energy per unit volume.
On an equivalent energy basis, motor gasoline (which contains up to 10% ethanol) was estimated to account for 99% of light-duty vehicle fuel consumption in 2012. Over half of the remaining 1% was from diesel; all other fuels combined for less than half of 1%. The widespread use of these fuels is largely explained by their energy density and ease of onboard storage, as no other fuels provide more energy within a given unit of volume.
The chart above compares energy densities (both per unit volume and per unit weight) for several transportation fuels that are available throughout the United States. The data points represent the energy content per unit volume or weight of the fuels themselves, not including the storage tanks or other equipment that the fuels require. For instance, compressed fuels require heavy storage tanks, while cooled fuels require equipment to maintain low temperatures.
[849] Proposed rule: “Regulation to Mitigate the Misfueling of Vehicles and Engines with Gasoline Containing Greater Than Ten Volume Percent Ethanol and Modifications to the Reformulated and Conventional Gasoline Programs.” Federal Register, November 4, 2010. <www.govinfo.gov>
Pages 68067–68079:
Understanding the chemical and physical differences between gasoline and ethanol is helpful in determining how increased ethanol concentrations in gasoline may impact vehicle and engine technologies and whether emission differences may occur. …
Gasoline is a complex mixture of several hundred hydrocarbon molecules (organic compounds containing carbon and hydrogen) ranging in carbon number from four to twelve that are produced from various refinery streams. In contrast, fuel ethanol contains only one kind of molecule with two carbon atoms. Alcohols such as ethanol are derived from hydrocarbons by replacing the hydrogen atoms in their parent hydrocarbon (ethane is the parent of ethanol) with one or more hydroxyl groups containing oxygen and hydrogen. …
The question with the use of E15 [a blend of 15 percent ethanol and 85 percent gasoline by volume] is whether or not the vehicles, engines, equipment, and products that are designed for the properties of gasoline and/or E10 [a blend of 10 percent ethanol and 90 percent gasoline by volume] are also designed for the properties of E15. Some property differences between E10 and E15 may be dealt with in fuel blending such that the base gasoline can be adjusted in advance to accommodate the ethanol. This adjustment will ensure that the resulting blend meets a target specification for properties such as volatility and octane rating. On the other hand, some property differences between E10 and E15 are inherent to the ethanol fraction and cannot be accounted for by blending. For example, the impact of E15 versus E10 on engine combustion is a potential concern. How a vehicle or engine adapts to combust fuels with different ethanol concentrations depends on the vehicle hardware and software control strategies. Vehicles and engines operating on E15 may have hotter exhaust temperatures than the same vehicles and engines running on E10. In addition, material compatibility is time, temperature, and concentration dependent. Some material effects with E15 are possible that may not have been experienced with E10 in the past. …
When gasoline is combusted in an engine, the stoichiometric A/F [air-to-fuel] ratio (i.e., the ideal ratio for complete combustion of the fuel and air into carbon dioxide and water vapor) is approximately 14.7 times the mass of air to fuel (14.7:1). For gasoline, any mixture less than 14.7:1 is considered to be a rich mixture (excess fuel), and any mixture more than 14.7:1 is a lean mixture (excess air/oxygen) given ideal test fuel and complete combustion. The addition of oxygenates such as ethanol (with its hydroxyl group) to gasoline alters the stoichiometric A/F ratio and therefore affects combustion. Engines/vehicles equipped with feedback controls can adjust the A/F ratio to stoichiometric conditions—around 14.0:1 for E10 and 13.8:1 for E15 (the ratio is lower as ethanol contains oxygen so less air is needed). However, for gasoline engines that do not have the ability to react to the desired stoichiometric A/F ratio for a different fuel (e.g., gasoline-ethanol blends), combustion is enleaned. E10 would result in approximately 4% enleanment when compared with gasoline, E15 would result in approximately 6% enleanment. This means E10 and E15 have 4% and 6% more oxygen, respectively, than the stoichiometric A/F ratio.
Fuel metering components are sized to deliver an A/F mixture that optimizes emission performance, power output, fuel economy, and durability. If an engine is allowed to operate at a mixture that is leaner than it is designed for (too much oxygen for a given amount of fuel), it may run at a somewhat higher combustion temperature. This in turn can lead to changes in exhaust temperatures which may affect catalyst durability, and, especially in the case of nonroad products, engine durability, causing an increase in emissions. In addition, combustion instability from lean mixtures, which can cause misfire, can then lead to accelerated catalyst performance degradation or damage.
… Ethanol dissolves in water when the two are mixed together. Unlike ethanol, gasoline is considered to be a non-polar and hydrophobic hydrocarbon molecule which means that it does not attract water in the same way as ethanol does. …
Ethanol is soluble in gasoline though to a lesser extent than it is in water. If a gasoline-ethanol blend is saturated with water, a reduction in ambient temperature may cause the ethanol and gasoline to separate into two layers. However, the presence of ethanol in gasoline will allow more water to be absorbed by the gasoline-ethanol blend before phase separation occurs. Some level of water carried through the fuel distribution system is generally acceptable and likely unavoidable given fuel exposure to moisture and humidity in normal dispensing and storage, either at the fuel station or on-board. However, excessive water in the fuel can lead to phase separation that can in turn cause stalling or permanent damage to most internal combustion engines. …
The hydroxyl group of ethanol also reacts with natural rubber materials. Certain elastomers exposed to alcohols may swell or soften and lose strength.62 Some plastics and fiberglass can become brittle leading to cracks and leaks.63 Table VI.B.2.-1 shows the effects of gasoline and ethanol on some of the many elastomers that have been developed.64 As noted from this table, polyfluorocarbons have been shown to be compatible with ethanol and ethanol blends. As discussed below in VI.C.2., the physical interaction of ethanol with certain elastomers also leads to increased permeation of ethanol and hydrocarbons through the walls of components made from such materials. …
Ethanol can also contribute to corrosion due to galvanic coupling or the absorption of water. Alcohols are better electrical conductors compared to gasoline so gasoline-ethanol blends could promote galvanic corrosion and galvanic-couple effects between electrochemically dissimilar alloys in the fuel system. Ethanol can also contribute to corrosion due to galvanic coupling or the absorption of water. Alcohols are better electrical conductors compared to gasoline so gasoline-ethanol blends could promote galvanic corrosion and galvanic-couple effects between electrochemically dissimilar alloys in the fuel system.65, 66 The National Ethanol Vehicle Coalition and the Petroleum Equipment Institute have demonstrated that aluminum is sensitive to corrosion from ethanol. In addition, water in gasoline-ethanol blends can cause corrosion of metallic materials (such as brass, cast iron, copper, and various types of steel) as the water/ethanol layer becomes acidic if phase separation occurs.67 The presence of water in the fuel distribution system also provides a suitable habitat for the growth of microbes which excrete acids that in turn are also detrimental to metallic fuel storage systems.68 Contaminants in water may also impact additives used in finished fuel that are designed to maintain the integrity of the finished fuel.69, 70, 71 Because of these corrosion concerns, actions are usually taken to accommodate ethanol in ethanol production, storage, and distribution systems, as well as in vehicles and engines. Such actions include the careful selection of materials and/or the use of appropriate ethanol compatible coatings on susceptible metal parts that come into contact with the ethanol fuel, as well as the use of corrosion and biocide additives. …
Ethanol can also act as a solvent for various materials. As such, ethanol has historically been known to remove or dissolve components built up in the fuel storage, handling and delivery systems (e.g. fuel tank, fuel lines, injectors, etc.). Once these components are loosened or partially dissolved, they are transported through the fuel system, and if excessive, may cause fuel filter, injector plugging or other component problems, all of which can lead to poor operability and degraded emission performance. Gasoline-ethanol blends may also pick up contaminants from storage tanks and delivery trucks. The amount of build-up is related to a combination of fuel composition properties and fuel usage patterns (i.e., regular fuel usage versus infrequent, etc.). Non-automotive equipment may experience fuel filter plugging related more to extended storage periods where gasoline can deteriorate and lead to more deposits requiring a plugged fuel filter replacement. …
Fuel volatility is a measure of a fuel’s vapor pressure or its tendency to vaporize. When ethanol is blended into gasoline, the hydrogen bonding between the ethanol molecules is weakened significantly and the alcohol “depolarizes.” This results in higher Reid Vapor Pressures (RVP) for gasoline containing ethanol. Ethanol’s effects on RVP have been well documented,72, 73, 74 where low level ethanol blends, in general, will increase gasoline RVP by up to one pound per square inch with the maximum effect occurring at approximately 3 vol% ethanol concentration. The RVP of the base fuel will also influence just how much increase will occur by the addition of ethanol.75 Increases in RVP result in increased vapor generation and increased evaporative emissions.
Additionally, while ethanol at certain levels may raise the general volatility of the gasoline-ethanol blend, because of ethanol’s single boiling point and high latent heat of vaporization, the ethanol fraction may cause combustion difficulties and increased emissions during the start of some spark-ignition engines when the engines are cold, particularly at colder start temperatures. Further, once the engine is hot, the single boiling point can also cause difficulty in operating and starting a hot engine as observed in older motor vehicles when ethanol first became available. The ethanol would reach its boiling point in the fuel system and result in what is known as “vapor lock.” …
Ethanol impacts motor vehicles in three primary ways. First, as discussed in Section VI.B.1 above, ethanol enleans the A/F ratio which leads to increased exhaust gas temperatures and therefore potentially incremental deterioration of emission control hardware and performance over time. Second, over time, enleanment caused by ethanol can ultimately lead to catalyst failure. Third, ethanol can cause material compatibility issues which may lead to other component failure. Ultimately, all of these impacts may lead to exhaust and/or evaporative emission increases. …
MY2000 and older light-duty motor vehicles have much less sophisticated emissions control systems compared to today’s motor vehicles and, as described below, may experience conditions that lead to both immediate emission increases and increases over time if operated on E15. Vehicles produced prior to the mid-1980s were equipped primarily with carbureted engines. The A/F ratio of the carburetor is preset at the factory based on the expected operating conditions of the engine such as ambient temperature, atmospheric pressure, speed, and load. As a result, carburetors have “open loop” fuel control which means that the air and fuel are provided at a specified, predetermined ratio that is not automatically adjusted during motor vehicle operation. As fuel composition can vary, an engine with a carburetor and open loop fuel control would never know whether it achieved the desired A/F ratio. Since the motor vehicles at this time operated “open loop” all of the time with no ability to react for changes in the A/F ratio, the addition of ethanol to the fuel tended to make the A/F ratio leaner—closer to stoichiometry, which had the immediate effect of reducing HC [hydrocarbon] and CO [carbon monoxide] emissions, but increasing NOX [nitrogen oxides] emissions. However, some of these older open loop systems already operate at the lean edge of combustion on current commercial fuels so an increase in ethanol may cause them to begin to misfire resulting in HC and CO increases. …
While most motor vehicles are operating today on E10, motor vehicles operated on E15 will likely run even leaner than those operated on E10 depending on the motor vehicle technology and operating conditions. Enleaned combustion leads to an increase in the temperature of the exhaust gases. This increase in exhaust gas temperatures has the potential to raise the temperatures of various exhaust system components (e.g., exhaust valves, exhaust manifolds, catalysts, and oxygen sensors) beyond their design limits. However, based on past experience, the most sensitive component is likely the catalyst, particularly in older motor vehicles with early catalyst technology. Catalyst durability is highly dependent on temperature, time, and fuel gas composition. Catalyst temperatures must be controlled and catalyst deterioration minimized during all motor vehicle operation modes for the catalyst to maintain high conversion efficiency over the motor vehicle’s life. This is particularly important during high load operation of a motor vehicle where high exhaust gas temperatures are encountered and the risk for catalyst deterioration is highest. Catalysts that exceed temperature thresholds will deteriorate at rates higher than expected, compromising the motor vehicle’s ability to meet the required emission standards over its full useful life. Extended catalyst exposure to higher exhaust temperatures can accelerate catalyst thermal deactivation mechanisms (e.g., sintering of active precious metal sites, sintering of oxygen storage materials, and migration of active materials into inert support materials). While this damage can occur at a highly accelerated rate with a sudden change in temperature (e.g., with a misfire allowing raw fuel to reach the catalyst), it is more likely to occur over time from elevated exhaust temperatures as may be experienced with frequent or even occasional exposure to E15. This deterioration may adversely affect a motor vehicle’s ability to control emissions, particularly after significant mileage accumulation. …
The fuel trim has a limited range of adjustment in which it can continue to update the A/F ratio and maintain the fuel system at or near stoichiometry. For MY2000 and older light-duty motor vehicles, the fuel trim range is generally more limited than the range for newer light-duty motor vehicles, and MY2000 and older motor vehicles may use their full range of fuel trim adjustment to account for normal component deterioration. Injectors, sensors and changes to fuel pressure may shift with time and aging to use all of the fuel trim’s range of adjustment. The additional oxygenate in E15 may actually shift the A/F ratio more than the earlier introduction of E10 if the engine’s A/F ratio feedback cannot compensate because it has reached its adjustment limit. In short, MY2000 and older motor vehicles are at risk of having insufficient thermal margins to accommodate ethanol blends up to E15 due to the limits of their fuel trim range. …
Test data to confirm or refute concerns over the use of E15 in older vehicles is very limited in scope and content. The available data do not prove or disprove the concerns, although there are several studies that support the potential for long term durability issues consistent with engineering theory. Three studies—the CRC [Coordinating Research Council] Screening Study, DOE [U.S. Department of Energy] Pilot Study, and the Orbital Study—discussed in section IV.A. highlight in particular the concern with MY2000 and older motor vehicles. The CRC Screening Study (E-87-1) was a test program developed to look at the effects of mid-level ethanol blends on U.S. vehicles.76 This screening study was the first phase of a two-phase study evaluating the effects of mid-level ethanol blends on emission control systems. The purpose of this first phase of the study was to identify vehicles which used learned fuel trims to correct open loop air-fuel rations. Under the test program a fleet of 25 test vehicles was identified and acquired with six of those vehicles being MY2000 [model year 2000] and older. The study collected vehicle speed, oxygen sensor air-fuel-ratio, and catalyst temperature data for four fuels (E0, E10, E15, and E20). The results of the three ethanol blended fuels compared to E0 showed that four of the six MY2000 and older vehicles tested failed to apply long-term fuel trim to open loop operation in order to compensate for increasing ethanol levels. And that these same four vehicles exhibited increased catalyst temperatures when operated on E20 as compared to E0. While the subsequent DOE Catalyst Study concluded that this learned fuel trim was not important for MY2007 and newer motor vehicles because they are durable (and therefore can handle E15) as discussed in section IV.A, there was no such follow on program for MY2000 and older motor vehicles so the durability of these vehicles on E15 is unknown.
Another study suggests that many MY2000 and older motor vehicles may also have emission exceedances if operated on E15. In 2003, the Orbital Engine Company issued a report on the findings of vehicle testing it completed to assess the impact of E20 on the Australian passenger vehicle fleet. While the Australian vehicles in this study were not representative of U.S. vehicles of the same model years, they are similar to MY2000 and older U.S. motor vehicles with respect to technology and emission standards. The testing program covered vehicle performance and operability testing, vehicle durability testing, and component material compatibility testing, on nine different vehicle makes or models, five vehicles from MY2001 and four vehicles from MY1985 to MY1993. Testing results showed increases in exhaust gas temperature in five of the nine vehicles tested with three showing increases in catalyst temperature. Enleanment was found to occur in six of the nine vehicles tested, with three having closed loop control—the old vehicles without closed loop control all displayed enleanment. In general, the increase in exhaust gas temperature was found to follow those vehicles with enleanment. Furthermore, one vehicle in the study experienced catalyst degradation sufficient to make the tested vehicle no longer meet its applicable Australian emission standards. …
Moving from E10 to E15 reflects a 50% increase in the volume of ethanol present in gasoline. Therefore, since the impacts of ethanol on materials are a function of concentration, E15 has the potential to have more significant impacts than E10 if used in motor vehicles not equipped for it. For MY2000 and older motor vehicles, E15 use may result in degradation of metallic and non-metallic components in the fuel and evaporative emissions control systems that can lead to highly elevated hydrocarbon emissions from both vapor and liquid leaks. Potential problems such as fuel pump corrosion or fuel hose swelling would likely be worse with E15 than historically with E10, especially if motor vehicles will be operating exclusively on it. Since ethanol historically comprised a much smaller portion of the fuel supply (see section VI.A.), in-use experience with E10 was often discontinuous or temporary, while material effects are time and exposure dependent. Thus, problems may surface with E15 that have not surfaced historically in-use. Additionally, leak detection diagnostics did not appear until MY1996 and enhanced evaporative test procedures were not fully implemented until the late 1990s.
In addition to potential vapor or liquid leaks, ethanol is also known to facilitate permeation through the materials in the fuel system. Studies have shown this to be a significant source of increased emissions with gasoline-ethanol blends, especially on older motor vehicles. Following additional testing requirements as part of the Tier 2 motor vehicle emission standards beginning in 2004, materials in newer motor vehicles have been able to mitigate the permeation effects of ethanol in the fuel, as discussed in the waiver decision document. However, as shown in the Figure VI.C.2-1 below, permeation emissions from older model year vehicles may be very high with ethanol blends.78 …
Based on our review of the literature and industry comments on the E15 waiver request, we believe that MY2000 and older light-duty motor vehicles have the potential for increased material degradation with E15 use. In addition, some MY2000 and older light-duty motor vehicles may have been designed for only limited exposure to E10 while the oldest vehicles on the road pre-date ethanol blends in the marketplace all together. This potential for material degradation may make the emissions control and fuel systems more susceptible to corrosion and chemical reactions from E15 when compared to the E0 certification fuels for these motor vehicles and may ultimately increase vehicle emissions, especially for MY2000 and older motor vehicles. …
In 1978, EPA [Environmental Protection Agency] issued HC and CO emission standards for highway motorcycles. There were no standards for NOX emissions. To meet these standards, the vast majority of motorcycle models used the approach of adjusting the A/F ratio rather than using any unique emission control technologies, such as catalytic converters, EFI [electronic fuel injection], and air injection. For performance and durability purposes, most motorcycles operated with an A/F ratio that was considerably rich of stoichiometry. The strategy used to control HC and CO emissions was to lean the A/F ratio from these rich values traditionally used for maximum performance. As with light-duty motor vehicles, this strategy resulted in lower HC and CO emissions, but caused an increase in NOX emissions. Since there were no NOX emission standards, the increased NOX emissions were allowed. This strategy also resulted in complaints about vehicle performance and driveability. As a result, a common practice was for motorcycle owners to change the A/F ratio on their own to a richer setting that improved the performance concerns, but also possibly resulted in an exceedance of the emissions standards. These emission standards were unchanged until 2006 when more stringent standards for HC and new standards for NOX were introduced for MY2008.
Off-highway motorcycles were unregulated until 2006. Beginning with MY2006, off-highway motorcycles were required to meet emission standards for HC, CO, and NOX emissions. In general, the overall majority of motorcycles designed from 1978 through 2006 either used an A/F ratio leaner than desired for maximum performance and durability to comply with highway motorcycle emission standards or ran rich, in the case of off-highway motorcycles, to help cool the engine and protect it from overheating and failure. The practice of motorcycle owners adjusting the A/F ratio to a richer setting to improve performance and driveability was even more prevalent in the off-highway motorcycle sector, especially for competition motorcycles where performance is an important attribute.
As E10 fuel has become more prevalent in the marketplace, many owners of off-highway and older highway motorcycles have chosen to either operate their motorcycles on E0 fuel whenever it is available or have modified their A/F ratio to a richer setting. In fact, the internet is full of blogs of motorcycle owners discussing concerns with operation on E10 fuel and ways to avoid these concerns, including how to change the A/F ratio setting. It is a violation of the CAA [Clean Air Act] to modify a certified motorcycle from its certified configuration. Changing the A/F ratio from the certified setting would be considered tampering, yet it is clear it is practiced in-use. …
In either case, the use of E15 fuel could cause engine damage and emission increases for highway motorcycles built prior to 2008 and for all off-highway motorcycles, regardless of age. For highway motorcycles built after MY2008 there is the possibility that some models may be able to successfully accommodate the use E15 fuel. For MY2008 and beyond, there are a number of models that use EFI and catalytic converters. The systems are similar to automotive closed-loop catalyst systems. However, one of the advantages to modern Tier 2 light-duty emission control systems is that they use very sophisticated fuel trim learning systems that allow a very precise “learning and adapting” of changes to the A/F ratio mixture. While many of today’s motorcycle models use closed-loop systems, they do not have the advanced fuel trim control of today’s motor vehicles, meaning they would most likely not be able to accommodate the enleanment of the A/F ratio in the same manner as today’s motor vehicles. Their closed-loop technology is more similar to that of MY2000 and older motor vehicles than to current motor vehicles.
In light of the above, while there is no actual E15 test data on motorcycles, EPA believes that any operation of highway or off-highway motorcycles on fuel containing E15 could result in engine damage and emission increases for highway and off-highway motorcycles. It also could have the unintentional result of encouraging motorcycle owners to violate the CAA by tampering with the vehicles A/F ratio setting to improve performance, driveability, and protect the engine from damage, while at the same time significantly increasing hydrocarbon and CO emissions. Therefore, we are proposing to prohibit the use of E15 in all motorcycles (highway and off-highway) but seek comment on our assessment. …
The nonroad product market is extremely diverse which makes it difficult to determine what the impacts of E15 use might be. However, similar to older motor vehicles, it appears that nonroad products may experience emissions increases related to enleanment and material compatibility issues if operated on E15. This is based in large part on the history of the design of nonroad products operating on E10 in relation to the age of those products in the field, and the implications of extrapolating this in-use operating experience with E10 to E15. …
… Leaner operation increases cylinder and exhaust temperatures that can lead to overheating of the engine. In some cases this can lead to expansion of the engine block and pistons and result in a seized engine. Increased combustion temperature can also result in expansion and contraction of the engine block and head metals which leads to loosening of the head bolts. With looser bolts, the gap between the engine block and the head will open and the head gasket can get damaged, which in turn damages other engine components (e.g., intake and exhaust valves, manifolds, etc.) which can result in increased emissions and potential engine failure. …
The likelihood that nonroad products may experience such issues with E15 is difficult to quantify. However, limited testing by DOE100 showed some engine failures with E15, and this is not entirely unexpected since nonroad products are particularly prone to enleanment for several reasons. First, nonroad products remain primarily carbureted and/or have open loop fuel control.101 This means they do not have the ability to self-adjust the A/F ratio in-use for the presence of ethanol in the fuel. …
There have been several attempts to study the material compatibility of E15 use in nonroad engines, vehicles and equipment. However, the broad range of equipment and designs over time make it extremely difficult to do any definitive study on the nonroad sector that would address the entire fleet. A literature and information search prepared by the University of Minnesota Center for Diesel Research outlines a number of the concerns with ethanol that could be experienced with E15.
—Corrosion of steel is accelerated by the presence of alcohols in the fuel, both because the ethanol itself is considered to be more corrosive but also because it is a solvent that removes oils and coatings from the surface that might protect against corrosion. In addition, ethanol attracts and mixes with water which is also corrosive and tends to create a slightly acidic solution, especially over time.
—Elastomers exposed to higher gasoline-ethanol blends over time can increase in weight gain, swell, soften and increase in hardness when dried and as a result lose tensile strength, causing fuel pumps and fuel lines to fail. For fuel hoses, swelling and softening creates a risk of failure of the joints. The swelling and softening of O-rings, seals and gaskets causes a risk of damage or incorrect fit of the seal during assembly of joints leading to fuel leakage.
—Seals and gaskets on equipment that have not been previously exposed to higher alcohol fuels could deteriorate and break down creating leakage.
—Fiberglass-reinforced plastic fuel tanks, such as those on marine engines and motorcycles, may also experience problems depending on the type of resin and how much the ethanol will contribute to the corrosion of it.
—Materials such as lead/tin-coated steel used in fuel tanks and aluminum fuel system components require corrosion inhibitors due to the presence of the higher alcohol in E15.
In addition, four studies have been reported which tested the effect of a number of ethanol containing fuels (E10, E20) on materials compatibility of polymers, metal, and elastomers in motor vehicles and nonroad engines. While none of these studies reported on E15, a number of reports gave conditions seen on E10 and E20 and so results for E15 can be interpolated. The results of one technical assessment, published in 2002,108 of E10 and E20 on two 2-stroke engines indicated materials compatibility concerns for E20 for both engine types, including effects on some polymeric materials that were deemed unacceptable and E20 tarnishing and corroding brass and aluminum parts. Similarly, three other studies conducted by the University of Minnesota published in 2008 on metal, plastic, and elastomer materials, respectively,109, 110, 111 used in highway vehicles and nonroad products found a variety of impacts with E20 relative to E10 or E0, including clear incompatibility with some materials. The existence of such materials on equipment in the in-use fleet could lead to increased emissions, fuel leaks, and potentially engine failure from longer term use of E15. The degree to which such incompatible materials exist in the in-use fleet is unknown, but it is clear that they do exist based on in-use experience with E10.112, 113
We are not aware of any testing that has been done that might help quantify the potential impact on emissions from the types of engine problems that would result from material compatibility problems. However on July 14, 2010 the United States Consumer Protection Safety Commission (CPSC) and Health Canada (HC) announced a recall of Toro snowblowers stating that “Exposure to ethanol in gasoline can cause the carburetor needle to become corroded. A corroded needle can stick in the open position and allow fuel to leak from the carburetor.”114 Clearly fuel leaks would result in a considerable increase in evaporative emissions, and material issues with carburetors, fuel pumps, and other engine components could clearly lead to significant changes in exhaust emissions, if not engine survivability.
[850] Proposed rule: “Regulation to Mitigate the Misfueling of Vehicles and Engines with Gasoline Containing Greater Than Ten Volume Percent Ethanol and Modifications to the Reformulated and Conventional Gasoline Programs.” Federal Register, November 4, 2010. <www.govinfo.gov>
Pages 68067–68071:
How a vehicle or engine adapts to combust fuels with different ethanol concentrations depends on the vehicle hardware and software control strategies. Vehicles and engines operating on E15 [a blend of 15 percent ethanol and 85 percent gasoline by volume] may have hotter exhaust temperatures than the same vehicles and engines running on E10 [a blend of 10 percent ethanol and 90 percent gasoline by volume]. …
… Furthermore, material compatibility with ethanol is time, condition (e.g., temperature, pressure), and concentration dependent, such that problems may occur with E15 that did not show up with E10.
Moving from E10 to E15 reflects a 50% increase in the volume of ethanol present in gasoline. Therefore, since the impacts of ethanol on materials are a function of concentration, E15 has the potential to have more significant impacts than E10 if used in motor vehicles not equipped for it.
[851] Article: “Ethanol Blend Wall: Are We There Yet?” U.S. Energy Information Administration, November 23, 2011. <www.eia.gov>
“Ethanol blending in the United States has recently grown to the point where nearly every gallon of gasoline contains 10-percent ethanol by volume (E10), the legal maximum for general use in conventional gasoline-powered vehicles under the gasohol waiver issued in 1979 by the U.S. Environmental Protection Agency (EPA).”
[852] Proposed rule: “Regulation to Mitigate the Misfueling of Vehicles and Engines with Gasoline Containing Greater Than Ten Volume Percent Ethanol and Modifications to the Reformulated and Conventional Gasoline Programs.” Federal Register, November 4, 2010. <www.govinfo.gov>
Pages 68047–68048:
CAA [Clean Air Act] section 211(f)(1) makes it unlawful for any manufacturer of any fuel or fuel additive to first introduce into commerce, or to increase the concentration in use of, any fuel or fuel additive for use in motor vehicles manufactured after model year 1974 unless it is substantially similar to any fuel or fuel additive utilized in the certification of any model year 1975, or subsequent model year, vehicle or engine under section 206 of the Act.
Section 211(f)(4) of the Act provides that upon application by any fuel or fuel additive manufacturer, the Administrator may waive the prohibition of section 211(f)(1). A waiver may be granted if the Administrator determines that the applicant has established that the fuel or fuel additive, and the emission products of such fuel or fuel additive, will not cause or contribute to a failure of any emission control device or system (over the useful life of the motor vehicle, motor vehicle engine, nonroad engine or nonroad vehicle in which such device or system is used) to achieve compliance with the emission standards to which the vehicle or engine has been certified. In other words, the Administrator may grant a waiver for an otherwise prohibited fuel or fuel additive if the applicant can demonstrate that the fuel or fuel additive will not cause or contribute to engines, vehicles or equipment failing to meet their emissions standards over their useful life.
EPA [U.S. Environmental Protection Agency] previously issued a “substantially similar” interpretive rule for unleaded gasoline which allows oxygen content up to 2.7% by weight for certain ethers and alcohols.8 E10 [a blend of 10 percent ethanol and 90 percent gasoline by volume] contains approximately 3.5% oxygen by weight, which means E10 is not “substantially similar” to certification fuel under the current interpretation. As explained at 44 FR 20777 (April 6, 1979), E10 received a waiver of the substantially similar prohibition by operation of law since EPA did not grant or deny a waiver request for a fuel containing 90% unleaded gasoline and 10% ethyl alcohol within 180 days of receiving that request. This waiver by operation of law was based on the then current terms of CAA section 211(f)(4), which has subsequently been amended.
Section 211(c)(1) of the Act allows the Administrator, by regulation, to “control or prohibit the manufacture, introduction into commerce, offering for sale, or sale of any fuel or fuel additive for use in a motor vehicle, motor vehicle engine, or nonroad engine or nonroad vehicle (A) if, in the judgment of the Administrator, any fuel or fuel additive or any emission product of such fuel or fuel additive causes, or contributes, to air pollution or water pollution (including any degradation in the quality of groundwater) that may reasonably be anticipated to endanger the public health or welfare, or (B) if emission products of such fuel or fuel additive will impair to a significant degree the performance of any emission control device or system which is in general use, or which the Administrator finds has been developed to a point where in a reasonable time it would be in general use were such regulation to be promulgated.”
[853] Article: “Ethanol Blend Wall: Are We There Yet?” U.S. Energy Information Administration, November 23, 2011. <www.eia.gov>
“Ethanol blending in the United States has recently grown to the point where nearly every gallon of gasoline contains 10-percent ethanol by volume (E10), the legal maximum for general use in conventional gasoline-powered vehicles under the gasohol waiver issued in 1979 by the U.S. Environmental Protection Agency (EPA).”
[854] Report: “The Impact of Ethanol Use on Food Prices and Greenhouse-Gas Emissions.” Congressional Budget Office, April 2009. <www.cbo.gov>
Page 3:
The Energy Policy Act of 2005 laid out a schedule of mandates through 2012 for increasing the amount of biofuels used in the United States.11 The Energy Independence and Security Act of 2007 [EISA] expanded the mandates and extended them through 2022 (see Figure 1). Under those laws, federal mandates requiring the use of biofuels are intended to encourage the domestic production of ethanol and other biofuels; the mandates also seek to generate increasingly large reductions in greenhouse-gas emissions from the transportation sector.12
Specifically, those mandates require usage of biofuels in the United States to be at least 20.5 billion gallons annually by 2015, or more than double the country’s usage in 2008. Of that total, not more than 15 billion gallons may be refined from cornstarch. By 2022, the total amount of biofuels used (including conventional and cellulosic ethanol as well as biodiesel and other advanced biofuels) must be at least 36 billion gallons. …
12 EISA directed the Environmental Protection Agency to issue rules that ensured that biofuels would be sold or introduced into commerce in the United States, but it also gave the agency discretion to relax the standards if they were shown to result in severe economic or environmental harm to any state or region.
[855] Article: “Ethanol Blend Wall: Are We There Yet?” U.S. Energy Information Administration, November 23, 2011. <www.eia.gov>
“Ethanol blending in the United States has recently grown to the point where nearly every gallon of gasoline contains 10-percent ethanol by volume (E10), the legal maximum for general use in conventional gasoline-powered vehicles under the gasohol waiver issued in 1979 by the U.S. Environmental Protection Agency (EPA).”
[856] Report: “Biofuels Issues and Trends.” U.S. Energy Information Administration, October, 2012. <www.eia.gov>
Page 25: “The most straightforward way to use ethanol is to blend it with gasoline. But gasoline demand growth has slowed considerably as a result of several factors including higher gasoline prices, slower economic growth, and greater vehicle efficiency.”
[857] Dataset: “US Business Cycle Expansions and Contractions.” National Bureau of Economic Research. Last updated July 19, 2021. <www.nber.org>
“Contractions (recessions) start at the peak of a business cycle and end at the trough. … Peak Month [=] December … Peak Year [=] 2007 … Peak Quarter [=] 4 … Trough Month [=] June … Trough Year [=] 2009 … Trough Quarter [=] 2”
[858] Report: “Biofuels Issues and Trends.” U.S. Energy Information Administration, October, 2012. <www.eia.gov>
Page 5: “Ethanol consumption in 2011 reached 12.9 billion gallons…. Over 99 percent of ethanol is consumed as E10, a blend of 10 percent ethanol and 90 percent gasoline by volume.”
[859] Webpage: “Almost All U.S. Gasoline Is Blended with 10% Ethanol.” U.S. Energy Information Administration. Last updated May 4, 2016. <www.eia.gov>
“Blends of petroleum-based gasoline with 10% ethanol, commonly referred to as E10, account for more than 95% of the fuel consumed in motor vehicles with gasoline engines. … [N]early all fuel ethanol is blended with a BOB [blendstocks for oxygenate blending] to produce E10.”
[860] Report: “Biofuels Issues and Trends.” U.S. Energy Information Administration, October, 2012. <www.eia.gov>
Page 25: “The saturation of the United States’ gasoline supply with ethanol sold as E10 [a blend of 10 percent ethanol and 90 percent gasoline by volume], termed the blend wall, motivated the ethanol industry to seek approval for a mid-level ethanol blend greater than 10 percent.”
[861] Article: “Ethanol Blend Wall: Are We There Yet?” U.S. Energy Information Administration, November 23, 2011. <www.eia.gov>
The term “blend wall” describes the situation in the ethanol market as it nears the saturation point (at the 10 percent content level) due to limited ability to distribute or use additional ethanol, except as E85, a fuel blend with 70 percent to 85 percent ethanol content presently used in very limited volumes that may be sold only for use in flex-fuel vehicles that have been specifically designed to accommodate its use. …
The rapid increase in U.S. ethanol exports in 2010 and 2011, combined with very low levels of ethanol imports, is additional evidence that the blend wall has been reached in most areas. Fuel ethanol exports rose averaged almost 800 thousand barrels per month in 2010, with a strong trend upward in the latter half of the year. This trend continued in the first months of 2011 as export volumes climbed from just under 1.5 million barrels of total ethanol exports for both January and February to more than 3 million barrels of exports in July. This trend, in conjunction with few imports, could be a sign that domestic markets for E10 [a blend of 10 percent ethanol and 90 percent gasoline by volume] are currently saturated, and until E15 [a blend of 15 percent ethanol and 85 percent gasoline by volume] and/or E85 is more available and widely adopted, additional ethanol volumes beyond the 10-percent share of gasoline are being sold to foreign markets. …
While nationally we are seeing total ethanol use in all gasoline at about 10 percent, available data suggest that the blend wall has not been reached in every region. Some smaller regions appear to still not be saturated. The blend ratio in PADD [Petroleum Administration for Defense Districts] 4 (the Rocky Mountains), for example, was still below 8 percent as of July 2011 (according to some EIA [U.S. Energy Information Administration] estimates). In addition, volumes of higher-level blends such as E85, while modest, would tend to push up the ratio, masking gasoline volumes that are not blended with ethanol. Furthermore, the data are inexact: published ethanol consumption includes uncertainties due to estimates for missing information and inherent data errors. … Regardless, we appear to be near enough to the 10-percent ethanol blend wall to merit closer inspection of how the ethanol market will respond in the face of this challenge.
[862] Report: “Biofuels Issues and Trends.” U.S. Energy Information Administration, October, 2012. <www.eia.gov>
Page 25:
The saturation of the United States’ gasoline supply with ethanol sold as E10 [a blend of 10 percent ethanol and 90 percent gasoline by volume], termed the blend wall, motivated the ethanol industry to seek approval for a mid-level ethanol blend greater than 10 percent. Without a mid-level blend, incremental domestic ethanol supply would have no market outside of exports or domestic E85 [a mixture of 70–85% ethanol and 15–30% gasoline] sales. E85 is currently sold in very limited volumes because relatively few vehicles are capable of using the fuel and very few service stations dispense E85.61 In March 2009, Growth Energy and a number of ethanol producers petitioned EPA [U.S. Environmental Protection Agency] to approve the use of up to 15 percent ethanol by volume in finished gasoline (E15).
[863] Article: “Ethanol Blend Wall: Are We There Yet?” U.S. Energy Information Administration, November 23, 2011. <www.eia.gov>
“Recognition of the looming blend wall motivated the March 2009 waiver filing by Growth Energy and 54 ethanol producers seeking approval for the use of ethanol blends above E10 [a blend of 10 percent ethanol and 90 percent gasoline by volume] in conventional gasoline vehicles.”
[864] Report: “Biofuels Issues and Trends.” U.S. Energy Information Administration, October, 2012. <www.eia.gov>
Pages 25–26:
In October 2010, EPA [U.S. Environmental Protection Agency] approved the use of E15 [a blend of 15 percent ethanol and 85 percent gasoline by volume] in vehicles of model year 2007 and later after conducting vehicle tests in conjunction with the Department of Energy. In January 2011, EPA approved the use of E15 in light-duty vehicles beginning with model year 2001. … E10 [a blend of 10 percent ethanol and 90 percent gasoline by volume] will continue to be the limit for light vehicles built prior to model year 2001, all gasoline-powered heavy-duty vehicles, and all nonroad equipment.
[865] Article: “Ethanol Blend Wall: Are We There Yet?” U.S. Energy Information Administration, November 23, 2011. <www.eia.gov>
In October 2010, after conducting testing alongside the U.S. Department of Energy, the EPA [U.S. Environmental Protection Agency] approved (but did not require) the use of E15 [a blend of 15 percent ethanol and 85 percent gasoline by volume] in model year 2007 and newer light-duty motor vehicles. In January 2011, EPA approved (but did not require) the use of E15 in model year 2001 through 2006 light-duty vehicles.
[866] Article: “Gasoline with Higher Ethanol Content Getting Closer to U.S. Drivers’ Fuel Tanks.” U.S. Energy Information Administration, December 8, 2011. <www.eia.gov>
“E15 [a blend of 15 percent ethanol and 85 percent gasoline by volume] is not approved for older vehicles, boats, lawnmowers, chain saws or snowmobiles.”
[867] Proposed rule: “Regulation to Mitigate the Misfueling of Vehicles and Engines with Gasoline Containing Greater Than Ten Volume Percent Ethanol and Modifications to the Reformulated and Conventional Gasoline Programs.” Federal Register, November 4, 2010. <www.govinfo.gov>
Page 68082:
EPA [U.S. Environmental Protection Agency] believes that E15 [a blend of 15 percent ethanol and 85 percent gasoline by volume] can significantly impair the emissions control technology in MY2000 [model year] and older light-duty motor vehicles, heavy-duty gasoline engines and vehicles, highway and off-highway motorcycles, and all nonroad products. As discussed in Section VI above, ethanol enleans the A/F [air-to-fuel] ratio; this may lead to emissions products that can cause increased exhaust gas temperatures and, over time, incremental deterioration of emission control hardware and performance. Enleanment can also lead to catalyst failure. Additionally, ethanol can cause material compatibility issues which may lead to other component failure. Ultimately, all of these impacts would likely significantly impair the emissions control systems or devices and lead to exhaust and/or evaporative emission increases.
NOTE: For many of the technical details underlying these conclusions, click here.
[868] Report: “Biofuels Issues and Trends.” U.S. Energy Information Administration, October, 2012. <www.eia.gov>
Page 1: “While the U.S. Environmental Protection Agency (EPA) has approved use of a 15 percent ethanol blend (E15) for model year 2001 and newer cars and light trucks, concerns related to automobile warranties, potential liability for misfueling, and infrastructure costs are likely to limit E15 use to low volumes in the near term.”
[869] Article: “Gasoline with Higher Ethanol Content Getting Closer to U.S. Drivers’ Fuel Tanks.” U.S. Energy Information Administration, December 8, 2011. <www.eia.gov>
“To gain market share, E15 [a blend of 15 percent ethanol and 85 percent gasoline by volume] will also have to overcome laws and regulations in about three dozen states that restrict gasoline with more than 10% ethanol.”
[870] Report: “Biofuels Issues and Trends.” U.S. Energy Information Administration, October, 2012. <www.eia.gov>
Page 26: “Automakers, however, continue to oppose the use of E15 [a blend of 15 percent ethanol and 85 percent gasoline by volume] in any vehicle that is not capable of using high ethanol blends up to E85 [a mixture of 70–85% ethanol and 15–30% gasoline].”
[871] Press release: “Sensenbrenner Hears from Automakers: E15 Bad for Engines, American Consumers.” By Amanda Infield. Office of U.S. Congressman James Sensenbrenner, July 5, 2011.
Congressman Sensenbrenner publicly released the responses from US automakers regarding the consequences of E15 [a blend of 15 percent ethanol and 85 percent gasoline by volume] on vehicle engines, fuel economy and warranties. …
The complete letters are attached…. Below are highlights from each manufacturer:
Chrysler: “We are not confident that our vehicles will not be damaged from the use of E15…. The warranty information provided to our customers specifically notes that use of the blends beyond E10 [a blend of 10 percent ethanol and 90 percent gasoline by volume] will void the warranty.”
Ford: “Ford does not support the introduction of E15 into the marketplace for the legacy fleet. … Fuel not approved in the owner’s manual is considered misfueling and any damage resulting from misfueling is not covered by the warranty.”
Mercedes-Benz: “Any ethanol blend above E10, including E15, will harm emission control systems in Mercedes-Benz engines, leading to significant problems.”
Honda: “Vehicle engines were not designed or built to accommodate the higher concentrations of ethanol. … There appears to be the potential for engine failure.”
Mazda: “The record fails to demonstrate that motor vehicles would not be damaged and result in failures when run on E15.”
Toyota: “Toyota cannot recommend the use of fuel with greater than E10 for Toyota vehicles currently on the road…. Our policy remains that we will not provide warranty coverage for issues arising from the misuse of fuels that exceed specified limits.”
Nissan: “We are not at all confident that there will not be damage to MY [model year] 2001 and later vehicles that are fueled with E15. In our view the record fails to demonstrate that motor vehicles … would not be damaged and result in failures when run on E15.”
Volkswagen: “Volkswagen agrees that the EPA [U.S. Environmental Protection Agency] did not conduct an adequate test program when E15 was considered and then approved for use in conventional vehicles. Our current warranty will not cover problems stemming from the use of E15.”
Volvo: “The risks related to emissions are greater than the benefits in terms of CO2 when using low-blend E15 for variants that are designed to E10.”
BMW: “BMW Group engines and fuel supply systems can be damaged by misfueling with E15. … Damage appears in the form of very rapid corrosion of fuel pump parts, rapid formation of sludge in the oil pan, plugged filters, and other damage that is very costly to the vehicle owner.”
Hyundai: “The EPA tests failed to conclusively show that the vehicles will not be subject to damage or increased wear.”
Kia: “EPA testing failed to determine that vehicles will not be subject to damage or increased wear.”
[872] Article: “Gasoline with Higher Ethanol Content Getting Closer to U.S. Drivers’ Fuel Tanks.” U.S. Energy Information Administration, December 8, 2011. <www.eia.gov>
“EPA [U.S. Environmental Protection Agency] also had to approve a new pump label for E15 [a blend of 15 percent ethanol and 85 percent gasoline by volume], so consumers would not be confused over what gasoline they were buying.”
[873] Report: “Biofuels: Challenges to the Transportation, Sale, and Use of Intermediate Ethanol Blends.” U.S. Government Accountability Office, June 2011. <www.gao.gov>
Page 2 (of PDF):
Liability. Since EPA [U.S. Environmental Protection Agency] has only allowed E15 [a blend of 15 percent ethanol and 85 percent gasoline by volume] for use in model year 2001 and newer automobiles, many fuel retailers are concerned about potential liability issues if consumers misfuel their older automobiles or nonroad engines with E15. Among other things, EPA has issued a proposed rule on labeling to mitigate misfueling.
[874] Report: “Biofuels Issues and Trends.” U.S. Energy Information Administration, October, 2012. <www.eia.gov>
Page 13:
E10 [a blend of 10 percent ethanol and 90 percent gasoline by volume] can be sold at service stations from any existing pump. Widespread use of E15 [a blend of 15 percent ethanol and 85 percent gasoline by volume] or E85 [a mixture of 70–85% ethanol and 15–30% gasoline] will require that existing service station pumps, storage tanks, and other associated systems be upgraded or replaced. Retailers may dedicate pumps to E15 or E85, or they may install blender pumps for additional flexibility. Blender pumps draw from a tank of clear gasoline32 or E10 and from a tank of E85 and can dispense either fuel directly or combine the two fuels to make intermediate ethanol blends such as E15, E20, or E30. There are several hundred of these pumps in operation in the United States.33
[875] Article: “Gasoline with Higher Ethanol Content Getting Closer to U.S. Drivers’ Fuel Tanks.” U.S. Energy Information Administration, December 8, 2011. <www.eia.gov>
However, it is uncertain how quickly retailers will invest in the infrastructure to sell E15 [a blend of 15 percent ethanol and 85 percent gasoline by volume] even if these legal hurdles are overcome. Service station owners, from independent retailers to major chains, have to decide if they want to switch over to sell only E15 gasoline, continue to sell only E10 [a blend of 10 percent ethanol and 90 percent gasoline by volume] gasoline, or make both types available.
Selling both E10 and E15 would require a station to have separate pumps and storage tanks for each type of gasoline or to install more expensive blender pumps that could dispense both fuels. Where tank space is limited, station operators may not be able to offer the full range of fuel grades at each level of ethanol content. One problem is some stations have older pumps certified by Underwriters Laboratories (UL) to dispense only E10 gasoline. UL is concerned that gaskets and seals on older pumps could degrade and leak if they are exposed to gasoline with more than 10% ethanol.
[876] Report: “Biofuels: Challenges to the Transportation, Sale, and Use of Intermediate Ethanol Blends.” U.S. Government Accountability Office, June 2011. <www.gao.gov>
Page 2 (of PDF):
Compatibility. Federally sponsored research indicates that intermediate blends may degrade or damage some materials used in existing underground storage tank (UST) systems and dispensing equipment, potentially causing leaks. However, important gaps exist in current research efforts—none of the planned or ongoing studies on UST systems will test actual components and equipment, such as valves and tanks. While EPA [U.S. Environmental Protection Agency] officials have stated that additional research will be needed to more fully understand the effects of intermediate blends on UST systems, no such research is currently planned.
Cost. Due to concerns over compatibility, new storage and dispensing equipment may be needed to sell intermediate blends at retail outlets. The cost of installing a single-tank UST system compatible with intermediate blends is more than $100,000. In addition, the cost of installing a single compatible fuel dispenser is over $20,000.
[877] News release: “EPA Delivers on President Trump’s Promise to Allow Year-Round Sale of E15 Gasoline and Improve Transparency in Renewable Fuel Markets.” U.S. Environmental Protection Agency, May 31, 2019. <www.epa.gov>
Today, U.S. Environmental Protection Agency (EPA) Administrator Andrew Wheeler signed the final action that would remove the key regulatory barrier to using gasoline blended with up to 15% ethanol (E15) during the summer driving season and reform the renewable identification number (RIN) compliance system under the Renewable Fuel Standard (RFS) program to increase transparency and deter price manipulation. Taken together, these steps follow through on the Trump Administration’s commitment to responsible environmental protection that promotes energy independence, regulatory reform, and increasing the use of biofuels to give consumers more choices, while supporting American farmers. …
With today’s action, EPA is finalizing regulatory changes to apply the 1-psi Reid Vapor Pressure (RVP) waiver that currently applies to E10 [a blend of 10 percent ethanol and 90 percent gasoline by volume] during the summer months so that it applies to E15 as well. This removes a significant barrier to wider sales of E15 in the summer months, thus expanding the market for ethanol in transportation fuel.
[878] Final rule: “Modifications to Fuel Regulations To Provide Flexibility for E15; Modifications to RFS [Renewable Fuel Standard] RIN [renewable identification number] Market Regulations.” Federal Register, June 10, 2019. <www.govinfo.gov>
Page 26980:
The Environmental Protection Agency (EPA) is adopting a new statutory interpretation and making corresponding regulatory changes to allow gasoline blended with up to 15 percent ethanol to take advantage of the 1-pound per square inch (psi) Reid Vapor Pressure (RVP) waiver afforded under the Clean Air Act (CAA). In doing so, EPA is finalizing an interpretive rulemaking which defines gasoline blended with up to 15 percent ethanol as ‘‘substantially similar’’ to the fuel used to certify Tier 3 motor vehicles.
[879] Report: “Year Round Sale of E15.” By Kelsi Bracmort. Congressional Research Service, March 25, 2019. <fas.org>
Page 1 (of PDF):
Interest continues in the year-round sale of E15—generally described as an ethanol-gasoline fuel blend of 15% ethanol and 85% gasoline—among some Members of Congress. At present, E15 generally cannot be sold during summer months because it does not meet the Reid Vapor Pressure (RVP) requirements, which limit fuel volatility, under the Clean Air Act (CAA) for the summer ozone season (generally June 1–September 15). Recently, the U.S. Environmental Protection Agency (EPA) issued a proposed rule that would allow higher-volatility summertime E15 (in line with an existing exemption for 10% ethanol-gasoline fuel blends), among other provisions, thus allowing year-round E15 sales. …
The CAA authorizes the EPA Administrator to regulate fuels and fuel additives. Among other pollutants, the CAA regulates ground-level ozone (“smog”). One of the requirements to reduce the formation of smog is a limit on gasoline volatility (volatile compounds evaporate and contribute to smog formation). RVP is a common metric used to determine gasoline volatility; the lower the RVP, the less volatile the gasoline. RVP requirements (in §211(h) of the CAA)—which apply to the 48 contiguous states and the District of Columbia—generally prohibit the sale of gasoline with an RVP greater than 9 pounds per square inch (psi) during the high ozone season (i.e., the summer months).
[880] Article: “Ethanol Blend Wall: Are We There Yet?” U.S. Energy Information Administration, November 23, 2011. <www.eia.gov>
“… E85, a fuel blend with 70 percent to 85 percent ethanol content presently used in very limited volumes that may be sold only for use in flex-fuel vehicles that have been specifically designed to accommodate its use.”
NOTE: Observe the range discrepancy with the next footnote.
[881] Webpage: “Flexible Fuel Vehicles.” U.S. Department of Energy, Alternative Fuels Data Center. Last updated October 1, 2013. <www.afdc.energy.gov>
Flexible fuel vehicles (FFVs) have an internal combustion engine and are capable of operating on gasoline, E85 (a gasoline-ethanol blend containing 51% to 83% ethanol, depending on geography and season), or a mixture of the two. …
FFVs have one fueling system, which is made up of ethanol-compatible components and a powertrain controller calibrated to accommodate the higher oxygen content of E85. View the illustration … to learn about the special features of an FFV.
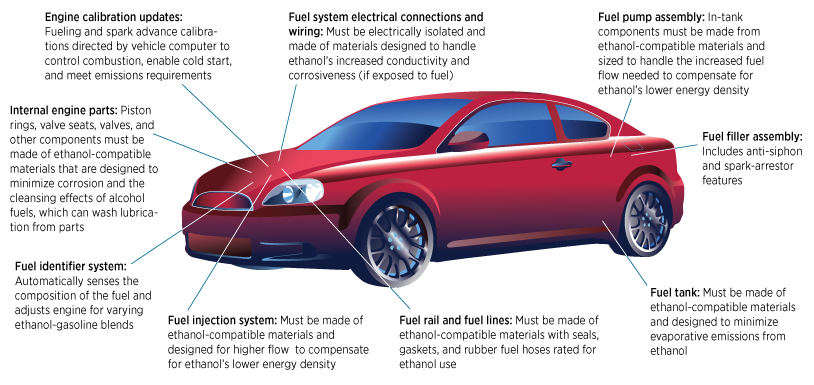
[882] Calculated with data from the report: “Biofuels Issues and Trends.” U.S. Energy Information Administration, October, 2012. <www.eia.gov>
Page 5: “Consumption of ethanol in gasoline blends with more than 51 percent ethanol by volume (E85) grew somewhat in 2011, but still accounted for less than one percent of total ethanol produced for motor fuels.”
Page 25:
E85 is currently sold in very limited volumes because relatively few vehicles are capable of using the fuel and very few service stations dispense E85.61 …
61 Of the fleet of 223 million light-duty vehicles in the United States in 2012, 11 million are capable of using E85. (Annual Energy Outlook 2012, Table 40). Out of approximately 160,000 gas stations in the United States, 2,544 sell E85. (DOE [U.S. Department of Energy] Alternative Fuels Data Center and EIA [U.S. Energy Information Administration] Today in Energy, April 30, 2012).
CALCULATIONS:
[883] Constructed with data from the report: “The Renewable Fuel Standard (RFS): An Overview.” Congressional Research Service. Updated August 10, 2022. <crsreports.congress.gov>
Pages 7–8: “Table 1. Renewable Fuel Standard Statute, EPA Final and Proposed Volume Amounts (in billions of gallons)”
NOTE: An Excel file containing the data is available upon request.
[884] Final rule: “Renewable Fuel Standard Program: Standards for 2014, 2015, and 2016 and Biomass-Based Diesel Volume for 2017 (Part II).” Federal Register, December 14, 2015. <www.gpo.gov>
Page 77422:
In the June 10, 2015 notice of proposed rulemaking (NPRM), we proposed standards based on an approach that sought to achieve the Congressional intent of increasing renewable fuel use over time in order to address climate change and increase energy security, while at the same time accounting for the real-world challenges that have slowed progress toward such goals.7 Those challenges have made the volume targets established by Congress for 2014, 2015, and 2016 beyond reach. In the NPRM we proposed to use waiver mechanisms that Congress provided to allow for the volume targets to be reduced if necessary. The proposed volume requirements were lower than the statutory targets but set at a level that we believed would spur growth in renewable fuel use, consistent with Congressional intent.
In this action, we are finalizing standards that make use of the statute’s waiver provisions. The final standards differ from the proposed standards based on new information, consideration of public comments, and corrected calculations. Details of these changes are provided below. …
Despite significant increases in renewable fuel use in the United States, real-world constraints, such as the slower than expected development of the cellulosic biofuel industry and constraints in the marketplace needed to supply certain biofuels to consumers, have made the timeline laid out by Congress impossible to achieve. These challenges remain, even as we recognize the success of the RFS [Renewable Fuel Standard] program over the past decade in boosting renewable use, and the recent signs of progress towards development of increasing volumes of advanced, low GHG [greenhouse gas]-emitting fuels, including cellulosic biofuels.
Page 77449:
While we do not believe that the total renewable fuel volume requirement for 2016 should be reduced below the proposed level, we continue to believe that challenges associated with growth in the supply of renewable fuels precludes attainment of the statutory volumes in 2016. Constraints including but not limited to the E10 [a blend of 10 percent ethanol and 90 percent gasoline by volume] blendwall, are real and can only be partially overcome by a responsive market in the near term.
[885] Report: “Biofuels Issues and Trends.” U.S. Energy Information Administration, October, 2012. <www.eia.gov>
Page 24:
Given uncertainty about whether the new RFS [Renewable Fuel Standard] volumes could be achieved, EISA2007 [Energy Independence and Security Act of 2007] included a general waiver based on technical, economic, or environmental feasibility. In addition, the cellulosic biofuels mandate includes an option for waivers to be issued in years when the projected amount of cellulosic fuel sales is judged by the EPA [U.S. Environmental Protection Agency] Administrator to be below the compliance level. When waivers are issued, the EPA Administrator also has discretionary authority to reduce the advanced and total schedules. For all fuel requirements, if there is a 20-percent deficit in more than two consecutive years or a 50-percent deficit in any one year, regulatory adjustment mechanisms are provided to lower the mandated levels from that point forward. This rule, which may be implemented by the EPA Administrator no sooner than 2016, would modify all applicable volumes (including the overall and advanced biofuel totals) for all subsequent years.
[886] Final rule: “Renewable Fuel Standard Program: Standards for 2017 and Biomass-Based Diesel Volume for 2018.” Federal Register, December 12, 2016. <www.gpo.gov>
Page 89747:
The standards we are setting are designed to achieve the Congressional intent of increasing renewable fuel use over time in order to reduce lifecycle GHG [greenhouse gas] emissions of transportation fuels and increase energy security, while at the same time accounting for the real world challenges that have slowed progress toward these goals. Those challenges have made the volume targets established by Congress for 2017 beyond reach for all fuel categories other than biomass-based diesel (BBD), for which the statute specifies only a minimum requirement of 1.0 billion gallons. In setting these standards for 2017, we have used the cellulosic waiver authority provision provided by Congress to establish volume requirements that will be lower than the statutory targets for fuels other than biomass-based diesel, but nevertheless represent significant growth from past years.
[887] Final rule: “Renewable Fuel Standard Program: Standards for 2018 and Biomass-Based Diesel Volume for 2019.” Federal Register, December 12, 2017. <www.gpo.gov>
Page 58487:
Real-world challenges, in particular the slower-than-expected development of the cellulosic biofuel industry, has slowed progress towards meeting Congressional goals for renewable fuels. Given the nested nature of the standards, the shortfall in cellulosic biofuels has made the volume targets established by Congress for 2018 for advanced biofuels and total renewable fuels beyond reach. On July 21, 2017, EPA [U.S. Environmental Protection Agency] published a proposed rulemaking, containing proposed volume requirements for the RFS [Renewable Fuel Standard] Program’s four categories of renewable fuels that would apply in 2018 (and 2019 for BBD [biomass-based diesel]).3 On August 1, EPA hosted a public hearing on the proposed rule, and EPA received over 235,000 written comments on the proposed rule as well. On October 4, 2017 (82 FR 46174), EPA published an “Availability of Supplemental Information; Request for Further Comment,” (hereinafter, “October 4 document”) seeking further comment on the possible use of other waiver authorities in the final rule. Transcripts of the public hearing, along with all the comments received on the proposed rule and the October 4 document are available in the docket. After careful review of the information before us we are finalizing volume requirements for 2018 for cellulosic biofuel, advanced biofuel and total renewable fuel that are lower than the statutory targets, but nevertheless will ensure these renewable fuels will continue to play a critical role as a complement to our petroleum-based fuels. The final rule modifies the volume requirements slightly relative to the proposed rule, and in this notice we explain where and why such modifications were made.
[888] Final rule: “Renewable Fuel Standard Program: Standards for 2019 and Biomass-Based Diesel Volume for 2020.” Federal Register, December 11, 2018. <www.govinfo.gov>
Page 63705:
Today, nearly all gasoline used for transportation purposes contains 10 percent ethanol (E10), and on average diesel fuel contains nearly 5 percent biodiesel and/or renewable diesel.5 However, the market has fallen well short of the statutory volumes for cellulosic biofuel, resulting in shortfalls in the advanced biofuel and total renewable fuel volumes. In this action, we are finalizing a volume requirement for cellulosic biofuel at the level we project to be available for 2019, along with an associated applicable percentage standard. For advanced biofuel and total renewable fuel, we are finalizing reductions under the “cellulosic waiver authority” that would result in advanced biofuel and total renewable fuel volume requirements that are lower than the statutory targets by the same magnitude as the reduction in the cellulosic biofuel reduction. This would effectively maintain the implied statutory volumes for non-cellulosic advanced biofuel and conventional biofuel.6
[889] Final rule: “Renewable Fuel Standard Program: Standards for 2020 and Biomass-Based Diesel Volume for 2021.” Federal Register, February 6, 2020. <www.govinfo.gov>
Page 7017:
Today, nearly all gasoline used for transportation purposes contains 10 percent ethanol (E10), and on average diesel fuel contains nearly 5 percent of biodiesel and renewable diesel.5 However, the market has fallen well short of the statutory volumes for cellulosic biofuel, resulting in shortfalls in the advanced biofuel and total renewable fuel volumes. In this action, we are establishing a volume requirement for cellulosic biofuel at the level we project to be available for 2020, along with an associated applicable percentage standard. For advanced biofuel and total renewable fuel, we are finalizing volume requirements using the ‘‘cellulosic waiver authority’’ that result in advanced biofuel and total renewable fuel volume requirements that are lower than the statutory targets by the same magnitude as the reduction in the cellulosic biofuel reduction. This would effectively maintain the implied statutory volumes for non-cellulosic biofuel and conventional biofuel.6
[890] Report: “Biofuels: Challenges to the Transportation, Sale, and Use of Intermediate Ethanol Blends.” U.S. Government Accountability Office, June 2011. <www.gao.gov>
Page 6:
As shown in figure 2, the infrastructure used to transport petroleum fuels from refineries to wholesale terminals in the United States is different from that used to transport ethanol. Petroleum-based fuel is primarily transported from refineries to terminals by pipeline.10 In contrast, ethanol is transported to terminals via a combination of rail cars, tanker trucks, and barges.11 According to DOE [U.S. Department of Energy] estimates, there are approximately 1,050 terminals in the United States that handle gasoline and other petroleum products. At the terminals, most ethanol is currently blended as an additive in gasoline to make E10 [a blend of 10 percent ethanol and 90 percent gasoline by volume] fuel blends. A relatively small volume is also blended into a blend of between 70 percent to 83 percent ethanol (E85) and the remainder gasoline. E85 has a more limited market, primarily in the upper Midwest, and can only be used in flexible-fuel vehicles, which are vehicles that have been manufactured or modified to accept it.12 After blending, the fuel is moved to retail fueling locations in tanker trucks.
10 Terminals on the East Coast are large integrated facilities with marine, pipeline, and tanker truck receiving and dispatching capabilities. Although some terminals have rail access, they were not originally designed to support rail as a major mode for transporting fuel.
Page 7:
Figure 2: Primary Transportation of Petroleum Products and Ethanol from Refineries to Retail Fueling Outlets
Note: Other means of transportation are also used to move petroleum and ethanol products to wholesale terminals. For example, for ethanol, barges are also used to a limited extent.
[891] Webpage: “Safe Pipelines FAQs.” U.S. Department of Transportation, Pipeline and Hazardous Materials Safety Administration, August 29, 2007. <www.phmsa.dot.gov>
Pipelines are one of the safest and most cost-effective means to transport the extraordinary volumes of natural gas and hazardous liquid products that fuel our economy. To move the volume of even a modest pipeline, it would take a constant line of tanker trucks, about 750 per day, loading up and moving out every two minutes, 24 hours a day, seven days a week. The railroad-equivalent of this single pipeline would be a train of seventy-five 2,000-barrel tank rail cars everyday.
Relative to the volumes of products transported, pipelines are extremely safe when compared to other modes of energy transportation. Oil pipeline spills amount to about 1 gallon per million barrel-miles (Association of Oil Pipelines). One barrel, transported one mile, equals one barrel-mile, and there are 42 gallons in a barrel. In household terms, this is less than one teaspoon of oil spilled per thousand barrel-miles.
Pipeline statistics for calendar year 2002 report 139 liquid pipeline accidents resulted in the loss of about 97,000 barrels and about $31 million in property damage, but no deaths nor injuries. Natural gas transmission line accidents in 2002 resulted in one death and five injuries. …
Even though pipeline transportation is the safest and most economical means of transportation for our nation’s energy products, PHMSA [U.S. Department of Transportation, Pipeline and Hazardous Materials Safety Administration] and pipeline operators are engaged in research to identify and develop more effective means of ensuring the safety of energy pipelines.
[892] Report: “Biofuels Issues and Trends.” U.S. Energy Information Administration, October, 2012. <www.eia.gov>
Page 13:
Pipelines are potentially the most efficient way to transport ethanol, but there are several practical problems. The U.S. petroleum product pipeline system is primarily designed to move products from refineries in the Gulf Coast to consuming regions in the Northeast and the Midwest. Nearly all ethanol is produced in the Midwest and must be delivered to gasoline bulk terminals nationwide. Under normal operations, petroleum product pipelines often have hydrocarbon residues and small amounts of water in them. Ethanol, a strong solvent, can dissolve both residues and water thereby arriving at its destination out of specification.
Since 2009, Kinder Morgan has successfully transported ethanol in batches from Tampa to Orlando on its Central Florida pipeline system. The pipeline, while relatively short and without the complications of many other product pipelines, needed special cleaning and material upgrades prior to the start of shipping ethanol. In addition, each batch of ethanol is treated with anticorrosion additives to prevent corrosion of the steel pipes.29 In 2011, Kinder Morgan, the Tampa Port Authority, and CSX announced plans to upgrade the rail infrastructure to handle unit trains.30 The Kinder Morgan line remains the only multiproduct pipeline shipping ethanol.31 Currently there are no dedicated pipelines for ethanol in the United States.
Pages 18–19:
Biodiesel distribution is very similar to ethanol distribution. Most biodiesel is shipped from the production plant by rail because biodiesel plants are not necessarily located near pipelines. Where they are permitted, low blends of biodiesel can be shipped on existing pipelines without product degradation. But, like ethanol, biodiesel blends are mostly prohibited from petroleum product pipelines. Most product pipelines that ship diesel fuel also ship jet fuel, in which trace quantities of biodiesel are not currently acceptable. Some exceptions include Kinder Morgan, which allows biodiesel blends on its Plantation system from Mississippi to Virginia and also on its Oregon Pipeline, and the Colonial Pipeline, which allows biodiesel blends on a portion of its system in Georgia.
[893] Report: “Biofuels: Challenges to the Transportation, Sale, and Use of Intermediate Ethanol Blends.” U.S. Government Accountability Office, June 2011. <www.gao.gov>
Page 16:
Over many decades, the United States has established very efficient networks of pipelines that move large volumes of petroleum-based fuels from production or import centers on the Gulf Coast and in the Northeast to distribution terminals along the coasts. However, the existing networks of petroleum pipelines are not well suited for the transport of billions of gallons of ethanol. Specifically, as shown in figure 4, ethanol is generally produced in the Midwest and needs to be shipped to the coasts, flowing roughly in the opposite direction of petroleum-based fuels. The location of renewable fuel production plants (such as biorefineries) is often dictated by the need to be close to the source of the raw materials and not by proximity to centers of fuel demand or existing petroleum pipelines.
Pages 18–20:
Existing petroleum pipelines can be used to ship ethanol in some areas of the country. For example, in December 2008, the U.S. pipeline operator Kinder Morgan began transporting commercial batches of ethanol along with gasoline shipments in its 110-mile Central Florida Pipeline from Tampa to Orlando. However, pipeline owners would face the same technical challenges and costs that Kinder Morgan representatives reported facing, including the following:25
• Compatibility. Ethanol can dissolve dirt, rust, or hydrocarbon residues in a petroleum pipeline and degrade the quality of the fuel being shipped. It can also damage critical nonmetallic components, including gaskets and seals, which can cause leaks. In order for existing pipelines to transport ethanol, pipeline operators would need to chemically remove residues and replace any components that are not compatible with ethanol. According to DOT [U.S. Department of Transportation] officials, the results from two research projects sponsored by that agency have identified specific actions that must be taken on a wide variety of nonmetallic components commonly utilized by the pipeline industry.26
• Stress corrosion cracking. Tensile stress and a corrosive environment can combine to crack steel. The presence of ethanol increases the likelihood of this in petroleum pipelines. Over the past 2 decades, approximately 24 failures due to stress corrosion cracking have occurred in ethanol tanks and in production-facility piping having steel grades similar to those of petroleum pipelines. According to DOT officials, the results from nine research projects sponsored by that agency have targeted these challenges and produced guidelines and procedures to prevent or mitigate stress corrosion cracking. As a result, pipelines can safely transport ethanol after implementing the identified measures, according to DOT officials.27
• Attraction of water. Ethanol attracts water. If even small amounts of water mix with gasoline-ethanol blends, the resulting mixture cannot be used as a fuel or easily separated into its constituents. The only options are additional refining or disposal.
Some groups have proposed the construction of a new pipeline dedicated to the transportation of ethanol. For example, in February 2008, Magellan Midstream Partners, L.P. (Magellan) and Buckeye Partners, L.P. (Buckeye) proposed building a new pipeline from the Midwest to the East Coast.28 According to this proposal, the pipeline would gather ethanol from three segments: (1) Iowa, Nebraska, and South Dakota; (2) Illinois, Michigan, and Minnesota; and (3) Indiana and Ohio. Ethanol would be transported to demand centers in New England, the Mid-Atlantic, Virginia, and West Virginia.
The federal government has studied the feasibility of building a pipeline similar to the one proposed by Magellan. Specifically, under section 243 of EISA [Energy Independence and Security Act of 2007], DOE [U.S. Department of Energy] (in collaboration with DOT) issued a study in March 2010 that examined the feasibility of constructing an ethanol pipeline linking large East Coast demand centers with refineries in the Midwest.29 The report identified a number of significant challenges to building a dedicated ethanol pipeline, including the following:
• Construction costs. Using recent trends in and generally accepted industry estimates for pipeline construction costs, DOE estimated that an ethanol pipeline from the Midwest to the East Coast could cost about $4.5 million per mile. While DOE assumed that the construction of 1,700 miles of pipeline would cost more than $3 billion, it did not model total project costs beyond $4.25 billion in the report.
• Higher transportation rates. Based on the assumed demand for ethanol in the East Coast service area and the estimated cost of construction, DOE estimated the ethanol pipeline would need to charge an average tariff of 28 cents per gallon, substantially more than the current average rate of 19 cents per gallon, for transporting ethanol using rail, barge, and truck along the same transportation corridor.
• Lack of eminent domain authority. DOE estimated that siting a new ethanol pipeline of any significant length will likely require federal eminent domain authority, which currently does not exist for ethanol pipelines.
DOE’s report concluded that a dedicated ethanol pipeline can become a feasible option if there is (1) adequate demand for the ethanol (approximately 4.1 billion gallons per year for the hypothetical pipeline assessed) and (2) government financial incentives to help defray the large construction costs.
[894] Report: “International Energy Outlook 2016.” U.S. Energy Information Administration, May 2016. <www.eia.gov>
Page 2: “In addition to being price-sensitive, biofuels development, in particular, often depends heavily on policies or mandates to support growth.”
[895] Calculated with data from:
a) Report: “July 2022 Monthly Energy Review.” U.S. Energy Information Administration, Office of Energy Statistics, July 26, 2022. <www.eia.gov>
Page 61: “Table 3.1 Petroleum Overview (Thousand Barrels per Day) … Field Productiona … Totalc … 2020 [=] 16,458 … Biofuels Plant Net Productione … 2020 [=] 1009”
b) Dataset: “International Energy Outlook 2021, World Petroleum and Other Liquids Production, Reference Case.” U.S. Energy Information Administration. Accessed September 5, 2022 at <www.eia.gov>
“Total liquid fuels (million b/d) 2020 [=] 94.0”
c) Dataset: “International Energy Outlook 2021, World Other Liquid Fuels Production, Reference Case.” U.S. Energy Information Administration. Accessed September 5, 2022 at <www.eia.gov>
“Liquids from renewable sources (million b/d) 2020 [=] 2.5”
CALCULATIONS:
[896] Calculated with data from:
a) Dataset: “International Energy Outlook 2021, World Petroleum and Other Liquids Production, Reference Case.” U.S. Energy Information Administration. Accessed September 5, 2022 at <www.eia.gov>
“Total liquid fuels (million b/d) 2050 [=] 125.9”
b) Dataset: “International Energy Outlook 2021, World Other Liquid Fuels Production, Reference Case.” U.S. Energy Information Administration. Accessed September 5, 2022 at <www.eia.gov>
“Liquids from renewable sources (million b/d) 2050 [=] 3.8”
CALCULATION: 3.8 renewable liquids / 125.9 total liquids = 2.7%
[897] Calculated with data from the report: “International Energy Outlook 2019.” U.S. Energy Information Administration. September 24, 2019. <www.eia.gov>
“Appendix Tables: Reference Case.” <www.eia.gov>
Page 35 (of PDF): “Table G1. World Petroleum and Other Liquids Production, Reference Case (million barrels per day) … Liquid Fuel … Total Liquids … 2050 [=] 121.5”
Page 37 (of PDF): “Table G3. World Other Liquid Fuels Production, Reference Case (million barrels per day) … Liquid Fuel … Liquids from renewable sources … 2050 [=] 2.7”
CALCULATION: 2.7 / 121.5 = 2%
[898] Calculated with data from the report: “International Energy Outlook 2017: Appendix G—Projections of Petroleum and Other Liquids Fuel Projections in Three Cases.” U.S. Energy Information Administration, September 2017. <www.eia.gov>
Page 45: “Table G1. World petroleum and other liquids production by region and country, 2015–50, Reference case (million barrels per day) … 2050 … Total World [=] 122.1 … United States [=] 16.9”
Page 47:
Table G3. International other liquid fuelsa production by region and country, 2015–50, Reference case (million barrels per day) … Liquids from renewable sourcesc … 2050 … Total World [=] 3.4 … United States [=] 1.1 …
a Other liquids includes natural gas plant liquids, liquids from renewable sources (biofuels, including ethanol, biodiesel, and biomass-to-liquids [BTL], liquids from natural gas (gas-to-liquids [GTL]), liquids from coal (coal-to-liquids [CTL]), and liquids from kerogen (oil shale). …
c Liquids from renewable sources (biofuels) include ethanol, biodiesel, and biomass-to-liquids [BTL]. All volumes, including ethanol, are reported on a volume basis. China statistics include methanol volumes.
CALCULATIONS:
[899] Ruling: American Petroleum Institute v. Environmental Protection Agency. U.S. Court of Appeals for the District of Columbia Circuit. January 25, 2013. <www.cadc.uscourts.gov>
Page 2:
The [Clean Air] Act enumerates yearly “applicable volume” requirements not only for renewable fuel but also for a subclass known as “advanced biofuels,” which produce lower greenhouse gas emissions than conventional renewable fuels such as corn-based ethanol. … The “applicable volume” for a particular fuel (a phrase used repeatedly in the statute and thus in this opinion) determines how much of that fuel refiners, importers and blenders must purchase each year in order to comply with the RFS [Renewable Fuel Standard] program.
[900] Report: “Biofuels: Challenges to the Transportation, Sale, and Use of Intermediate Ethanol Blends.” U.S. Government Accountability Office, June 2011. <www.gao.gov>
Page 5:
According to the RFS [Renewable Fuel Standard], most advanced biofuels must be produced from cellulosic materials, which can include perennial grasses, crop residue, and the branches and leaves of trees. In addition, some advanced biofuels must be produced from biomass-based diesel, which generally includes any diesel made from biomass feedstocks, such as soybeans.
Page 6: “The RFS generally requires that U.S. transportation fuels in 2022 contain 36 billion gallons of biofuels. In addition, at least 16 billion of the 36 billion gallons of biofuels must be cellulosic biofuels—including ethanol and diesel derived from cellulosic materials.”
[901] Report: “The Impact of Ethanol Use on Food Prices and Greenhouse-Gas Emissions.” Congressional Budget Office, April 2009. <www.cbo.gov>
Page 2: “Ethanol can also be produced from cellulose; however, the production process is more difficult than that for corn because the sugars contained within cellulose are tightly bound in the fibrous materials that give potential cellulosic sources—such as cornstalks and trees—their sturdiness.”
Page 14:
Cellulosic ethanol—produced by using switchgrass (a North American grass used for hay and forage), corn stover (the leaves and stalks of the corn plant), or forest residues (in general, small or dead wood items not useful for resale and wastes from lumber operations) as feedstocks—offers the potential for greater reductions in greenhouse-gas emissions (see Figure 3). Relative to corn ethanol, cellulosic ethanol is expected to produce fewer net greenhouse-gas emissions because cellulosic wastes (rather than fossil fuels) might be used as a source of energy for an ethanol plant’s operations or in cogeneration facilities (facilities that produce electricity as well as steam that can be used for the plant’s operations). Electricity produced by such facilities could be transmitted to the electric grid, which might reduce the use of fossil fuels in coal-fired or natural gas-fired power plants.50
According to researchers, cellulosic ethanol, if successfully developed, could reduce greenhouse-gas emissions by 85 percent to 95 percent relative to emissions associated with the production of gasoline.51 In the long run, if cellulosic ethanol could be produced on a large scale and if that fuel along with corn ethanol was substituted for gasoline at the levels called for under the EISA [Energy Independence and Security Act of 2007] mandate, greenhouse-gas emissions might be reduced by about 130 million metric tons of CO2e by 2022, or 6 percent of total projected emissions from the transportation sector and 2 percent of total emissions generated in the United States.52
[902] Public Law 110-140: “Energy Independence and Security Act of 2007.” 110th U.S. Congress. Signed into law by George W. Bush on December 19, 2007. <www.gpo.gov>
Pages 28–29:
(B) Advanced Biofuel.—
(i) In General.—The term “advanced biofuel” means renewable fuel, other than ethanol derived from corn starch, that has lifecycle greenhouse gas emissions, as determined by the Administrator, after notice and opportunity for comment, that are at least 50 percent less than baseline lifecycle greenhouse gas emissions.
(ii) Inclusions.—the types of fuels eligible for consideration as “advanced biofuel” may include any of the following:
(I) Ethanol derived from cellulose, hemicellulose, or lignin.
(II) Ethanol derived from sugar or starch (other than corn starch).
(III) Ethanol derived from waste material, including crop residue, other vegetative waste material, animal waste, and food waste and yard waste.
(IV) Biomass-based diesel.
(V) Biogas (including landfill gas and sewage waste treatment gas) produced through the conversion of organic matter from renewable biomass.
(VI) Butanol or other alcohols produced through the conversion of organic matter from renewable biomass.
(VII) Other fuel derived from cellulosic biomass.
(C) Baseline Lifecycle Greenhouse Gas Emissions.—The term “baseline lifecycle greenhouse gas emissions” means the average lifecycle greenhouse gas emissions, as determined by the Administrator, after notice and opportunity for comment, for gasoline or diesel (whichever is being replaced by the renewable fuel) sold or distributed as transportation fuel in 2005.
(D) Biomass-Based Diesel.—The term “biomass-based diesel” means renewable fuel that is biodiesel as defined in section 312(f) of the Energy Policy Act of 1992 (42 U.S.C. 13220(f)) and that has lifecycle greenhouse gas emissions, as determined by the Administrator, after notice and opportunity for comment, that are at least 50 percent less than the baseline lifecycle greenhouse gas emissions. Notwithstanding the preceding sentence, renewable fuel derived from co-processing biomass with a petroleum feedstock shall be advanced biofuel if it meets the requirements of subparagraph (B), but is not biomass-based diesel.
(E) Cellulosic Biofuel.—The term “cellulosic biofuel” means renewable fuel derived from any cellulose, hemicellulose, or lignin that is derived from renewable biomass and that has lifecycle greenhouse gas emissions, as determined by the Administrator, that are at least 60 percent less than the baseline lifecycle greenhouse gas emissions.
(F) Conventional Biofuel.—The term “conventional biofuel” means renewable fuel that is ethanol derived from corn starch.
(G) Greenhouse Gas.—The term “greenhouse gas” means carbon dioxide, hydrofluorocarbons, methane, nitrous oxide, perfluorocarbons, sulfur hexafluoride. The Administrator may include any other anthropogenically emitted gas that is determined by the Administrator, after notice and comment, to contribute to global warming.
(H) Lifecycle Greenhouse Gas Emissions.—The term “lifecycle greenhouse gas emissions” means the aggregate quantity of greenhouse gas emissions (including direct emissions and significant indirect emissions such as significant emissions from land use changes), as determined by the Administrator, related to the full fuel lifecycle, including all stages of fuel and feedstock production and distribution, from feedstock generation or extraction through the distribution and delivery and use of the finished fuel to the ultimate consumer, where the mass values for all greenhouse gases are adjusted to account for their relative global warming potential.
Page 32:
Cellulosic Biofuel—For the purpose of subparagraph (A), of the volume of advanced biofuel required under subclause (II), the applicable volume of cellulosic biofuel for the calendar years 2010 through 2022 shall be determined in accordance with the following table:
|
Calendar Year |
Applicable Volume of Cellulosic Biofuel (in Billions of Gallons) |
|
2010 |
0.1 |
|
2011 |
0.25 |
|
2012 |
0.5 |
|
2013 |
1 |
|
2014 |
1.75 |
|
2015 |
3 |
|
2016 |
4.25 |
|
2017 |
5.5 |
|
2018 |
7 |
|
2019 |
8.5 |
|
2020 |
10.5 |
|
2021 |
13.5 |
|
2022 |
16 |
[903] Ruling: American Petroleum Institute v. Environmental Protection Agency. U.S. Court of Appeals for the District of Columbia Circuit. January 25, 2013. <www.cadc.uscourts.gov>
Page 3:
When Congress introduced the cellulosic biofuel requirement in 2007, there was no commercial-scale production at all. Yet Congress mandated cellulosic biofuel sales in the U.S. of 100 million gallons in 2010, 250 million in 2011, and half a billion in 2012 (all in ethanol-equivalent gallons)….
Recognizing the technological challenges, Congress provided for the possibility that actual production would fall short of the stated requirements. Section 7545(o)(7)(D)(i) calls for a determination by EPA [U.S. Environmental Protection Agency] of the “projected volume of cellulosic biofuel production” for each calendar year, to be made no later than November 30 of the prior year and to be “based on” an estimate of the Energy Information Administration (“EIA”). When that projection is less than the mandated volume, the Administrator is to “reduce the applicable volume of cellulosic biofuel … to the projected volume.” … The Act also provides that in the event of such a reduction the Administrator “may also reduce the applicable volume of renewable fuel and advanced biofuels” required for that year.
[904] Public Law 110-140: “Energy Independence and Security Act of 2007.” 110th U.S. Congress. Signed into law by George W. Bush on December 19, 2007. <www.gpo.gov>
Page 32: “For the purpose of subparagraph (A), of the volume of advanced biofuel required under subclause (II), the applicable volume of cellulosic biofuel for the calendar years 2010 through 2022 shall be determined in accordance with the following table….”
[905] Report: “The Renewable Fuel Standard: Issues for 2014 and Beyond.” Congressional Budget Office, June 2014. <www.cbo.gov>
Page 6:
To date, the greatest challenge in meeting the requirements specified in EISA [Energy Independence and Security Act of 2007] has been the small supply of cellulosic biofuels. The industry that produces those fuels is in its infancy, and the volumes required by EISA far outstrip the projected growth in the industry’s production capacity. EISA first set requirements for cellulosic biofuels in 2010, mandating the use of 100 million gallons in that year and larger amounts in each subsequent year. Before 2013, however, no commercial plants to produce cellulosic biofuels were in operation, and EPA [U.S. Environmental Protection Agency] virtually eliminated the requirements until that year.
[906] Calculated with data from the report: “The Renewable Fuel Standard (RFS): An Overview.” Congressional Research Service, January 24, 2018. <fas.org>
Page 6: “Table 1. Renewable Fuel Standard Statute, EPA [U.S. Environmental Protection Agency] Final and Proposed Volume Amounts (in billions of gallons) … 2010 … S [=] 0.1000 … 2010 … F [=] 0.0065 … Notes: S = Statute, F = Final”
CALCULATION: (0.1000 Statute – 0.0065 Final) / 0.1000 = 93.5%
[907] Dataset: “2010 Renewable Fuel Standard Data.” U.S. Environmental Protection Agency. Last updated January 19, 2017. <19january2017snapshot.epa.gov>
“RIN [Renewable Identification Number] Generation and Renewable Fuel Volume Production by Fuel Type … Total Production by Fuel Type … Fuel (D Code) … Cellulosic Biofuel (D3) … Ethanol (EV 1.0) … Volume [=] 0”
[908] Calculated with data from the report: “The Renewable Fuel Standard (RFS): An Overview.” Congressional Research Service, January 24, 2018. <fas.org>
Page 6: “Table 1. Renewable Fuel Standard Statute, EPA [U.S. Environmental Protection Agency] Final and Proposed Volume Amounts (in billions of gallons) … 2011 … S [=] 0.2500 … 2011 … F [=] 0.0060 … Notes: S = Statute, F = Final”
CALCULATION: (0.2500 Statute – 0.0060 Final) / 0.2500 = 97.6%
[909] Dataset: “2010 Renewable Fuel Standard Data.” U.S. Environmental Protection Agency. Last updated January 19, 2017. <19january2017snapshot.epa.gov>
“RIN [Renewable Identification Number] Generation and Renewable Fuel Volume Production by Fuel Type … Total Production by Fuel Type … Fuel (D Code) … Cellulosic Biofuel (D3) … Ethanol (EV 1.0) … Volume [=] 0”
[910] Final rule: “Regulation of Fuels and Fuel Additives: 2011 Renewable Fuel Standards.” Federal Register, December 9, 2010. <www.gpo.gov>
Page 76792:
In our assessment we evaluated both domestic and foreign sources of cellulosic biofuel. We determined that five U.S. facilities have the potential to make volumes of cellulosic biofuel commercially available for transportation use in the U.S. in 2011. We also identified three international facilities, two in Canada and one in Germany, that we expect will produce cellulosic biofuel in 2011. While these facilities may also be able to produce cellulosic volume in 2011, we determined that they are unlikely to make the fuel available to the U.S. market. Based on our assessment for this rulemaking, we are lowering the applicable volume of cellulosic biofuel for 2011 from the statutory volume of 250 million gallons to 6.0 million ethanol-equivalent gallons.
[911] Article: “A Fine for Not Using a Biofuel That Doesn’t Exist.” By Matthew L. Wald. New York Times, January 9, 2012. <www.nytimes.com>
When the companies that supply motor fuel close the books on 2011, they will pay about $6.8 million in penalties to the Treasury because they failed to mix a special type of biofuel into their gasoline and diesel as required by law.
But there was none to be had. Outside a handful of laboratories and workshops, the ingredient, cellulosic biofuel, does not exist.
In 2012, the oil companies expect to pay even higher penalties for failing to blend in the fuel, which is made from wood chips or the inedible parts of plants like corncobs. Refiners were required to blend 6.6 million gallons into gasoline and diesel in 2011 and face a quota of 8.65 million gallons this year.
[912] Ruling: American Petroleum Institute v. Environmental Protection Agency. U.S. Court of Appeals for the District of Columbia Circuit. January 25, 2013. <www.cadc.uscourts.gov>
Page 4:
In a January 2012 Final Rule (the “2012 RFS [Renewable Fuel Standard] rule”), EPA [U.S. Environmental Protection Agency] projected that 8.65 million gallons of cellulosic biofuel (10.45 million ethanol-equivalent gallons) would be produced in 2012, well short of the 500 million ethanol-equivalent gallons mandated by the Act for that year. … In the same rule, EPA considered but rejected a reduction in the volume of total advanced biofuels required for 2012, stating that other kinds of advanced biofuels could make up for the shortfall.
Page 9: “Finally, API [American Petroleum Institute] challenges the special tilt with which EPA expressly viewed the data—a tilt, in its words, toward ‘promoting growth’ in the cellulosic biofuel industry. We agree with API that such a purpose has no basis in the relevant text of the Act.”
Page 10:
We do not think the text of § 7545(o)(7)(D)(i) or the general structure of the RFS program supports EPA’s decision to adopt a methodology in which the risk of overestimation is set deliberately to outweigh the risk of underestimation.2 Section 7545(o)(7)(D)(i)’s reference to the “projected volume of cellulosic biofuel” seems plainly to call for a prediction of what will actually happen. EPA points to no instance in which the term “projected” is used to allow the projector to let its aspirations for a self-fulfilling prophecy divert it from a neutral methodology.
2 More precisely, a methodology that plans for the expected value of upside errors (the summation of each upside deviation, weighted by its likelihood) to exceed the expected value of downside errors.
Page 12: “Apart from their role as captive consumers, the refiners are in no position to ensure, or even contribute to, growth in the cellulosic biofuel industry. ‘Do a good job, cellulosic fuel producers. If you fail, we’ll fine your customers.’ ”
Page 14:
For the reasons set out above, we reject API’s challenge to EPA’s refusal to lower the applicable volume of advanced biofuels for 2012. However, we agree with API that EPA’s 2012 projection of cellulosic biofuel production was in excess of the agency’s statutory authority. We accordingly vacate that aspect of the 2012 RFS rule and remand for further proceedings consistent with this opinion.
[913] Ruling: American Petroleum Institute v. Environmental Protection Agency. U.S. Court of Appeals for the District of Columbia Circuit. January 25, 2013. <www.cadc.uscourts.gov>
Page 3:
When Congress introduced the cellulosic biofuel requirement in 2007, there was no commercial-scale production at all. Yet Congress mandated cellulosic biofuel sales in the U.S. of 100 million gallons in 2010, 250 million in 2011, and half a billion in 2012 (all in ethanol-equivalent gallons)….
Recognizing the technological challenges, Congress provided for the possibility that actual production would fall short of the stated requirements. Section 7545(o)(7)(D)(i) calls for a determination by EPA [U.S. Environmental Protection Agency] of the “projected volume of cellulosic biofuel production” for each calendar year, to be made no later than November 30 of the prior year and to be “based on” an estimate of the Energy Information Administration (“EIA”). When that projection is less than the mandated volume, the Administrator is to “reduce the applicable volume of cellulosic biofuel … to the projected volume.” … The Act also provides that in the event of such a reduction the Administrator “may also reduce the applicable volume of renewable fuel and advanced biofuels” required for that year.
[914] Public Law 110-140: “Energy Independence and Security Act of 2007.” 110th U.S. Congress. Signed into law by George W. Bush on December 19, 2007. <www.gpo.gov>
Page 32: “For the purpose of subparagraph (A), of the volume of advanced biofuel required under subclause (II), the applicable volume of cellulosic biofuel for the calendar years 2010 through 2022 shall be determined in accordance with the following table….”
[915] Report: “The Renewable Fuel Standard: Issues for 2014 and Beyond.” Congressional Budget Office, June 2014. <www.cbo.gov>
Page 6:
To date, the greatest challenge in meeting the requirements specified in EISA [Energy Independence and Security Act of 2007] has been the small supply of cellulosic biofuels. The industry that produces those fuels is in its infancy, and the volumes required by EISA far outstrip the projected growth in the industry’s production capacity. EISA first set requirements for cellulosic biofuels in 2010, mandating the use of 100 million gallons in that year and larger amounts in each subsequent year. Before 2013, however, no commercial plants to produce cellulosic biofuels were in operation, and EPA [U.S. Environmental Protection Agency] virtually eliminated the requirements until that year.
[916] Calculated with data from the report: “The Renewable Fuel Standard (RFS): An Overview.” Congressional Research Service, January 24, 2018. <fas.org>
Page 6: “Table 1. Renewable Fuel Standard Statute, EPA [U.S. Environmental Protection Agency] Final and Proposed Volume Amounts (in billions of gallons) … 2010 … S [=] 0.1000 … 2010 … F [=] 0.0065 … Notes: S = Statute, F = Final”
CALCULATION: (0.1000 Statute – 0.0065 Final) / 0.1000 = 93.5%
[917] Dataset: “2010 Renewable Fuel Standard Data.” U.S. Environmental Protection Agency. Last updated January 19, 2017. <19january2017snapshot.epa.gov>
“RIN [Renewable Identification Number] Generation and Renewable Fuel Volume Production by Fuel Type … Total Production by Fuel Type … Fuel (D Code) … Cellulosic Biofuel (D3) … Ethanol (EV 1.0) … Volume [=] 0”
[918] Calculated with data from the report: “The Renewable Fuel Standard (RFS): An Overview.” Congressional Research Service, January 24, 2018. <fas.org>
Page 6: “Table 1. Renewable Fuel Standard Statute, EPA [U.S. Environmental Protection Agency] Final and Proposed Volume Amounts (in billions of gallons) … 2011 … S [=] 0.2500 … 2011 … F [=] 0.0060 … Notes: S = Statute, F = Final”
CALCULATION: (0.2500 Statute – 0.0060 Final) / 0.2500 = 97.6%
[919] Dataset: “2010 Renewable Fuel Standard Data.” U.S. Environmental Protection Agency. Last updated January 19, 2017. <19january2017snapshot.epa.gov>
“RIN [Renewable Identification Number] Generation and Renewable Fuel Volume Production by Fuel Type … Total Production by Fuel Type … Fuel (D Code) … Cellulosic Biofuel (D3) … Ethanol (EV 1.0) … Volume [=] 0”
[920] Final rule: “Regulation of Fuels and Fuel Additives: 2011 Renewable Fuel Standards.” Federal Register, December 9, 2010. <www.gpo.gov>
Page 76792:
In our assessment we evaluated both domestic and foreign sources of cellulosic biofuel. We determined that five U.S. facilities have the potential to make volumes of cellulosic biofuel commercially available for transportation use in the U.S. in 2011. We also identified three international facilities, two in Canada and one in Germany, that we expect will produce cellulosic biofuel in 2011. While these facilities may also be able to produce cellulosic volume in 2011, we determined that they are unlikely to make the fuel available to the U.S. market. Based on our assessment for this rulemaking, we are lowering the applicable volume of cellulosic biofuel for 2011 from the statutory volume of 250 million gallons to 6.0 million ethanol-equivalent gallons.
[921] Article: “A Fine for Not Using a Biofuel That Doesn’t Exist.” By Matthew L. Wald. New York Times, January 9, 2012. <www.nytimes.com>
When the companies that supply motor fuel close the books on 2011, they will pay about $6.8 million in penalties to the Treasury because they failed to mix a special type of biofuel into their gasoline and diesel as required by law.
But there was none to be had. Outside a handful of laboratories and workshops, the ingredient, cellulosic biofuel, does not exist.
In 2012, the oil companies expect to pay even higher penalties for failing to blend in the fuel, which is made from wood chips or the inedible parts of plants like corncobs. Refiners were required to blend 6.6 million gallons into gasoline and diesel in 2011 and face a quota of 8.65 million gallons this year.
[922] Ruling: American Petroleum Institute v. Environmental Protection Agency. U.S. Court of Appeals for the District of Columbia Circuit. January 25, 2013. <www.cadc.uscourts.gov>
Page 4:
In a January 2012 Final Rule (the “2012 RFS [Renewable Fuel Standard] rule”), EPA [U.S. Environmental Protection Agency] projected that 8.65 million gallons of cellulosic biofuel (10.45 million ethanol-equivalent gallons) would be produced in 2012, well short of the 500 million ethanol-equivalent gallons mandated by the Act for that year. … In the same rule, EPA considered but rejected a reduction in the volume of total advanced biofuels required for 2012, stating that other kinds of advanced biofuels could make up for the shortfall.
Page 9: “Finally, API [American Petroleum Institute] challenges the special tilt with which EPA expressly viewed the data—a tilt, in its words, toward ‘promoting growth’ in the cellulosic biofuel industry. We agree with API that such a purpose has no basis in the relevant text of the Act.”
Page 10:
We do not think the text of § 7545(o)(7)(D)(i) or the general structure of the RFS program supports EPA’s decision to adopt a methodology in which the risk of overestimation is set deliberately to outweigh the risk of underestimation.2 Section 7545(o)(7)(D)(i)’s reference to the “projected volume of cellulosic biofuel” seems plainly to call for a prediction of what will actually happen. EPA points to no instance in which the term “projected” is used to allow the projector to let its aspirations for a self-fulfilling prophecy divert it from a neutral methodology.
2 More precisely, a methodology that plans for the expected value of upside errors (the summation of each upside deviation, weighted by its likelihood) to exceed the expected value of downside errors.
Page 12: “Apart from their role as captive consumers, the refiners are in no position to ensure, or even contribute to, growth in the cellulosic biofuel industry. ‘Do a good job, cellulosic fuel producers. If you fail, we’ll fine your customers.’ ”
Page 14:
For the reasons set out above, we reject API’s challenge to EPA’s refusal to lower the applicable volume of advanced biofuels for 2012. However, we agree with API that EPA’s 2012 projection of cellulosic biofuel production was in excess of the agency’s statutory authority. We accordingly vacate that aspect of the 2012 RFS rule and remand for further proceedings consistent with this opinion.
[923] Calculated with data from:
a) Dataset: “RIN [Renewable Identification Number] Generation and Renewable Fuel Volume Production by Fuel Type for the Renewable Fuel Standard From July 2022.” U.S. Environmental Protection Agency, July 2022. <www.epa.gov>
b) Report: “The Renewable Fuel Standard (RFS): An Overview.” Congressional Research Service. Updated August 10, 2022. <crsreports.congress.gov>
Pages 7–8: “Table 1. Renewable Fuel Standard Statute, EPA Final and Proposed Volume Amounts (in billions of gallons)”
NOTE: An Excel file containing the data and calculations is available upon request.
[924] Final rule: “Regulation of Fuels and Fuel Additives: Identification of Additional Qualifying Renewable Fuel Pathways Under the Renewable Fuel Standard Program.” Federal Register, March 5, 2013. <www.gpo.gov>
Page 14205:
C. Lifecycle Greenhouse Gas Emissions Analysis for Certain Renewable Gasoline and Renewable Gasoline Blendstocks Pathways
In this rule, EPA [U.S. Environmental Protection Agency] is also adding pathways to Table 1 to § 80.1426 for the production of renewable gasoline and renewable gasoline blendstock using specified feedstocks, fuel production processes, and process energy sources. The feedstocks we considered are generally considered waste feedstocks such as crop residues or cellulosic components of separated yard waste. These feedstocks have been identified by the industry as the most likely feedstocks for use in making renewable gasoline or renewable gasoline blendstock in the near term due to their availability and low cost.
[925] Dataset: “RIN [Renewable Identification Number] Generation and Renewable Fuel Volume Production by Fuel Type for the Renewable Fuel Standard From July 2022.” U.S. Environmental Protection Agency, July 2022. <www.epa.gov>
|
2013 Cellulosic Biofuel (D3) Production |
|
|
Fuel Category |
Volume (Gallons) |
|
Cellulosic Ethanol (EV 1.0) |
|
|
Renewable Compressed Natural Gas |
|
|
Renewable Liquefied Natural Gas |
|
|
Cellulosic Renewable Gasoline Blendstock (EV application required) |
281,819 |
|
2014 Cellulosic Biofuel (D3) Production |
|
|
Fuel Category |
Volume (Gallons) |
|
Cellulosic Ethanol (EV 1.0) |
|
|
Renewable Compressed Natural Gas |
|
|
Renewable Liquefied Natural Gas |
|
|
Cellulosic Renewable Gasoline Blendstock (EV application required) |
29,445 |
[926] Final rule: “Regulation of Fuels and Fuel Additives: RFS Pathways II, and Technical Amendments to the RFS Standards and E15 [a blend of 15 percent ethanol and 85 percent gasoline by volume] Misfueling Mitigation Requirements.” Federal Register, July 18, 2014. <www.gpo.gov>
Page 42147:
2. Consideration of Corn Kernel Fiber as a Crop Residue
We also proposed in the NPRM [notice of proposed rulemaking] that corn kernel fiber be considered a crop residue. Corn kernel fiber has not been specifically mentioned as a type of crop residue in any previous RFS [Renewable Fuel Standard] rulemaking. However, EPA [U.S. Environmental Protection Agency] has received several requests to consider corn kernel fiber to be a crop residue. Because it had not been considered a crop residue previously, EPA conducted an evaluation that assessed whether corn kernel fiber should be considered a crop residue. This analysis focuses on whether corn kernel fiber can be considered “left over from the harvesting or processing of planted crops,” whether it has “no significant impacts on demand for the feedstock crop, products produced from that crop, or any substitutes for the crop and its products” nor “any other impact that would result in a significant increase in direct or indirect GHG [greenhouse gas] emissions.”
We requested comment on our proposed analysis. We received significant comment supporting our analysis and our proposal that corn kernel fiber should be considered a crop residue.74 We did not receive any comments opposing our analysis or our conclusions. Accordingly, we have decided based on the assumptions, facts and analysis described below that corn kernel fiber should be considered crop residue as proposed. Should relevant facts described in our analysis change, a re-evaluation of the issue may be warranted. Our analysis of corn kernel fiber can serve as one of many possible illustrative examples of how crop products can be evaluated for qualification as crop residues, in addition to our previous considerations of other feedstocks that we consider to be crop residue, such as corn stover.75
74 Several commenters expressed extremely similar opinions on this point. But see, for example, comments submitted by the Renewable Fuels Association… the National Corn Growers Association … and Growth Energy….
75 For our analysis of corn stover in the context of the crop residue pathway, see 75 FR [final rule] 14670, March 26, 2010.
Page 42148: “These findings support a determination that corn kernel fiber meets the definition of a crop residue. Therefore, corn kernel fiber may be used as a feedstock in those pathways in Table 1 to § 80.1426 that specify crop residue as a feedstock.”
[927] Regulatory announcement: “EPA [U.S. Environmental Protection Agency] Issues Final Rule for Renewable Fuel Standard (RFS) Pathways II and Modifications to the RFS Program, Ultra Low Sulfur Diesel Requirements, and E15 [a blend of 15 percent ethanol and 85 percent gasoline by volume] Misfueling Mitigation Requirements.” U.S. Environmental Protection Agency, July 2014. <nepis.epa.gov>
New Pathways
This action qualifies the following as cellulosic and advanced fuel pathways under the Renewable Fuels Standards (RFS):
• Compressed natural gas produced from biogas from landfills, municipal wastewater treatment facility digesters, agricultural digesters, and separated MSW [municipal solid waste] digesters
• Liquefied natural gas produced from biogas from landfills, municipal wastewater treatment facility digesters, agricultural digesters, and separated MSW digesters
[928] Final rule: “Regulation of Fuels and Fuel Additives: RFS Pathways II, and Technical Amendments to the RFS Standards and E15 [a blend of 15 percent ethanol and 85 percent gasoline by volume] Misfueling Mitigation Requirements.” Federal Register, July 18, 2014. <www.gpo.gov>
Page 42128:
We also modify regulatory provisions related to renewable fuel made from biogas, including a new compressed natural gas (CNG)/liquefied natural gas (LNG) cellulosic biofuel pathway, and add a new cellulosic biofuel pathway for renewable electricity (used in electric vehicles) produced from biogas. These pathways have the potential to provide notable volumes of cellulosic biofuel for use in complying with the RFS [Renewable Fuel Standard] program, since significant volumes of advanced biofuels are already being generated for fuel made from biogas, and in many cases this same fuel will qualify for cellulosic RINs [renewable identification numbers] when this rule becomes effective. The approval of these new cellulosic pathways could have an impact on EPA’s [U.S. Environmental Protection Agency] projection of 2014 cellulosic biofuel volumes in the final 2014 RFS standards rulemaking.
[929] Calculated with the dataset: “RIN [Renewable Identification Number] Generation and Renewable Fuel Volume Production by Fuel Type for the Renewable Fuel Standard From July 2022.” U.S. Environmental Protection Agency, July 2022. <www.epa.gov>
NOTE: An Excel file containing the data and calculations is available upon request.
[930] Article: “NREL Science Central to Success of New Biofuels Projects: DuPont–NREL Partnership Delivered Key Innovations for Large Scale Cellulosic Ethanol Facility in Iowa.” By Bill Scanlon. U.S. Department of Energy, National Renewable Energy Laboratory, February 23, 2015. <www.nrel.gov>
The Energy Department’s National Renewable Energy Laboratory (NREL) played crucial roles in developing the technology that has led companies such as DuPont, POET, and Abengoa to open commercial-scale facilities to turn biomass into clean transportation fuels. …
“DuPont is leading the way in the commercialization of cellulosic ethanol,” states Jan Koninckx, Director DuPont Biofuels. “The work conducted with NREL has provided foundational science, and today, DuPont offers an integrated and demonstrated farm-to-fuel cellulosic ethanol solution that meets the demands of renewable fuel and chemical producers for a cost effective, sustainable, scalable technology.”
[931] Webpage: “About NREL.” U.S. Department of Energy, National Renewable Energy Laboratory. Accessed May 9, 2018 at <www.nrel.gov>
“At NREL [National Renewable Energy Laboratory], we focus on creative answers to today's energy challenges. From breakthroughs in fundamental science to new clean technologies to integrated energy systems that power our lives, NREL researchers are transforming the way the nation and the world use energy.”
[932] Article: “Largest Cellulosic Ethanol Plant in the World Opens October 30.” U.S. Department of Energy, Office of Energy Efficiency and Renewable Energy, October 30, 2015. <www.energy.gov>
The DuPont cellulosic ethanol facility, opening in Nevada, Iowa, on October 30, will be the largest cellulosic ethanol plant in the world. The U.S. Department of Energy (DOE) Bioenergy Technologies Office (BETO) Director, Jonathan Male, alongside senior government officials, DuPont leaders and staff, and local farmers will attend the grand opening ceremony and plant tour. …
DuPont broke ground on this facility in 2012, although preparation for the building of this advanced biorefinery started in the early 2000s when it began working with DOE’s National Renewable Energy Laboratory (NREL) on biofuels technology. According to DuPont, the biorefinery has provided many job and financial opportunities for this rural area of the United States, such as employing 1,000 construction workers, obtaining corn stover from approximately 500 nearby farmers, hiring 85 employees to work at the plant, and using another 150 people to collect, transport, and store feedstock.
[933] Webpage: “POET-DSM: Project Liberty.” U.S. Department of Energy, Office of Energy Efficiency and Renewable Energy. Accessed May 9, 2018 at <www.energy.gov>
Project LIBERTY, POET-DSM’s new biorefinery in Emmetsburg, Iowa, began producing cellulosic ethanol from corn stover on September 3, 2014. This state-of-the-art facility uses a biological process to convert post-harvest corn stover (cobs, leaves, husks, and upper stalks) into a biofuel that will help build U.S. fuel independence, reduce climate impacts, and create new jobs. The facility could increase Iowa’s economic output by $24.4 billion and create more than 13,500 jobs in the state over the next 20 years.
The U.S. Department of Energy contributed $100 million in cost-shared support for the development, design, and construction of this pioneer facility, which has the capacity to produce up to 25 million gallons of cellulosic ethanol annually. It is one of the first generation of large-scale U.S. biorefineries to produce biofuel from agricultural waste. With the successful scale up this novel technology, the biorefinery will help to advance U.S. competitiveness in clean energy technology while providing American farmers with an additional revenue stream.
[934] Webpage: “Abengoa.” U.S. Department of Energy, Office of Energy Efficiency and Renewable Energy. Accessed May 9, 2018 at <www.energy.gov>
Abengoa’s biorefinery in Hugoton, Kansas, is the third cellulosic ethanol facility co-funded by the U.S. Department of Energy (DOE) to begin production at commercial scale since July 2013. The Department provides cost-shared funding to these first-of-a-kind facilities to help drive down technical risk and foster private investment in the growing U.S. bioeconomy. …
DOE awarded $97 million in cost-shared funding and a $132.4 million loan guarantee to facilitate the design, development, and construction of this landmark project. Like the INEOS biorefinery in Florida and the POET-DSM biorefinery in Iowa, Abengoa’s Hugoton facility is generating jobs, improving energy security, and reducing the greenhouse gases emitted over the lifecycle of this alternative fuel (relative to petroleum-based gasoline).
[935] Article: “NREL Science Central to Success of New Biofuels Projects: DuPont–NREL Partnership Delivered Key Innovations for Large Scale Cellulosic Ethanol Facility in Iowa.” By Bill Scanlon. U.S. Department of Energy, National Renewable Energy Laboratory, February 23, 2015. <www.nrel.gov>
The Energy Department’s National Renewable Energy Laboratory (NREL) played crucial roles in developing the technology that has led companies such as DuPont, POET, and Abengoa to open commercial-scale facilities to turn biomass into clean transportation fuels.
Combined, the three facilities are a huge step toward meeting the Department’s goals of producing clean energy from the non-food parts of plants, creating good American jobs, mitigating greenhouse gases, and boosting America’s energy security. …
The collaboration between NREL and DuPont got its start in 2002 when the Energy Department’s Bioenergy Technologies Office issued a funding opportunity announcement asking that companies collaborate with national laboratories to improve the process of making cellulosic ethanol. …
The CRADA [Cooperative Research and Development Agreement] with NREL and the technology transfer enabled DuPont to put together a package that includes all the steps of turning biomass into ethanol—pretreatment, enzymatic hydrolysis, and fermentation. The NREL team had the satisfaction of knowing that the process they helped pioneer had proven successful enough for DuPont to build a commercial scale facility.
“DuPont is leading the way in the commercialization of cellulosic ethanol,” states Jan Koninckx, Director DuPont Biofuels. “The work conducted with NREL has provided foundational science, and today, DuPont offers an integrated and demonstrated farm-to-fuel cellulosic ethanol solution that meets the demands of renewable fuel and chemical producers for a cost effective, sustainable, scalable technology.”
[936] Article: “DowDuPont to Exit Cellulosic Biofuels Business.” By Jim Lane. Biofuels Digest, November 2, 2017. <www.biofuelsdigest.com>
In an official statement, the company said:
As part of DowDuPont’s intent to create a leading Specialty Products Company, we are making a strategic shift in how we participate in the cellulosic biofuels market. While we still believe in the future of cellulosic biofuels we have concluded it is in our long-term interest to find a strategic buyer for our technology including the Nevada, IA biorefinery. …
As DowDuPont’s chief for Industrial Biosciences, William Feehery, explained to the Digest, “as we are racing to create an independent speciality products company, we came to the conclusion that this business just doesn’t really fit that [new] company. … [F]uels are not a speciality product.” …
In DowDuPont’s case, Feehery emphasized that the internal evolution of DowDuPont was the basis for the decision to exit cellulosic.
[937] Article: “Verbio Launches $115 Million Renewable Natural Gas, Ethanol Plant in Nevada; Touts Bigger Plans.” By Donnelle Eller. Des Moines Register, May 7, 2022. <www.desmoinesregister.com>
Calling the technology at a central Iowa biorefinery a game changer, corporate and elected officials marked the start of commercial production of renewable natural gas and ethanol at a $115 million central Iowa biorefinery Friday. …
The plant, occupying the site of the former DuPont cellulosic ethanol facility between Nevada and Ames on Lincolnway Highway, is expected when fully operational to make renewable natural gas that contains the energy equivalent of 19 million gallons of ethanol each year. It also will produce 60 million gallons of corn-based ethanol annually. …
… the company will buy 100,000 tons of the crop residue, known as corn stover, annually from central Iowa farmers, as well as 20 million bushels of corn to make ethanol.
[938] Article: “Dupont Sells Iowa Ethanol Plant to German Company; It Will Soon Make Renewable Natural Gas.” By Donnelle Eller. Des Moines Register, November 9, 2018. <www.desmoinesregister.com>
“The DuPont cellulosic ethanol plant in Nevada will be sold to a German biofuels company’s U.S. subsidiary, which plans to convert the plant to produce renewable natural gas.”
[939] Article: “Story County Plant Getting Iowa Tax Incentives to Resume Ethanol Production.” By Tyler Jett. Des Moines Register, March 19, 2021. Updated 3/23/2021. <www.desmoinesregister.com>
Verbio North American Corp. received $2.6 million in tax incentives from the Iowa Economic Development Authority on Friday to build an $80 million ethanol production line in its Nevada plant, previously the nation’s largest producer of an experimental variety of the renewable fuel.
… Verbio previously received incentives from the authority to produce renewable natural gas, which the company expects to go on line this fall.
[940] Press release: “EPA Actions Trigger Project Liberty Shift From Production to R&D.” POET-DSM, November 19, 2019. <poet.com>
POET-DSM Advanced Biofuels, LLC, a joint venture of Royal DSM and POET, LLC today announced that it will pause production of cellulosic biofuels at Project LIBERTY and shift to R&D focused on improving operational efficiency. This step is a result of EPA [U.S. Environmental Protection Agency] challenges with the implementation of the Renewable Fuel Standard (RFS). The joint venture will focus on R&D with the goal of improving mechanical reliability, creating additional technological efficiencies and licensing technology in countries which favorably support the use of low carbon fuels from crop residue and other biomass.
[941] Article: “Shuttered Iowa Ethanol Plant Settles Tax Incentive Deal.” Associated Press, October 20, 2020. <apnews.com>
The Iowa Economic Development Authority approved a settlement with Poet DSM Advanced Biofuels last week, ending a contract of incentives that helped enable construction of the massive plant, the Des Moines Register reported. The plant, which opened in 2014, was billed as an ultra-green bio-fuel producer that used corncobs, husks and stalks instead of corn to make ethanol.
Poet, the nation’s largest ethanol producer, idled the plant in July and laid off 52 workers this year.
[942] Article: “Abengoa Unit Files for U.S. Bankruptcy with Up to $10 Billion in Debt.” By Tom Hals and Tracy Rucinski. Reuters, February 24, 2016. <www.reuters.com>
Abengoa SA (ABG.MC) put its U.S. bioenergy unit into Chapter 11 bankruptcy on Wednesday with up to $10 billion in liabilities, the latest twist in the multinational parent’s race to avoid becoming Spain’s largest corporate failure.
The U.S. filing came as the Spanish company faced a March 28 deadline to agree on a wide-ranging restructuring plan with its banks and bondholders, without which it could be forced to declare bankruptcy.
The filing by Abengoa Bioenergy US Holding LLC was prompted by involuntary bankruptcy petitions against two subsidiaries earlier this month by grain suppliers, including Gavilon Grain LLC, the Farmers Cooperative Association, the Andersons Inc and Central Valley Ag.
[943] Article: “Bankruptcy Court OKs Synata Bio to Buy Hugoton Plant.” By Meghan Sapp. Biofuels Digest, December 1, 2016. <www.biofuelsdigest.com>
In Kansas, a district bankruptcy court has given Synata Bio the green light to buy Abengoa Bioenergy’s Hugoton cellulosic ethanol facility for $48.5 million despite Shell’s stalking horse bid of $26 million. Synata Bio submitted a $27.05 million qualified bid on Nov. 18, so when both companies went to auction on Nov. 21, Shell stopped at $40.75 million, leaving Synata Bio the winner. The deal that includes the plant, equipment, intellectual property for the production process and 400 acres is set to close on Dec. 5.
[944] Webpage: “Synata Bio, Inc.” Synata Bio. Accessed May 10, 2018 at <www.globalsyngas.org>
Synata is the Premiere High Efficiency GTL Platform
• Novel, simple and efficient gas-to-liquids (GTL) technology for converting syngas to products
• Syngas input harmonizes all feedstocks (natural gas, coal, H2, biomass, MSW [municipal solid waste]), making the technology truly feedstock agnostic
• Proprietary, non-GMO [genetically modified organism] biocatalysts coupled with proven and scalable fermentation design
[945] Article: “Renewable Diesel to Launch in Hugoton.” By Todd Neeley. DTN, May 17, 2021. <www.dtnpf.com>
Seaboard Energy announced at the end of April plans to complete construction of a plant by Dec. 31, 2021, on the former Abengoa Bioenergy SA site in Hugoton. …
Seaboard expects to blend and ship biodiesel from the company’s other biodiesel plants in Guymon, Oklahoma, and St. Joseph, Missouri, from the 800-acre site in Hugoton. …
Near the end of 2016, Synata Bio Inc. bought the plant at auction with a top bid of $48.5 million. Synata then sold the plant to High Plains Bioenergy in February 2019, which changed its name to Seaboard.
[946] Webpage: “Hydropower Technologies.” U.S. Energy Information Administration. Last updated August 14, 2013. <energy.gov>
“Hydropower technologies use flowing water to create energy that can be captured and turned into electricity. Both large and small-scale power producers can use hydropower technologies to produce clean electricity.”
[947] Webpage: “Large-Scale Hydropower.” U.S. Energy Information Administration, Office of Energy Efficiency & Renewable Energy. Last updated August 14, 2013. <energy.gov>
“Most large-scale hydropower projects use a dam and a reservoir to retain water from a river. When the stored water is released, it passes through and rotates turbines, which spin generators to produce electricity.”
[948] Booklet: “Energy, Powering Your World.” By M.T. Westra and S. Kuyvenhoven. Foundation for Fundamental Research on Matter, Institute for Plasma Physics, Rijnhuizen (the Netherlands), 2002. <fire.pppl.gov>
Page 27: “In an electrical generator electricity is made by turning a magnet in a magnetic field. The changing magnetic field drives the electrical current. With the exception of solar cells and fuel cells (which are discussed in chapters 4 and 6), all ways of generating electricity in some way drive a generator of this type.”
[949] Webpage: “Hydropower Technologies.” U.S. Energy Information Administration. Last updated August 14, 2013. <energy.gov>
[950] Booklet: “Energy, Powering Your World.” By M.T. Westra and S. Kuyvenhoven. Foundation for Fundamental Research on Matter, Institute for Plasma Physics, Rijnhuizen (the Netherlands), 2002. <fire.pppl.gov>
Page 5: “The power of falling water also has a long history. As early as 4000 B.C., water wheels were used in Greece to power small mills to grind corn, supply drinking water to villages, and drive a variety of machines such as saw mills, pumps, forge bellows, and so on.”
Page 7: “In the mid 1800’s, the construction of small dams to generate electricity from hydro power began, and at the end of the 1800’s, people experimented on generating electricity by windmills.”
[951] Article: “Water Power.” By Vijay P. Singh (Department of Civil and Environmental Engineering, Louisiana State University). World Book Encyclopedia, 2007 Deluxe Edition.
“The first water-powered plant for generating electricity was built in Appleton, Wisconsin, in 1882. This hydroelectric plant established water power as a major source of electricity. Hydroelectric power is now used all over the world.”
[952] Webpage: “History of Hydro.” National Hydropower Association. Accessed September 24, 2013 at <www.hydro.org>
“The precursor to the modern hydro turbine was developed in the mid-18th century. One hundred years later, inventors were steadily improving the efficiency of these technologies. In 1849, an engineer named James Francis developed the Francis Turbine, the type of turbine that is most widely used today.”
[953] Webpage: “History of Hydropower.” U.S. Department of Energy, Water Power Program. Last updated September 19, 2011. <www.energy.gov>
Humans have been harnessing water to perform work for thousands of years. The Greeks used water wheels for grinding wheat into flour more than 2,000 years ago. Besides grinding flour, the power of the water was used to saw wood and power textile mills and manufacturing plants.
For more than a century, the technology for using falling water to create hydroelectricity has existed. The evolution of the modern hydropower turbine began in the mid-1700s when a French hydraulic and military engineer, Bernard Forest de Bélidor wrote Architecture Hydraulique. In this four volume work, he described using a vertical-axis versus a horizontal-axis machine.
During the 1700s and 1800s, water turbine development continued. In 1880, a brush arc light dynamo driven by a water turbine was used to provide theatre and storefront lighting in Grand Rapids, Michigan; and in 1881, a brush dynamo connected to a turbine in a flour mill provided street lighting at Niagara Falls, New York. These two projects used direct-current technology.
Alternating current is used today. That breakthrough came when the electric generator was coupled to the turbine, which resulted in the world’s, and the United States’, first hydroelectric plant located in Appleton, Wisconsin, in 1882.
[954] Webpage: “U.S. Hydropower Output Varies Dramatically From Year to Year.” U.S. Energy Information Administration, August 15, 2011. <www.eia.gov>
“Annual weather and precipitation cycles affect hydropower production. The hydroelectric resource potential depends on a combination of rainwater draining directly into waterways and the level of accumulated snowpack in mountainous regions that eventually melts and becomes run-off.”
[955] Calculated with data from the report: “July 2022 Monthly Energy Review.” U.S. Energy Information Administration, Office of Energy Statistics, July 26, 2022. <www.eia.gov>
Page 7: “Table 1.3. Primary Energy Consumption by Source (Quadrillion Btu)”
NOTE: An Excel file containing the data and calculations is available upon request.
[956] Calculated with data from the report: “July 2022 Monthly Energy Review.” U.S. Energy Information Administration, Office of Energy Statistics, July 26, 2022. <www.eia.gov>
Page 131: “Table 7.2a. Electricity Net Generation: Total (All Sectors)”
NOTE: An Excel file containing the data and calculations is available upon request.
[957] Webpage: “Large-Scale Hydropower Basics.” U.S. Energy Information Administration, Office of Energy Efficiency & Renewable Energy. Last updated April 14, 2013. <energy.gov>
Most large-scale hydropower projects use a dam and a reservoir to retain water from a river. When the stored water is released, it passes through and rotates turbines, which spin generators to produce electricity. Water stored in a reservoir can be accessed quickly for use during times when the demand for electricity is high.
Dammed hydropower projects can also be built as power storage facilities. During periods of peak electricity demand, these facilities operate much like a traditional hydropower plant—water released from the upper reservoir passes through turbines, which spins generators to produce electricity. However, during periods of low electricity use, electricity from the grid is used to spin the turbines backward, which causes the turbines to pump water from a river or lower reservoir to an upper reservoir, where the water can be stored until the demand for electricity is high again.
[958] Report: “Annual Energy Review 2011.” U.S. Energy Information Administration, Office of Energy Statistics, September 2012. <www.eia.gov>
Page 358:
Hydroelectric Pumped Storage: Hydroelectric power that is generated during peak load periods by using water previously pumped into an elevated storage reservoir during off-peak periods when excess generating capacity is available to do so. When additional generating capacity is needed, the water can be released from the reservoir through a conduit to turbine generators located in an electric power plant at a lower level.
[959] Article: “How Dams Vary and Why It Matters for the Emerging Science of Dam Removal.” By N. Leroy Poff and David D. Hart. BioScience, August 2002. Pages 659–668. <academic.oup.com>
Page 660: “Many hydropower dams operate to produce dramatic daily flow variation….”
[960] Webpage: “Demand for Electricity Changes Through the Day.” U.S. Energy Information Administration, April 6, 2011. <www.eia.gov>
“Electric power systems must match generation and load in real time, with tight tolerances. As a result, both system stress and prices can vary considerably throughout the day. … Load curve shapes vary among regions and change with the season of the year.”
[961] Booklet: “Energy, Powering Your World.” By M.T. Westra and S. Kuyvenhoven. Foundation for Fundamental Research on Matter, Institute for Plasma Physics, Rijnhuizen (the Netherlands), 2002. <fire.pppl.gov>
Page 34:
When a new dam is planned in an area where people live, many people will have to leave their homes, which will be flooded by the storage lake. … In total, around 40 to 80 million people were displaced because of dam projects during the last century.
Another problem with big storage lakes is the environmental damage done to the flooded area, and the release of methane by rotting plants in the storage lakes. Methane is a powerful greenhouse gas, and adds to the increased global warming. Also the threat of possible accidents to the dam has to be considered.
[962] Webpage: “Large-Scale Hydropower Basics.” U.S. Energy Information Administration, Office of Energy Efficiency & Renewable Energy. Last updated April 14, 2013. <energy.gov>
“Many large-scale dam projects have been criticized for altering wildlife habitats, impeding fish migration, and affecting water quality and flow patterns.”
[963] Article: “How Dams Vary and Why It Matters for the Emerging Science of Dam Removal.” By N. Leroy Poff and David D. Hart. BioScience, August 2002. Pages 659–668. <academic.oup.com>
Pages 659–660:
[T]he central justification for removing dams from an environmental perspective is that they adversely impact the structure and function of river ecosystems. Both individually and cumulatively, dams fundamentally transform river ecosystems in several ways: (a) They alter the downstream flux of water and sediment, which modifies biogeochemical cycles as well as the structure and dynamics of aquatic and riparian habitats. (b) They change water temperatures, which influences organismal bioenergetics and vital rates. (c) And they create barriers to upstream–downstream movement of organisms and nutrients, which hinders biotic exchange. These fundamental alterations have significant ecological ramifications at a range of spatial and temporal scales.
NOTE: The paragraphs that follow the above-quoted excerpt provide further detail on these environmental effects.
[964] Article: “BPA [Bonneville Power Administration] Curtails Wind Power Generators During High Hydropower Conditions.” U.S. Energy Information Administration, June 15, 2011. <www.eia.gov>
Dam operators have regulatory limits on how much water they can “spill” over a dam. Spilling churns air into the water and increases the concentration of dissolved nitrogen, which can give fish gas bubble disease (like the bends). Since many of these fish are protected under the Endangered Species Act, as much water as possible is brought through the turbines to generate electricity, avoiding contact with air.
[965] Webpage: “Large-Scale Hydropower Basics.” U.S. Energy Information Administration, Office of Energy Efficiency & Renewable Energy. Last updated April 14, 2013. <energy.gov>
“Research and development efforts have succeeded in reducing many of these environmental impacts through the use of fish ladders (to aid fish migration), fish screens, new turbine designs, and reservoir aeration.”
[966] Calculated with data from the webpage: “Benefits of Dams.” U.S. Department of Homeland Security, Federal Emergency Management Agency. Last updated October 22, 2019. <www.fema.gov>
This page describes various important roles that dams play in the United States. It is geared toward general audiences that wish to learn more about the purpose of dams and what impact they have in their lives and communities.
Dams provide a range of economic, environmental, and social benefits, including recreation, flood control, water supply, hydroelectric power, waste management, river navigation, and wildlife habitat.
Recreation [=] 38.4% … Flood Control [=] 17.7% … Fire & Farm Ponds [=] 17.1% … Irrigation [=] 11.0% … Tailings & Other [=] 8.0% … Undetermined [=] 3.8% … Hydroelectric [=] 2.9% … Debris Control [=] 0.8% … Navigation [=] 0.4%
• Recreation Dams provide prime recreational facilities throughout the United States. Boating, skiing, camping, picnic areas, and boat launch facilities are all supported by dams.
• Flood Control In addition to helping farmers, dams help prevent the loss of life and property caused by flooding. Flood control dams impound floodwaters and then either release them under control to the river below the dam or store or divert the water for other uses. For centuries, people have built dams to help control devastating floods.
• Water Storage (Fire & Farm Ponds) Dams create reservoirs throughout the United States that supply water for many uses, including industrial, municipal, and agricultural.
• Irrigation Ten percent of American cropland is irrigated using water stored behind dams. Thousands of jobs are tied to producing crops grown with irrigated water.
• Mine Tailings There are more than 1,300 mine tailings impoundments in the United States that allow the mining and processing of coal and other vital minerals while protecting the environment.
• Electrical Generation The United States is one of the largest producers of hydropower in the world, second only to Canada. Dams produce over 103,800 megawatts of renewable electricity and meet 8 to 12 percent of the Nation's power needs. Hydropower is considered clean because it does not contribute to global warming, air pollution, acid rain, or ozone depletion.
• Debris Control In some instances, dams provide enhanced environmental protection, such as the retention of hazardous materials and detrimental sedimentation.
• Navigation Dams and locks provide for a stable system of inland river transportation throughout the heartland of the Nation.
CALCULATION: 8.0% Tailings & Other + 3.8% Undetermined + 0.8% Debris Control + 0.4% Navigation = 13% Other purposes
[967] Calculated with data from the report: “An Assessment of Energy Potential at Non-Powered Dams in the United States.” By Boualem Hadjerioua and others. Oak Ridge National Laboratory, April 2012. <www1.eere.energy.gov>
Page vii:
[H]ydropower-producing facilities represent only a fraction of the infrastructure development that has taken place on the nation’s waterways. In contrast to the roughly 2,500 dams that provide 78 gigawatts (GW)1 of conventional and 22 GW of pumped-storage hydropower, the United States has more than 80,000 non-powered dams (NPDs)—dams that do not produce electricity—providing a variety of services ranging from water supply to inland navigation.
CALCULATION: 2,500 powered dams / (80,000 non powered dams + 2,500 powered dams) = 3.0%
[968] Article: “How Dams Vary and Why It Matters for the Emerging Science of Dam Removal.” By N. Leroy Poff and David D. Hart. BioScience, August 2002. Pages 659–668. <academic.oup.com>
Page 659:
The damming of streams and rivers has been integral to human population growth and technological innovation. Among other things, dams have reduced flood hazard and allowed humans to settle and farm productive alluvial soils on river floodplains; they have harnessed the power of moving water for commerce and industry; and they have created reservoirs to augment the supply of water during periods of drought.
[969] Report: “An Assessment of Energy Potential at Non-Powered Dams in the United States.” By Boualem Hadjerioua and others. Oak Ridge National Laboratory, April 2012. <www1.eere.energy.gov>
Pages vii–viii:
Importantly, many of the monetary costs and environmental impacts of dam construction have already been incurred at NPDs [non-powered dams], so adding power to the existing dam structure can often be achieved at lower cost, with less risk, and in a shorter timeframe than development requiring new dam construction. The abundance, cost, and environmental favorability of NPDs, combined with the reliability and predictability of hydropower, make these dams a highly attractive source for expanding the nation’s renewable energy supply.
To better characterize this unique national resource, the U.S. Department of Energy (DOE) Wind and Water Power Program has undertaken a national-scale analysis of U.S. dams to determine the ability of NPDs to provide hydroelectric power. DOE’s Oak Ridge National Laboratory (ORNL), with input from DOE’s Idaho National Laboratory, quantified the potential capacity and generation available from adding power production capability to U.S. NPDs. Of the more than 80,000 NPDs throughout the U.S., 54,391 dams were analyzed, with remaining dams eliminated from consideration due to erroneous geographic information, or erroneous flow or drainage area attributes that could not be resolved and corrected through independent investigation of maps and records. Anecdotal information suggests that these dams with missing or erroneous information are likely to be relatively small or have low potential to produce hydroelectric energy. Dams with a reported height of less than five feet were also excluded from analysis. A thorough quality control and review process ensured that the 54,391 remaining NPDs were analyzed and characterized as accurately as possible. Figure ES-1 demonstrates the spatial and capacity potential distribution of the nation’s NPDs. Electric generating capacities included in the report were calculated using the assumption that all water passing a facility would be available for conversion into electrical energy and that hydraulic head at the facility would remain constant. The analysis did not consider the economic feasibility of developing each unpowered facility. The assessment provides preliminary information for stakeholders (such as developers, municipal planners, and policymakers), who can further evaluate the potential to increase hydropower production at NPD sites. Developers could use the information provided in this assessment to focus on more detailed analysis of sites that demonstrate a reasonable potential for being developed.
Adding power to U.S. NPDs has the potential to add up to 12 GW (12,000 megawatts or MW) of new renewable capacity—a potential equivalent to increasing the size of the existing conventional hydropower fleet by 15%. A majority of this potential is concentrated in just 100 NPDs, which could contribute approximately 8 GW of clean, reliable hydropower; the top 10 facilities alone could add up to 3 GW of new hydropower. Eighty-one of the 100 top NPDs are U.S. Army Corps of Engineers (USACE) facilities, many of which, including all of the top 10, are navigation locks on the Ohio River, Mississippi River, Alabama River, and Arkansas River, as well as their major tributaries. This study also shows that dams owned by the U.S. Bureau of Reclamation hold the potential to add approximately 260 MW of capacity; the Bureau has also engaged in an effort to conduct a more detailed evaluation of its own facilities.
1 1 gigawatt (GW)=1,000 megawatts (MW). On an annual basis, 1 MW of hydropower produces enough electricity to power nearly 400 U.S. homes. Each gigawatt could power up to 400,000 homes.
[970] Webpage: “Large-Scale Hydropower Basics.” U.S. Energy Information Administration, Office of Energy Efficiency & Renewable Energy. Last updated April 14, 2013. <energy.gov>
“A third type of hydropower project, called run of the river, does not require large impoundment dams (although it may require a small, less obtrusive dam). Instead, a portion of a river’s water is diverted into a canal or pipe to spin turbines.”
[971] Report: “Feasibility Assessment of the Water Energy Resources of the United States for New Low Power and Small Hydro Classes of Hydroelectric Plants.” By Douglas G. Hall and others. Idaho National Laboratory, January 2006. <www.energy.gov>
Page v:
In the present study, the water energy resource sites that were identified in the prior study were evaluated to determine the feasibility of their development using a set of feasibility criteria. These criteria considered site accessibility, load or transmission proximity, and land use or environmental sensitivities that would make development unlikely. Water energy resource sites that met the feasibility criteria were designated as feasible potential project sites. More realistic estimates of the power potential of these sites were determined by assuming a development model not requiring a dam obstructing the watercourse or the formation of a reservoir. The development model included a penstock running parallel to the stream, culminating in a powerhouse whose tailwater returned the working flow to the stream. It was assumed that only a low power (<1 MWa) or small hydro (≥1 MWa and ≤30 MWa) plant would be installed at the site. The working flow was restricted to half the stream flow rate at the site or sufficient flow to produce 30 MWa, whichever was less.
Page xviii:
Penstock A pipe conducting water from the point of takeoff on a stream to a turbine. …
Gross power potential Ideal hydroelectric power based on an annual mean flow rate and an associated gross hydraulic head having units of MWa (average megawatts) in this report. The actual value in any given year will usually differ from the predicted value because of annual variations in annual mean flow rate. (Note: in the case of the developed power potential of an actual hydroelectric plant, annual mean power [average power] of the plant is used as the developed power potential.)
Page 1:
During the 2002 to 2004 timeframe, INL [Idaho National Laboratory] conducted regional assessments and then a national assessment of the power potential of all streams in the study area culminating in a report documenting the power potential of all United States natural streams (Hall et al. 2004). This comprehensive assessment conducted in conjunction with the U.S. Geological Survey (USGS) used state-of-the-art digital elevation models and geographic information system (GIS) tools to estimate the power potential of a mathematical analog of every stream segment in the country. Summing the estimated power potential of all stream segments provided an estimate of the total power potential of U.S. natural streams. The study only assessed water energy resources associated with natural water courses (constructed waterways, tides, waves, and ocean currents were not included).
Page 2:
Feasibility criteria including exclusion of development, site accessibility, and transmission and load proximity were used to identify which water energy resource sites are locations for feasible potential projects. Development criteria regarding working flow rate and realistic penstock lengths were used to determine estimates of the realistic power potential of the feasible potential projects. The low power or small hydro project model that was used assumed power production without total stream impoundment or the creation of a reservoir.
Page 7:
The power classes are defined on the basis of annual average power [Pa = Annual Generation/Annual Hours (8,760 hr)] rather than by design capacity. They include:
• Low power: Pa < 1 MWa
• Small hydro: 1 MWa ≤ Pa ≤ 30 MWa
• Large hydro: Pa > 30 MWa.
Page 9:
The gross power potential of each water energy resource site was defined by the annual mean flow rate of the associated reach and gross hydraulic head equal to the elevation difference between the upstream and downstream ends of the reach. Use of the entire reach flow and installations of penstocks of 10,000 ft long on average, which was the average reach length, are not realistic for most low power and small hydro plants. It was, therefore, necessary to define a basic model for site development incorporating limitations on both the usable flow and the penstock length to estimate the true hydropower potential of the site.
The basic development model assumed was a hydroelectric plant producing power at an annual average rate of 30 MWa or less. The plant configuration did not include a dam obstructing the main stream channel and did not include water impoundment in its operation.
Page 19:
The water energy resource site population on which the feasibility assessment was performed included 500,157 sites representing a total gross power potential of 297,436 MWa. The distribution of these sites and their associated gross power potential on the basis of four categories … is shown in Figure 11. …
Total Resource Potential [=] 297,436 MWa
Excluded Potential [=] 97,845 MWa (33%)
Feasible Potential [=] 98,700 MWa (33%)
Other Available Potential [=] 76,807 MWa (26%)
Pages 22–23:
The distribution of feasible potential project sites and their associated hydropower potential is shown in Figure 13. This figure shows the results of applying the development criteria to obtain better estimates of hydropower potential. The nearly 130,000 feasible project sites, which had a total gross power potential of nearly 100,000 MWa, were found to realistically offer 30,000 MWa of hydropower potential. This is not surprising considering that the development criteria of using half the site’s flow or less resulted in at least halving of the possible amount of hydropower potential compared to the gross power potential. The working flow rate restriction may be overly conservative resulting in more total hydropower potential than that estimated by the study. …
It is essential that the total hydropower potential of approximately 30,000 MWa not be interpreted to be same as 30,000 MW of likely capacity increase potential identified in a site-based resource assessment conducted during the 1990s by INL (Connor et al. 1998). While the numerical values are the same, the units and associated generation potential are not. The hydropower potential estimated by the present study is annual mean power. This power value translates directly to generation power when multiplied by the number of hours in a year (8760 hr). …
The information shown in Figure 13 is put in perspective by comparison with information about the present U.S. plant population shown in Figure 2. The 30,000 MWa of hydropower potential estimated by this study is comparable to the total average power of the existing plant population, which is between 25,000 and 35,000 MWa as discussed above. However, considering that the present plant population numbers on the order of 2,400 plants (not counting pumped storage plants), it is clear that 130,000 projects will not get built in the foreseeable future, which would double U.S. annual hydropower generation. The fact that the study identified this many feasible projects does indicate a significant number of opportunities for new hydropower development. Development that is more realistic is represented by the 5,400 new small hydro projects identified by the study as shown in Figure 13. These potential projects represent nearly 20,000 MWa of hydropower potential, which would increase in U.S. annual hydropower generation by more than 50%, if they were developed.
Page 35:
This study has refined the results of the previous assessment of the water energy resources of the United States (Hall et al. 2004) by accounting for environmentally sensitive areas as zones in which hydropower development is unlikely. It has extended the previous study by identifying water energy resource sites that are feasible to develop and estimated their hydropower potential based on a realistic development model and associated development constraints. Of the approximately 300,000 MWa of total, gross power potential of U.S. natural stream water energy resources, only about 10% has been developed. About 30% are located in zones where development is unlikely. The remaining 60% of over 170,000 MWa have not been developed and are not restricted from development based on information sources used in the assessment. Of this potential, it was found that nearly 100,000 MWa of gross power potential could feasibly be developed. This feasible potential corresponds to nearly 130,000 potential low power and small hydro projects. Estimation of the hydropower potential of these sites indicates 30,000 MWa of new power supply could feasibly be developed in the United States. …
Water energy resource sites were designated as being feasible for development in this study based on a set of feasibility criteria. Local land use, policies, and environmental sensitivities not accounted for in the study may render some of the identified potential projects unfeasible. Economic factors may also affect the development viability of some sites. The study also did not include a comprehensive assessment of the economic viability of the identified potential projects. An elementary consideration was given to acceptable costs of site accessibility and power transmission. However, the costs of licensing, construction, mitigation, operation and maintenance, availability of financing, and the potential income from purchased power were not evaluated.
Page A-3:
Appendix A
Description of Exclusion Zones
In this study, exclusion zones were areas in which development of new hydroelectric plants is highly unlikely either because of land use designated by federal statutes and policies or because of known environmental sensitivities. These zones were used to apply the feasibility criteria stipulating that a water energy resource site must not be located in an exclusion zone if it is to be designated as a feasible potential project. Geographic information system (GIS) tools were used to determine whether any part of a stream reach corresponding to a water energy resource site intersected the polygon area representing the exclusion zone. If any part of the reach intersected the zone, the site was designated as unfeasible for development. However, if no part of the reach intersected the zone, no matter how close to the zone boundary it is, the exclusion zone feasibility criteria were considered to be met affirmatively. The two sections of this appendix each describe one of the two types of exclusion zones used in the study and the data that was used for analysis.
States, regional jurisdictions, and local jurisdictions have also designated protected areas that are most likely excluded from hydropower development. However, information regarding these protected areas is scattered among numerous state, regional, and local government agencies. Much of this information is not yet in digital format, and much of the digital data are not available online.
[972] “Small Hydropower Technology: Summary Report on a Summit Meeting Convened by Oak Ridge National Laboratory, the National Hydropower Association, and the Hydropower Research Foundation.” Oak Ridge National Laboratory, April 7–8, 2010. <www.hydro.org>
Page 5:
Operations and Maintenance – the scale of small hydropower power plants makes maintenance relatively costly because no electricity is generated when the power plants are taken off line to perform maintenance. Development of service outage plans can reduce costs by allowing facilities to reduce down time and would facilitate more effective maintenance by giving a clear plan to maintenance issues to be addressed during the down time.
Along with outage planning, a better assessment of hydropower component replacement timelines and costs can lead to decreased maintenance costs. Bearings and seals fail and lead to costly maintenance. The age of many of the dams is a concern, because it involves safety issues, and long-term upgrades are the biggest capital costs.
Page 8:
Similarly, the costs for grid interconnections for small projects are equal to those for large projects. Forming a node with an independent system operator or public utility is costly. The costs of $400,000–$500,000 are the same for small and large hydropower projects. Required interconnection equipment is not optimized and is usually of a larger scale than is required for most small hydropower projects. In order to be eligible, the output usually must be 10MW or larger, which excludes some small hydropower. Feeding directly to an end user improves cost effectiveness, but still must deal with varying requirements and requires a nearby end user with a high load demand. In addition to a lack of small hydropower-specific standards for interconnections, each installation site can have varying requirements set by states and utilities, which further drive up costs and require custom designs. Excitation equipment is designed for large hydropower, so small hydropower projects must modify the equipment, which is not cost effective. Solutions to these needs and challenges are necessary to further commercialize small hydropower.
[973] Report: “Annual Energy Review 2011.” U.S. Energy Information Administration, Office of Energy Statistics, September 2012. <www.eia.gov>
Page 370: “Wind Energy: Kinetic energy present in wind motion that can be converted to mechanical energy for driving pumps, mills, and electric power generators.”
[974] Webpage: “Wind Turbines.” U.S. Energy Information Administration, Office of Energy Efficiency & Renewable Energy. Last updated April 22, 2013. <www.eere.energy.gov>
[975] Booklet: “Energy, Powering Your World.” By M.T. Westra and S. Kuyvenhoven. Foundation for Fundamental Research on Matter, Institute for Plasma Physics, Rijnhuizen (the Netherlands), 2002. <fire.pppl.gov>
Page 5: “As early as 5000 B.C., wind energy was used to propel ships on the Nile River, and several centuries before Christ, windmills were used in China to pump water. Around A.D. 600, windmills were used in Persia to grind grain.”
[976] Calculated with data from the report: “July 2022 Monthly Energy Review.” U.S. Energy Information Administration, Office of Energy Statistics, July 26, 2022. <www.eia.gov>
Page 7: “Table 1.3. Primary Energy Consumption by Source (Quadrillion Btu)”
Page 179: “Table 10.1. Renewable Energy Production and Consumption by Source (Trillion Btu)”
NOTE: An Excel file containing the data and calculations is available upon request.
[977] Calculated with data from the report: “July 2022 Monthly Energy Review.” U.S. Energy Information Administration, Office of Energy Statistics, July 26, 2022. <www.eia.gov>
Page 131: “Table 7.2a. Electricity Net Generation: Total (All Sectors)”
NOTE: An Excel file containing the data and calculations is available upon request.
[978] Webpage: “Overview of Wind Energy in California.” California Energy Commission. Accessed October 3, 2013 at <www.energy.ca.gov>
“Utility-scale wind farms are generally located in areas with average annual wind speeds of at least 13 miles per hour.”
[979] Report: “Wind Energy Basics.” GE Energy, 2009. <renewables.gepower.com>
Page 3: “This document is intended to provide general information on megawatt-scale wind turbines and the wind plant development process in North America. The guidance is general in nature, and is based on the published advice of recognized industry associations such as the American Wind Energy Association (AWEA).”
Page 4:
Simple resource classification provided by AWEA based on average wind speed:
– Moderate: 6.4–7 m/s (14.3–15.6 mph) IEC3 Wind Turbine Class IV
– Good: 7–7.5 m/s (15.6–16.7 mph) IEC [International Electrotechnical Commission] Wind Turbine Class III
– Excellent: >7.5 m/s (16.7 mph) IEC Wind Turbine Class III, II or I
Page 5:
Siting Considerations
Siting wind turbines and assessing the feasibility of a proposed location must consider factors such as:
• Wind resource characteristics, including extreme wind conditions
• Setback requirements (distance to publicly accessible areas), and spacing between turbines
• Proximity to existing infrastructure including transmission lines and roads with adequate capacity to serve the wind plant
• Environmental impact, including avian, bat and other biological considerations
• Seismic activity, noise constraints, altitude, corrosion, and extreme temperatures
• Community acceptance and compatibility with adjacent land uses
Depending on setback requirements tens of acres might be necessary to house a single GE 1.5MW turbine. Hence, megawatt-scale wind turbines cannot be located in densely populated areas. …
Minimize the amount of transmission infrastructure, if possible—building high voltage lines can be very expensive.
[980] Report: “Transmitting Wind Energy Issues and Options in Competitive Electric Markets.” By Andrew Brown. National Conference of State Legislatures and National Wind Coordinating Committee, January 1999. <www.nrel.gov>
Page 1: “Wind development must occur where the wind resource is, which may or may not be near customer load or transmission systems. Promising sites also may be more remote from load centers than sites that are available to competing fossil-fired resources.”
[981] Report: “Challenges of Electric Power Industry Restructuring for Fuel Suppliers.” U.S. Energy Information Administration, September 1998. <www.eia.gov>
Page 86: “While wind power has no air emissions, it does have other impacts on the environment. These are visual obstruction, bird kills, and noise pollution. Mitigation measures are frequently taken to resolve these problems.”
[982] “Energy Primer: A Handbook of Energy Market Basics.” Federal Energy Regulatory Commission, November 2015. <www.ferc.gov>
Page 53: “Because the best wind resources are often far from load centers, obtaining sufficient transmission presents a challenge to delivering its output.”
[983] Book: Electric Power Generation, Transmission, and Distribution (2nd edition). Edited by Leonard L. Grigsby. CRC Press, 2007.
Chapter 1: “Wind Power.” By Gary L. Johnson. Pages 1-1–1-7.
Page 1-4: “Wind speeds vary with the time of day, time of year, height above ground, and location on the earth’s surface.”
Page 1-5: “There can be a factor of two between a poor month and an excellent month…. There will not be as much variation from one year to the next, perhaps 10 to 20%.”
[984] Webpage: “Overview of Wind Energy in California.” California Energy Commission. Accessed October 3, 2013 at <www.energy.ca.gov>
Utility-scale wind farms are generally located in areas with average annual wind speeds of at least 13 miles per hour. …
Wind power is more available during certain seasons because climatic conditions affect wind speed. In California, wind speeds are highest in the hot summer months, and approximately three-fourths of all annual wind power output is produced during the spring and summer.
[985] Booklet: “Energy, Powering Your World.” By M.T. Westra and S. Kuyvenhoven. Foundation for Fundamental Research on Matter, Institute for Plasma Physics, Rijnhuizen (the Netherlands), 2002. <fire.pppl.gov>
Page 37: “Another problem is that sometimes there is no wind. This situation can occasionally last many days, and may happen over a large part of Europe simultaneously. Another way of saying this is that wind power (and also solar power) is intermittent, which means that that the electricity is generated very irregularly.”
[986] Report: “Challenges of Electric Power Industry Restructuring for Fuel Suppliers.” U.S. Energy Information Administration, September 1998. <www.eia.gov>
Page 86: “Another major issue regarding wind intermittency is that wind power can offer energy, but not on-demand capacity. Even at the best sites, there are times when the wind does not blow sufficiently and no electricity is generated.”
[987] Article: “Electricity Systems Adjust Operations to Growing Wind Power Output.” U.S. Energy Information Administration, March 25, 2011. Corrected 3/28/11. <www.eia.gov>
Wind generators are subject to abrupt changes in wind speed, and their power output is characterized by steep ramps up or down. Power systems handle such moment-to-moment changes in intermittent generation just as they handle small fluctuations in demand: certain generators automatically raise or lower their output in response to imbalances between supply and demand.
[988] For one of many examples: “Remarks by the President in the State of the Union Address.” Obama Administration White House, February 12, 2013. <www.whitehouse.gov>
“Last year, wind energy added nearly half of all new power capacity in America. So let’s generate even more.”
[989] Booklet: “Energy, Powering Your World.” By M.T. Westra and S. Kuyvenhoven. Foundation for Fundamental Research on Matter, Institute for Plasma Physics, Rijnhuizen (the Netherlands), 2002. <fire.pppl.gov>
Page 37:
Wind turbines come with a label that says how much power they can generate. For example, there are 750 kW turbines, and larger ones, 1.5 MW to 2.5 MW. This figure is the peak output (or maximum capacity) of the turbine, which is the amount of power the turbine generates when the wind is optimal. When people talk about the “installed capacity of wind power”, they use these figures.
The energy that is delivered by a wind turbine depends on the number of hours it can operate each year. This of course depends on the weather condition. In fact, averaged over a year, a wind turbine delivers about 20–30% of its potential energy output. The difference between the actual yearly energy and the theoretical maximum is called the capacity factor. So on average, a wind turbine of 1.5 MW delivers about 4200 MWh per year. So on average during the year, it is as if the turbine had power of about 300 to 450 kW, instead of 1,500 kW.
[990] “2010 Solar Technologies Market Report.” U.S. Department of Energy, Office of Energy Efficiency and Renewable Energy, National Renewable Energy Laboratory, November 2011. <www.nrel.gov>
Page 55: “Capacity factor is the ratio of an energy-generation system’s actual energy output during a given period to the energy output that would have been generated if the system ran at full capacity for the entire period.”
[991] Calculated with data from the report: “Electric Power Annual 2020.” U.S. Energy Information Administration, Assistant Administrator for Energy Statistics, October 29, 2021. Updated 3/10/22. <www.eia.gov>
Pages 11– 12 (of PDF): “Table 1.2. Summary Statistics for the United States, 2010–2020 (From Tables 3.1.A. and 3.1.B.) Net Generation (Thousand Megawatthours)”
Pages 12–13 (of PDF): “Table 1.2. Summary Statistics for the United States, 2010–2020 (From Tables 4.2.A. and 4.2.B.) Net Summer Generating Capacity (Megawatts)”
NOTE: An Excel file containing the data and calculations is available upon request.
[992] Booklet: “Energy, Powering Your World.” By M.T. Westra and S. Kuyvenhoven. Foundation for Fundamental Research on Matter, Institute for Plasma Physics, Rijnhuizen (the Netherlands), 2002. <fire.pppl.gov>
Page 26: “The main difference between fossil fuels and electricity is that fossil fuels are easy to store, and electricity is not. Fossil fuels can be stored close to where they are used, for example in the fuel tank of a car. Most of the electricity you use is generated a fraction of a second before it is consumed.”
[993] Textbook: Energy Economics: Concepts, Issues, Markets and Governance. By Subhes C. Bhattacharyya. Springer-Verlag, 2011.
Page 13: “Before consumption, some storage may be required for some forms of energy, while for electricity no practical and economic storage solution exists.”
[994] “Kansas Energy Report 2009.” Kansas Energy Council, January 7, 2009. <www.justfacts.com>
Page 26: “Electricity differs from other commodities in that it can not be stored on a commercial scale: in other words, electricity stored through currently available mechanical and chemical means encounters very large losses in efficiency.”
[995] Report: “Natural Gas-Electricity Primer.” By Randy Friedman and others. Pacific Northwest Utilities Conference Committee/Northwest Natural Gas Association Planning Task Force, August 2012. <docplayer.net>
Page 12: “However, electricity supply and demand must be balanced on a real-time basis in very short intervals (measured in seconds).”
[996] Report: “Energy Primer: A Handbook of Energy Market Basics.” Federal Energy Regulatory Commission, November 2015. <www.ferc.gov>
Page 49:
Unlike many other products, electricity cannot be stored in any appreciable quantities. Further, electricity is a necessity for most consumers, whose use responds little to price changes. Finally, electric equipment and appliances are tuned to a very specific standard of power, measured as voltage. Deviations in voltage can cause devices to operate poorly or may even damage them. Consequently, the supply side of the electric market must provide and deliver exactly the amount of power customers want at all times, at all locations. This requires constant monitoring of the grid and close coordination among industry participants.
[997] Article: “Electricity Systems Adjust Operations to Growing Wind Power Output.” U.S. Energy Information Administration, March 25, 2011. Corrected 3/28/11. <www.eia.gov>
“Demand response and energy storage are also potential approaches, but the deployment of storage—other than pumped hydro—is essentially zero at this time.”
[998] Report: “Annual Energy Review 2011.” U.S. Energy Information Administration, Office of Energy Statistics, September 2012. <www.eia.gov>
Page 358:
Hydroelectric Pumped Storage: Hydroelectric power that is generated during peak load periods by using water previously pumped into an elevated storage reservoir during off-peak periods when excess generating capacity is available to do so. When additional generating capacity is needed, the water can be released from the reservoir through a conduit to turbine generators located in an electric power plant at a lower level.
[999] Booklet: “Energy, Powering Your World.” By M.T. Westra and S. Kuyvenhoven. Foundation for Fundamental Research on Matter, Institute for Plasma Physics, Rijnhuizen (the Netherlands), 2002. <fire.pppl.gov>
Page 37: “If the share of wind and solar power grow, great care has to be taken to guarantee the stability of the electricity supply. In most cases, back-up systems fueled by fossil fuels will be necessary.”
Page 54: “[W]ind and solar energy are so-called intermittent sources of energy, meaning that they do not deliver energy all the time. This means that you need back-up power, or a means of storing power for times when there is no sun or wind, which adds to the costs of these energy sources.”
[1000] “Kansas Energy Report 2009.” Kansas Energy Council, January 7, 2009. <www.justfacts.com>
Pages 26–27:
Electricity differs from other commodities in that it can not be stored on a commercial scale: in other words, electricity stored through currently available mechanical and chemical means encounters very large losses in efficiency. Therefore, in order to provide reliable service, utilities must have enough capacity—defined as instantaneous electrical production—to meet the greatest peak loads experienced.63 This capacity can be provided either from their own generation assets; long-term power purchase agreements; or “real-time” purchases in the spot market.
Generating units that rely on fuel sources whose availability can be controlled by the operators of the plant are said to provide firm power. Power plants that generate electricity from most conventional sources of electricity (e.g., fossil fuels, nuclear, and hydro), as well as some non-conventional sources such as geothermal and landfill wastes, are considered firm power. On the other hand, generating units that rely on fuel sources, such as wind and solar energy, whose availability can not be controlled by the operators of the unit are said to provide intermittent power. Because intermittent resources cannot be depended on to supply electricity at any given moment, units relying on these resources must be accompanied by power plants that provide firm power. For example, dedicated (load-following) units, which operate on standby, can be used to meet demand during periods when the intermittent resource is unavailable, as when the wind is not blowing or the sun is not shining.
63 In practice utilities are required to maintain capacity well in excess of forecasted peak loads. Southwest Power Pool (SPP) requires (with few exceptions) that all members maintain capacity margins 12% greater than forecasted peak load.
[1001] Article: “Electricity Systems Adjust Operations to Growing Wind Power Output.” U.S. Energy Information Administration, March 25, 2011. Corrected 3/28/11. <www.eia.gov>
[Electric power system] operators must continuously match electricity generation to electricity demand, a process that becomes more difficult with additional intermittency. …
Electric power systems with a large share of intermittent resources may rely more on flexible resources such as gas turbines or hydropower to “firm up” the output of intermittent generators.
[1002] Report: “Natural Gas-Electricity Primer.” By Randy Friedman and others. Pacific Northwest Utilities Conference Committee/Northwest Natural Gas Association Planning Task Force, August 2012. <docplayer.net>
Page 3:
In the United States, over the past decade, the single largest sector of natural gas demand growth has occurred in the area of power generation. As emissions from coal-fired power plants have come under increasing public scrutiny, more and more electric utilities and merchant power producers have turned to natural gas for new baseload and peaking generation. This trend has been accelerated in recent years, due to the boom of shale gas production, the relatively short lead time and low cost of natural gas-fired power plant construction, and the robust flexibility that natural gas-fired plants can bring to the area of Variable Energy Resource (VER) integration (i.e., wind and solar).
The Pacific Northwest has followed this national trend for many of the same reasons as listed above. A decade ago, approximately 1,000 MW of natural gas-fueled generation was available to meet the Northwest’s electrical needs. Today, over 8,000 MW are installed, and that number is projected to increase. One significant driver in the region’s gas-fired power plant growth has been the remarkable development of wind generation plants in the Pacific Northwest. The Renewable Portfolio Standards (RPS) of Oregon, Washington and California have contributed to nearly 8,000 MW of wind generation being built in the Northwest. Due to limitations in the Northwest hydropower system, the task of balancing incremental amounts of wind generation intermittency will increasingly fall on natural gas-fired power plants, as will the need to meet peak load. This shift in operations is the driving force behind the addition of many gas-fired peaking plants in the region.
[1003] Report: “Annual Energy Outlook 2013 with Projections to 2040.” U.S. Energy Information Administration, April 2013. <www.osti.gov>
Page 44:
In general, [natural gas] combined-cycle units are considered to be more flexible than steam turbines. They can ramp their output up and down more easily, and their start-up and shutdown procedures involve less time and expense. However, plants that are operated more flexibly (i.e., ramping up and down and cycling on and off) often have higher maintenance requirements and higher maintenance costs.
[1004] Report: “Investment Decisions for Baseload Power Plants.” Prepared by ICF International for the National Energy Technology Laboratory, January 29, 2010. <citeseerx.ist.psu.edu>
Page x: “Renewables combine two features that have increased popular support: energy security and lower CO2 emissions. However, they can be expensive, are often located far from load centers, and contribute little to grid reliability.”
[1005] Article: “Increasing Wind Capacity Requires New Approaches to Electricity Planning and Operations.” U.S. Energy Information Administration, March 22, 2011. <www.eia.gov>
The increasing penetration of wind capacity creates challenges for the electric power industry. Wind generation is intermittent and can be difficult to predict. Often, wind generation does not coincide with the demand for electric power; wind resources are generally more prevalent overnight, when demand for electric power is at a minimum. In most areas, summer peak demand for electricity coincides with hot afternoons when consumers have turned up their air conditioners—but in many areas, such times are calm and wind resources may be quite low.
[1006] Discussion paper: “Assessing the Economic Value of New Utility-Scale Electricity Generation Projects.” U.S. Energy Information Administration, July 2013. <www.eia.gov>
Page 3: “Onshore wind projects, whose output is generally poorly matched with peak loads on both a seasonal and diurnal basis….”
[1007] Article: “Increasing Wind Capacity Requires New Approaches to Electricity Planning and Operations.” U.S. Energy Information Administration, March 22, 2011. <www.eia.gov>
Wind power is attractive for its lack of emissions and low operating costs, but its intermittency and sudden changes in production create challenges for grid operators and planners. This is particularly true in the regions with the most rapid increases in wind capacity, such as Texas (see chart), the Midwest/Plains States, and the Pacific Northwest.
The increasing penetration of wind capacity creates challenges for the electric power industry. Wind generation is intermittent and can be difficult to predict. …
Installations of wind generators continue to increase, and with them the challenge of successfully integrating large amounts of intermittent generation while still maintaining the moment-to-moment balance of electricity supply and demand that is essential for stable operation of the power grid.
[1008] Article: “Electricity Resource Planners Credit Only a Fraction of Potential Wind Capacity.” U.S. Energy Information Administration, May 13, 2011. <www.eia.gov>
Today’s story describes how electric power system planners treat wind generators, recognizing that the wind necessary to achieve a turbine’s full generating capacity may not be available at the time of peak electric demand. In their long-range projections, planners count only a fraction of the nameplate capacity by “derating” a plant’s capacity (i.e. applying a discount factor to it).
Electric power system planners forecast the demand for electricity at the time of the peak, and then identify existing and potential generating resources needed to satisfy that demand, plus enough additional resources to provide a comfortable reserve margin. The goal is to minimize the costs associated with new capacity investments while ensuring reliability for customers. …
Depending on how much wind capacity is in a region, a slight change in the rated capacity value for wind can mean a large change in future capacity requirements. Hypothetically, if a region projecting 20 GW of wind capacity by 2019 decreased its capacity value by one percentage-point from 12% to 11%, and had to replace that lost wind capacity in order to meet its target reserve margin, it would require an additional 200 MW of capacity resources by 2019. That 200 MW could come from a variety of traditional sources (gas, coal), or represent the available-on-peak portion of ~1800MW of additional wind. A conventional natural gas combustion turbine of the required size might require approximately $195 million in overnight capital costs (given the cost assumptions used in EIA’s [U.S. Energy Information Administration] Annual Energy Outlook).
[1009] Article: “Electricity Systems Adjust Operations to Growing Wind Power Output.” U.S. Energy Information Administration, March 25, 2011. Corrected 3/28/11. <www.eia.gov>
Electric power system operators face a challenge as they seek to integrate rising quantities of intermittent generation from wind plants into the system mix. Operators must continuously match electricity generation to electricity demand, a process that becomes more difficult with additional intermittency.
… In today’s story, we describe how electric power system operators adjust their procedures to deal with increasing wind capacity as the demand for electric power changes over the course of the day. The unpredictability and sudden changes in production from wind generation (see chart above for a real-life example) create real engineering issues for operators. …
As the percentage of intermittent generation on the system increases, it becomes more important to smooth out the fluctuations in wind generation. Spreading out wind generators across a wide geographical area reduces variability. Also, building a more robust transmission network not only connects wind resources to load centers but provides a wider set of resources for combating the effects of intermittent generation.
Late-model wind turbines are better able to control their output by changing the pitch of their blades and “spilling” wind (i.e., letting the wind blow past without extracting its energy, like water spilling over a dam). This allows them to respond to orders to reduce output.
[1010] Booklet: “Energy, Powering Your World.” By M.T. Westra and S. Kuyvenhoven. Foundation for Fundamental Research on Matter, Institute for Plasma Physics, Rijnhuizen (the Netherlands), 2002. <fire.pppl.gov>
Page 54: “A third reason is that especially wind and solar energy are so-called intermittent sources of energy, meaning that they do not deliver energy all the time. This means that you need back-up power, or a means of storing power for times when there is no sun or wind, which adds to the costs of these energy sources.”
[1011] Paper: “The Market Value of Variable Renewables.” By Lion Hirth. Energy Economics, February 19, 2013. <neon.energy>
Page 218: “Wind and solar are variable2 renewable energy sources (VREs) in the sense that their output is determined by weather, in contrast to ‘dispatchable’ generators that adjust output as a reaction to economic incentives.”
Page 219:
The market value of VRE is affected by three intrinsic technological properties:
• The supply of VRE is variable. Due to storage constraints and supply and demand variability, electricity is a time-heterogeneous good. Thus the value of electricity depends on when it is produced. In the case of VRE, the time of generation is determined by weather conditions. Variability affects the market value because it determines when electricity is generated.
• The output of VRE is uncertain until realization. Electricity trading takes place, production decisions are made, and power plants are committed the day before delivery. Forecast errors of VRE generation need to be balanced at short notice, which is costly. These costs reduce the market value.
• The primary resource is bound to certain locations. Transmission constraints cause electricity to be a heterogeneous good across space. Hence, the value of electricity depends on where it is generated. Since good wind sites are often located far from load centers, this reduces the value of wind power.3
Page 233:
The first and foremost result of this study is that the market value of both wind and solar power is significantly reduced by increasing market shares of the respective technology. At low penetration levels, the market value of both technologies is comparable to a constant source of electricity, or even higher. At 30% market share, the value of wind power is reduced to 0.5–0.8 of a constant source.
Page 234:
[W]e find that a high carbon price alone does not make wind and solar power competitive at high penetration rates. In Europe that could mean that even if CO2 prices pick up again, subsidies would be needed well beyond 2020 to reach ambitious renewables targets. Finally, without fundamental technological breakthroughs, wind and solar power will struggle becoming competitive on large scale, even with quite steep learning curves.
[1012] Report: “Germany 2020 Energy Policy Review.” International Energy Agency, February 2020. <iea.blob.core.windows.net>
Page 13:
In 2017, wind power surpassed both nuclear and natural gas to become the second-largest source of electricity generation. Continued growth in renewables in line with Germany’s energy and climate targets will require a number of measures for advancing electrification and system integration of renewables, including improvements to taxation and market regulation, and expansion of the transmission and distribution infrastructure, including improving its functionality.
Page 130:
Most wind capacity is located in northern Germany, whereas most demand comes from metropolitan and industrial areas in the south and west of the country. As a result, northern states are facing power surpluses while southern ones are experiencing deficits, an imbalance that will worsen as the last of the country’s nuclear facilities close and more offshore wind comes online. The imbalance has resulted in significantly increased “re-dispatch” measures in the south (where grid operators order power stations to ramp up output to compensate for procured wind power that cannot make it south) and curtailment in the north (where grid operators order wind power to shut down to avoid congestion), costing consumers hundreds of millions of euros annually. Grid operators estimated that these kinds of grid stabilisation measures were required on 329 days in 2017. The imbalance also creates “loop flows” to neighbouring countries, which have had to invest in grid enforcement and special transformers to maintain security of electricity supply.
[1013] Webpage: “Texas: State Profile and Energy Estimates.” U.S. Energy Information Administration. Last updated April 15, 2021. <www.eia.gov>
“Texas leads the nation in wind-powered generation and produced about 28% of all U.S. wind-powered electricity in 2020. Wind power surpassed the state’s nuclear generation for the first time in 2014 and produced more than twice as much electricity as the state’s two nuclear power plants combined in 2020.”
[1014] Webpage: “Fast Facts.” Southwest Power Pool. Accessed August 2, 2021 at <www.spp.org>
SPP [Southwest Power Pool] has members in 14 states: Arkansas, Iowa, Kansas, Louisiana, Minnesota, Missouri, Montana, Nebraska, New Mexico, North Dakota, Oklahoma, South Dakota, Texas and Wyoming. …
Generating capacity: 94,648 MW (based on nameplate capacity as of Jan. 13, 2021)
• 38.9% natural gas
• 29.0% wind
• 24.3% coal …
Energy production by fuel type:
• 38.6% coal
• 29.5% wind
• 22.7% natural gas
[1015] Report: “A Comprehensive Review of Southwest Power Pool’s Response to the February 2021 Winter Storm: Analysis and Recommendations.” Southwest Power Pool, July 19, 2021. <www.spp.org>
Pages 41–42:
Figure 16 shows the forced generation outages in effect by fuel type during the two weeks preceding and the week of the event.
On Feb. 7, freezing rain and freezing fog moved into the central and southern regions of SPP [Southwest Power Pool] (Kansas, Oklahoma and the Texas panhandle) and reduced available wind capacity due to ice buildup on turbine blades. …
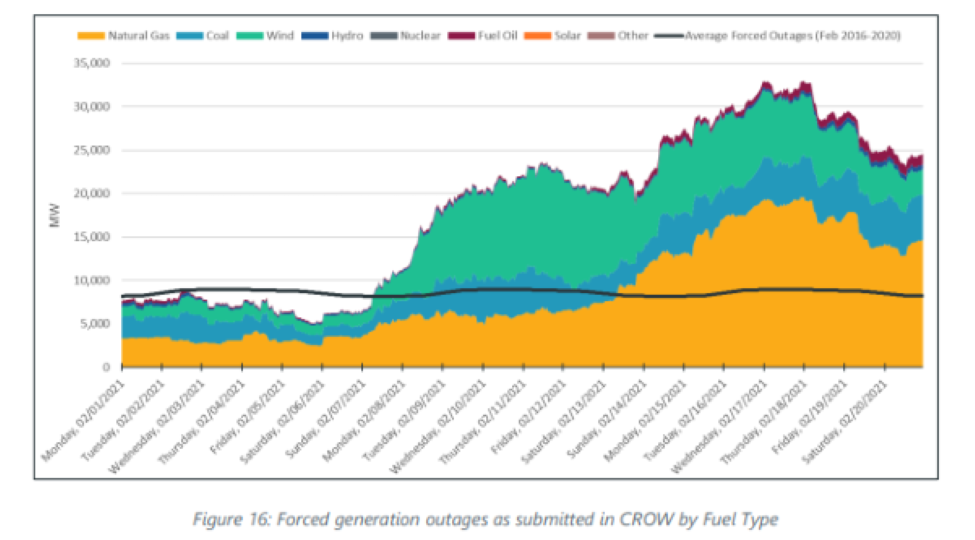
Page 43: “On average, approximately 51% of all forced wind generation outages experienced during the week of the event were caused by regulatory/safety/environmental issues, with 90% of those related to icing conditions.”
[1016] Report: “The Timeline and Events of the February 2021 Texas Electric Grid Blackouts.” Energy Institute Committee, University of Texas at Austin, July 2021. <www.puc.texas.gov>
Page 21: “Wind turbines suffered some of the earliest outages and derates as freezing precipitation and fog resulted in ice accumulation on blades and—eventually, as temperatures dropped further—in the gearboxes and nacelles.”
Page 29:
Going into the early morning of February 15, generation outages (nameplate) were already high at roughly 30,000 MW [megawatts]. By 9:00 a.m., total outages and derates 43 increased to over 50,000 MW, or roughly 40% of the total installed nameplate capacity in ERCOT [Electricity Reliability Council of Texas]. Levels of outages and derates would change over the event, but would not return to pre-blackout levels until the afternoon of February 19. …
As the extreme cold weather settled over the entire state, the outages increased. From noon on February 14 to noon on February 15, the offline renewable capacity increased from 15,100 MW to 19,400 MW (+4,300 MW) and the total outages of thermal generators increased from 13,700 MW to 31,100 MW (+17,400).45 …
45 Values rounded to nearest 100 MW.
Page 33:
Figure 2.n aggregates all the causes of outages and shows the total amount of outages by fuel, based on nameplate capacity. …
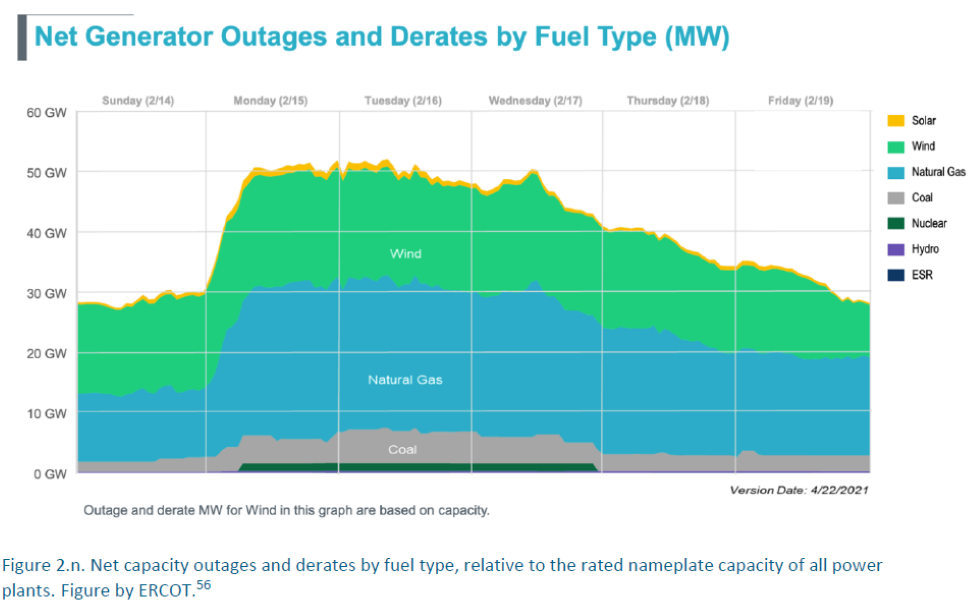
[1017] News release: “Grid Operator Restores More Power Overnight.” Electricity Reliability Council of Texas, February 17, 2021. <www.ercot.com>
Since the winter storm began on Monday, approximately 185 generating units have tripped offline for one reason or another. Some factors include frozen wind turbines, limited gas supplies, low gas pressure and frozen instrumentation.
As of 9 a.m., approximately 46,000 MW of generation has been forced off the system during this extreme winter weather event. Of that, 28,000 MW is thermal and 18,000 MW is wind and solar.
[1018] Article: “Solar Radiation Basics.” U.S. Department of Energy, Office of Energy Efficiency and Renewable Energy, August 21, 2013. <energy.gov>
“Solar radiation, often called the solar resource, is a general term for the electromagnetic radiation emitted by the sun. Solar radiation can be captured and turned into useful forms of energy, such as heat and electricity, using a variety of technologies.”
[1019] Report: “Renewable Energy: Federal Agencies Implement Hundreds of Initiatives.” U.S. Government Accountability Office, February 2012. <www.gao.gov>
Page 18:
Solar photovoltaic technologies convert energy from sunlight directly into electricity, using arrays of solar panels. Concentrating solar power technologies use mirrors to focus the sun’s light energy and convert it into heat to create electrical power. In solar hot water technology, a collector absorbs and transfers heat from the sun to water, which is stored in a tank until needed.
[1020] Report: “Distributed Generation System Characteristics and Costs in the Buildings Sector.” U.S. Energy Information Administration, August 2013. <www.eia.gov>
Page 4: “Photovoltaic (PV) technologies are constructed using semiconductor materials that have the ability to convert sunlight into electricity. PV technologies are typically divided into three categories—crystalline silicon, thin-film, and multi-junction (see Table 4).”
[1021] Webpage: “Glossary.” U.S. Energy Information Administration. Accessed July 18, 2013 at <www.eia.gov>
Concentrating solar power or solar thermal power system: A solar energy conversion system characterized by the optical concentration of solar rays through an arrangement of mirrors to generate a high temperature working fluid. Also see Solar trough, Solar power tower, or Solar dish. Concentrating solar power (but not Solar thermal power) may also refer to a system that focuses solar rays on a photovoltaic cell to increase conversion efficiency.
Roof pond: A solar energy collection device consisting of containers of water located on a roof that absorb solar energy during the day so that the heat can be used at night or that cools a building by evaporation at night.
Solar power tower: A solar energy conversion system that uses a large field of independently adjustable mirrors (heliostats) to focus solar rays on a near single point atop a fixed tower (receiver). The concentrated energy may be used to directly heat the working fluid of a Rankine cycle engine or to heat an intermediary thermal storage medium (such as a molten salt).
Solar thermal parabolic dishes: A solar thermal technology that uses a modular mirror system that approximates a parabola and incorporates two-axis tracking to focus the sunlight onto receivers located at the focal point of each dish. The mirror system typically is made from a number of mirror facets, either glass or polymer mirror, or can consist of a single stretched membrane using a polymer mirror. The concentrated sunlight may be used directly by a Stirling, Rankine, or Brayton cycle heat engine at the focal point of the receiver or to heat a working fluid that is piped to a central engine. The primary applications include remote electrification, water pumping, and grid-connected generation.
Unglazed solar collector: A solar thermal collector that has an absorber that does not have a glazed covering. Solar swimming pool heater systems usually use unglazed collectors because they circulate relatively large volumes of water through the collector and capture nearly 80 percent of the solar energy available.
[1022] Timeline: “The History of Solar.” U.S. Department of Energy, Office of Energy Efficiency & Renewable Energy. Last updated March 8, 2004. <www1.eere.energy.gov>
Pages 1–2:
3rd Century B.C. Greeks and Romans use burning mirrors to light torches for religious purposes. …
1860s French mathematician August Mouchet proposed an idea for solar-powered steam engines. In the following two decades, he and his assistant, Abel Pifre, constructed the first solar powered engines and used them for a variety of applications. These engines became the predecessors of modern parabolic dish collectors.
[1023] Timeline: “The History of Solar.” U.S. Department of Energy, Office of Energy Efficiency & Renewable Energy. Last updated March 8, 2004. <www1.eere.energy.gov>
Page 2:
1954 Photovoltaic technology is born in the United States when Daryl Chapin, Calvin Fuller, and Gerald Pearson develop the silicon photovoltaic (PV) cell at Bell Labs—the first solar cell capable of converting enough of the sun’s energy into power to run everyday electrical equipment. Bell Telephone Laboratories produced a silicon solar cell with 4% efficiency and later achieved 11% efficiency.
1955 Western Electric began to sell commercial licenses for silicon photovoltaic (PV) technologies. Early successful products included PV-powered dollar bill changers and devices that decoded computer punch cards and tape.
[1024] Textbook: Essentials of Environmental Science. By Andrew Friedland, Rick Relyea, and David Courard-Hauri. W.H. Freeman and Company, 2012.
Pages 197–198:
[T]he Sun is the ultimate source of fossil fuels. As FIGURE 8.17 shows, most types of renewable energy are also derived from the Sun and cycles driven by the Sun, including solar, wind, and hydroelectric energy as well as plant biomass such as wood. In fact, the only important sources of energy that are not solar-based are nuclear, geothermal, and tidal energy.
[1025] Report: “Energy for Sustainable Rural Development Projects (Volume 1).” United Nations Food and Agriculture Organization, 1991.
Chapter 1: “Basic Energy Concepts.” By W.S. Hulscher. https://<www.fao.org>
“We observe that the primary energy sources are not the ultimate sources of energy. For instance, animate energy comes from biomass, whereas biomass energy ultimately comes from the sun. Apart from geothermal and nuclear energy, all our so-called primary energy sources have ultimately got their energy from the sun!”
[1026] Booklet: “What You Need to Know About Energy.” National Academy of Sciences, 2008. <nap.nationalacademies.org>
“The sun’s energy warms the planet’s surface, powering titanic transfers of heat and pressure in weather patterns and ocean currents. The resulting air currents drive wind turbines. Solar energy also evaporates water that falls as rain and builds up behind dams, where its motion is used to generate electricity via hydropower.”
[1027] Webpage: “How Hydropower Works.” U.S. Department of Energy, Water Power Program. Last updated September 23, 2013. <energy.gov>
Hydropower is using water to power machinery or make electricity. Water constantly moves through a vast global cycle, evaporating from lakes and oceans, forming clouds, precipitating as rain or snow, then flowing back down to the ocean. The energy of this water cycle, which is driven by the sun, can be tapped to produce electricity or for mechanical tasks like grinding grain.
[1028] Calculated with data from the report: “July 2022 Monthly Energy Review.” U.S. Energy Information Administration, Office of Energy Statistics, July 26, 2022. <www.eia.gov>
Page 7: “Table 1.3. Primary Energy Consumption by Source (Quadrillion Btu)”
Page 179: “Table 10.1. Renewable Energy Production and Consumption by Source (Trillion Btu)”
NOTE: An Excel file containing the data and calculations is available upon request.
[1029] Calculated with data from the report: “Electric Power Monthly with Data for January 2022.” U.S. Energy Information Administration, Office of Energy Statistics, March 24, 2022. <www.eia.gov>
Page 17 (of PDF): “Table 1.1. Net Generation by Energy Source: Total (All Sectors), 2012–January 2022 (Thousand Megawatthours)”
Page 18 (of PDF): “Table 1.1.A. Net Generation from Renewable Sources: Total (All Sectors), 2012–January 2022 (Thousand Megawatthours)”
NOTES:
[1030] Report: “Photovoltaic (PV) Pricing Trends: Historical, Recent, and Near-Term Projections.” By David Feldman and others. U.S. Department of Energy, National Renewable Energy Laboratory, August 2015. <www.nrel.gov>
Page 4: “Reported system prices of residential and commercial PV [photovoltaic] systems declined 6%–12% per year, on average, from 1998–2014, and by 9%–21% from 2013–2014, depending on system size.”
[1031] Calculated with data from the report: “Tracking the Sun: Pricing and Design Trends for Distributed Photovoltaic Systems in the United States, 2021 Edition.” By Galen Barbose and others. Lawrence Berkeley National Laboratory, September 2021. <eta-publications.lbl.gov>
Summary Data Tables: “Installed Price Trends Over Time” <eta-publications.lbl.gov>
NOTE: An Excel file containing the data and calculations is available upon request.
[1032] Calculated with data from the report: “Utility-Scale Solar, 2021 Edition: Empirical Trends in Deployment, Technology, Cost, Performance, PPA Pricing, and Value in the United States.” By Mark Bolinger and others. Lawrence Berkeley National Laboratory, October 2021. <eta-publications.lbl.gov>
Page 7: “Our data analysis focuses on a subset of this sample—all projects larger than 5MWAC that were completed by the end of 2020: … We define “utility-scale” as any ground-mounted project that is larger than 5 MWAC”
Page 18: “Installed Costs (2020 $/W)” <eta-publications.lbl.gov>
NOTE: An Excel file containing the data and calculations is available upon request.
[1033] Report: “Photovoltaic (PV) Pricing Trends: Historical, Recent, and Near-Term Projections.” By David Feldman and others. Lawrence Berkeley National Laboratory, November 2012. <www.nrel.gov>
Page v: “Reported installed prices of U.S. residential and commercial PV systems declined 5%–7% per year, on average, from 1998–2011, and by 11%–14% from 2010–2011, depending on system size.”
[1034] Report: “Photovoltaic (PV) Pricing Trends: Historical, Recent, and Near-Term Projections.” By David Feldman and others. U.S. Department of Energy, National Renewable Energy Laboratory, August 2015. <www.nrel.gov>
Page 4: “Reported system prices of residential and commercial PV [photovoltaic] systems declined 6%–12% per year, on average, from 1998–2014, and by 9%–21% from 2013–2014, depending on system size.”
[1035] Report: “Distributed Generation System Characteristics and Costs in the Buildings Sector.” U.S. Energy Information Administration, August 2013. <www.eia.gov>
Page 1: “As relatively new technologies on the globalized production market, PV [photovoltaic] and small wind are experiencing significant cost changes through technological progress and economies of scale.”
Page 3: “The building block for a PV system is a PV cell (or solar cell). Multiple PV cells are interconnected and assembled in a support structure, or frame, to form a PV module (or solar panel). Multiple modules are then combined to form a PV array (see Figure 2).”
[1036] “2010 Solar Technologies Market Report.” U.S. Department of Energy, Office of Energy Efficiency and Renewable Energy, National Renewable Energy Laboratory, November 2011. <www.nrel.gov>
Page 81:
Federal policies and incentives play an important role in the commercialization and adoption of solar technologies. They have enabled rapid expansion of solar markets in countries such as Germany, Spain, Italy, Japan, and the United States, among others. Legislation enacted in the United States in 2008 and early 2009 provided unprecedented levels of federal support for U.S. renewable energy projects, including solar energy projects.
Page 88: “In the United States, state and local policies in support of increased solar deployment are more prevalent than federal policies and have a well-documented history of both successes and failures.”
[1037] Report: “Distributed Generation System Characteristics and Costs in the Buildings Sector.” Prepared by ICF International for the U.S. Energy Information Administration, Office of Integrated Analysis and Forecasting, August 2013. <www.eia.gov>
Appendix A: “Photovoltaic (PV) Cost and Performance Characteristics for Residential and Commercial Applications, Final Report,” August 2010.
Appendix A, Page 11:
PV market size, maturity, and total installed costs vary widely from state to state. The growth of residential and commercial PV markets within a state has been driven almost entirely by state-based incentive programs (Venkataraman 2009). The overwhelming majority of residential and commercial PV installations have occurred in just two states—California and New Jersey (Wiser 2009). Both of these states have well developed incentive programs that have stimulated PV adoption.
In addition to capacity based incentives and performance based incentives, states have used a variety of other tools to encourage the installation of PV, including sales and property tax exemptions, net metering laws, feed-in tariffs, solar access laws, standardized and liberalized interconnection procedures, etc. The incentive mix changes continuously; refer to the Database of State Incentives for Renewables and Efficiency (DSIRE) for the most recent information (DSIRE 2009).
Appendix A, Page 13:
Technological developments across the PV supply chain, from commodities to efficiencies, have pushed total installed costs downward. An increase in silicon manufacturing has increased supply and lowered the price of silicon in crystalline PV modules (Hasan 2009). Improved manufacturing processes have increased the production output of facilities, while decreasing the costs of production (GT Solar 2009).
In recent years, streamlined manufacturing has led to decreased manufacturing costs. Machine manufacturers have begun to offer turn-key production lines which are complete manufacturing system packages. Turn-key solutions are sold for every stage of the supply chain, from wafer fabrication to module fabrication (GT Solar 2009). These automated turn-key production lines have helped increase productivity, quality, and yields, while lowering manufacturing costs. Automated systems have also made it easier for new firms to enter the manufacturing arena, thereby increasing competition and putting downward pressure on prices.
[1038] Article: “N.Y. Man Erects Solar Panels as Testament to Waste.” By Justin Murphy of the Rochester (NY) Democrat and Chronicle. USA Today, August 14, 2013. <www.usatoday.com>
The 20 solar panels Jeffrey Punton installed in the backyard of his Rochester, N.Y., home…. He installed the panels in 2009 …
About $17,000 of the money for Punton’s panels came directly from the New York State Energy Research and Development Authority. …
$42,480, total project cost.
$29,504, combined value of subsidies and tax credits.
[1039] “Energy Primer: A Handbook of Energy Market Basics.” Federal Energy Regulatory Commission, November 2015. <www.ferc.gov>
Page 50: “PV [photovoltaic] growth has increased greatly as a result of policy incentives and cost declines. Annual PV installations increased nearly tenfold from 2009 to 2013 as PV system costs decreased. PV growth has been relatively concentrated; 10 states had 90 percent of PV capacity in 2014, while California alone had over half.”
[1040] Calculated with data from the article: “N.Y. Man Erects Solar Panels as Testament to Waste.” By Justin Murphy of the Rochester (N.Y.) Democrat and Chronicle. USA Today, August 14, 2013. <www.usatoday.com>
The 20 solar panels Jeffrey Punton installed in the backyard of his Rochester, N.Y., home…. He installed the panels in 2009 …
About $17,000 of the money for Punton’s panels came directly from the New York State Energy Research and Development Authority. …
$42,480, total project cost.
$29,504, combined value of subsidies and tax credits.
CALCULATION: $29,504 government backing / $42,480 project cost = 69% paid by government
[1041] Report: “Tracking the Sun V: An Historical Summary of the Installed Price of Photovoltaics in the United States from 1998 to 2011.” By Galen Barbose and others. Lawrence Berkeley National Laboratory, 2012. <eta-publications.lbl.gov>
Page 4: “The market for PV [photovoltaic] in the United States is, to a significant extent, driven by national, state, and local government incentives, including up-front cash rebates, production-based incentives, renewables portfolio standards, and federal and state tax benefits.”
[1042] For one example of many: Press release: “SEIA Applauds President Obama for Continued Commitment to Solar.” Solar Energy Industries Association, August 15, 2013. <www.seia.org>
SEIA [Solar Energy Industries Association] President and CEO Rhone Resch issued the following statement today after learning the White House has begun installing solar panels “to improve overall energy efficiency” of America’s most famous building …
“Presently, there’s more than 8,500 megawatts (MW) of cumulative solar electric capacity installed in the U.S. What’s more, in the first quarter of 2013, nearly half of all new generating capacity added to the grid was solar.”
[1043] “2010 Solar Technologies Market Report.” U.S. Department of Energy, Office of Energy Efficiency and Renewable Energy, National Renewable Energy Laboratory, November 2011. <www.nrel.gov>
Page 55:
Capacity factor is the ratio of an energy-generation system’s actual energy output during a given period to the energy output that would have been generated if the system ran at full capacity for the entire period. For example, if a system ran at its full capacity for an entire year, the capacity factor would be 100% during that year. Because PV [photovoltaic] and CSP [concentrating solar power] generate electricity only when the sun is shining, their capacity factors are reduced because of evening, cloudy, and other low-light periods. This can be mitigated in part by locating PV and CSP systems in areas that receive high levels of annual sunlight. The capacity factor of PV and CSP systems is also reduced by any necessary downtime (e.g., for maintenance), similar to other generation technologies.
For PV, electricity generation is maximized when the modules are normal (i.e., perpendicular) to the incident sunlight. Variations in the sun’s angle that are due to the season and time of day reduce the capacity factor of fixed-orientation PV systems. This can be mitigated, in part, by tilting stationary PV modules to maximize annual sunlight exposure or by incorporating one- or two-axis solar tracking systems, which rotate the modules to capture more normal sunlight exposure than is possible with stationary modules.
[1044] Article: “Solar Radiation Basics.” U.S. Department of Energy, Office of Energy Efficiency and Renewable Energy, August 21, 2013. <energy.gov>
Every location on Earth receives sunlight at least part of the year. The amount of solar radiation that reaches any one spot on the Earth’s surface varies according to:
• Geographic location
• Time of day
• Season
• Local landscape
• Local weather.
Because the Earth is round, the sun strikes the surface at different angles, ranging from 0° (just above the horizon) to 90° (directly overhead). When the sun’s rays are vertical, the Earth’s surface gets all the energy possible. The more slanted the sun’s rays are, the longer they travel through the atmosphere, becoming more scattered and diffuse. Because the Earth is round, the frigid polar regions never get a high sun, and because of the tilted axis of rotation, these areas receive no sun at all during part of the year.
The Earth revolves around the sun in an elliptical orbit and is closer to the sun during part of the year. When the sun is nearer the Earth, the Earth’s surface receives a little more solar energy. The Earth is nearer the sun when it is summer in the southern hemisphere and winter in the northern hemisphere. However, the presence of vast oceans moderates the hotter summers and colder winters one would expect to see in the southern hemisphere as a result of this difference.
The 23.5° tilt in the Earth’s axis of rotation is a more significant factor in determining the amount of sunlight striking the Earth at a particular location. Tilting results in longer days in the northern hemisphere from the spring (vernal) equinox to the fall (autumnal) equinox and longer days in the southern hemisphere during the other 6 months. Days and nights are both exactly 12 hours long on the equinoxes, which occur each year on or around March 23 and September 22.
Countries such as the United States, which lie in the middle latitudes, receive more solar energy in the summer not only because days are longer, but also because the sun is nearly overhead. The sun’s rays are far more slanted during the shorter days of the winter months. Cities such as Denver, Colorado, (near 40° latitude) receive nearly three times more solar energy in June than they do in December.
The rotation of the Earth is also responsible for hourly variations in sunlight. In the early morning and late afternoon, the sun is low in the sky. Its rays travel further through the atmosphere than at noon, when the sun is at its highest point. On a clear day, the greatest amount of solar energy reaches a solar collector around solar noon.
Diffuse and Direct Solar Radiation
As sunlight passes through the atmosphere, some of it is absorbed, scattered, and reflected by:
• Air molecules
• Water vapor
• Clouds
• Dust
• Pollutants
• Forest fires
• Volcanoes.
This is called diffuse solar radiation. The solar radiation that reaches the Earth’s surface without being diffused is called direct beam solar radiation. The sum of the diffuse and direct solar radiation is called global solar radiation. Atmospheric conditions can reduce direct beam radiation by 10% on clear, dry days and by 100% during thick, cloudy days. …
The solar resource across the United States is ample for photovoltaic (PV) systems because they use both direct and scattered sunlight. Other technologies may be more limited. However, the amount of power generated by any solar technology at a particular site depends on how much of the sun’s energy reaches it. Thus, solar technologies function most efficiently in the southwestern United States, which receives the greatest amount of solar energy.
[1045] Report: “Distributed Generation System Characteristics and Costs in the Buildings Sector.” Prepared by ICF International for the U.S. Energy Information Administration, Office of Integrated Analysis and Forecasting, August 2013. <www.eia.gov>
Appendix A: “Photovoltaic (PV) Cost and Performance Characteristics for Residential and Commercial Applications, Final Report,” August 2010.
Appendix A, Page 7:
The electrical efficiency of a solar cell in the lab under Standard Test Conditions (STC) is almost always higher than the field efficiency, in part due to temperature differences. For STC measurements, the solar cell is held at 25 ºC. The efficiency of a solar cell decreases with increasing temperature, and the field temperature of a solar cell is almost always higher than 25 °C. Roof mounted arrays can reach temperatures of 70–80°C (Wiles 2009). For rooftop conditions, the California Energy Commission recommends a de-rating factor of 89% from STC lab conditions to expected field power (Xantrex 2009). …
Maximum PV output occurs when a solar panel is oriented perpendicular to incoming sunlight. The optimum orientation changes through the day as the sun moves across the sky, and on a seasonal basis as the height of the sun above the horizon changes. Tracking systems can be added to PV arrays to optimize electrical output.
In most residential applications, PV panels are placed on roof tops in fixed frames (also called “racks”), and tracking systems are not utilized. When the panels are located directly on the roof top, they are referred to as “flat racked” systems. Unless the roof is pitched at the local latitude angle, the system’s power output can be increased by tilting the racking to be closer to the latitude angle to capture more sunlight (see Table 5). This type of tilting is referred to as “latitude racking.”
Latitude racking is more expensive than flat-racking for both the residential and commercial sectors. Compared to flat-racked systems, significantly more hardware, assembly, and labor is involved in latitude racked systems. However, there is a financial trade off to consider. Even though flat-racking costs less, the modules are 20–30% less efficient than latitude racked systems (Focusing on Energy 2008).
In addition to static latitude racking, more sophisticated dynamic tracking systems can be used. Dynamic tracking systems can be either single-axis or dual-axis designs. A single axis design follows the daily east–west arc of the sun. With a dual axis system, hourly tracking (east–west) is achieved as well as seasonal tracking (north–south).
[1046] Calculated with data from the report: “Electric Power Annual 2020.” U.S. Energy Information Administration, Assistant Administrator for Energy Statistics, October 29, 2021. Updated 3/10/22. <www.eia.gov>
Pages 11– 12 (of PDF): “Table 1.2. Summary Statistics for the United States, 2010–2020 (From Tables 3.1.A. and 3.1.B.) Net Generation (Thousand Megawatthours)”
Pages 12–13 (of PDF): “Table 1.2. Summary Statistics for the United States, 2010–2020 (From Tables 4.2.A. and 4.2.B.) Net Summer Generating Capacity (Megawatts)”
NOTE: An Excel file containing the data and calculations is available upon request.
[1047] Booklet: “Energy, Powering Your World.” By M.T. Westra and S. Kuyvenhoven. Foundation for Fundamental Research on Matter, Institute for Plasma Physics, Rijnhuizen (the Netherlands), 2002. <fire.pppl.gov>
Page 26: “The main difference between fossil fuels and electricity is that fossil fuels are easy to store, and electricity is not. Fossil fuels can be stored close to where they are used, for example in the fuel tank of a car. Most of the electricity you use is generated a fraction of a second before it is consumed.”
[1048] Textbook: Energy Economics: Concepts, Issues, Markets and Governance. By Subhes C. Bhattacharyya. Springer-Verlag, 2011.
Page 13: “Before consumption, some storage may be required for some forms of energy, while for electricity no practical and economic storage solution exists.”
[1049] “Kansas Energy Report 2009.” Kansas Energy Council, January 7, 2009. <www.justfacts.com>
Page 26: “Electricity differs from other commodities in that it can not be stored on a commercial scale: in other words, electricity stored through currently available mechanical and chemical means encounters very large losses in efficiency.”
[1050] Report: “Natural Gas-Electricity Primer.” By Randy Friedman and others. Pacific Northwest Utilities Conference Committee/Northwest Natural Gas Association Planning Task Force, August 2012. <docplayer.net>
Page 12: “However, electricity supply and demand must be balanced on a real-time basis in very short intervals (measured in seconds).”
[1051] Report: “Energy Primer: A Handbook of Energy Market Basics.” Federal Energy Regulatory Commission, November 2015. <www.ferc.gov>
Page 49:
Unlike many other products, electricity cannot be stored in any appreciable quantities. Further, electricity is a necessity for most consumers, whose use responds little to price changes. Finally, electric equipment and appliances are tuned to a very specific standard of power, measured as voltage. Deviations in voltage can cause devices to operate poorly or may even damage them. Consequently, the supply side of the electric market must provide and deliver exactly the amount of power customers want at all times, at all locations. This requires constant monitoring of the grid and close coordination among industry participants.
[1052] Article: “Electricity Systems Adjust Operations to Growing Wind Power Output.” U.S. Energy Information Administration, March 25, 2011. Corrected 3/28/11. <www.eia.gov>
“Demand response and energy storage are also potential approaches, but the deployment of storage—other than pumped hydro—is essentially zero at this time.”
[1053] Report: “Annual Energy Review 2011.” U.S. Energy Information Administration, Office of Energy Statistics, September 2012. <www.eia.gov>
Page 358:
Hydroelectric Pumped Storage: Hydroelectric power that is generated during peak load periods by using water previously pumped into an elevated storage reservoir during off-peak periods when excess generating capacity is available to do so. When additional generating capacity is needed, the water can be released from the reservoir through a conduit to turbine generators located in an electric power plant at a lower level.
[1054] Booklet: “Energy, Powering Your World.” By M.T. Westra and S. Kuyvenhoven. Foundation for Fundamental Research on Matter, Institute for Plasma Physics, Rijnhuizen (the Netherlands), 2002. <fire.pppl.gov>
Page 37: “If the share of wind and solar power grow, great care has to be taken to guarantee the stability of the electricity supply. In most cases, back-up systems fueled by fossil fuels will be necessary.”
Page 54: “[W]ind and solar energy are so-called intermittent sources of energy, meaning that they do not deliver energy all the time. This means that you need back-up power, or a means of storing power for times when there is no sun or wind, which adds to the costs of these energy sources.”
[1055] “Kansas Energy Report 2009.” Kansas Energy Council, January 7, 2009. <www.justfacts.com>
Pages 26–27:
Electricity differs from other commodities in that it can not be stored on a commercial scale: in other words, electricity stored through currently available mechanical and chemical means encounters very large losses in efficiency. Therefore, in order to provide reliable service, utilities must have enough capacity—defined as instantaneous electrical production—to meet the greatest peak loads experienced.63 This capacity can be provided either from their own generation assets; long-term power purchase agreements; or “real-time” purchases in the spot market.
Generating units that rely on fuel sources whose availability can be controlled by the operators of the plant are said to provide firm power. Power plants that generate electricity from most conventional sources of electricity (e.g., fossil fuels, nuclear, and hydro), as well as some non-conventional sources such as geothermal and landfill wastes, are considered firm power. On the other hand, generating units that rely on fuel sources, such as wind and solar energy, whose availability can not be controlled by the operators of the unit are said to provide intermittent power. Because intermittent resources cannot be depended on to supply electricity at any given moment, units relying on these resources must be accompanied by power plants that provide firm power. For example, dedicated (load-following) units, which operate on standby, can be used to meet demand during periods when the intermittent resource is unavailable, as when the wind is not blowing or the sun is not shining.
63 In practice utilities are required to maintain capacity well in excess of forecasted peak loads. Southwest Power Pool (SPP) requires (with few exceptions) that all members maintain capacity margins 12% greater than forecasted peak load.
[1056] Article: “Electricity Systems Adjust Operations to Growing Wind Power Output.” U.S. Energy Information Administration, March 25, 2011. Corrected 3/28/11. <www.eia.gov>
[Electric power system] operators must continuously match electricity generation to electricity demand, a process that becomes more difficult with additional intermittency. …
Electric power systems with a large share of intermittent resources may rely more on flexible resources such as gas turbines or hydropower to “firm up” the output of intermittent generators.
[1057] Report: “Natural Gas-Electricity Primer.” By Randy Friedman and others. Pacific Northwest Utilities Conference Committee/Northwest Natural Gas Association Planning Task Force, August 2012. <docplayer.net>
Page 3:
In the United States, over the past decade, the single largest sector of natural gas demand growth has occurred in the area of power generation. As emissions from coal-fired power plants have come under increasing public scrutiny, more and more electric utilities and merchant power producers have turned to natural gas for new baseload and peaking generation. This trend has been accelerated in recent years, due to the boom of shale gas production, the relatively short lead time and low cost of natural gas-fired power plant construction, and the robust flexibility that natural gas-fired plants can bring to the area of Variable Energy Resource (VER) integration (i.e., wind and solar).
The Pacific Northwest has followed this national trend for many of the same reasons as listed above. A decade ago, approximately 1,000 MW of natural gas-fueled generation was available to meet the Northwest’s electrical needs. Today, over 8,000 MW are installed, and that number is projected to increase. One significant driver in the region’s gas-fired power plant growth has been the remarkable development of wind generation plants in the Pacific Northwest. The Renewable Portfolio Standards (RPS) of Oregon, Washington and California have contributed to nearly 8,000 MW of wind generation being built in the Northwest. Due to limitations in the Northwest hydropower system, the task of balancing incremental amounts of wind generation intermittency will increasingly fall on natural gas-fired power plants, as will the need to meet peak load. This shift in operations is the driving force behind the addition of many gas-fired peaking plants in the region.
[1058] Report: “Annual Energy Outlook 2013 with Projections to 2040.” U.S. Energy Information Administration, April 2013. <www.osti.gov>
Page 44:
In general, [natural gas] combined-cycle units are considered to be more flexible than steam turbines. They can ramp their output up and down more easily, and their start-up and shutdown procedures involve less time and expense. However, plants that are operated more flexibly (i.e., ramping up and down and cycling on and off) often have higher maintenance requirements and higher maintenance costs.
[1059] Booklet: “Energy, Powering Your World.” By M.T. Westra and S. Kuyvenhoven. Foundation for Fundamental Research on Matter, Institute for Plasma Physics, Rijnhuizen (the Netherlands), 2002. <fire.pppl.gov>
Page 54: “A third reason is that especially wind and solar energy are so-called intermittent sources of energy, meaning that they do not deliver energy all the time. This means that you need back-up power, or a means of storing power for times when there is no sun or wind, which adds to the costs of these energy sources.”
[1060] Report: “Annual Energy Outlook 2013 with Projections to 2040.” U.S. Energy Information Administration, April 2013. <www.osti.gov>
Page 44:
In general, [natural gas] combined-cycle units are considered to be more flexible than steam turbines. They can ramp their output up and down more easily, and their start-up and shutdown procedures involve less time and expense. However, plants that are operated more flexibly (i.e., ramping up and down and cycling on and off) often have higher maintenance requirements and higher maintenance costs.
[1061] Paper: “The Market Value of Variable Renewables.” By Lion Hirth. Energy Economics, February 19, 2013. <neon.energy>
Page 218: “Wind and solar are variable2 renewable energy sources (VREs) in the sense that their output is determined by weather, in contrast to ‘dispatchable’ generators that adjust output as a reaction to economic incentives.”
Page 219:
The market value of VRE is affected by three intrinsic technological properties:
• The supply of VRE is variable. Due to storage constraints and supply and demand variability, electricity is a time-heterogeneous good. Thus the value of electricity depends on when it is produced. In the case of VRE, the time of generation is determined by weather conditions. Variability affects the market value because it determines when electricity is generated.
• The output of VRE is uncertain until realization. Electricity trading takes place, production decisions are made, and power plants are committed the day before delivery. Forecast errors of VRE generation need to be balanced at short notice, which is costly. These costs reduce the market value.
• The primary resource is bound to certain locations. Transmission constraints cause electricity to be a heterogeneous good across space. Hence, the value of electricity depends on where it is generated.
Page 233:
The first and foremost result of this study is that the market value of both wind and solar power is significantly reduced by increasing market shares of the respective technology. At low penetration levels, the market value of both technologies is comparable to a constant source of electricity, or even higher. At 30% market share, the value of wind power is reduced to 0.5–0.8 of a constant source. Solar reaches a similar reduction already at 15% penetration.
Page 234:
[W]e find that a high carbon price alone does not make wind and solar power competitive at high penetration rates. In Europe that could mean that even if CO2 prices pick up again, subsidies would be needed well beyond 2020 to reach ambitious renewables targets. Finally, without fundamental technological breakthroughs, wind and solar power will struggle becoming competitive on large scale, even with quite steep learning curves.
[1062] Webpage: “California: State Profile and Energy Estimates.” U.S. Energy Information Administration. Last updated March 17, 2022. <www.eia.gov>
“In 2021, California was the nation’s top producer of electricity from solar, geothermal, and biomass energy….”
[1063] Report: “2021 Summer Loads and Resources Assessment.” California Independent System Operator, May 12, 2021. <www.caiso.com>
Page 36:
In recent years, significant amounts of new renewable generation, especially solar, have reached commercial operation to meet the 60 percent requirement by 2030. To successfully meet the state’s Renewables Portfolio Standard goals, increasing amounts of flexible and fast responding resources must be available to integrate the growing amounts of variable resources. These increasing amounts of variable resources integrated with the ISO [Independent System Operator] grid pose unique challenges for ISO operations and for the analytical tools used by the ISO to assess near-term reliability.
As new renewable resources come on the system, the ISO reliability focus has evolved from meeting the gross peak demand to meeting both net peak demand and flexible capacity requirements. The gross peak usually occurs at the hour ending 16:00 to 18:00 while net peak occurs in the hour ending 19:00 to 21:00 timeframe, when solar generation is close to zero. The ISO’s evolving net load profile—gross load minus grid-interconnected solar and wind generation—has become known as the duck curve. The growing amount of photovoltaic solar generation that is interconnected to the ISO grid continues to change the ISO’s net load profile and creates more challenges and uncertainty for ISO operations.
Photovoltaic solar generation located behind the customer meter is an additional impact, affecting the gross load and further decreasing the net load that the ISO serves. The result is a constantly increasing ramping requirement, significantly more than what has been required from the generation fleet in the past, both upward and downward. Furthermore, solar generation does not provide significant power at the hours ending 19:00 to 21:00, which leads to reliance on gas and other non-solar generation after sunset. The continuing decline in dispatchable generation in the ISO as dispatchable units retire is beginning to challenge the ISO system’s ability to meet net peak demand after sunset and flexible capacity requirements.
Page 47: “[T]he ISO will be at the greatest operational risk during a late-summer widespread heat wave that results in low net imports due to high peak demands in its neighboring balancing authority areas, concurrent with the diminishing effective load carrying capability of solar resources and the diminishment of hydro generation.”
[1064] News release: “Statewide Flex Alert Issued for Today, Calling for Energy Conservation.” California Independent System Operator, August 14, 2020. <www.caiso.com>
The California Independent System Operator (ISO) has issued a statewide Flex Alert, a call for voluntary electricity conservation, from 3 p.m. to 10 p.m. today. …
Prolonged heat over several consecutive days is expected to drive electricity demand higher, as nighttime temperatures are also forecast to be above average. Remnants of a tropical system are expected to bring cloud cover to areas of California through this event, reducing solar generation, which leads to tighter energy supplies.
Consumers are urged to conserve electricity, especially during the late afternoon and early evening, when the grid is most stressed due to higher demand and solar energy production falling. Consumers are urged to set air conditioner thermostats to 78 degrees or higher, turn off unnecessary lights, and use major appliances before 3 p.m. and after 10 p.m.
[1065] Report: “Final Root Cause Analysis: Mid-August 2020 Extreme Heat Wave.” California Energy Commission, California Public Utilities Commission, and California Independent System Operator, January 13, 2021. <www.caiso.com>
Page 21:
In terms of supply, the extreme heat wave negatively impacted conventional generation (such as thermal resources fueled by natural gas), which typically operates less efficiently during temperature extremes. Even for solar generation, high clouds caused by a storm covering large parts of California and smoke from active fires during these events reduced large-scale grid-connected solar and behind-the-meter solar generation on some days, leading to increased variability.
Page 43:
The construct for RA was developed around peak demand, which until recently has been the most challenging and expensive moment to meet demand. The principle was that if enough capacity was available during peak demand, there would be enough capacity at all other hours of the day as well, since most resources could run 24/7 if needed. With the increase of use-limited resources such as solar generation in recent years, however, this is no longer the case. Today, the single critical period of peak demand is giving way to multiple critical periods during the day, including the net demand peak, which is the peak of load net of solar and wind generation resources.
Page 44:
Since 2016, the CAISO, CEC, and the CPUC have worked to examine the impacts of significant renewable penetration on the grid. Solar generation in particular shifts “utility peaks to a later hour as a significant part of load at traditional peak hours (late afternoon) is served by solar generation, with generation dropping off quickly as the evening hours approach.”50 Furthermore, as the sun sets, demand previously served by behind-the-meter solar generation is coming back to the CAISO system while load remains high. Consequently, on hot days, load later in the day may still be high, after the gross peak has passed, because of air conditioning demand and other load that was being served by behind-the-meter solar coming back on the system. As a result of declining behind-the-meter and front-of-meter (utility scale) generation in the late afternoon, after the peak demand hour of the day, demand is decreasing at a slower rate than net demand is increasing, which creates higher risk of shortages around 7 p.m., when the net demand reaches the peak (net demand peak). …
50 California Energy Commission Staff Report, California Energy Demand Updated Forecast, 2017–2027, January 2017, P. 51.
[1066] Article: “Blackouts Threaten Entire U.S. West This Summer as Heat Awaits.” By Naureen S. Malik, David R. Baker, and Mark Chediak. Bloomberg, May 13, 2021. <www.bloomberg.com>
For many, California’s power crisis in 2020 was the first indication of how serious the regional power shortfall had become. While the blackouts highlighted the state’s reliance on solar power—a resource that ebbs in the evening just as demand picks up—an equally significant problem was California’s dependence on imported electricity. Utilities routinely source power supplies from out of state, drawing electricity across high-voltage transmission lines to wherever it’s needed. But last summer, neighboring states coping with the same heat wave as California were straining to keep their own lights on, and imports were hard to come by. …
While wind and solar capacity have more than tripled in the region, the output from those resources varies by the hour, making them harder to rely on during an unexpected demand crunch. Massive batteries can help make up the difference, but their installation is just beginning. …
Energy consultant Mike Florio, who used to sit on the board of California’s grid operator, said other states can learn from the West’s dilemma. They should keep a variety of resources as they decarbonize, learning how to balance the daily rhythms of solar and wind, and not move too quickly to shutter old gas-burning plants that can provide power in a pinch.
[1067] Webpage: “What Is Geothermal Energy?” U.S. Energy Information Administration. Last reviewed April 23, 2013. <www.eia.gov>
The word geothermal comes from the Greek words geo (earth) and therme (heat). So, geothermal energy is heat from within the Earth. We can recover this heat as steam or hot water and use it to heat buildings or generate electricity. …
People around the world use geothermal energy to heat their homes and to produce electricity by digging deep wells and pumping the heated underground water or steam to the surface. We can also make use of the stable temperatures near the surface of the Earth to heat and cool buildings.
[1068] Webpage: “Use of Geothermal Energy.” U.S. Energy Information Administration. Last reviewed April 26, 2013. <www.eia.gov>
Some applications of geothermal energy use the Earth’s temperatures near the surface, while others require drilling miles into the Earth. The three main uses of geothermal energy are:
• Direct use and district heating systems use hot water from springs or reservoirs near the surface.
• Electricity generation power plants require water or steam at very high temperature (300° to 700°F). Geothermal power plants are generally built where geothermal reservoirs are located within a mile or two of the surface.
• Geothermal heat pumps use stable ground or water temperatures near the Earth’s surface to control building temperatures above ground.
[1069] Webpage: “Geothermal Power Plants.” U.S. Energy Information Administration. Last updated December 17, 2021. <www.eia.gov>
Geothermal power plants use hydrothermal resources that have both water (hydro) and heat (thermal). Geothermal power plants require high-temperature (300°F to 700°F) hydrothermal resources that come from either dry steam wells or from hot water wells. People use these resources by drilling wells into the Earth and then piping steam or hot water to the surface. The hot water or steam powers a turbine that generates electricity. Some geothermal wells are as much as 2 miles deep.
[1070] Report: “Renewable Energy: Federal Agencies Implement Hundreds of Initiatives.” U.S. Government Accountability Office, February 2012. <www.gao.gov>
Page 21:
Ground-source heat pumps, also known as geothermal heat pumps, are devices that take advantage of the relatively constant temperature immediately beneath the earth’s surface to provide heat in the winter and air conditioning in the summer. During the winter, a heat pump transfers the heat of the ground to a fluid-filled set of coils and then pumps this fluid into the building. During the summer, heat pumps work in reverse, extracting heat from the building and transferring it to the ground.
[1071] Webpage: “Geothermal Heat Pumps.” U.S. Energy Information Administration. Last reviewed November 19, 2020. <www.eia.gov>
Although air temperatures above ground change throughout the day and with the seasons, temperatures of the earth 10 feet below ground are consistently between 50°F and 60°F. For most areas of the United States, this means soil temperatures are usually warmer than the air in winter and cooler than the air in summer. Geothermal heat pumps use the earth's constant temperature to heat and cool buildings. Geothermal heat pumps transfer heat from the ground (or water) into buildings during the winter and reverse the process in the summer.
[1072] Webpage: “Use of Geothermal Energy.” U.S. Energy Information Administration. Last reviewed April 26, 2013. <www.eia.gov>
There have been direct uses of hot water as an energy source since ancient times. Ancient Romans, Chinese, and Native American cultures used hot mineral springs for bathing, cooking, and heating. …
After bathing, the most common direct use of geothermal energy is for heating buildings through district heating systems. Hot water near the Earth’s surface can be piped directly into buildings and industries for heat. A district heating system provides heat for 95% of the buildings in Reykjavik, Iceland.
[1073] Webpage: “Geothermal Power Plants.” U.S. Energy Information Administration. Last reviewed December 17, 2021. <www.eia.gov>
“The first geothermal power plant was built in 1904 in Tuscany, Italy, where natural steam erupted from the Earth.”
[1074] Calculated with data from the report: “July 2022 Monthly Energy Review.” U.S. Energy Information Administration, Office of Energy Statistics, July 26, 2022. <www.eia.gov>
Page 7: “Table 1.3. Primary Energy Consumption by Source (Quadrillion Btu)”
Page 179: “Table 10.1. Renewable Energy Production and Consumption by Source (Trillion Btu)”
NOTE: An Excel file containing the data and calculations is available upon request.
[1075] Calculated with data from the report: “Electric Power Monthly with Data for January 2022.” U.S. Energy Information Administration, Office of Energy Statistics, March 24, 2022. <www.eia.gov>
Page 17 (of PDF): “Table 1.1. Net Generation by Energy Source: Total (All Sectors), 2012–January 2022 (Thousand Megawatthours)”
Page 18 (of PDF): “Table 1.1.A. Net Generation from Renewable Sources: Total (All Sectors), 2012–January 2022 (Thousand Megawatthours)”
NOTES:
[1076] Webpage: “Where Geothermal Energy Is Found.” U.S. Energy Information Administration. Last reviewed February 15, 2022. <www.eia.gov>
Geothermal reservoirs are naturally occurring areas of hydrothermal resources. These reservoirs are deep underground and are largely undetectable above ground. …
Most of the geothermal power plants in the United States are in western states and Hawaii, where geothermal energy resources are close to the earth’s surface. California generates the most electricity from geothermal energy. The Geysers dry steam reservoir in Northern California is the largest known dry steam field in the world and has been producing electricity since 1960.
[1077] Report: “Nuclear Power’s Role in Generating Electricity.” Congressional Budget Office, May 2008. <www.cbo.gov>
Pages 1–2:
This study compares the cost of advanced nuclear technology with that of other major sources of base-load capacity that are available throughout the country—including both conventional and innovative fossil-fuel technologies. Because the study focuses only on technologies that can be used as base-load capacity in most parts of the country, it does not address … technologies that use resources readily available only in certain areas (such as geothermal or hydroelectric power).
[1078] Book: Energy Investments and the Environment, Selected Topics. Edited by Corazón M. Siddayao with the assistance of Lisa A. Griffin. Economic Development Institute of the World Bank, 1993.
Section 2: “Environmental Considerations in Renewable Energy Policy Development and Investment Planning.” By Wesley K. Foell, Mark E. Hanson, and Collin W. Green. Pages 17–76.
Page 60:
The choice of energy options inevitably involves trade-offs. Among fossil energy sources, there is the trade-off between the relative abundance and low cost of coal and the higher cost but lower emission properties of oil and particularly natural gas, both of which result in lower emissions of carbon, sulfur, and other pollutants. The trade-offs in comparing conventional and renewable resources become even more complex due to some features inherent to renewables. Renewable energy systems tend to have different types and locations of environmental impacts compared to conventional energy sources.
[1079] Report: “Development and Climate Change.” World Bank, International Bank for Reconstruction and Development, 2010. <www.worldbank.org>
Page 191: “Energy policies have to balance four competing objectives—sustain economic growth, increase energy access for the world’s poor, enhance energy security, and improve the environment—tall orders.”
[1080] Booklet: “What You Need to Know About Energy.” National Academy of Sciences, 2008. <nap.nationalacademies.org>
American society, with a standard of living unprecedented in human history, can attribute a large measure of its success to increasingly sophisticated uses of energy. The strength of industry, the speed of transportation, the myriad comforts and conveniences of home and workplace, and the security of the nation all derive from ever more ingenious provision and application of various sources and forms of energy.
But that condition has come at a cost—to irreplaceable resources, to the environment, and to our national independence. Society has begun to question the methods we use to power modern life and to search for better alternatives. As the nationwide debate continues, it is already evident that managing energy use wisely in the 21st century will call for balancing three essential, but quite different, concerns: resources, responsibility, and security.
[1081] Report: “Information on Shale Resources, Development, and Environmental and Public Health Risks.” U.S. Government Accountability Office, September 5, 2012. <www.gao.gov>
Pages 3–4:
To determine what is known about the environmental and public health risks associated with the development of shale oil and gas,10 we reviewed studies and other publications from federal agencies and laboratories, state agencies, local governments, the petroleum industry, academic institutions, environmental and public health groups, and other nongovernmental associations. We identified these studies by conducting a literature search, and by asking for recommendations during interviews with federal, state, and tribal officials; representatives from industry, trade organizations, environmental, and other nongovernmental groups; and researchers from academic institutions. For a number of studies, we interviewed the author or authors to discuss the study’s findings and limitations, if any. We believe we have identified the key studies through our literature review and interviews, and that the studies included in our review have accurately identified currently known potential risks for shale oil and gas development. However, it is possible that we may not have identified all of the studies with findings relevant to our objectives, and the risks we present may not be the only issues of concern.
The risks identified in the studies and publications we reviewed cannot, at present, be quantified, and the magnitude of potential adverse effects or likelihood of occurrence cannot be determined for several reasons. First, it is difficult to predict how many or where shale oil and gas wells may be constructed. Second, the extent to which operators use effective best management practices to mitigate risk may vary. Third, based on the studies we reviewed, there are relatively few studies that are based on comparing predevelopment conditions to postdevelopment conditions—making it difficult to detect or attribute adverse conditions to shale oil and gas development. In addition, changes to the federal, state, and local regulatory environments and the effectiveness of implementing and enforcing regulations will affect operators’ future activities and, therefore, the level of risk associated with future development of oil and gas resources. Moreover, risks of adverse events, such as spills or accidents, may vary according to business practices which, in turn, may vary across oil and gas companies, making it difficult to distinguish between risks associated with the process to develop shale oil and gas from risks that are specific to particular business practices.
[1082] Book: Microeconomics for Public Decisions (2nd edition). By Anne C. Steinemann. Askmar Publishing, 2011.
Pages 344–355:
Cost-Benefit Analysis: Strengths and Limitations
Cost-benefit analysis should be viewed as one tool in a toolbox of methods that can help in decision making. If it is used, its limitations, assumptions, and potential for misuse should be recognized. This section examines the strengths and shortcomings associated with the use of CBA [cost-benefit analysis] in decision making.
Strengths of cost-benefit analysis are that it provides a straightforward, systematic approach for organizing information and evaluating programs, using a single metric: money. The process of performing a CBA can encourage decision makers to take a hard look at the potential impacts of a program, both positive and negative. The process can also make explicit the basis for a decision and the factors considered, which otherwise may have remained undocumented. Yet the strengths of CBA may have corresponding shortcomings.
First, even though a single metric—money—provides ease of evaluation, all benefits and costs do not necessarily have monetary equivalents. Even for benefits and costs that could be, in some sense, represented by monetary amounts, the process of converting a program impact (such as improved health) into a monetary amount, for a specific time period, can be difficult and subject to inaccuracies. Moreover, impacts that don’t have monetary values are often omitted from cost-benefit analyses, even though those impacts may have a large social significance. For instance, many effects are not inherently economic, but concern more fundamental social attributes, such as justice.
Second, uncertainty underlies cost-benefit analysis. It is practically impossible to predict all the future impacts of a program, let alone their magnitudes and their probabilities of occurrence. Analysts generally focus on coming up with numbers to represent costs and benefits, and thus produce a summary number. However, collapsing all benefits and costs into a single number does not reveal the assumptions on which that number is based. Bottom-line myopia sets in and crucial information about sources of uncertainty is obscured.
Third, analyses can produce varying results. As we saw, even when using the same numbers for costs and benefits, different methods for CBA produced different recommendations. The determination of what is a benefit and what is a cost can influence the result. Also, the costs and benefits of one project may be affected by other projects. The discount rate is highly influential and controversial: it implicitly devalues the future, and the higher the rate, the greater the devaluation.
Fourth, cost-benefit analyses have been criticized for being used to justify or influence a decision, rather than to inform a decision. It can be relatively easy to “construct” a CBA to produce a desired outcome. If the original answer is not as desired, the analyst can go out and find more benefits or more costs. This approach has tended to promote “paralysis by analysis”—a fixation with generating data and analyses rather than using CBA to make informed decisions.
Fifth, CBA has also been criticized for its failure to adequately consider issues of equity, both intragenerational and intergenerational. A potential Pareto improvement is not the same as an actual Pareto improvement unless the redistribution actually takes place. In decisions involving intergenerational impacts, compensation may be practically impossible. A larger concern is that discounting implicitly favors present consumption over future consumption. At most discount rates, benefits and costs in the future can appear relatively insignificant in the present. The result may be a tendency to approve projects that promote short-term consumption at the expense of long-term societal welfare. So at some point, we must ask the question that economics cannot answer: What is the legacy we want to leave for future generations?
[1083] Article: “Americans Demand Climate Action (as Long as It Doesn’t Cost Much): Reuters Poll.” By Valerie Volcovici. Reuters, June 26, 2019. <www.reuters.com>
Some 78% believe the government should invest more money to develop clean energy sources such as solar, wind and geothermal, including 69% of Republicans and 79% of independents. …
Support for such changes dropped off dramatically, however, when poll respondents where [sic] asked whether they would be willing to assume certain costs to achieve them.
Only 34% said they would be very likely or somewhat likely to pay an extra $100 a year in taxes to help, including 25% of Republicans and 33% of independents, according to the poll. The results were similar for higher power bills.
[1084] Graphic: “Americans’ Attitude on Climate Action.” By Sirui Zhu. Reuters. Accessed June 23, 2020 at <graphics.reuters.com>
“How likely would you be to do the following in the next year to help limit climate change: … Taxes increased by $100 annually [=] 34% … Electricity bills increased by $100 annually [=] 29% … Note: Poll conducted between June 11–14; Credibility interval: 2% pts.; Sample size: 3,281”
[1085] Calculated with data from the report: “Toplines—Energy Bill—April 24–25, 2010.” Rasmussen Reports. <www.rasmussenreports.com>
“Margin of Sampling Error, ± 3 percentage points with a 95% level of confidence”
NOTE: An Excel file containing the data and calculations is available upon request.
[1086] Poll: “Adults in Five Largest European Countries and the U.S. Supportive of Renewable Energy, But Unwilling to Pay Much More for It.” Harris Interactive, February 26, 2008. <theharrispoll.com>
These are some of the results of a Financial Times/Harris Poll conducted online by Harris Interactive among a total of 6,448 adults aged 16 to 64 within France, Germany, Great Britain, Spain and the United States, and adults aged 18 to 64 in Italy, between January 30 and February 8, 2008. …
Table 6. Increasing the Number of Wind Farms
“How much do you favor or oppose a large increase in the number of wind farms in [the UK, France, Germany, Italy, Spain, the U.S.]?”
United States … Unweighted base [=] 1020 … FAVOR (NET) [=] 92%
[1087] Calculated with data from the poll: “Adults in Five Largest European Countries and the U.S. Supportive of Renewable Energy, But Unwilling to Pay Much More for It.” Harris Interactive, February 26, 2008. <theharrispoll.com>
Table 1. Paying More for Renewable Energy
“How much of an increase would you be willing to pay at the most for energy if it were from renewable sources?”
Base: All EU [European Union] adults in five countries and US adults who have some form of responsibility for paying household energy bills
NOTE: An Excel file containing the data and calculations is available upon request.
[1088] For documentation, visit the section of this research about transportation fuel costs.
[1089] Report: “Federal Energy Subsidies: Direct and Indirect Interventions in Energy Markets.” U.S. Energy Information Administration, November 1992. <www.justfacts.com>
Page 3:
Much current debate on energy policy focuses on externalities associated with energy use. Many believe there is a large implicit subsidy to energy production and consumption insofar as pollution results in environmental costs not fully charged to those responsible. Failure to internalize “recognized” externalities in the context of current fuel use may result in conventional energy being underpriced compare to other energy sources. Advocates of increased use of renewable energy claim this form of “subsidy” to be central to the continued dominance of fossil fuels as a component of energy supply.
In fact, the effort to deal with environmental concerns has become a central feature of Federal energy policy. Substantial costs which were formerly outside the market mechanism have, through the implementation of a series of taxes and regulations, been internalized to energy markets.
[1090] Report: “Federal Electricity Subsidies.” U.S. Government Accountability Office, October 2007. <www.gao.gov>
Page 10: “Subsidies are broadly defined as payments or benefits provided to encourage certain desired activities or behaviors.”
[1091] Report: “Federal Financial Interventions and Subsidies in Energy Markets 1999: Primary Energy.” U.S. Energy Information Administration, September 1999. <www.justfacts.com>
Page 1:
There is no universally accepted definition of what constitutes a subsidy. Typically, a subsidy is defined as a transfer of economic resources by a government to the buyer or seller of a good or service that has the effect of reducing the price paid, increasing the price received, or reducing the cost of production of the good or service. The net effect of such a subsidy is to stimulate the production or consumption of a commodity over what it would otherwise have been.3 The transfer of resources from the government entity must be contingent in some way on the actual production or consumption of the subsidized good or service by the recipient.
3 See C. Shoup, Public Finance (Chicago, IL: Aldine Publishing Company, 1969), p. 145.
[1092] Report: “Direct Federal Financial Interventions and Subsidies in Energy in Fiscal Year 2010.” U.S. Energy Information Administration, July 2011. <www.eia.gov>
Page ix: “This report only includes subsidies meeting the following criteria: they are provided by the federal government, they provide a financial benefit with an identifiable FY 2010 federal budget impact, and, they are specifically targeted at energy.”
[1093] Report: “Federal Energy Subsidies: Direct and Indirect Interventions in Energy Markets.” U.S. Energy Information Administration, November 1992. <www.justfacts.com>
Page 4: “[T]he costs or benefits of many indirect subsidies are not reflected in budget documents but rather in the financial accounts of affected energy consumers and producers.”
[1094] As shown by the next two references, EIA [U.S. Energy Information Administration] previously classified loan guarantees and government R&D [research and development] as indirect subsidies. These are now considered to be direct subsidies under the current definition of the terms.
a) Report: “Federal Energy Subsidies: Direct and Indirect Interventions in Energy Markets.” U.S. Energy Information Administration, November 1992. <www.justfacts.com>
Page 2: “Subsidies in the form of direct payments to producers or consumers are termed direct subsidies. Direct subsidies also include tax expenditures. … There are also many indirect subsidies. … Indirect subsidies include provision of energy or energy services at below-market prices; loans or loan guarantees; insurance services; research and development; and the unreimbursed provision by the Government of environmental, safety, or regulatory services.”
b) Report: “Direct Federal Financial Interventions and Subsidies in Energy in Fiscal Year 2010.” U.S. Energy Information Administration, July 2011. <www.eia.gov>
Page viii: “Energy subsidies and interventions discussed in this report are divided into five separate program categories: Direct Expenditures to Producers or Consumers … Tax Expenditures … Research and Development (R&D) … Loans and Loan Guarantees … Electricity programs serving targeted categories of electricity consumers in several geographic regions of the country.”
[1095] Report: “Energy Tax Policy: Historical Perspectives on and Current Status of Energy Tax Expenditures.” By Molly F. Sherlock. Congressional Research Service, May 2, 2011. <www.leahy.senate.gov>
Page 10:
Both the production and consumption of energy often generate negative externalities.22 For example, burning fossil fuels contributes to air pollution and generates greenhouse gasses. When an activity generates a negative externality, imposing a tax on the activity can improve economic efficiency. For example, driving gasoline powered motor vehicles may impose negative externalities due to polluting emissions as well as increased highway congestion. Imposing a tax equal in value to the monetary value of the driving-induced environmental and congestion damages reduces the equilibrium quantity of driving. By imposing a tax, potential drivers face a price of driving that is equal to the social marginal cost associated with driving. With a tax, an individual’s choices regarding driving are based on their own costs as well as the external costs driving imposes on society.
As an alternative, policymakers often subsidize a substitute activity, one that is associated with fewer negative externalities. Following the example above, policymakers may choose to subsidize public transportation, reducing the price of public transportation relative to driving. Currently, there are a number of subsidies available for renewable energy production and technologies.
[1096] Report: “Direct Federal Financial Interventions and Subsidies in Energy in Fiscal Year 2010.” U.S. Energy Information Administration, July 2011. <www.eia.gov>
Page 63:
Title 1703 of EPAct05 [Energy Policy Act of 2005] authorizes the DOE [U.S. Department of Energy] to make loan guarantees to fund projects related to the generation and conservation of electricity, including nuclear power. These projects must avoid, reduce or sequester greenhouse gasses and employ new or significantly different technologies compared to ones currently in commercial operation in the United States.
[1097] Report: “Energy Tax Policy: Historical Perspectives on and Current Status of Energy Tax Expenditures.” By Molly F. Sherlock. Congressional Research Service, May 2, 2011. <www.leahy.senate.gov>
Page 11:
Informational problems and a variety of other market barriers may also be used to justify government intervention in energy markets. For example, homeowners may not know the precise payback or rate of return of a specific energy-efficient device. This may explain the so-called “energy paradox”—the empirical observation that consumers require an abnormally high rate of return to undertake energy-efficiency investments.25 High initial first costs of energy-efficiency investments are also often cited as a barrier to investment in energy efficiency.26 When externalities lead to an inefficient use of energy resources, tax policy may effectively address the inefficiency. It is less clear that tax policy will effectively address the inefficiency when informational problems or other barriers prevent an efficient allocation of energy resources. While tax subsidies can be used to reduce the cost of investing in energy-efficient property, informational programs or consumer lending programs may also be effective at encouraging investments in energy-efficiency.
[1098] Report: “Energy Tax Policy: Historical Perspectives on and Current Status of Energy Tax Expenditures.” By Molly F. Sherlock. Congressional Research Service, May 2, 2011. <www.leahy.senate.gov>
Pages 11–12:
Preserving national security is another often-cited rationale for intervention in energy markets. Presently, much of the petroleum consumed in the United States is derived from foreign sources.27 There are potentially a number of external costs associated with petroleum importation, especially when imported from unstable countries and regions. First, a high level of reliance on imported oil may contribute to a weakened system of national defense or contribute to military vulnerability in the event of an oil embargo or other supply disruption. Second, there are costs to allocating more resources to national defense than otherwise necessary when relying on high levels of imported oil.28 Specifically, there is an opportunity cost associated with resources allocated to national defense, as such resources are not available for other domestic policy initiatives and programs. To the extent that petroleum importers fail to take these external costs into account, there is market failure. While imposing a tax on imported oil would theoretically correct for this externality, in practice such a tax would likely violate trade agreements. Instead, policymakers have historically subsidized domestic oil and gas production.
[1099] Report: “Challenges of Electric Power Industry Restructuring for Fuel Suppliers.” U.S. Energy Information Administration, September 1998. <www.eia.gov>
Page 67:
The oil embargo of 1973 was a catalyst for the proposal and adoption of the National Energy Act of 1978, a compendium of statutes aimed at restructuring the U.S. energy sector. One objective of the Act was to reduce the Nation’s dependence on foreign oil and its vulnerability to interruptions in oil supply through the development of renewable and alternative energy sources.
[1100] Report: “Direct Federal Financial Interventions and Subsidies in Energy in Fiscal Year 2010.” U.S. Energy Information Administration, July 2011. <www.eia.gov>
Page 29:
LIHEAP [Low Income Home Energy Assistance Program] was established as a block grant program in 1981 for the purpose of subsidizing heating and cooling costs for low-income households. Because LIHEAP is a block grant, LIHEAP grants are provided to States, territories and Tribes who are then free to administer the program within the requirements of federal law. Federal LIHEAP requirements set eligibility at 150 percent of the federal poverty level or 60 percent of the State’s median income, but do have some flexibility and allow “maximum policy discretion to grantees.” Other federal rules include coordination with DOE’s [U.S. Department of Energy] Weatherization Assistance program, annual audits, and outreach activities. Heating and/or cooling assistance funds may be paid directly to eligible households or to retail energy suppliers in the form of cash or vouchers but in practice the majority of funds are paid directly to the energy providers. In addition to funds used for heating and/or cooling assistance, money must be set aside by recipients for energy crisis intervention and has been released for natural disasters, such as Hurricane Katrina in 2005.
[1101] Article: “A Gold Rush of Subsidies in the Search for Clean Energy.” By Eric Lipton and Clifford Krauss. New York Times, November 11, 2011. <www.nytimes.com>
States like California sweetened the pot by offering their own tax breaks and by approving long-term power-purchase contracts that, while promoting clean energy, will also require ratepayers to pay billions of dollars more for electricity for as long as two decades. …
P.G.& E. [Pacific Gas & Electric], and ultimately its electric customers, will pay NRG $150 to $180 a megawatt-hour, according to a person familiar with the project, who asked not to be identified because the price information was confidential. At the time the contract was awarded, that was about 50 percent more than the expected market cost of electricity in California from a newly built gas-powered plant, state officials said.
[1102] Report: “The Impact of Ethanol Use on Food Prices and Greenhouse-Gas Emissions.” Congressional Budget Office, April 2009. <www.cbo.gov>
Page 3:
The more than 9 billion gallons of ethanol that Americans consumed during 2008 displaced about 6 billion gallons of gasoline. The difference in the number of gallons of ethanol on the one hand and gasoline on the other arises because the energy content of a gallon of gasoline is greater than that of a gallon of ethanol. About 1.5 gallons of ethanol are required to provide as much energy as 1 gallon of gasoline.6
The federal government has supported the development and use of ethanol since the late 1970s through programs that subsidize the production of ethanol, impose tariffs on ethanol imports, and mandate particular amounts of consumption. Those programs provide support because, when the two fuels are assessed on the basis of their energy content, ethanol has often been more expensive than gasoline to produce in the United States.
Page 4: “It is unlikely that, on average, ethanol producers over the past several decades would have turned a profit if they had not received production subsidies.”
[1103] Report: “Challenges of Electric Power Industry Restructuring for Fuel Suppliers.” U.S. Energy Information Administration, September 1998. <www.eia.gov>
Page 67:
Public policies favoring renewable energy are nothing new. Policies including tax and financial incentives and guaranteed purchase power contracts, among others, have supported the development of renewable energy in the past. Such policies have sought to develop a sustainable energy future, reduce dependence on foreign oil, and reduce the environmental impacts of fossil-fueled electricity generation. These ends were deemed to be more important than the fact that alternative fuels cost more than fossil fuel sources of energy.
[1104] Working paper: “Do Renewable Portfolio Standards Deliver?” By Michael Greenstone and others. Energy Policy Institute, University of Chicago, April 2019. <bfi.uchicago.edu>
Page 1:
Renewable Portfolio Standards (RPS) are the largest and perhaps most popular climate policy in the US, having been enacted by 29 states and the District of Columbia. Using the most comprehensive panel data set ever compiled on program characteristics and key outcomes, we compare states that did and did not adopt RPS policies, exploiting the substantial differences in timing of adoption. The estimates indicate that 7 years after passage of an RPS program, the required renewable share of generation is 1.8 percentage points higher and average retail electricity prices are 1.3 cents per kWh, or 11% higher; the comparable figures for 12 years after adoption are a 4.2 percentage point increase in renewables’ share and a price increase of 2.0 cents per kWh or 17%. These cost estimates significantly exceed the marginal operational costs of renewables and likely reflect costs that renewables impose on the generation system, including those associated with their intermittency, higher transmission costs, and any stranded asset costs assigned to ratepayers. The estimated reduction in carbon emissions is imprecise, but, together with the price results, indicates that the cost per metric ton of CO2 abated exceeds $130 in all specifications and ranges up to $460, making it least several times larger than conventional estimates of the social cost of carbon. These results do not rule out the possibility that RPS policies could dynamically reduce the cost of abatement in the future by causing improvements in renewable technology.1
[1105] Report: “Annual Energy Outlook 2013 with Projections to 2040.” U.S. Energy Information Administration, April 2013. <www.osti.gov>
Page 38:
These alternative cases may also have significant implications for the broader economy. … In the High Oil and Gas Resource case, increasing energy production has immediate benefits for the economy. U.S. industries produce more goods with 12 percent lower energy costs in 2025 and 15 percent lower energy costs in 2040. Consumers see roughly 10 percent lower energy prices in 2025, and 13 percent lower energy prices in 2040, as compared with the Reference case. Cheaper energy allows the economy to expand further, with real GDP [gross domestic product] attaining levels that are on average about 1 percent above those in the Reference case from 2025 through 2040, including growth in both aggregate consumption and investment.
[1106] Textbook: Microeconomics for Today (6th edition). By Irvin B. Tucker. South-Western Cengage Learning, 2010.
Page 450: “GDP [gross domestic product] per capita provides a general index of a country’s standard of living. Countries with low GDP per capita and slow growth in GDP per capita are less able to satisfy basic needs for food, shelter, clothing, education, and health.”
[1107] Report: “Nuclear Power’s Role in Generating Electricity.” Congressional Budget Office, May 2008. <www.cbo.gov>
Pages 22–23: “Because production tax credits reduce the price of electricity, consumers might use electrical power less efficiently and expand the gap between the price of electricity and its cost to society at the expense of the general taxpayer.”
[1108] Report: “Energy Tax Policy: Historical Perspectives on and Current Status of Energy Tax Expenditures.” By Molly F. Sherlock. Congressional Research Service, May 2, 2011. <www.leahy.senate.gov>
Page 10:
While taxing activities associated with negative externalities may enhance economic efficiency, subsidizing the alternative activity is not necessarily economically efficient. Subsidizing renewable energy, in this context, reduces the average price of energy, which increases demand and ultimately consumption. Subsidies for renewable energy, by decreasing the average price of energy, work against initiatives for energy efficiency.
[1109] Report: “Direct Federal Financial Interventions and Subsidies in Energy in Fiscal Year 2010.” U.S. Energy Information Administration, July 2011. <www.eia.gov>
Page 29:
LIHEAP [Low Income Home Energy Assistance Program] was established as a block grant program in 1981 for the purpose of subsidizing heating and cooling costs for low-income households. Because LIHEAP is a block grant, LIHEAP grants are provided to States, territories and Tribes who are then free to administer the program within the requirements of federal law. Federal LIHEAP requirements set eligibility at 150 percent of the federal poverty level or 60 percent of the State’s median income, but do have some flexibility and allow “maximum policy discretion to grantees.” Other federal rules include coordination with DOE’s [U.S. Department of Energy] Weatherization Assistance program, annual audits, and outreach activities. Heating and/or cooling assistance funds may be paid directly to eligible households or to retail energy suppliers in the form of cash or vouchers but in practice the majority of funds are paid directly to the energy providers.
[1110] Report: “The Impact of Ethanol Use on Food Prices and Greenhouse-Gas Emissions.” Congressional Budget Office, April 2009. <www.cbo.gov>
Page vii:
The use of ethanol in gasoline has increased substantially over the past decade. Currently, most ethanol in the United States is produced from domestically grown corn, and the rapid rise in the fuel’s production and usage means that roughly one-quarter of all corn grown in the United States is now used to produce ethanol. Since 2006, food prices have also risen more quickly than in earlier years, affecting federal spending for nutrition programs (such as school lunches) and the household budgets of individual consumers. The increased use of ethanol accounted for about 10 percent to 15 percent of the rise in food prices between April 2007 and April 2008, the Congressional Budget Office (CBO) estimates. In turn, that increase will boost federal spending for the Supplemental Nutrition Assistance Program (SNAP, formerly the Food Stamp program) and child nutrition programs by an estimated $600 million to $900 million in fiscal year 2009. Last year, the use of ethanol reduced gasoline consumption in the United States by about 4 percent and greenhouse-gas emissions from the transportation sector by less than 1 percent.
Page 6:
Producing ethanol for use in motor fuels increases the demand for corn, which ultimately raises the prices that consumers pay for a wide variety of foods at the grocery store, ranging from corn syrup sweeteners found in soft drinks to meat, dairy, and poultry products. In addition, the demand for corn may help push up the prices of other commodities, such as soybeans. (Farmers that increase the number of acres they plant with corn to meet rising demand will most likely plant fewer acres with other crops.)
Page 8: “Production rose despite the increased costs for producing corn that were caused by rapid hikes in the price of fuel, especially oil and natural gas. (Oil is used to produce diesel fuel and gasoline, both of which are used in growing, harvesting, and transporting corn to market; natural gas is used to produce fertilizers and to dry corn for storage.)”
Page 10:
The impact on food prices resulting from hikes in the price of corn related to ethanol production was smaller than the effect of higher prices for energy, which contribute to the CPI-U [consumer price index for urban consumers] for food directly through higher costs for transportation and electricity and indirectly through higher costs for producing commodities. As an example, the CPI-U for energy rose by 16 percent between April 2007 and April 2008.36 Given the contributions that the prices of transportation, fuel, and electricity make to the CPI-U for food, the increase in the CPI-U for energy implies a direct boost in the CPI-U for food of 1.1 percentage points (22 percent) of the 5.1 percent increase in food prices during the April 2007–April 2008 period. Alternatively, the producer price index for intermediate energy products could be used as a measure (and may better reflect the costs that the retail food sector faces for energy). Using that measure leads to an increase in energy prices between April 2007 and April 2008 of 25 percent, which implies a direct increase in the CPI-U for food of 1.8 percentage points (36 percent) of the increase in food prices during that period.37
The impact of higher prices for food will probably be greater in other countries than in the United States because the percentage of households’ income that is spent on food in those other nations is larger and the value of commodities makes up a bigger share of the cost of food. (in 2007, the share of spending for goods and services that a household allocated to food purchases for consumption at home was less than 6 percent in the United States but more than 32 percent in India.)38 In contrast to countries that export commodities, countries that import a large percentage of their food will also be adversely affected by rising global prices for commodities. The United Nations’ Food and Agriculture Organization has estimated that, in contrast to steadily declining real (inflation-adjusted) prices for food commodities between 1974 and 2000, real prices for commodities (including corn, soybeans, and sugarcane) increased by 135 percent between January 2000 and April 2008.39
[1111] Article: “Rush to Use Crops as Fuel Raises Food Prices and Hunger Fears.” By Elisabeth Rosenthal. New York Times, April 6, 2011. <www.nytimes.com>
This year, the United Nations Food and Agriculture Organization reported that its index of food prices was the highest in its more than 20 years of existence. Prices rose 15 percent from October to January alone, potentially “throwing an additional 44 million people in low- and middle-income countries into poverty,” the World Bank said. …
Olivier Dubois, a bioenergy expert at the Food and Agriculture Organization in Rome, said it was hard to quantify the extent to which the diversions for biofuels had driven up food prices.
“The problem is complex, so it is hard to come up with sweeping statements like biofuels are good or bad,” he said. “But what is certain is that biofuels are playing a role. Is it 20 or 30 or 40 percent? That depends on your modeling.”
[1112] Article: “Desperate Haitians Survive on Mud Cookies.” By Jonathan M. Katz. Associated Press, January 30, 2008. <www.cbsnews.com>
It was lunchtime in one of Haiti’s worst slums, and Charlene Dumas was eating mud. With food prices rising, Haiti’s poorest can’t afford even a daily plate of rice, and some take desperate measures to fill their bellies. …
Food prices around the world have spiked because of higher oil prices, needed for fertilizer, irrigation and transportation. Prices for basic ingredients such as corn and wheat are also up sharply, and the increasing global demand for biofuels is pressuring food markets as well.
The problem is particularly dire in the Caribbean, where island nations depend on imports and food prices are up 40 percent in places. …
Still, at about 5 cents apiece, the [mud] cookies are a bargain compared to food staples. About 80 percent of people in Haiti live on less than $2 a day and a tiny elite controls the economy.
[1113] Paper: “Impacts of Biofuel Cultivation on Mortality and Crop Yields.” By K. Ashworth and others. Nature Climate Change, January 6, 2013. Pages 492–496. <www.nature.com>
Page 492:
Ground-level ozone is a priority air pollutant…. It is produced in the troposphere through photochemical reactions involving oxides of nitrogen (NOX) and volatile organic compounds (VOCs). … Concerns about climate change and energy security are driving an aggressive expansion of bioenergy crop production and many of these plant species emit more isoprene than the traditional crops they are replacing. Here we quantify the increases in isoprene emission rates caused by cultivation of 72 Mha of biofuel crops in Europe. We then estimate the resultant changes in ground-level ozone concentrations and the impacts on human mortality and crop yields that these could cause.
[1114] Report: “Energy Tax Policy: Historical Perspectives on and Current Status of Energy Tax Expenditures.” By Molly F. Sherlock. Congressional Research Service, May 2, 2011. <www.leahy.senate.gov>
Page 10:
Further, the government must raise revenue to finance these [energy] subsidies. Such revenues may be raised using distortionary taxes.24
24 Distortionary taxes are those that lead firms or consumers to change their behavior. For example, if a tax on income is used to fund public transportation subsidies, this could lead to a reduction in income-generating activities, reducing economic output.
NOTE: Facts about the economic effects of taxes are available in Just Facts’ research on taxes.
[1115] Report: “United States Federal Debt: Answers to Frequently Asked Questions, An Update.” U.S. Congress, Government Accountability Office, August 12, 2004. <www.gao.gov>
Page 39:
Over the long term, the costs of federal borrowing will be borne by tomorrow’s workers and taxpayers. Higher saving and investment in the nation’s capital stock—factories, equipment, and technology—increase the nation’s capacity to produce goods and services and generate higher income in the future. Increased economic capacity and rising incomes would allow future generations to more easily bear the burden of the federal government’s debt. Persistent deficits and rising levels of debt, however, reduce funds available for private investment in the United States and abroad. Over time, lower productivity and GDP [gross domestic product] growth ultimately may reduce or slow the growth of the living standards of future generations.
NOTE: Facts about the consequences of government debt are available in Just Facts’ research on the national debt.
[1116] Report: “Federal Support for the Development, Production, and Use of Fuels and Energy Technologies.” Congressional Budget Office, November 2015. Updated 6/29/16. <www.cbo.gov>
Page 2:
Although some studies have found that certain technologies, including those for generating electricity from wind, have been responsive to subsidies, a review by the National Academy of Sciences (NAS) concluded that the tax credit for the generation of electricity from renewable sources reduced CO2 emissions at an average cost of $250 per ton. By comparison, federal agencies recently estimated that the value of the benefits of reducing CO2 emissions is between $40 and $60 per ton.
Page 12:
Tax preferences for domestic production (including the option to expense investment costs on the basis of gross income rather than production, as well as the other preferences listed in Table 1 on page 6) have had a minimal effect on the amount of domestic oil produced; as a result, measured on the basis of each additional barrel of oil produced, the cost of the tax preferences has been substantial.
Page 18:
In general, funding for the early stages of developing new technologies, such as research that provides a better understanding of materials or underlying physical processes, has been more likely to yield benefits in excess of costs than has funding for the commercial demonstration of large integrated systems, such as projects demonstrating technological innovations in the generation of electrical power. Early-stage technology development programs, often in energy efficiency, regularly returned economic benefits that exceeded their costs by substantial amounts. Specifically, DOE [U.S. Department of Energy]-funded R&D [research and development] on refrigeration, electronic ballasts for lights, compact fluorescent lights, low-emission windows, and improvements in oil field technology have yielded positive net benefits.33 Not only can federal agencies play a pivotal role in increasing the understanding of physical phenomena that are critical to the development of new technology, they can also serve as the repositories of technical expertise and specialized instruments.
In contrast, many large energy technology demonstration projects undertaken in the 1970s and 1980s produced returns that fell short of their costs. DOE has generally been unsuccessful at lowering costs by funding large demonstration projects, for two reasons. First, federal agencies, including DOE, typically do not have an advantage in lowering production costs.34 In most cases, industrial costs decline only when industries begin producing in substantial volumes, and such costs might even rise with the first few projects. Second, DOE’s handling of large demonstration projects has been questionable in the past; the Government Accountability Office and others have long criticized DOE for poor management of such projects.35
[1117] Report: “Federal Financial Interventions and Subsidies in Energy Markets 2007.” U.S. Energy Information Administration, April 2008. <www.eia.gov>
Page 41:
65 Several studies suggest that the return on overall Federal R&D [research and development] investment is much lower than the return on private-sector R&D, implying relatively high failure rates. See, Terlecyyj, N., “Effects of R&D on the Productivity Growth of Industries: An Exploratory Study” (Washington, DC: National Planning Association, 1974), and Griliches, Z., “Returns to R&D in the Private Sector,” in Kendrick, J. and Vaccara, B. (eds.), “New Developments in Productivity Measurement and Analysis,” NBER [National Bureau of Economic Research] Studies in Income and Wealth No. 44 (Chicago, IL: University of Chicago Press, 1980), pp. 419–454. This result need not be surprising, as the Federal Government’s research portfolio may be much riskier than the private sector’s.
66 One recent study, “Energy Research at DOE [U.S. Department of Energy]: Was It Worth It? Energy and Fossil Energy Research 1978 to 2000,” concluded that: “DOE’s R&D programs in fossil energy and energy efficiency have yielded significant benefits (economic, environmental, and national security-related), important technological options for potential applications in a different (but possible) economic, political and/or environmental setting, and important additions to the stock of engineering and scientific knowledge in a number of fields.” The committee also found that DOE has not employed a consistent methodology for estimating and evaluating the benefits from its R&D programs in these and presumably other areas.” National Research Council Committee on the Benefits of DOE R&D on Energy Efficiency and Fossil Energy, Washington, DC: National Academy Press (2001), p. 5.
[1118] Report: “Federal Support for the Development, Production, and Use of Fuels and Energy Technologies.” Congressional Budget Office, November 2015. Updated 6/26/16. <www.cbo.gov>
Page 14:
However, such subsidies are typically less cost-effective than incorporating external costs into energy prices because they have some combination of the following undesirable effects: …
The government may end up paying firms or households to make choices about investment, production, or consumption that they would have made without the subsidies. For example, tax credits for energy-efficient windows might go to homeowners who would have purchased them anyway.
[1119] Article: “A Gold Rush of Subsidies in the Search for Clean Energy.” By Eric Lipton and Clifford Krauss. New York Times, November 11, 2011. <www.nytimes.com>
… NRG Energy is building … a compound of nearly a million solar panels that will produce enough electricity to power about 100,000 homes. …
Taxpayers and ratepayers are providing subsidies worth almost as much as the entire $1.6 billion cost of the project. …
The government support—which includes loan guarantees, cash grants and contracts that require electric customers to pay higher rates—largely eliminated the risk to the private investors and almost guaranteed them large profits for years to come. …
“I have never seen anything that I have had to do in my 20 years in the power industry that involved less risk than these projects,” he [NRG’s chief executive David W. Crane] said in a recent interview. …
The total value of all those subsidies in today’s dollars is about $1.4 billion, leading to an expected rate of return of 25 percent for the project’s equity investors, according to Booz. [“Booz & Company, a strategic consulting firm that regularly performs such studies for private investors.”]
Mr. Crane of NRG disputed the Booz estimate, saying that the company’s return on equity was “in the midteens.”
[1120] Report: “Nuclear Power’s Role in Generating Electricity.” Congressional Budget Office, May 2008. <www.cbo.gov>
Page 16: “Government incentives that directly subsidize electricity generation or transfer financial risk from investors to the public decrease levelized costs in comparison to actual costs.”
Page 22:
Loan guarantees and insurance against delays reduce the financial risk of investing in advanced nuclear power plants by transferring risk to the public. The reduced risk means investors would incur lower costs for financing construction and other activities before a plant began operating. However, economic theory suggests that such incentives cause recipients to invest in excessively risky projects because they do not bear all the cost of a project’s failure.
Page 33: “The loan guarantee program could encourage investors to choose relatively risky projects over more certain alternatives because they would be responsible for only about 20 percent of a project’s costs but would receive 100 percent of the returns that exceeded costs.”
[1121] Article: “Green Firms Get Fed Cash, Give Execs Bonuses, Fail.” By Ronnie Greene and Matthew Mosk. iWatch News and ABC News, March 6, 2012. <abcnews.go.com>
President Obama’s Department of Energy helped finance several green energy companies that later fell into bankruptcy—but not before the firms doled out six-figure bonuses and payouts to top executives, a Center for Public Integrity and ABC News investigation found.
Take, for instance, Beacon Power Corp., the second recipient of an Energy Department loan guarantee in 2009. In March 2010, the Massachusetts energy storage company paid cash bonuses of $259,285 to three executives in part due to progress made on the $43 million energy loan, Securities and Exchange Commission records show. Last October, Beacon Power filed for Chapter 11 bankruptcy.
[1122] Report: “Direct Federal Financial Interventions and Subsidies in Energy in Fiscal Year 2010.” U.S. Energy Information Administration, July 2011. <www.eia.gov>
Page viii: “Direct Expenditures to Producers or Consumers. These are federal programs that involve direct cash outlays which provide a financial benefit to producers or consumers of energy.”
Page 25:
Until recently energy-related direct expenditures were dominated by funding for LIHEAP [Low Income Home Energy Assistance Program] and weatherization programs. Expenditures for these programs have increased in recent years reflecting increased spending to assist low income consumers with rising energy costs. In the wake of the credit crisis and a sharp economic downturn, the federal government launched several new energy-specific direct expenditure programs that are largely directed at renewables and energy conservation. Section 1603 of ARRA [American Recovery and Reinvestment Act of 2009 (a.k.a., Obama stimulus)], which provides a grant option in lieu of long-standing PTC [production tax credits] and ITCs [investment tax credits] for qualifying sources of renewable energy, is the most prominent of these new programs.
[1123] Report: “Federal Energy Subsidies: Direct and Indirect Interventions in Energy Markets.” U.S. Energy Information Administration, November 1992. <www.justfacts.com>
Page ix:
The most obvious subsidy is the direct expenditure from the Federal budget. As the report shows, these direct expenditures account for only a tiny fraction of the total impact of Federal Government intervention in energy markets. In addition, tax subsidies had to be considered. These are the tax incentives which are received by producers or consumers of various forms of energy. In this case, the Government does not spend money, but it loses revenue that it would have otherwise received. The effect is basically the same. Those who receive the tax subsidies benefit in either their production or their consumption activities.
Page 21:
Tax expenditures are reductions in Government revenues resulting from preferential tax treatment for particular taxpayers. They are termed tax expenditures because the objectives they are intended to achieve can also be reached by a direct expenditure of Government funds. …
Many tax expenditure programs are functionally equivalent to direct expenditure programs. The basis for selecting one or the other approach to provide benefits to taxpayers is not always clear. Several factors may be considered during the selection process. Tax expenditures, in particular, may be less subject to annual review in the normal budget cycle. Also, tax expenditure programs are less visible than direct expenditure programs in the budget process.
[1124] Report: “Direct Federal Financial Interventions and Subsidies in Energy in Fiscal Year 2010.” U.S. Energy Information Administration, July 2011. <www.eia.gov>
Page viii: “Tax Expenditures. These are provisions in the federal tax code that reduce the tax liability of firms or individuals who take specified actions that affect energy production, consumption, or conservation.”
Page 8:
The determination of what exactly is a preferential provision is subject to interpretation. Items in the budget identified as tax expenditures by the U.S. Treasury Department on occasion differ from those determined to be tax expenditures by the Joint Committee on Taxation (JCT)—the two bodies which produce these estimates. Historical tax expenditure data used in this report are taken from a number of government sources. For FY 2010, the Treasury Department is the primary provider of estimates for tax expenditures, supplemented by data provided by the JCT.
NOTE: Tax Expenditures are also known as “tax preferences,” and facts about how they function are available in Just Facts’ research on taxes.
[1125] Report: “Federal Energy Subsidies: Direct and Indirect Interventions in Energy Markets.” U.S. Energy Information Administration, November 1992. <www.justfacts.com>
Page 3:
Subsidy-like effects flow from the imposition of a range of regulations imposed by Government on energy markets. Regulations may directly subsidize a fuel by mandating a specified level of consumption, thereby creating a market which might not otherwise exist. The imposition of oxygenate requirements for gasoline in the winter of 1992, which stimulates demand for alcohol-based additives, is a recent example.
[1126] Report: “Annual Energy Outlook 2013 with Projections to 2040.” U.S. Energy Information Administration, April 2013. <www.osti.gov>
Page 13: “Currently, 30 states and the District of Columbia have an enforceable renewable portfolio standard (RPS) or similar law (Table 3). Under such standards, each state determines its own levels of renewable generation, eligible technologies44, and noncompliance penalties. … In 2025 the [RPS] targets account for about 10 percent of U.S. electricity sales.”
Page 14: “Table 3. Renewable portfolio standards in the 30 states and District of Columbia with current mandates”
Page 75: “Regional growth in non-hydroelectric renewable electricity generation is based largely on three factors: availability of renewable energy resources, cost competitiveness with fossil fuel technologies, and the existence of state RPS programs that require the use of renewable generation.”
[1127] Report: “Renewable Energy: Federal Agencies Implement Hundreds of Initiatives.” U.S. Government Accountability Office, February 2012. <www.gao.gov>
Page 16:
In addition, EPA’s [U.S. Environmental Protection Agency] Renewable Fuel Standard program, mandated by the Clean Air Act, as amended, generally requires the volume of biofuels used in the transportation sector in the 48 contiguous states to increase through 2022 to an annual total of 36 billion gallons.26
26 Under the act, the Renewable Fuel Standard applies to transportation fuel sold or introduced into commerce in the 48 contiguous states. However, the Administrator of the EPA is authorized, upon a petition from Alaska or Hawaii, to allow the Renewable Fuel Standard to apply in that state. On June 22, 2007, Hawaii petitioned EPA to opt into the Renewable Fuel Standard, and the Administrator approved that request. For the purposes of this report, statements that the Renewable Fuel Standard applies to U.S. transportation fuel refer to the 48 contiguous states and Hawaii. For more information on biofuels and the Renewable Fuel Standard, see GAO [U.S. Government Accountability Office], Biofuels: Challenges to the Transportation, Sale, and Use of Intermediate Ethanol Blends, GAO-11-513 (Washington, D.C.: June 3, 2011), and Biofuels: Potential Effects and Challenges of Required Increases in Production and Use, GAO-09-446 (Washington, D.C.: Aug. 25, 2009).
[1128] Report: “Biofuels Issues and Trends.” U.S. Energy Information Administration, October, 2012. <www.eia.gov>
Page 18:
RINs [Renewable Identification Numbers] for the biomass-based diesel component of RFS2 [Renewable Fuel Standard, Energy Independence and Security Act of 2007] have become especially important to biodiesel producers. The RFS2 compliance mechanism offers an economic incentive to producers of renewable fuel to achieve the mandated levels. Refiners and petroleum product importers demonstrate compliance with the RFS2 through the submission of RINs that are generated by the production of qualifying renewable fuels. Fuel blenders may separate RINs from physical volumes of renewable fuel and subsequently sell any RINs above the quantity needed to meet their individual requirement. Thus, RINs act as tradable credits that can offset any cost disadvantage renewable fuels may have over comparable petroleum products in order to achieve the required levels of consumption.
[1129] Report: “Renewable Energy: Federal Agencies Implement Hundreds of Initiatives.” U.S. Government Accountability Office, February 2012. <www.gao.gov>
Page 3:
The federal government is also the single largest user of energy in the United States, and a number of recent federal laws and executive orders have established requirements and direction for federal agencies to (1) reduce energy consumption and greenhouse gas emissions and increase renewable energy use at their facilities, and (2) to reduce petroleum consumption and increase the use of alternative fuels in their vehicle fleets.
Page 29:
Similarly, the Navy’s Alternative Fuels Program focuses on examining whether fuels produced using certain methods can be used in its equipment. These efforts contribute to the high level energy goals set forth in the Navy’s Energy Program for Security and Independence, which include sailing the “Great Green Fleet”—a carrier strike group composed of nuclear ships, hybrid electric ships running on biofuel, and aircraft flying on biofuel—by 2016, and meeting at least 50 percent of shore-based energy requirements from alternative sources by 2020, among other energy goals.
[1130] Article: “Insight: ‘Green Fleet’ Sails, Meets Stiff Headwinds in Congress.” By David Alexander. Reuters, July 2, 2012. <www.reuters.com>
The Pentagon hopes it can prove the Navy looks as impressive burning fuel squeezed from seeds, algae and chicken fat as it does using petroleum.
But the demonstration, years in the making, may be a Pyrrhic victory.
Some Republican lawmakers have seized on the fuel’s $26-a-gallon price, compared to $3.60 for conventional fuel. …
The Pentagon paid Solazyme Inc $8.5 million in 2009 for 20,055 gallons of biofuel based on algae oil, or $424 a gallon.
[1131] Report: “Direct Federal Financial Interventions and Subsidies in Energy in Fiscal Year 2010.” U.S. Energy Information Administration, July 2011. <www.eia.gov>
Page viii:
Loans and Loan Guarantees. These involve federal financial support for certain energy technologies. The U.S. Department of Energy (DOE) is authorized to provide financial support for “innovative clean energy technologies that are typically unable to obtain conventional private financing due to their ‘high technology risks.’ In addition, eligible technologies must avoid, reduce, or sequester air pollutants or anthropogenic emissions of greenhouse gases.”
Page 59:
With the exception of RUS [the U.S. Department of Agriculture’s Rural Utilities Service] and the synthetic fuel program in the 1970s, energy-related explicit loan guarantee programs are new federal interventions in energy financial markets. DOE’s initial loan guarantee program was authorized by the Energy Policy Act of 2005 (EPAct2005) and the first guarantee was issued in the fall of 2009. As of the end of calendar year 2010, the Department of Energy has actually issued over $25 billion in loan guarantees. Additionally, the staff of the office within DOE that administers the programs has grown from 0 in 2005 to roughly 85 in 2010. Thus, DOE’s loan guarantee program is growing and is becoming an important component of the Administration’s energy program.
[1132] Report: “External Debt Statistics: Guide for Compilers and Users.” International Monetary Fund, 2003. <www.imf.org>
Page 268: “Loan Guarantee A legally binding agreement under which the guarantor agrees to pay any or all of the amount due on a loan instrument in the event of nonpayment by the borrower.”
[1133] Report: “Federal Energy Subsidies: Direct and Indirect Interventions in Energy Markets.” U.S. Energy Information Administration, November 1992. <www.justfacts.com>
Page x: “The Federal Government has an extensive program of funding energy research and development activities. … To the extent that this Government-supported research can be used by the industries involved, it represents a subsidy to them as they do not have to pay the expense of developing new technologies.”
[1134] Report: “Direct Federal Financial Interventions and Subsidies in Energy in Fiscal Year 2010.” U.S. Energy Information Administration, July 2011. <www.eia.gov>
Page viii:
Research and Development (R&D). These are federal expenditures aimed at a variety of goals, such as increasing U.S. energy supplies or improving the efficiency of various energy consumption, production, transformation, and end-use technologies. R&D expenditures generally do not directly affect current energy consumption, production, and prices, but, if successful, they could affect future consumption, production, and prices.
Page 33: “The federal government’s role in financing large-scale civilian research and development (R&D) dates back to the late 1940s. … In 1975, the Energy Research and Development Administration (ERDA) was created through the consolidation of several existing R&D programs. In 1977, ERDA became a part of the United States Department of Energy.”
[1135] Calculated with data from the report: “Direct Federal Financial Interventions and Subsidies in Energy in Fiscal Year 2010.” U.S. Energy Information Administration, July 2011. <www.eia.gov>
Page xiii: “Table ES2. Quantified energy-specific subsidies and support by type, FY 2010 and FY 2007 (million 2010 dollars) … 2010 … Beneficiary … Coal … Direct Expenditures [=] 42 … Tax Expenditures [=] 561 … Research & Development [=] 663 … DOE [Department of Energy] Loan Guarantee Program [=] 0 … Federal & RUS [Department of Agriculture’s Rural Utilities Service] Electricity [=] 91 … Total [=] 1,358”
Page 34: “Table 12. Applied Federal energy R&D [research and development] expenditures by type and function, 2007 and 2010 (million 2010 dollars) … Applied R&D … Coal … FY2010 [=] 663 … Sources: Department of Energy FY 2009 Congressional Budget Request (DOE/CF-031) and Department of Energy FY 2012 Congressional Budget Request (DOE/CF-0064).”
NOTE: This report does not specify the purposes of the coal R&D subsides. These are detailed in the next two footnotes.
CALCULATION: $663 R&D / $1,358 Total = 48.8%
[1136] “Fiscal Year 2010 Annual Performance Report.” U.S. Department of Energy, April 2011. <energy.gov>
Page 17:
Achieving President Obama’s climate change goal to reduce U.S. greenhouse gas emissions to 17% below 2005 levels by 2020 and 83% by 2050 necessitates contributions from the full portfolio of available clean energy technologies. … Near-zero emissions coal plants will help allow fossil fuels to be used as abundant and low-carbon emitting energy resources in the future.
Page 18: “Budget and Performance … Base Program (funded from FY 2010 appropriations) … FY 2010 Budgetary Expenditures (million $) … Zero Emissions Coal-Based Electricity & Hydrogen Production [=] 538”
NOTES:
[1137] Report: “Fiscal Year 2010: Summary of Performance and Financial Information.” U.S. Department of Energy, November 12, 2010. <energy.gov>
Page 13:
An unprecedented $3.4 billion was provided by the Recovery Act for investment in carbon capture and storage technologies. By attracting significant private capital, DOE [Department of Energy] has been pursuing projects that will capture more than 10 million tons of carbon dioxide (CO2) annually by 2015 and help demonstrate the economic viability of carbon capture and storage by 2020. Five projects were selected to accelerate the development of advanced coal technologies with carbon capture and storage at commercial-scale.
Page 20:
To achieve the president’s stated goal of reducing the country’s greenhouse gas emissions by 83% by 2050, DOE must assist in providing the means to mitigate CO2 emissions from current coal-fueled electric power plants and industrial sources. These sources combined produce about 50% of the nation’s CO2 emissions. Given the high cost and amount of energy required to capture and geologically store CO2 with existing technology, development of advanced lowcost technology will help overcome the barriers to commercial deployment of carbon capture and sequestration in the 2020 time frame. Widespread cost-effective deployment of carbon capture and storage will occur only if the technology is commercially available at economically competitive prices and supportive national policy frameworks are in place.
[1138] Calculated with data from the report: “Direct Federal Financial Interventions and Subsidies in Energy in Fiscal Year 2010.” U.S. Energy Information Administration, July 2011. <www.eia.gov>
Page xiii: “Table ES2. Quantified energy-specific subsidies and support by type, FY 2010 and FY 2007 (million 2010 dollars) … 2010 … Beneficiary … Coal … Direct Expenditures [=] 42 … Tax Expenditures [=] 561 … Research & Development [=] 663 … DOE [Department of Energy] Loan Guarantee Program [=] 0 … Federal & RUS [Department of Agriculture’s Rural Utilities Service] Electricity [=] 91 … Total [=] 1,358”
Page 9: “Table 2. Coal-related tax expenditures (million 2010 dollars) … FY [fiscal year] 2010 … Credit for Investment in Clean Coal Facilities [=] 240 … Amortization of Pollution Control Equipment [=] 100 … Total Coal and Refined Coal Tax Expenditures [=] 561”
CALCULATION: (240 + 100) / 561 = 61%
Page 10:
Credit for Investment in Clean Coal Facilities. This credit has an estimated value of $31 million in FY 2007 and $240 million in FY 2010. Section 1307 of the EPAct 2005 [Energy Policy Act of 2005] provided for a 20-percent credit to coal gasification projects using integrated gasification combined-cycle (IGCC) technology and a 15-percent credit to other advanced coal technologies. It allocated $800 million tax credits towards electricity-related IGCC projects and $500 million towards other advanced coal technologies. An additional $350 million was applied to coal gasification technologies for industrial use. Eligible plants are expected to achieve a 90-percent reduction in SO2 and a 90-percent reduction in mercury. The Energy Improvement and Extension Act of 2008 authorized an additional $1.5 billion in tax credits for clean coal, $1.5 billion for advanced coal-based generation technologies that sequester at least 65 percent of CO2, and $250 million for projects that sequester 75 percent of CO2. Section 112 of the Energy Improvement and Extension Act included an income tax credit for coal gasification investments. In July 2010, the U.S. government awarded a $417-million investment tax credit to builders of the 602-megawatt Taylorville “clean coal” power plant with carbon capture and storage in south central Illinois. The Taylorville plant is designed to capture at least 65 percent of its CO2 emissions. Construction of the Taylorville plant has encountered delays as the Illinois state senate has yet to approve construction. …
Amortization of Pollution Control Equipment. This provision was added by EPAct2005, under Section 1309. In general, a taxpayer may elect to recover the cost of any certified pollution control facility over a period of 60 months. A certified pollution control facility is defined as a new, identifiable treatment facility which (1) is used in connection with a plant in operation before January 1, 1976, to abate or control water or atmospheric pollution or contamination. A certified air pollution control facility (but not a water pollution control facility) used in connection with an electric generation plant which is primarily coal fired is eligible for 84-month amortization if the associated plant or other property was not in operation prior to January 1, 1976. The 60-month amortization period remains in effect for any certified air pollution control facility used in connection with an electric generation plant which is primarily coal fired and which was in operation prior to January 1, 1976. The JCT [Joint Committee on Taxation] estimated the value of this expenditure to be $31 million for FY 2007 and $100 million for FY 2010.
CALCULATION: $561 tax expenditures / $1,358 Total = 41.3%
[1139] Report: “Renewable Energy: Federal Agencies Implement Hundreds of Initiatives.” U.S. Government Accountability Office, February 2012. <www.gao.gov>
Page 1: “We defined renewable energy as energy derived from any of the following sources: bioenergy, such as liquid biofuel and solid biomass fuel; geothermal; hydropower; solar; wind; ocean energy, including wave, tidal, current, and ocean thermal energy; and waste conversion, including anaerobic digestion, landfill gas, and municipal solid waste.”
Page 12: “Governmentwide, we identified 679 renewable energy-related initiatives for fiscal year 2010 at the 23 agencies we examined and their 130 subagencies.”
Page 16: “Figure 2 shows the number of initiatives that support each energy source, which sums to more than 679—the number of initiatives in the inventory—because about half of the initiatives supported multiple energy sources.”
Page 3:
The federal government is also the single largest user of energy in the United States, and a number of recent federal laws and executive orders have established requirements and direction for federal agencies to (1) reduce energy consumption and greenhouse gas emissions and increase renewable energy use at their facilities, and (2) to reduce petroleum consumption and increase the use of alternative fuels in their vehicle fleets.
We found that agencies’ initiatives provided support to a range of recipients in both the public (governmental) and private (generally nongovernmental) sectors; however, the majority of them supported private sector recipients. Specifically, almost 90 percent of the initiatives we identified supported private sector recipients either exclusively or along with public sector recipients. Figure 3 shows the percentage of initiatives that supported private or public sector recipients, or both.
Page 39:
At the outset of our work, we determined that it would not be feasible to examine every federal department, agency, or other entity to collect data on renewable energy efforts because many agencies indicated that data on such efforts were not tracked in a centralized, comprehensive, or consistent manner.1 Therefore, we began by focusing on the 24 agencies subject to the Chief Financial Officers Act of 1990 (CFO Act), as these agencies were collectively responsible for 98 percent of federal outlays in fiscal year 2009.2
[1140] Report: “Direct Federal Financial Interventions and Subsidies in Energy in Fiscal Year 2010.” U.S. Energy Information Administration, July 2011. <www.eia.gov>
“Table ES2. Quantified energy-specific subsidies and support by type, FY 2010 and FY 2007 (million 2010 dollars) … 2010 … Beneficiary … Renewable[s] … Total [=] 14,674”
[1141] Report: “Annual Energy Outlook 2013 with Projections to 2040.” U.S. Energy Information Administration, April 2013. <www.osti.gov>
Page 13: “Currently, 30 states and the District of Columbia have an enforceable renewable portfolio standard (RPS) or similar law (Table 3). Under such standards, each state determines its own levels of renewable generation, eligible technologies (44), and noncompliance penalties. … In 2025 the [RPS] targets account for about 10 percent of U.S. electricity sales.”
Page 14: “Table 3. Renewable portfolio standards in the 30 states and District of Columbia with current mandates”
Page 75: “Regional growth in non-hydroelectric renewable electricity generation is based largely on three factors: availability of renewable energy resources, cost competitiveness with fossil fuel technologies, and the existence of state RPS programs that require the use of renewable generation.”
[1142] Webpage: “State Renewable Portfolio Standards and Goals.” National Conference of State Legislatures, August 13, 2021. <www.ncsl.org>
Iowa was the first state to establish an RPS [renewable portfolio standard] since then, more than half of states have established renewable energy targets. Thirty states, Washington, D.C., and two territories have active renewable or clean energy requirements, while an additional three states and one territory have set voluntary renewable energy goals. RPS legislation has seen two opposing trends in recent years. On one hand, many states with RPS targets are expanding or renewing those goals. Since 2018, 15 states, two territories, and Washington, D.C., have passed legislation to increase or expand their renewable or clean energy targets. On the other hand, seven states and one territory have allowed their RPS targets to expire; an additional four states have RPS targets that expire in 2021. …
State renewable portfolio standard policies vary widely on several elements including RPS targets, the entities they include, the resources eligible to meet requirements and cost caps. In many states, standards are measured by the percentage of retail electric sales. Iowa and Texas, however, require specific amounts of renewable energy capacity rather than percentages and Kansas requires a percentage of peak demand.
Eligible resources under an RPS vary state-by-state but often include wind, solar, biomass, geothermal and some hydroelectric facilities—depending on the size and vintage. States determine eligible resources based on their existing energy generation mix and the potential for renewable energy development in their states.
[1143] Report: “Direct Federal Financial Interventions and Subsidies in Energy in Fiscal Year 2010.” U.S. Energy Information Administration, July 2011. <www.eia.gov>
Page xiii: “Table ES2. Quantified energy-specific subsidies and support by type, FY 2010 and FY 2007 (million 2010 dollars) … 2010 … Beneficiary … Solar … Direct Expenditures [=] 496 … Tax Expenditures [=] 120 … Research & Development [=] 348 … DOE [Department of Energy] Loan Guarantee Program [=] 173 … Total [=] 1,134”
[1144] Report: “Challenges of Electric Power Industry Restructuring for Fuel Suppliers.” U.S. Energy Information Administration, September 1998. <www.eia.gov>
Pages 67–68:
The oil embargo of 1973 was a catalyst for the proposal and adoption of the National Energy Act of 1978, a compendium of statutes aimed at restructuring the U.S. energy sector. …
The most significant statute in the National Energy Act for the development of commercial markets for renewable energy was passed into law as the Public Utility Regulatory Policies Act of 1978 (PURPA). Among other things, PURPA encouraged the development of “nonutility” cogeneration and small-scale renewable-fueled electric power plants designated as “qualifying facilities.”160 Under PURPA, utilities were required to purchase electricity from certain qualifying facilities at the utilities’ avoided costs, that is, the cost to the utility if it had generated or otherwise purchased the power. Some avoided cost purchase contracts, particularly in California, were very favorable to renewable technologies.
160 Essentially, PURPA defines two groups of “qualifying facilities”: (1) “small power producers” with 160 rated capacity less than 80 megawatts that obtain at least 75 percent of input energy from renewable sources and (2) renewable-based cogenerators. Utilities may not own more than 50 percent of a qualifying facility.
Page 75:
[N]et metering is an arrangement that permits users generating power to sell any electricity in excess of requirements back to the grid to offset consumption.170 How excess energy (if any) from facilities under net metering is treated, and what rates are paid, are what differentiate State net metering policies. Some State initiatives require the utility to pay retail rates instead of avoided cost rates for the excess energy. States may apply certain capacity restrictions and, in some cases, fuel restrictions on facilities that qualify for net metering.
Most net metering programs are available to customer-owned small generating facilities only, and some programs further restrict the eligibility to renewable energy technologies. Net metering can increase the economic value of small renewable energy technologies for customers by allowing them to use the grid to bank their energy, producing electricity at one time and consuming it at another. This form of energy exchange is especially useful for such renewable energy technologies as wind turbines and photovoltaics, which transmit electricity to the grid intermittently (when the wind is blowing or the sun is shining) and, at other times, are consumers of electricity from the grid.
170 Net metering, in effect, measures the difference between the total generation of a facility and the electricity consumed by the facility with a single meter that can read electricity flows in and out of a facility. Hence, the meter will record the net energy received by the facility or, if the facility generated more than it consumed, the energy delivered to the grid.
[1145] Article: “Solar Power Adds to Nonusers’ Costs.” By Christopher Martin and Mark Chediak. San Francisco Chronicle, December 17, 2012. <www.sfgate.com>
Power companies in the state, the nation’s biggest for solar power, are required to buy electricity from home solar generators at the same price they resell it to other customers, meaning utilities earn nothing to cover their fixed costs. …
“You get into a situation where you have a transmission and distribution system with nobody paying for it,” said Akbar Jazayeri, vice president of regulatory operations at Edison, a unit of Edison International and California’s second-largest electric utility. …
Pacific Gas & Electric, the state’s biggest utility, will pass on about $700 million in annual costs to people without solar systems when the state hits the cap, according to Denny Boyles, a spokesman.
[1146] Report: “Net Metering Bill Impacts and Distributed Energy Subsidies.” Navigant Consulting, December 11, 2012. <www.aps.com>
Page 4:
Arizona net metering rules were implemented in May 2009.4 Net metering is available to customers that generate electricity on-site using solar, wind, hydroelectric, geothermal, biomass, biogas, combined heat and power (CHP), or fuel cell technologies.5 Customers that participate in net metering receive bill credits in each billing period for PV [photovoltaic] generated electricity that exceeds the amount they consume during the billing period. Any bill credits that exceed a customer’s consumption in that billing period are either netted against future consumption within that same month or “banked” at the end of the month and used to offset charges in future months for actual customer consumption of APS [Arizona Public Service]-provided electricity.
Page 5:
Customers participating in net metering that generate more electricity than they consume in a given billing period are in effect treated as if they had sold that excess generation back to the grid at the prices they would have paid for that electricity under their respective retail rates. At the end of each year, any remaining excess generation is sold back to the grid at ($/kWh) prices equal to the most recent ACC [Arizona Corporation Commission]-approved purchase rates.11
11 For example, customers would be paid $0.033 to $0.035/kWh (the non-firm power purchase price reported in Table 12, page 38) for any banked excess generation remaining at the end of the calendar year, instead of the full retail rate (approximately $0.156/kWh, on average).
Page 6:
In particular, APS must maintain enough back-up (i.e., standby) generating capacity to provide the electricity that those customers consume when their systems are not producing electricity (e.g., when clouds obscure the sun, at night or when systems are down). The fact that these customers are producing energy at one point in time, and then using bill credits to offset the kWh for which they would have otherwise been charged later on, is often described as allowing those customers to use APS’s grid as a virtual battery. APS also still needs a transmission and distribution (T&D) infrastructure to provide back-up generation to DE [distributed energy] customers. Self-generation by DE customers also does not enable APS to avoid the cost of providing ancillary services needed to maintain the stability of the grid.
Page 14:
Net metered customers that consume and/or in effect “sell” PV [photovoltaic] generation back to the grid, avoid paying not only the variable costs APS would have incurred if it had supplied those kWh, but also the APS fixed costs whose recovery accounts for the bulk of a typical customer’s bill. Most of those unrecovered fixed costs consist of generation capacity costs, T&D wires costs, and the system benefits charge, in addition to other costs. The only base bill component these customers would not avoid paying is the daily basic service charge for metering and billing.
Page 17:
As indicated in Table 3 and Figure 11, a PV system would have reduced the annual electricity bill of the hypothetical residential customer on APS’ ET-2 rate from $1,833 to $573. That $1,260 bill reduction17 is 207.3% higher than the $410 in costs APS avoided due to that customer’s PV system.
If that bill reduction was instead equal to the costs APS avoided due to that system, that customer’s bill would be $1,424.18
Because that customer’s bill would actually have been $573, however, APS would have had to charge other customers $851 more than it would have charged them if the reduction in that customer’s bill equaled the cost APS avoided.19
17 $1,260 = $1,833 – $573.
18 $1,423 = $1,833 – $410, after rounding. The actual difference is $1,424.
19 $851 = $1,424 – $573, after rounding.
Page 22:
As Table 5 and Figure 15 indicate, a PV system would have reduced the annual electricity bill of that hypothetical [medium-sized] commercial customer [on an E-32M rate] from $71,222 to $51,049. That $20,173 bill reduction24 is 74.8% higher than the $11,539 in costs APS would have avoided because of that PV system.
If the reduction in that customer’s bill was instead equal to the costs APS would have avoided, that customer’s bill would have been $59,683.25
Because that customer’s actual bill would have been only $51,049, however, APS would have had to charge other customers $8,634 more than it would have charged them if the reduction in that customer’s bill equaled the cost APS avoided.26
24 $20,173 = $71,222 – $51,049.
25 $59,683 = $71,222 – $11,539.
26 $8,634 = $59,683 – $51,049, after rounding.
[1147] Booklet: “Energy, Powering Your World.” By M.T. Westra and S. Kuyvenhoven. Foundation for Fundamental Research on Matter, Institute for Plasma Physics, Rijnhuizen (the Netherlands), 2002. <fire.pppl.gov>
Page 13: “The central generation of electricity means it has to be distributed over the country in order to bring it to your house. This causes an average loss of energy of 10%, and needs a large and expensive distribution system.”
[1148] Article: “Electric Rates Not Falling Along with Fuel Costs.” By Jonathan Fahey. Associated Press, July 11, 2012. <news.yahoo.com>
“The cost of actually delivering electricity, which accounts for 40 percent of a customer’s bill on average, has been rising fast.”
[1149] Calculated with data from the report: “Direct Federal Financial Interventions and Subsidies in Energy in Fiscal Year 2010.” U.S. Energy Information Administration, July 2011. <www.eia.gov>
Page xiii: “Table ES2. Quantified energy-specific subsidies and support by type, FY 2010 and FY 2007 (million 2010 dollars) … 2010 … Beneficiary … Wind … Total [=] 4,986 ARRA [American Recovery and Reinvestment Act of 2009] Related [=] 4,852”
CALCULATION: $4,852 / $4,986 = 97.3%
[1150] Report: “Renewable Energy: Federal Agencies Implement Hundreds of Initiatives.” U.S. Government Accountability Office, February 2012. <www.gao.gov>
Page 32:
IRS [Internal Revenue Service] also supports the development of renewable energy for electricity through the Energy Production Tax credit, which, in calendar year 2010, was largely used to develop wind energy, according to information provided by IRS. The amount of the credit varies depending upon the source: in calendar year 2010, the credit amount for wind, geothermal, and certain biomass electricity production was 2.2 cents per kilowatt hour, and 1.1 cents per kilowatt hour for electricity produced from other renewable energy sources. Table 7 shows the 21 renewable energy-related tax expenditures administered by IRS.
Page 34:
In addition to tax expenditures, under Section 1603 of the Recovery Act [American Recovery and Reinvestment Act of 2009], Treasury offers payments for specific energy property in lieu of the Energy Production and Energy Investment tax credits. These payments provide an incentive for investment in property for electricity and heat production, particularly those applicants without sufficient tax liability to utilize a tax credit.
[1151] Report: “Direct Federal Financial Interventions and Subsidies in Energy in Fiscal Year 2010.” U.S. Energy Information Administration, July 2011. <www.eia.gov>
Page xii:
The growth in subsidies for renewable fuels is primarily driven by the $4.2 billion in expenditures for grants under Section 1603 of ARRA [American Recovery and Reinvestment Act of 2009], which went mainly to wind facilities, and by growth in federal support for biofuels. The ARRA grant program allowed investors in new qualifying facilities to choose an upfront grant in lieu of the longstanding 10-year production tax credit that was also available, but which became less attractive to developers as the market for financial instruments based on tax credit streams withered following the financial crisis. Though the two options have roughly similar value to investors and cost to the government over the life of the projects, the grant program front loads the government’s support for covered projects in the year that the grant is awarded.
[1152] Report: “Annual Energy Outlook 2013 with Projections to 2040.” U.S. Energy Information Administration, April 2013. <www.osti.gov>
Page 212: “As part of ARRA2009 [American Recovery and Reinvestment Act of 2009], plants eligible for the PTC [production tax credit] may instead elect to receive a 30-percent ITC [investment tax credit] or an equivalent direct grant.”
Page 28:
On January 1, 2013, Congress passed the American Taxpayer Relief Act of 2012 (ATRA). The law, among other things, extended several provisions for tax credits to the energy sector. Although the law was passed too late to be incorporated in the Annual Energy Outlook 2013 (AEO2013) Reference case, a special case was prepared to analyze some of its key provisions, including the extension of tax credits for utility-scale renewables, residential energy efficiency improvements, and biofuels69. The analysis found that the most significant impact on energy markets came from extending the production tax credits (PTCs) for utility-scale wind, and from changing the PTC qualification criteria from being in service on December 31, 2013, to being under construction by December 31, 2013, for all eligible utility-scale technologies. Although there is some uncertainty about what criteria will be used to define “under construction,” this analysis assumes that the effective length of the extension is equal to the typical project development time for a qualifying project. For wind, the effective extension is 3 years.
[1153] Report: “Renewable Energy: Federal Agencies Implement Hundreds of Initiatives.” U.S. Government Accountability Office, February 2012. <www.gao.gov>
Page 16:
In addition, EPA’s [U.S. Environmental Protection Agency] Renewable Fuel Standard program, mandated by the Clean Air Act, as amended, generally requires the volume of biofuels used in the transportation sector in the 48 contiguous states to increase through 2022 to an annual total of 36 billion gallons.26
26 Under the act, the Renewable Fuel Standard applies to transportation fuel sold or introduced into commerce in the 48 contiguous states. However, the Administrator of the EPA is authorized, upon a petition from Alaska or Hawaii, to allow the Renewable Fuel Standard to apply in that state.
[1154] Webpage: “Overview for Renewable Fuel Standard.” U.S. Environmental Protection Agency. Last updated February 22, 2022. <www.epa.gov>
“The Renewable Fuel Standard (RFS) program was created under the Energy Policy Act of 2005 (EPAct), which amended the Clean Air Act (CAA). The Energy Independence and Security Act of 2007 (EISA) further amended the CAA by expanding the RFS program. EPA implements the program in consultation with U.S. Department of Agriculture and the Department of Energy.”
[1155] Calculated with data from the report: “July 2022 Monthly Energy Review.” U.S. Energy Information Administration, Office of Energy Statistics, July 26, 2022. <www.eia.gov>
Page 56:
1993–2008: The transportation sector share of motor gasoline consumption is equal to transportation sector motor gasoline consumption from Table 3.7c divided by motor gasoline product supplied from Table 3.5. Transportation sector fuel ethanol (including denaturant) consumption is equal to total fuel ethanol (including denaturant) consumption from Table 10.3 multiplied by the transportation sector share of motor gasoline consumption.
Page 75: “Table 3.5 Petroleum Products Supplied by Type (Thousand Barrels per Day) … Motor Gasoline … 2004 Average [=] 9,105” <www.eia.gov>
Page 81: “Table 3.7c Petroleum Consumption: Transportation and Electric Power Sectors (Thousand Barrels per Day) … Transportation Sector … Motor Gasoline … 2004 Average [=] 8,887” <www.eia.gov>
Page 183: “Table 10.3 Fuel Ethanol Overview … Consumption … MMgal [million U.S. gallons] … 2004 Total [=] 3,552” <www.eia.gov>
CALCULATIONS:
[1156] Report: “The Impact of Ethanol Use on Food Prices and Greenhouse-Gas Emissions.” Congressional Budget Office, April 2009. <www.cbo.gov>
Page VIII:
In the future, the use of cellulosic ethanol, which is made from wood, grasses, and agricultural plant wastes rather than corn, might reduce greenhouse-gas emissions more substantially, but current technologies for producing cellulosic ethanol are not commercially viable. Research by ANL [Argonne National Laboratory] suggests that increased use of cellulosic ethanol in the amounts specified in the Energy Independence and Security Act of 2007 could reduce greenhouse-gas emissions from the nation’s transportation sector by as much as 130 million metric tons of CO2e by 2022—which would equal about 6 percent of emissions from that sector or slightly more than 2 percent of total projected U.S. emissions from all sources in that year. However, that potential would be realized only if cellulosic ethanol could be produced on a large scale and if the effects of changes in land use did not offset the reduction that producing, distributing, and consuming ethanol could make in greenhouse-gas emissions.
Page 3:
The Energy Policy Act of 2005 laid out a schedule of mandates through 2012 for increasing the amount of biofuels used in the United States.11 The Energy Independence and Security Act of 2007 expanded the mandates and extended them through 2022 (see Figure 1). Under those laws, federal mandates requiring the use of biofuels are intended to encourage the domestic production of ethanol and other biofuels; the mandates also seek to generate increasingly large reductions in greenhouse-gas emissions from the transportation sector.12
Specifically, those mandates require usage of biofuels in the United States to be at least 20.5 billion gallons annually by 2015, or more than double the country’s usage in 2008. Of that total, not more than 15 billion gallons may be refined from cornstarch. By 2022, the total amount of biofuels used (including conventional and cellulosic ethanol as well as biodiesel and other advanced biofuels) must be at least 36 billion gallons. By contrast, the United States’ current capacity for producing biofuels stands at 15 billion gallons, 12.4 billion gallons of which represents capacity for producing corn ethanol.
11 A biofuel, such as ethanol or biodiesel (diesel fuel made from plants), is composed of or produced from biological raw materials. In contrast, a fossil fuel, such as oil or coal, is formed in the earth from plant or animal remains.
12 EISA [Energy Independence and Security Act of 2007] directed the Environmental Protection Agency to issue rules that ensured that biofuels would be sold or introduced into commerce in the United States, but it also gave the agency discretion to relax the standards if they were shown to result in severe economic or environmental harm to any state or region.
[1157] Calculated with data from the report: “Direct Federal Financial Interventions and Subsidies in Energy in Fiscal Year 2010.” U.S. Energy Information Administration, July 2011. <www.eia.gov>
Page xiii: “Table ES2. Quantified energy-specific subsidies and support by type, FY 2010 and FY 2007 (million 2010 dollars) … 2010 … Beneficiary … Natural Gas and Petroleum Liquids … Tax Expenditures [=] Total [=] 2,690”
CALCULATION: $2,690 / $2,820 = 95.4%
[1158] Calculated with data from the report: “Direct Federal Financial Interventions and Subsidies in Energy in Fiscal Year 2010.” U.S. Energy Information Administration, July 2011. <www.eia.gov>
Page 18: “Table 6. Natural gas and petroleum related tax expenditures (million 2010 dollars) … FY 2010 … Excess of Percentage over Cost Depletion [=] 980 … Total [=] 2,690 … A portion of the tax expenditures, but indeterminate amount, of the Excess of Percentage over Cost Depletion and the Expensing of Exploration and Development Costs goes to coal.”
CALCULATION: $980 / $2,690 = 36.4%
[1159] Report: “Federal Energy Subsidies: Direct and Indirect Interventions in Energy Markets.” U.S. Energy Information Administration, November 1992. <www.justfacts.com>
Page 116: “Percentage depletion had the effect of substantially increasing the development of existing property since the total depletion claimed could exceed the original investment. The increase in output benefitted producers (operators and royalty holders) through increased royalties and higher after-tax profits. Consumers also benefitted, a result of lower prices.”
[1160] Report: “Business Expenses.” Internal Revenue Service, February 17, 2022. <www.irs.gov>
Pages 36–37:
Depletion is the using up of natural resources extracted from a mineral property by mining, drilling, quarrying stone, or cutting timber. The depletion deduction allows an owner or operator to account for the reduction of the mineral property’s value or basis as a result of the extraction of the natural resource.
There are two ways of figuring depletion: cost depletion and percentage depletion. For oil and gas wells, mines, other natural deposits (including geothermal deposits), and mineral property, you must generally use the method that gives you the larger deduction. For standing timber, you must use cost depletion. …
Mineral property includes oil and gas wells, mines, and other natural deposits (including geothermal deposits). For this purpose, the term “property” means each separate interest you own in each mineral deposit in each separate tract or parcel of land. You can treat two or more separate interests as one property or as separate properties. …
Generally, you must use the method that gives you the larger deduction. However, unless you are an independent producer or royalty owner, you generally cannot use percentage depletion for oil and gas wells.
[1161] Report: “Energy Tax Policy: Historical Perspectives on and Current Status of Energy Tax Expenditures.” By Molly F. Sherlock. Congressional Research Service, May 2, 2011. <www.leahy.senate.gov>
Page 3:
The percentage depletion provision allows a deduction of a fixed percentage of gross receipts rather than a deduction based on the actual value of the resources extracted.9 Through the mid-1980s, these tax preferences given to oil and gas remained the largest energy tax provisions in terms of estimated revenue loss. Both of these provisions remain in the tax code in limited form today. …
9 If oil and gas producers were subject to normal income tax treatment, expenses associated with developing energy and mineral properties would be capitalized into the basis of the property and recovered over time as output is produced. Under percentage depletion, producers can recover investment costs (other than IDCs [intangible drilling costs] that were already expensed) by claiming a depletion allowance that is a fixed percentage of gross receipts as opposed to a deduction for the actual value of the resource extracted. When first introduced, the percentage depletion rate was 27.5% for oil and gas. Currently, percentage depletion is allowed for independent producers at a rate of 15% for oil and gas and 10% for coal. Percentage depletion is allowed on production up to 1,000 barrels of average daily production of oil (or its equivalent for natural gas). The depletion allowance cannot exceed 100% of taxable income from the property (50% for coal) or 65% of the producers taxable income from all sources.
[1162] Report: “Federal Financial Interventions and Subsidies in Energy Markets 1999: Primary Energy.” U.S. Energy Information Administration, September 1999. <www.justfacts.com>
Pages 22–23: “[T]he many constraints imposed on the use of percentage depletion for oil and gas since 1975, including the use of percentage depletion by only independent producers and royalty owners and then only up to 1,000 barrels per day, have and will continue to limit that tax expenditure provision to small-scale oil and gas operations.”
[1163] Calculated with data from the report: “Direct Federal Financial Interventions and Subsidies in Energy in Fiscal Year 2010.” U.S. Energy Information Administration, July 2011. <www.eia.gov>
Page xiii: “Table ES2. Quantified energy-specific subsidies and support by type, FY 2010 and FY 2007 (million 2010 dollars) … 2010 … Beneficiary … Conservation … Direct Expenditures [=] 3,387 … Tax Expenditures [=] 3,206 … Total [=] 6,597”
Page 21: “The credit for energy efficiency improvements of existing homes is the most prominent conservation tax provision, having grown from $395 million in 2007 to $3.2 billion in 2010.”
Page 22:
Table 8. Conservation, efficiency, and end-use tax expenditures (million 2010 dollars) … FY 2010 … Credit for Energy Efficiency Improvements of Existing Homes [=] 3,190. …
The Credit for Energy-Efficiency Improvements of Existing Homes Established in EPAct2005 [Energy Policy Act of 2005], Section 1333, this credit had an estimated value of $3.2 billion in FY 2010 up sharply from an estimated $395 million in FY 2007, with most of this growth traceable to the higher credit amounts made available due to ARRA [American Recovery and Reinvestment Act of 2009]. This credit applies to windows, furnaces, boilers, furnace fans, and building envelope components, such as exterior doors and any metal roof that has appropriated pigmented coatings. Initially, the credit was available to houses constructed before December 31, 2007 (the credit expires on December 31, 2011).
CALCULATIONS:
[1164] Calculated with data from the report: “Direct Federal Financial Interventions and Subsidies in Energy in Fiscal Year 2010.” U.S. Energy Information Administration, July 2011. <www.eia.gov>
Page xiii: “Table ES2. Quantified energy-specific subsidies and support by type, FY 2010 and FY 2007 (million 2010 dollars) … 2010 … Beneficiary … Nuclear … Direct Expenditures [=] 0 … Tax Expenditures [=] 908 … Research & Development [=] 1,169 … DOE [Department of Energy] Loan Guarantee Program [=] 265 … Federal & RUS [Rural Utilities Service] Electricity [=] 157 … Total [=] 2,499”
Page 36: “Table 14. Nuclear R&D [research and development] expenditures, 2007 and 2010 (million 2010 dollars) … FY2010 … Non-defense environmental cleanup [=] 393 … Total [=] 1,169”
CALCULATIONS:
[1165] Report: “The Office of Environmental Management Non-Defense Environmental Cleanup.” U.S. Department of Energy, June 18, 2009. <www.energy.gov>
Page 1: “The Department of Energy (DOE) Office of Environmental Management (EM) program nondefense funding is used for the environmental cleanup of multiple sites across the country that comprise the former nuclear weapons development and government-sponsored nuclear energy research complex.”
[1166] Report: “Federal Financial Interventions and Subsidies in Energy Markets 2007.” U.S. Energy Information Administration, April 2008. <www.eia.gov>
Page 42: “Finally, much of what is defined as energy R&D [research and development] in the Federal government’s budget accounts is not directly expended on energy research or development. Rather, a portion of the funds are expended on environmental restoration and waste management associated with the byproducts of energy-related research facilities, e.g., nuclear waste disposal.”
Page 47: “DOE [Department of Energy] received an appropriation of $922 million for civilian nuclear R&D in FY [fiscal year] 2007 (Table 15). Nearly 40 percent of the appropriation ($350 million) is allocated to the cleanup of contaminated nuclear energy and research sites.”
Page 48:
A substantial portion of Federally-funded nuclear R&D is used for managing and addressing the environmental legacy resulting from past nuclear energy and research activities. Thousands of contaminated areas and buildings exist throughout the United States. The goal of the program is to decommission. Upon completing the clean up of these facilities, DOE’s presence and associated costs will be limited to long-term surveillance and maintenance.
[1167] Report: “Federal Financial Interventions and Subsidies in Energy Markets 1999: Primary Energy.” U.S. Energy Information Administration, September 1999. <www.justfacts.com>
Page 27: “Applied R&D [research and development] is aimed primarily at improving existing technology. Appropriations for applied energy R&D were about $1.5 billion in fiscal year 1999. Of that amount, more than half is allocated to nuclear activities. Within the range of nuclear projects, most of the money is spent on environmental management rather than R&D per se.”
[1168] Email from Just Facts to the U.S. Energy Information Administration on July 30, 2013:
Has EIA published historical data providing a comprehensive measure of direct federal subsidies? I’m very familiar with the 2011, 2008, 1999, and 1992 EIA reports on subsidies, but none of these reports provide comprehensive, consistent annual historical data on the overall level of subsidies for the major energy sources. I was wondering if EIA (or another creditable source) has published such data or has plans to publish it in the future.
Email from the U.S. Energy Information Administration to Just Facts on July 30, 2013:
We regret that the information you want is not available from the U.S. Energy Information Administration (EIA). EIA is an independent, policy-neutral, statistical agency at the U.S. Department of Energy. Unfortunately, the federal energy subsidies reports have been sporadic and EIA has not done anything more recent or comprehensive to provide comprehensive, consistent annual historical data on the overall level of subsidies for the major energy sources. I don’t know of any other source to provide this information.
[1169] Email from Just Facts to the U.S. Energy Information Administration on May 25, 2018:
I am trying to find comprehensive, consistent annual historical data on the overall level of subsidies for the major energy sources. In 2016, we contacted you at this email address to see if such data were available and received the following reply:
“Unfortunately, the federal energy subsidies reports have been sporadic and EIA [U.S. Energy Information Administration] has not done anything more recent or comprehensive to provide comprehensive, consistent annual historical data on the overall level of subsidies for the major energy sources.”
I was wondering if EIA (or another creditable source) has now published such data or has plans to publish it in the future.
Email from the U.S. Energy Information Administration to Just Facts on May 29, 2018:
“Thank you for your inquiry to the U.S. Energy Information Administration (EIA). We appreciate your interest in the data and reports that we publish. EIA does not do that type of analysis every year.”
[1170] In September 2022, Just Facts conducted a thorough search of the U.S. Energy Information Administration’s website for comprehensive, consistent annual historical data on the overall level of subsidies for the major energy sources. None was available.
[1171] Email from Just Facts to the Congressional Budget Office on July 26, 2013:
Has CBO [Congressional Budget Office] published historical data providing a comprehensive measure of direct federal energy subsidies? I’ve examined the 2013 and 2012 CBO reports on energy subsidies and the 2011, 2008, 1999 and 1992 EIA [U.S. Energy Information Administration] reports on subsidies, but none of these reports provide comprehensive annual historical data on the overall level of subsidies for the major energy sources. I was wondering if CBO (or another creditable source) has published such data or has plans to publish it in the future.
Email from the Congressional Budget Office to Just Facts to on July 26, 2013:
The Kennedy School has a big energy project. … It isn’t comprehensive in the sense that it only includes technology development and it includes only DOE [U.S. Department of Energy]. …
Beyond that I really know of no one who is tracking the entire relationship over history. I think you put your finger on the problem. I think highly of those EIA reports, but going back is virtually impossible.
[1172] Email from Just Facts to the Congressional Budget Office on May 25, 2018:
“I am looking for historical data that provide a comprehensive measure of direct federal energy subsidies. … I was wondering if CBO [Congressional Budget Office] (or another creditable source) has now published such data or has plans to publish it in the future.”
Email from CBO to Just Facts on June 5, 2018:
For your question about data that provides a comprehensive measure of direct federal energy subsidies for each major energy source, the 2017 testimony and report [Testimony on , Producing, and Using Fuels and Energy Technologies: <www.cbo.gov>] is the most recent publication and we wouldn’t have any more data to provide beyond those figures.
NOTE: This report does not provide comprehensive annual historical data on the overall level of subsidies for the major energy sources. For instance, they do not detail:
[1173] In September 2022, Just Facts conducted a thorough search of the Congressional Budget Office’s website for comprehensive, consistent annual historical data on the overall level of subsidies for the major energy sources. None was available.
[1174] For example, as shown by the next two references, EIA [U.S. Energy Information Administration] previously classified loan guarantees and government R&D [research and development] as indirect subsidies. These are now considered to be direct subsidies under the current definition of the terms.
a) Report: “Federal Energy Subsidies: Direct and Indirect Interventions in Energy Markets.” U.S. Energy Information Administration, November 1992. <www.justfacts.com>
Page 2: “Subsidies in the form of direct payments to producers or consumers are termed direct subsidies. Direct subsidies also include tax expenditures. … There are also many indirect subsidies. … Indirect subsidies include provision of energy or energy services at below-market prices; loans or loan guarantees; insurance services; research and development; and the unreimbursed provision by the Government of environmental, safety, or regulatory services.”
b) Report: “Direct Federal Financial Interventions and Subsidies in Energy in Fiscal Year 2010.” U.S. Energy Information Administration, July 2011. <www.eia.gov>
Page viii: “Energy subsidies and interventions discussed in this report are divided into five separate program categories: Direct Expenditures to Producers or Consumers … Tax Expenditures … Research and Development (R&D) … Loans and Loan Guarantees … Electricity programs serving targeted categories of electricity consumers in several geographic regions of the country.”
[1175] Report: “Renewable Energy: Federal Agencies Implement Hundreds of Initiatives.” U.S. Government Accountability Office, February 2012. <www.gao.gov>
Page 3:
The federal government is also the single largest user of energy in the United States, and a number of recent federal laws and executive orders have established requirements and direction for federal agencies to (1) reduce energy consumption and greenhouse gas emissions and increase renewable energy use at their facilities, and (2) to reduce petroleum consumption and increase the use of alternative fuels in their vehicle fleets.
Pages 9–11:
There have been several recent estimates of the level of federal financial support for renewable energy:
• the Energy Information Administration estimated total federal subsidies for renewable sources in fiscal year 2010 to be approximately $14.7 billion, including $8.2 billion in tax expenditures. This amount represented a substantial increase from its estimate for fiscal year 2007 of $5.1 billion going to renewable sources. Much of this increase was due to the Recovery Act, which provided an estimated $6.2 billion of the $14.7 billion in fiscal year 2010 subsidies.17 [NOTE: This is one of the two primary sources that Just Facts used to quantify the federal subsidies shown in the graphs below.]
• the Congressional Research Service estimated fiscal year 2010 federal revenue losses and outlays associated with renewable energy-related tax provisions to be approximately $13 billion, including Recovery Act funding of approximately $4.2 billion for Treasury payments for energy projects, primarily renewable energy projects.18 [NOTE: This is the other primary source that Just Facts used to quantify the federal subsidies shown in the graphs below.]
• the Environmental Law Institute estimated total federal subsidies for renewable sources over the 7-year period from fiscal years 2002 through 2008 to be approximately $29 billion.19
Several factors limit these estimates of federal financial support for renewable energy. For instance, many federal programs or tax expenditures support a wide range of renewable and conventional energy sources, as well as businesses or activities outside of the energy sector. These estimates use varying criteria to determine which programs or tax expenditures to include, and for those they do include, the analyses often do not isolate the financial support for renewable energy provided by programs or tax expenditures that may support a broader range of activities or energy sources. In addition, none of these estimates include the level of financial support provided to the renewable energy industry through federal efforts to incorporate renewable energy in agency vehicle fleets and facilities. These estimates also do not account for the costs to the federal government of implementing regulatory efforts related to renewable energy. Furthermore, these estimates do not include all federal agencies with programs that support renewable energy, and for those they do include, they do not always provide a full list of which programs are included.
Federal and state agencies, as well as public and private utilities, implement initiatives beyond those included in our review. First, at the federal level, agencies outside the scope of our review—agencies not subject to the CFO Act [Chief Financial Officers Act of 1990]—implement renewable energy-related initiatives. For example, the Overseas Private Investment Corporation partners with the private sector to invest in renewable energy and other markets in foreign countries, and the Export-Import Bank of the United States finances the foreign purchase of domestically-produced goods, including renewable energy technologies. In addition, the Commodity Futures Trading Commission and the Securities and Exchange Commission implement regulatory efforts involving markets for renewable energy certificates and commodities. Second, at the state level, the 50 states and the District of Columbia implement initiatives, including tax incentives, rebates, grants, and loans to individuals, businesses, or local governments for a wide range of renewable energy projects. Third, public and private utilities offer incentives to promote the installation and use of renewable energy systems by their customers, including rebates, loans, and performance-based incentives—payments based on the amount of energy generated by a renewable energy system.
Page 16:
In addition, EPA’s [U.S. Environmental Protection Agency] Renewable Fuel Standard program, mandated by the Clean Air Act, as amended, generally requires the volume of biofuels used in the transportation sector in the 48 contiguous states to increase through 2022 to an annual total of 36 billion gallons.26
26 Under the act, the Renewable Fuel Standard applies to transportation fuel sold or introduced into commerce in the 48 contiguous states. However, the Administrator of the EPA is authorized, upon a petition from Alaska or Hawaii, to allow the Renewable Fuel Standard to apply in that state. On June 22, 2007, Hawaii petitioned EPA to opt into the Renewable Fuel Standard, and the Administrator approved that request. For the purposes of this report, statements that the Renewable Fuel Standard applies to U.S. transportation fuel refer to the 48 contiguous states and Hawaii. For more information on biofuels and the Renewable Fuel Standard, see GAO [U.S. Government Accountability Office], Biofuels: Challenges to the Transportation, Sale, and Use of Intermediate Ethanol Blends, GAO-11-513 (Washington, D.C.: June 3, 2011), and Biofuels: Potential Effects and Challenges of Required Increases in Production and Use, GAO-09-446 (Washington, D.C.: Aug. 25, 2009).
Page 22:
In addition, while tax expenditures administered by the IRS generally support activities of private sector taxpayers, some tax expenditures also provide support for renewable energy efforts of public sector entities. For example, certain tax expenditures administered by IRS help public sector entities finance renewable energy projects by providing a credit to the bondholders who invest in such projects; thereby allowing the public sector entities to finance their projects with bonds that have lower interest rates than they would otherwise be able to issue.32
32 These tax expenditures include credits for taxpayers holding Clean Renewable Energy Bonds, New Clean Renewable Energy Bonds, and Qualified Energy Conservation Bonds. While there are differences between these credits in the amount of the credit available to taxpayers and how authority to issue the bonds was allocated, among other differences, generally for these bonds, taxpayers may receive an income tax credit in lieu of interest payments from the issuers of the bonds. Issuing these bonds helps tax-exempt entities finance projects that produce electricity from renewable energy sources because, since bondholders receive credits from the federal government, bond issuers can borrow while paying little or no interest on their debt. For the New Clean Renewable Energy Bonds and Qualified Energy Conservation Bonds, bond issuers also have the option to receive a direct payment equivalent to and in lieu of the amount of the tax credit that would otherwise go to the bondholder. In cases where bond issuers elect to receive a direct payment, this option helps tax-exempt entities finance projects that produce electricity from renewable energy sources because it provides an incentive for investors to purchase the bonds, since the investors’ returns would not depend upon having sufficient taxable income to utilize a tax credit.
[1176] Report: “Annual Energy Outlook 2013 with Projections to 2040.” U.S. Energy Information Administration, April 2013. <www.osti.gov>
Page 13: “Currently, 30 states and the District of Columbia have an enforceable renewable portfolio standard (RPS) or similar law (Table 3). Under such standards, each state determines its own levels of renewable generation, eligible technologies44, and noncompliance penalties. … In 2025 the [RPS] targets account for about 10 percent of U.S. electricity sales.”
[1177] Report: “Direct Federal Financial Interventions and Subsidies in Energy in Fiscal Year 2010.” U.S. Energy Information Administration, July 2011. <www.eia.gov>
Pages ix–x:
Not All Subsidies Impacting the Energy Sector Are Included in this Report
This report only includes subsidies meeting the following criteria: they are provided by the federal government, they provide a financial benefit with an identifiable FY 2010 federal budget impact, and, they are specifically targeted at energy. These criteria, particularly the energy-specific requirement, exclude some subsidies that benefit the energy sector. Some of the subsidies excluded from this analysis are discussed below.
For example, Section 199 of the American Jobs Creation Act of 2004, referred to as the domestic manufacturing deduction, provides reductions in taxable income for American manufacturers, including domestic oil and gas producers and refiners. The value of the Section 199 deduction in FY 2010 is estimated at $13 billion and approximately 25 percent is energy-related. While domestic oil and natural gas companies utilized this provision to reduce their 2010 tax liability, other industries, including traditional manufacturing sectors and other activities such as engineering and architectural services, sound recordings, and qualified film production, also took advantage of it.
Accelerated depreciation schedules arise from many provisions of the tax code and are widely available to energy and non-energy industries. Because the Internal Revenue Service (IRS) allows firms and individuals to deduct depreciation as an expense when computing their tax liability, accelerated depreciation front-loads deductible expenses, thereby reducing the present value of that liability. Accelerated depreciation provides a subsidy only to the extent that the amount of depreciation specified by the IRS exceeds the true economic “wear and tear” costs. Most empirical studies of economic depreciation have found evidence of some type of accelerated economic depreciation affecting various industries, though the exact pattern varied from study to study. This report includes the impacts of accelerated depreciation schedules identified as specific to the energy sector, but excludes schedules with applicability beyond the energy sector.
Subsidized credit for energy infrastructure projects is frequently provided by export credit agencies and multilateral development banks. However, entities such as the Export-Import Bank of the United States also provide support to non-energy industries including aerospace, medical equipment, non-energy mining, and agribusiness.
Tax-exempt municipal bonds allow publicly-owned utilities to obtain lower interest rates than those available from either private borrowers or the U.S. Treasury. However, while they are used by energy industries such as electric utilities, the group of eligible borrowers also includes water utilities, telecommunication facilities, waste treatment plants, and other publicly-owned entities.
The tax code allows a foreign tax credit for income taxes paid to foreign countries. If a multinational company is subject to a foreign country’s levy, and it also receives a specific economic benefit from that foreign country, it is classified as a “dual-capacity taxpayer.” Dual-capacity taxpayers cannot claim a credit for any part of the foreign levy unless it is established that the amount paid under a distinct element of the foreign levy is a tax, rather than a compulsory payment for some direct or indirect economic benefit. Major oil companies are significant beneficiaries of this provision. However, this tax provision is also available to non-energy industries.
The tax code also provides special treatment for some publicly-traded partnerships (PTP). Section 7704 of the Code generally treats a publicly-traded partnership as a corporation for federal income tax purposes. For this purpose, a PTP is any partnership that is traded on an established securities market or secondary market. However, a notable exception to Section 7704 occurs if 90 percent of the gross income of a PTP is passive-type income, such as interest, dividends, real property rents, gains from the disposition of real property, and similar income or gains. This would include gains from natural resource sales. In these cases, the PTP is exempt from corporate level taxation, thus allowing it to claim pass-through status for tax purposes.4
Another potential subsidy source not addressed in this report is associated with energy-related trust funds financed by taxes and fees. Examples include the Black Lung Disability Trust Fund, the Leaking Underground Storage Tank Trust Fund, the Oil Spill Liability Trust Fund, the Pipeline Safety Fund, the Aquatic Resources Trust Fund, the Abandoned Mine Reclamation Fund, the Nuclear Waste Fund, and the Uranium Enrichment Decontamination and Decommissioning Fund. By tying trust fund collections to products and activities responsible for the damages they address, the cost of programs for remediation and prevention of those damages can be reflected in the market price of energy use and production. If the fees or taxes collected by trust funds have been set appropriately, the funds will have sufficient resources to meet their obligations with the result that no subsidy is involved. However, if the fees or taxes are set too low, energy companies are receiving an implicit subsidy. These potential subsidies are not addressed in this report because of the difficulty in determining the sufficiency of the funds to meet potential liabilities and the fact that there is no direct federal budgetary impact in FY 2010. As with many other tax provisions, the tax treatment of PTPs is not exclusive to the energy sector.
This report also does not attempt to quantify the potential subsidy resulting from limits to liability in case of a nuclear accident provided by Section 170 of the Atomic Energy Act of 1954, the Price-Anderson Act. The Price-Anderson Act requires each operator of a nuclear power plant to obtain the maximum amount of primary coverage of liability insurance. Currently, the amount is about $400 million. Damages exceeding that amount would be funded with a retroactive assessment on all other firms owning commercial reactors based upon the number of reactors they own. However, Price-Anderson places a limit on the total liability to all owners of commercial reactors at about $12 billion.
Page 29:
LIHEAP [Low Income Home Energy Assistance Program] was established as a block grant program in 1981 for the purpose of subsidizing heating and cooling costs for low-income households. Because LIHEAP is a block grant, LIHEAP grants are provided to States, territories and Tribes who are then free to administer the program within the requirements of federal law. Federal LIHEAP requirements set eligibility at 150 percent of the federal poverty level or 60 percent of the State’s median income, but do have some flexibility and allow “maximum policy discretion to grantees.” Other federal rules include coordination with DOE’s [U.S. Department of Energy] Weatherization Assistance program, annual audits, and outreach activities. Heating and/or cooling assistance funds may be paid directly to eligible households or to retail energy suppliers in the form of cash or vouchers but in practice the majority of funds are paid directly to the energy providers. In addition to funds used for heating and/or cooling assistance, money must be set aside by recipients for energy crisis intervention and has been released for natural disasters, such as Hurricane Katrina in 2005.
[1178] Report: “Nuclear Power’s Role in Generating Electricity.” Congressional Budget Office, May 2008. <www.cbo.gov>
Page 26:
Neither the assumptions underlying that study nor CBO’s [Congressional Budget Office] base-case assumptions explicitly included the additional costs that utilities would have to pay if not for the limited liability protection offered under the Price-Anderson Nuclear Industries Indemnity Act, a policy long in effect (and extended by EPAct [Energy Policy Act of 2005]) that is implicitly captured in the reference scenario’s assumptions. Supplementary analysis that expands on the reference scenario by exploring the likelihood that a catastrophic nuclear accident might occur suggests that removing that insurance subsidy would probably increase the levelized cost of nuclear generation by no more than 1 percent (see Box 3-1).
Page 29:
Insurance premiums represent a small portion of the levelized cost for a nuclear power plant. Even if the analysis based on the Surry facility understates the expected cost of fatal nuclear accidents by a factor of 10, paying a fair premium would not lead to large changes in the levelized cost. In CBO’s reference scenario, increasing the insurance premium by $6 million per year increases the levelized costs by 1 percent.
[1179] Calculated with data from:
a) Report: “Federal Financial Interventions and Subsidies in Energy Markets 1999: Primary Energy.” U.S. Energy Information Administration, September 1999. <www.justfacts.com>
Page viii: “This report measures subsidies based on the cost of the programs to the Federal budget. … Federal subsidies for primary energy are estimated to be $4.0 billion in fiscal year 1999, down about $1 billion (1999 dollars) from fiscal year 1992 (Table ES1 and Figure ES1).”
Pages ix–x: “A subsidy amount of $4 billion or $5 billion is, in general, too small to have a significant effect on the overall level of energy prices and consumption in the United States; however, the subsidy programs described in this report are, in most cases, targeted at narrow segments of the energy industry (e.g., ethanol production for blending into gasoline and natural gas production from coalbed methane and tight sands).”
b) Report: “Annual Energy Review 2011.” U.S. Energy Information Administration, Office of Energy Statistics, September 2012. <www.eia.gov>
Page 13: “Table 1.5. Energy Consumption, Expenditures, and Emissions Indicators Estimates, Selected Years, 1949–2011 … Energy Expenditures (Million Nominal Dollars) … 1999 [=] 556,379”
CALCULATION: $5 billion / $556 billion = 0.9%
[1180] Report: “Federal Financial Interventions and Subsidies in Energy Markets 1999: Primary Energy.” U.S. Energy Information Administration, September 1999. <www.justfacts.com>
Page viii:
This report measures subsidies based on the cost of the programs to the Federal budget. This approach has the advantage of being relatively easy to measure using available information. However, Federal budget estimates generally overstate both the economic costs and the market impacts of specific programs. Programs that offer small subsidies for products for which there are huge existing markets tend to function mostly as transfer programs; that is, their market impacts are negligible, and for the most part they simply redistribute funds from one part of the economy to another, with the Government acting as the intermediary. More often, Federal energy subsidies offer relatively large payments to producers using specific energy technologies that otherwise would be uneconomical. In these cases, the effects on the larger markets are small, but the impacts on the use of particular technologies may be significant.
[1181] Report: “Federal Energy Subsidies: Direct and Indirect Interventions in Energy Markets.” U.S. Energy Information Administration, November 1992. <www.justfacts.com>
Page x:
Federal energy subsidies are not large compared to the total value of energy production. This report delineates an annual cost of between $5 billion and $10 billion from Federal energy subsidies for 1990. The total value of production in all energy industries is close to $475 billion. This meant that Federal subsidies were approximately 1 to 2 percent of the value of sales. This does not mean that subsidies are not important and have not influenced either production or consumption patterns for energy, but it does indicate that energy is not a heavily subsidized industry.
[1182] Calculated with data from:
a) Report: “Federal Financial Interventions and Subsidies in Energy Markets 1999: Primary Energy.” U.S. Energy Information Administration, September 1999. <www.justfacts.com>
Page viii: “This report measures subsidies based on the cost of the programs to the Federal budget. … Federal subsidies for primary energy are estimated to be $4.0 billion in fiscal year 1999, down about $1 billion (1999 dollars) from fiscal year 1992 (Table ES1 and Figure ES1).”
b) Report: “Annual Energy Review 2011.” U.S. Energy Information Administration, Office of Energy Statistics, September 2012. <www.eia.gov>
Page 13: “Table 1.5. Energy Consumption, Expenditures, and Emissions Indicators Estimates, Selected Years, 1949–2011 … Energy Expenditures (Million Nominal Dollars) … 1999 [=] 556,379”
CALCULATION: $4,000 million / $556,379 million = 0.7%
[1183] Calculated with data from:
a) Report: “Direct Federal Financial Interventions and Subsidies in Energy in Fiscal Year 2010.” U.S. Energy Information Administration, July 2011. <www.eia.gov>
Page xiii: “Table ES2. Quantified energy-specific subsidies and support by type, FY 2010 and FY 2007 (million 2010 dollars) … Total … 2007 [=] 17,895”
b) Report: “Annual Energy Review 2011.” U.S. Energy Information Administration, Office of Energy Statistics, September 2012. <www.eia.gov>
Page 13: “Table 1.5. Energy Consumption, Expenditures, and Emissions Indicators Estimates, Selected Years, 1949–2011 … Energy Expenditures (Million Nominal Dollars) … 2007 [=] 1,234,282”
CALCULATION: $17,895 million / $1,234,282 million = 1.4%
[1184] Calculated with data from:
a) Report: “Direct Federal Financial Interventions and Subsidies in Energy in Fiscal Year 2010.” U.S. Energy Information Administration, July 2011. <www.eia.gov>
Page xiii: “Table ES2. Quantified energy-specific subsidies and support by type, FY 2010 and FY 2007 (million 2010 dollars) … Total … 2010 [=] 37,160”
b) Report: “Annual Energy Review 2011.” U.S. Energy Information Administration, Office of Energy Statistics, September 2012. <www.eia.gov>
Page 13: “Table 1.5. Energy Consumption, Expenditures, and Emissions Indicators Estimates, Selected Years, 1949–2011 … Energy Expenditures (Million Nominal Dollars) … 2010 [=] 1,204,827”
CALCULATION: $37,160 million / $1,204,827 million = 3.1%
[1185] Calculated with data from:
a) Report: “Direct Federal Financial Interventions and Subsidies in Energy in Fiscal Year 2013.” U.S. Energy Information Administration, March 12, 2015. <www.eia.gov>
Page xv: “Table ES2. Quantified energy-specific subsidies and support by type, FY 2013 and FY 2010 (million 2013 dollars) … Total … 2013 [=] 29,258”
b) Report: “April 2016 Monthly Energy Review.” U.S. Energy Information Administration, Office of Energy Statistics, April 26, 2016. <www.eia.gov>
Page 17: “Table 1.7 Energy Consumption, Energy Expenditures, and Carbon Dioxide Emissions Indicators … Energy Expenditures … Expenditures … Million Nominal Dollars … 2013 [=] 1,375,306”
CALCULATION: $29,258 million / $1,375,306 million = 2.1%
[1186] Calculated with data from:
a) Report: “Direct Federal Financial Interventions and Subsidies in Energy in Fiscal Year 2016.” U.S. Energy Information Administration, April 2018. <www.eia.gov>
Page 9: “Table 3. Quantified energy-specific subsidies and support by type, FY 2010, FY 2013, and FY 2010 (million 2016 dollars, unless otherwise specified) … Total … 2016 [=] 14,983”
b) Report: “June 2018 Monthly Energy Review.” U.S. Energy Information Administration, Office of Energy Statistics, June 26, 2018. <www.eia.gov>
Page 17: “Table 1.7 Primary Energy Consumption, Energy Expenditures, and Carbon Dioxide Emissions Indicators … Energy Expendituresb … Expenditures (Million Nominal Dollars) … 2016 [=] 1,038,504 … b Expenditures include taxes where data are available.”
CALCULATION: $14,983 million / $1,038,504 million = 1.4%
[1187] Report: “Federal Financial Interventions and Subsidies in Energy Markets 1999: Primary Energy.” U.S. Energy Information Administration, September 1999. <www.justfacts.com>
Page 11:
This chapter discusses Federal programs directly affecting the energy industry through which the Federal Government provides a direct financial benefit to energy producers or consumers and receipt of the benefit is directly linked to primary energy production and consumption. … The type of Federal program considered in this chapter consists mainly of Federal Government tax expenditures.
[1188] Report: “Direct Federal Financial Interventions and Subsidies in Energy in Fiscal Year 2010.” U.S. Energy Information Administration, July 2011. <www.eia.gov>
Page viii: “Tax Expenditures. These are provisions in the federal tax code that reduce the tax liability of firms or individuals who take specified actions that affect energy production, consumption, or conservation.”
[1189] Calculated with data from the report: “Testimony on Federal Support for the Developing, Producing, and Using Fuels and Energy Technologies.” Congressional Budget Office, March 29, 2017. <www.cbo.gov>
Page 4: “Figure 1. Costs of Energy-Related Tax Preferences, by Type of Fuel or Technology, 1985 to 2016.”
NOTE: An Excel file containing the data and calculations is available upon request.
[1190] Report: “Testimony on Federal Support for the Developing, Producing, and Using Fuels and Energy Technologies.” Congressional Budget Office, March 29, 2017. <www.cbo.gov>
Page 4: “Figure 1. Costs of Energy-Related Tax Preferences, by Type of Fuel or Technology, 1985 to 2016.”
NOTE: An Excel file containing the data is available upon request.
[1191] Report: “Federal Financial Interventions and Subsidies in Energy Markets 1999: Primary Energy.” U.S. Energy Information Administration, September 1999. <www.justfacts.com>
Page ix: “Although the value of energy subsidies is low relative to total energy expenditures, some forms of energy receive subsidies that are substantial relative to the value of the fuels.”
Pages ix–x: “A subsidy amount of $4 billion or $5 billion is, in general, too small to have a significant effect on the overall level of energy prices and consumption in the United States; however, the subsidy programs described in this report are, in most cases, targeted at narrow segments of the energy industry (e.g., ethanol production for blending into gasoline and natural gas production from coalbed methane and tight sands).”
[1192] Report: “Federal Financial Interventions and Subsidies in Energy Markets 2007.” U.S. Energy Information Administration, April 2008. <www.eia.gov>
Page xvi: “A per-unit measure of electricity production subsidies and support may provide a better indicator of its market impact than an absolute measure. For example, even though coal receives more subsidies in absolute terms than wind power, the use of wind is likely to be more dependent on the availability of subsidies than the use of coal.”
[1193] Report: “Direct Federal Financial Interventions and Subsidies in Energy in Fiscal Year 2010.” U.S. Energy Information Administration, July 2011. <www.eia.gov>
Page xviii: “Table ES4. Fiscal year 2010 electricity production subsidies and support (million 2010 dollars) … Total … Coal [=] 1,189 … Solar [=] 968”
[1194] Report: “Direct Federal Financial Interventions and Subsidies in Energy in Fiscal Year 2010.” U.S. Energy Information Administration, July 2011. <www.eia.gov>
Page xx: “Table ES5. Measures of electricity production and production growth … Share of 2010 Generation (percent) … Coal [=] 44.9% … Solar [=] 0.0%”
NOTE: The figure for solar is incomplete. See the next footnote.
[1195] Calculated with data from the report: “Annual Energy Review 2011.” U.S. Energy Information Administration, Office of Energy Statistics, September 2012. <www.eia.gov>
Page 224: “Table 8.2a: Electricity Net Generation: Total (All Sectors), Selected Years, 1949–2011”
NOTES:
[1196] Calculated with data from:
a) Report: “Testimony on Federal Support for the Developing, Producing, and Using Fuels and Energy Technologies.” Congressional Budget Office, March 29, 2017. <www.cbo.gov>
Page 4: “Figure 1. Costs of Energy-Related Tax Preferences, by Type of Fuel or Technology, 1985 to 2016.”
b) Report: “May 2018 Monthly Energy Review.” U.S. Energy Information Administration, Office of Energy Statistics, May 24, 2018. <www.eia.gov>
Page 5: “Table 1.2 Primary Energy Production by Source”
NOTE: An Excel file containing the data and calculations is available upon request.
[1197] Calculated with data from:
a) Report: “Testimony on Federal Support for the Developing, Producing, and Using Fuels and Energy Technologies.” Congressional Budget Office, March 29, 2017. <www.cbo.gov>
Page 4: “Figure 1. Costs of Energy-Related Tax Preferences, by Type of Fuel or Technology, 1985 to 2016.”
b) Report: “May 2018 Monthly Energy Review.” U.S. Energy Information Administration, Office of Energy Statistics, May 24, 2018. <www.eia.gov>
Page 5: “Table 1.2 Primary Energy Production by Source”
NOTE: An Excel file containing the data and calculations is available upon request.
[1198] Report: “Federal Financial Interventions and Subsidies in Energy Markets 1999: Primary Energy.” U.S. Energy Information Administration, September 1999. <www.justfacts.com>
Page viii:
Programs that offer small subsidies for products for which there are huge existing markets tend to function mostly as transfer programs; that is, their market impacts are negligible, and for the most part they simply redistribute funds from one part of the economy to another, with the Government acting as the intermediary. More often, Federal energy subsidies offer relatively large payments to producers using specific energy technologies that otherwise would be uneconomical. In these cases, the effects on the larger markets are small, but the impacts on the use of particular technologies may be significant. … Although the value of energy subsidies is low relative to total energy expenditures, some forms of energy receive subsidies that are substantial relative to the value of the fuels. … A subsidy amount of $4 billion or $5 billion is, in general, too small to have a significant effect on the overall level of energy prices and consumption in the United States; however, the subsidy programs described in this report are, in most cases, targeted at narrow segments of the energy industry (e.g., ethanol production for blending into gasoline and natural gas production from coalbed methane and tight sands). … Although the value of energy subsidies is low relative to total energy expenditures, some forms of energy receive subsidies that are substantial relative to the value of the fuels.
[1199] Report: “Federal Financial Interventions and Subsidies in Energy Markets 2007.” U.S. Energy Information Administration, April 2008. <www.eia.gov>
Page xvi: “A per-unit measure of electricity production subsidies and support may provide a better indicator of its market impact than an absolute measure. For example, even though coal receives more subsidies in absolute terms than wind power, the use of wind is likely to be more dependent on the availability of subsidies than the use of coal.”
[1200] Report: “Federal Energy Subsidies: Direct and Indirect Interventions in Energy Markets.” U.S. Energy Information Administration, November 1992. <www.justfacts.com>
Page 46:
Coal conversion R&D. Coal conversion covers R&D [research and development] on technologies to convert coal into either petroleum products or synthetic gas. FY 1992 allocations were about $50 million, cut to $38 million in the FY 1993 request. Coal conversion technologies are inherently very high-cost technologies. The United States has a lengthy history of Government-funded efforts to create a synfuels industry.71 This effort has proven the technical possibility of producing synthetic fuels from coal. However, existing technologies are not competitive in current energy markets.72
71 Interested readers can learn about the history of synfuels programs in Richard Vietor, Energy Policy in America Since 1945 (New York, NY: Cambridge University Press, 1984), pp. 44–63 and pp. 163–189. See also Linda Cohen and Roger Noll, The Technology Pork Barrel (Washington, DC: the Brookings Institution, 1991), pp. 259–319.
72 A National Research Council study estimated that coal liquefaction plants, based on future technology developed through current R&D spending, would require oil prices ranging from $30 to $89 per barrel. National Research Council, Fuels to Drive Our Future (Washington, DC: National Academy Press, 1990), pp. 160–161.
[1201] Article: “A Crack in the System.” By Brady Dennis and Robert O’Harrow Jr. Washington Post, December 30, 2008. <www.washingtonpost.com>
That’s how [AIG Financial Products’ Joseph] Cassano and his Transaction Development Group found coal. …
A 1980 law, generated by the Carter administration, offered tax credits to companies as incentives to design and use synthetic fuel systems. The aim was to reduce U.S. dependence on foreign oil.
Associates at the Transaction Development Group had discovered that many energy companies were not making enough money to benefit from the tax breaks. But Financial Products’ profitable parent, AIG, could use those credits to reduce its tax bill.
“One thing AIG had was ample income,” Savage said. “So what we did is, we went out and we bought synthetic coal facilities.”
The firm had no intention of becoming coal processors. Instead, it arranged to install the equipment—bought for more than $225 million, as Savage recalls—at coal facilities and power plants. The facilities leased and operated the machines at a discount, while AIG got millions in tax credits. …
Over the next several years, AIG reaped $875 million in benefits from the deals. It was a coup for Cassano and his group. Although it wasn’t Cassano’s idea, Savage said, he guided it from concept to reality.
[1202] Report: “Federal Financial Interventions and Subsidies in Energy Markets 2007.” U.S. Energy Information Administration, April 2008. <www.eia.gov>
Page xv:
1 The alternative fuel production tax credit was initially established in the Windfall Profit Tax Act of 1980 (Public Law 96-223). The provision was codified in Section 29 of the Internal Revenue Code. It was subsequently modified by Section 710 of the American Jobs Creation Act of 2004 (Public Law 108-357) to include synthetic coal, which was redefined as refined coal and recodified in Section 45 of the Internal Revenue Code. The expiration date to qualify for the credit was extended in EPACT2005 [Energy Policy Act of 2005].
Page 30:
Credits for synthetic coal, landfill gas, and coke and coke oven gas were still in effect in 2007, but the synthetic coal credit for the 59 qualifying synfuel plants expired at the end of 2007. Most synthetic coal projects are owned by institutional investors such as insurance companies, banks, utilities, and large corporations with substantial net revenues against which the tax credits can be taken. Between 2002 and 2007, synthetic coal production nearly doubled (Figure 1). Production fell between 2005 and 2006 when high oil prices caused some plant operators into shutting down their facilities for part of the year.
Page 31:
The American Jobs Creation Act of 2004 (AJCA, Section 710, Public Law 108-357) introduced additional criteria for facilities producing synthetic (also referred to as “refined coal”).52 …
52 Although the terms “synthetic” and “refined” have been defined somewhat differently in various legislative provision, they are used interchangeably in this report.
Page 117:
Synthetic coal is the largest recipient of the Section 29 tax credit. Under IRC [Internal Revenue Code] Section 48 coal was qualified as a synthetic fuel as defined if it differs significantly in chemical composition from the alternative substance used to produce it. To qualify for this credit, a taxpayer must produce and sell qualified fuel from a production facility that was placed in service as of July 1, 1998, pursuant to a binding written contract in place as of January 1, 1997, and produced through December 31, 2007. The coal may be of any rank from lignite to anthracite although bituminous coals are most prominently used. In order to be classified as a synthetic fuel, coal must undergo a significant chemical change under the criteria of Internal Revenue Service Revenue Ruling 86-100. … Companies have been claiming the credits since as early as 1998.210
[1203] Report: “Energy Tax Policy: Historical Perspectives on and Current Status of Energy Tax Expenditures.” By Molly F. Sherlock. Congressional Research Service, May 2, 2011. <www.leahy.senate.gov>
Pages 17–18:
While the unconventional fuel production tax credit was initially enacted as part of the WPT80 [Windfall Profit Tax Act of 1980], the early revenue losses associated with the provision were low. The goal of the unconventional fuel production tax credit was to stimulate the production of synthetic fuels using domestic deposits of oil, gas, and coal. Even in the face of the high oil prices of the late 1970s and early 1980s, there was little production of unconventional fuels. By the late 1980s and into the early 1990s, producers of unconventional gases, such as coal bed methane and tight sands gas, had begun to claim the credit. The credit was expanded and extended under OBRA [the Omnibus Budget Reconciliation Act] in 1990 and again under the Energy Policy Act of 1992.
The composition of energy tax expenditures remained relatively stable throughout the late 1990s and early 2000s. By 2005, significant changes in the composition of revenue losses attributable to energy tax expenditures began to emerge. As provisions enacted under EPACT05 [Energy Policy Act of 2005] in 2005 went into effect, revenue losses associated with energy tax provisions increased. The provision primarily responsible for increasing energy tax expenditures in the years immediately after 2005 was the unconventional fuel production credit. In 2004, revenue losses associated with the unconventional fuel production credit were an estimated $0.6 billion. By 2007, revenue losses associated with the provision had increased more than seven-fold to $4.5 billion.
The unconventional fuels production credit was designed to induce the substitution of coal for oil and stimulate the development of a new synthetic fuel industry, but ultimately there were questions as to whether the credit served to benefit its intended recipients. A number of favorable private letter rulings from the IRS in the late 1990s and early 2000s encouraged an increasing number of producers to claim the tax credit for synthetic fuels.35 To qualify for the credit for coal-based synthetic fuel, producers had to demonstrate that their process involved a “substantial chemical change.” Some firms qualifying for this credit were simply spraying newly mined coal with diesel fuel, pine-tar resin, limestone, acid, or some other substance to induce this chemical change. By the mid-2000s there was evidence of substantial abuse of the credit.36 Following EPACT05, the Section 29 credit was eliminated from the Internal Revenue Code.
Page 21: “Even more striking is the fact that the primary beneficiaries of these tax credits—in both the case of the unconventional fuels production credit and the case of black liquor—were not those policymakers drafting the provision initially sought to subsidize.”
[1204] Report: “Direct Federal Financial Interventions and Subsidies in Energy in Fiscal Year 2010.” U.S. Energy Information Administration, July 2011. <www.eia.gov>
Page 11:
Synthetic coal. In FY 2007, the value of this credit for synthetic fuel produced from coal, and biomass, at $3.0 billion, made it the second largest tax expenditure. However under the Code, the credit was available only for synthetic fuel produced from coal and biomass sold up through 2007. Absent the tax credit, none of the 59 coal synthetic plants producing about 140 million tons of coal synfuel in 2007 remained profitable and all ceased production at the end of 2007.
[1205] Webpage: “SECNAV’s #Energy Goals Come to Life with #GreatGreenFleet.” Navy Office of Information. Accessed May 25, 2018 at <www.navy.mil>
What is the “Great Green Fleet”?
• In 2009, Secretary of the Navy (SECNAV) Ray Mabus announced five aggressive energy goals to reduce the Department of Navy’s (DON’s) consumption of energy, decrease its reliance on foreign sources of oil, and significantly increase its use of alternative energy.
• One of the five energy goals is to demonstrate and then deploy a “Great Green Fleet,” a Carrier Strike Group fueled by alternative sources of energy, including nuclear power. …
Why is the Navy doing this?
• SECNAV’s goals are designed to not only help save the US Navy money in the long run, but to make us more safe through decreasing our reliance on foreign sources of fuel.
[1206] Article: “Navy Secretary and USDA Secretary Announce Largest Government Purchase of Biofuel.” Official Website of the United States Navy, December 5, 2011. <www.navy.mil>
Secretary of the Navy Ray Mabus and U.S. Department of Agriculture Secretary Tom Vilsack announced the Defense Logistics Agency (DLA) signed a contract to purchase 450,000 gallons of advanced drop-in biofuel, the single largest purchase of biofuel in government history, Dec. 5.
While the Navy fleet alone uses more than 1.26 billion gallons of fuel each year, this biofuel purchase is significant because it accelerates the development and demonstration of a homegrown fuel source that can reduce America’s, and the military’s, dependence on foreign oil.
The Defense Department will purchase biofuel made from a blend of non-food waste (used cooking oil) from the Louisiana-based Dynamic Fuels, LLC, a joint-venture of Tyson Foods, Inc., and Syntroleum Corporation, and algae, produced by Solazyme. The fuel will be used in the U.S. Navy’s demonstration of a Green Strike Group in the summer of 2012 during the Rim of the Pacific Exercise (RIMPAC), the world’s largest international maritime exercise.
[1207] “Dynamic Fuels Green Fleet Solicitation SP0600-12-D-0549.” <www.inhofe.senate.gov>
Page 2:
HRJ5 Green Fleet Fuel Purchase Total: $2,675,000.000 …
HRD76 Green Fleet Purchase Total: $9,362,500.00 …
ITEM [=] 0101 … EST QTY/GALS [=] 100,000 … BASE UNIT PRICE [=] $26.750000 … DELIVERY DATE [=] May 1, 2012
ITEM [=] 0201 … EST QTY/GALS [=] 350,000 … BASE UNIT PRICE [=] $26.750000 … DELIVERY DATE [=] May 1, 2012
[1208] Article: “Insight: ‘Green Fleet’ Sails, Meets Stiff Headwinds in Congress.” By David Alexander. Reuters, July 2, 2012. <www.reuters.com>
The Pentagon hopes it can prove the Navy looks as impressive burning fuel squeezed from seeds, algae and chicken fat as it does using petroleum.
But the demonstration, years in the making, may be a Pyrrhic victory.
Some Republican lawmakers have seized on the fuel’s $26-a-gallon price, compared to $3.60 for conventional fuel.
[1209] Calculated with data from the report: “Direct Federal Financial Interventions and Subsidies in Energy in Fiscal Year 2010.” U.S. Energy Information Administration, July 2011. <www.eia.gov>
Page xviii: “Table ES4. Fiscal year 2010 electricity production subsidies and support (million 2010 dollars) … Total … Renewables [=] 6,560 … Hydropower [=] 215 … Solar [=] 968 … Wind [=] 4,986”
Page xx: “Table ES5. Measures of electricity production and production growth … 2010 Net Generation (billion kilowatt-hours) … Renewables [=] 425 … Hydroelectric [=] 257 … Solar [=] 1 … Wind [=] 95”
NOTE: The solar production data in this report is incomplete because it does not account for significant amounts of PV [photovoltaic] generated outside of the electric power sector (Article: “New EIA Data Show Total Grid-Connected Photovoltaic Solar Capacity.” U.S. Energy Information Administration, October 24, 2012. <www.eia.gov>). Based upon multiple calculations performed by Just Facts using EIA [U.S. Energy Information Administration] data, total solar generation can be estimated by multiplying the data in this report by 2.5. For the details of how Just Facts arrived at this figure, contact us.
CALCULATIONS:
[1210] Report: “Federal Energy Subsidies: Direct and Indirect Interventions in Energy Markets.” U.S. Energy Information Administration, November 1992. <www.justfacts.com>
Page 7: “Table 1. Summary of Subsidy Elements in Federal Programs by Program Type and Fuel on a Budget Outlay Basis, FY 1992 (Million Dollars) … Oil … Gas … Coal … Nuclear … Renewables … Electricity … Conservation”
NOTE: Table C4 on page 155 itemizes Department of Energy R&D [research and development] subsidies for specific renewables, but the report does not provide such data for overall subsidies.
[1211] Report: “Federal Financial Interventions and Subsidies in Energy Markets 1999: Primary Energy.” U.S. Energy Information Administration, September 1999. <www.justfacts.com>
Page ix: “Table ES1. Summary of Primary Energy Subsidy Elements in Federal Programs by Fuel and Program Type on a Budget Outlay Basis, Fiscal Year 1999 (Million 1999 Dollars) … Oil … Gas … Coal … Nuclear … Renewables … Electricity”
Page 20: “The tax expenditure ‘New Technology Credit’ is an aggregation of the investment tax credit for solar and geothermal energy coupled with the renewable resource production tax credit directed at wind and biomass energy. These values are not reported separately in U.S. budget documents. The U.S. Treasury does not disaggregate these items separately as tax expenditures.”
NOTE: Table C4 on page 118 itemizes Department of Energy R&D [research and development] subsidies for specific renewables, but the report does not provide such data for overall subsidies.
[1212] Report: “Federal Financial Interventions and Subsidies in Energy Markets 2007.” U.S. Energy Information Administration, April 2008. <www.eia.gov>
Page xvi:
Table ES5. Subsidies and Support to Electricity Production: Alternative Measures … FY 2007 Subsidy and Support per Unit of Production (dollars/megawatthour) … Coal … Refined Coal … Natural Gas and Petroleum Liquids … Nuclear … Biomass (and biofuels) … Geothermal … Hydroelectric … Solar … Wind … Landfill Gas … Municipal Solid Waste … Unallocated Renewables … Transmission and Distribution
Page xiii: “Table ES6. Energy Subsidies Not Related to Electricity Production: Alternative Measures … FY 2007 Subsidy and Support per Unit of Production (dollars/megawatthour) … Coal … Refined Coal … Natural Gas and Petroleum Liquids … Ethanol/Biofuels … Geothermal … Solar … Other Renewables … Hydrogen”
[1213] Report: “Direct Federal Financial Interventions and Subsidies in Energy in Fiscal Year 2010.” U.S. Energy Information Administration, July 2011. <www.eia.gov>
Page xiii: “Table ES2. Quantified energy-specific subsidies and support by type, FY 2010 and FY 2007 (million 2010 dollars) … Coal … Refined coal … Natural Gas and Petroleum Liquids … Nuclear … Biomass … Geothermal … Hydro … Solar … Wind … Other [Renewables] … Biofuels … Electricity – Smart Grid and Transmission … Conservation … End-Use”
[1214] Report: “Direct Federal Financial Interventions and Subsidies in Energy in Fiscal Year 2013.” U.S. Energy Information Administration, March 12, 2015. <www.eia.gov>
Page xv: “Table ES2. Quantified energy-specific subsidies and support by type, FY 2013 and FY 2010 (million 2013 dollars) … Coal … Refined coal … Natural Gas and Petroleum Liquids … Nuclear … Biomass … Geothermal … Hydropower … Solar … Wind … Other [Renewables] … Biofuels … Electricity – Smart Grid and Transmission … Conservation … End-Use”
[1215] Report: “Direct Federal Financial Interventions and Subsidies in Energy in Fiscal Year 2016.” U.S. Energy Information Administration, April 24, 2018. <www.eia.gov>
Page 11: “Table 4. Quantified renewable-related energy-specific subsidies and support by type, FY 2010, FY 2013, and FY 2016 (million 2016 dollars, unless otherwise specified) … Biomass … Geothermal … Hydroelectric … Solar … Wind … Other … Biofuels … Solar … Wind … Other … Biofuels … ”
[1216] Calculated with data from:
a) Report: “Direct Federal Financial Interventions and Subsidies in Energy in Fiscal Year 2016.” U.S. Energy Information Administration, April 2018. <www.eia.gov>
Page 9: “Table 3. Quantified energy-specific subsidies and support by type, FY 2010, FY 2013, and FY 2016 (million 2016 dollars, unless otherwise specified)”
Page 11: “Table 4. Quantified renewable-related energy-specific subsidies and support by type, FY 2010, FY 2013, and FY 2016 (million 2016 dollars, unless otherwise specified)”
b) Report: “May 2018 Monthly Energy Review.” U.S. Energy Information Administration, Office of Energy Statistics, May 24, 2018. <www.eia.gov>
Page 5: “Table 1.2. Primary Energy Production by Source”
Page 153: “Table 10.1. Renewable Energy Production and Consumption by Source”
NOTE: An Excel file containing the data and calculations is available upon request.
[1217] Calculated with data from:
a) “Direct Federal Financial Interventions and Subsidies in Energy in Fiscal Year 2010.” U.S. Energy Information Administration, July 2011. <www.eia.gov>
Page xiv: “Table ES2. Quantified energy-specific subsidies and support by type, FY 2010 and FY 2007 (cont.) (million 2010 dollars)”
b) Report: “Direct Federal Financial Interventions and Subsidies in Energy in Fiscal Year 2016.” U.S. Energy Information Administration, April 2018. <www.eia.gov>
Page 9: “Table 3. Quantified energy-specific subsidies and support by type, FY 2010, FY 2013, and FY 2016 (million 2016 dollars, unless otherwise specified)”
Page 11: “Table 4. Quantified renewable-related energy-specific subsidies and support by type, FY 2010, FY 2013, and FY 2016 (million 2016 dollars, unless otherwise specified)”
Page 13: “The estimation methods used by EIA are revised as new data and improved methods become available. While efforts are made to maintain consistency, improved estimation techniques take precedence over complete consistency with past editions of this report.”
c) Report: “May 2018 Monthly Energy Review.” U.S. Energy Information Administration, Office of Energy Statistics, May 24, 2018. <www.eia.gov>
Page 5: “Table 1.2. Primary Energy Production by Source”
Page 153: “Table 10.1. Renewable Energy Production and Consumption by Source”
d) Webpage: “CPI Inflation Calculator.” United States Department of Labor, Bureau of Labor Statistics. Accessed May 26, 2018. <www.bls.gov>
“$1.00 in January 2010 has the same buying power as $1.09 in January 2016”
“The CPI inflation calculator uses the Consumer Price Index for All Urban Consumers (CPI-U) U.S. city average series for all items, not seasonally adjusted. This data represents changes in the prices of all goods and services purchased for consumption by urban households.”
NOTE: An Excel file containing the data and calculations is available upon request.
[1218] Report: “Direct Federal Financial Interventions and Subsidies in Energy in Fiscal Year 2010.” U.S. Energy Information Administration, July 2011. <www.eia.gov>
Page xvi:
The Growth in Energy-Specific Subsidies and Support Between FY 2007 and FY 2010 Does Not Closely Correspond to Changes in Energy Consumption and Production Over the Same Time Period. In fact, overall energy consumption actually fell from 101 quadrillion Btu to 98 quadrillion Btu between 2007 and 2010, reflecting economic conditions, while domestic energy production rose from 71 quadrillion Btu to 75 quadrillion Btu due to increasing domestic production of shale gas, crude oil, and renewable energy (Table ES3). While the overall amount of federal subsidies and support provided per unit of overall energy consumption or production has clearly grown, simply dividing the current value of subsidies by current consumption or production does not reflect either the long-run impact of imbedded subsidies and or the future impacts of current subsidies and support that may only be starting to impact energy markets. For example, increases in R&D [research and development] expenditures are not reflected in the Nation’s energy mix unless and until the research leads to successful innovations that penetrate the market, a process that can take many years.
Page xvii:
Relative to their share of total electricity generation, renewables received a large share of direct federal subsidies and support in FY 2010. For example, renewable fuels accounted for 10.3 percent of total generation, while they received 55.3 percent of federal subsidies and support (Tables ES4 and ES5). However, caution should be used when making such calculations because many factors can drive the results. For example, many of the programs that showed the largest increases in subsidies between FY 2007 and FY 2010 are supporting facilities that are still under construction, including energy equipment manufacturing facilities that may not affect energy consumption or production for several years. Furthermore, the ARRA [American Recovery and Reinvestment Act of 2009] 1603 grant program, that allows investors to choose an upfront grant instead of a 10-year production tax credit, tended to lead to much higher overall electricity subsidy estimates for renewables in FY 2010 than would have occurred had they continued to rely on the existing production tax credit program, which does not front-load subsidy costs. Focusing on a single year’s data also does not capture the imbedded effects of subsidies that may have occurred over many years across all energy fuels and technologies.
[1219] Report: “Federal Financial Interventions and Subsidies in Energy Markets 2007.” U.S. Energy Information Administration, April 2008. <www.eia.gov>
Page 41:
The results of R&D [research and development] are inherently uncertain. Many programs are intended to advance knowledge across a range of energy and non-energy applications, rather than in the context of a particular fuel or form of consumption. Furthermore, the knowledge obtained may not be of value, in the sense that the research may only reveal technical or economic dead ends to be avoided in the future.65 Thus, only a portion of Federal energy R&D is likely to achieve results in the form of changes in energy production costs or consumption that can be attributed to a specific R&D program. Moreover, to the extent that R&D yields commercial technologies, they are likely to be measurable only years after the funded research effort is initiated.
Federal R&D is intended to support research that the private sector will not undertake. It is not supposed to substitute for private sector R&D. However, the creation of a Federally-funded R&D program could, under some circumstances, displace private-sector R&D. In that case, the Federal program would not produce new knowledge that could not be developed by the private sector, but would simply reduce private R&D costs. It is impossible to know with certainty what R&D private-sector firms would have performed in the hypothetical absence of a Federal program. In general, the less “basic” the R&D program and the more focused on near-term commercialization, the greater the risk that the program will be a substitute for private-sector R&D. As R&D projects approach commercial viability, the justification for government participation lessens.66
Federal government energy-related R&D spending often represents a first stage of Federal intervention in energy markets. The rationale for government intervention in technology development lessens as products approach commercialization, because private investors at later stages of product development face fewer barriers towards successful commercialization. Other forms of Federal interventions in energy markets may complement the preliminary work done at the R&D stage.
65 Several studies suggest that the return on overall Federal R&D investment is much lower than the return on private-sector R&D, implying relatively high failure rates. See, Terlecyyj, N., “Effects of R&D on the Productivity Growth of Industries: An Exploratory Study” (Washington, DC: National Planning Association, 1974), and Griliches, Z., “Returns to R&D in the Private Sector,” in Kendrick, J. and Vaccara, B. (eds.), “New Developments in Productivity Measurement and Analysis,” NBER [National Bureau of Economic Research] Studies in Income and Wealth No. 44 (Chicago, IL: University of Chicago Press, 1980), pp. 419–454. This result need not be surprising, as the Federal Government’s research portfolio may be much riskier than the private sector’s.
66 One recent study, “Energy Research at DOE [U.S. Department of Energy]: Was It Worth It? Energy and Fossil Energy Research 1978 to 2000,” concluded that: “DOE’s R&D programs in fossil energy and energy efficiency have yielded significant benefits (economic, environmental, and national security-related), important technological options for potential applications in a different (but possible) economic, political and/or environmental setting, and important additions to the stock of engineering and scientific knowledge in a number of fields.” The committee also found that DOE has not employed a consistent methodology for estimating and evaluating the benefits from its R&D programs in these and presumably other areas.” National Research Council Committee on the Benefits of DOE R&D on Energy Efficiency and Fossil Energy, Washington, DC: National Academy Press (2001), p. 5.
Page 42:
In the end, there are no means to determine conclusively whether or not particular Federal energy R&D projects are substitutes or complements for private-sector activities. Moreover, because research is risky, with the prospects of failure an inherent part of the process, the effectiveness of Federal R&D cannot easily be assessed. This report makes no judgments on either of these issues. …
Finally, much of what is defined as energy R&D in the Federal government’s budget accounts is not directly expended on energy research or development. Rather, a portion of the funds are expended on environmental restoration and waste management associated with the byproducts of energy-related research facilities, e.g., nuclear waste disposal.
Page 47: “DOE received an appropriation of $922 million for civilian nuclear R&D in FY 2007 (Table 15). Nearly 40 percent of the appropriation ($350 million) is allocated to the cleanup of contaminated nuclear energy and research sites.”
Page 48:
A substantial portion of Federally-funded nuclear R&D is used for managing and addressing the environmental legacy resulting from past nuclear energy and research activities. Thousands of contaminated areas and buildings exist throughout the United States. The goal of the program is to decommission. Upon completing the clean up of these facilities, DOE’s presence and associated costs will be limited to long-term surveillance and maintenance.
[1220] Report: “Challenges of Electric Power Industry Restructuring for Fuel Suppliers.” U.S. Energy Information Administration, September 1998. <www.eia.gov>
Page 35:
Under the Nuclear Waste Policy Act of 1982, as amended, the U.S. Department of Energy (DOE) is to provide for the ultimate disposal of spent fuel waste. To fund the DOE’s contractual obligations, each nuclear utility pays an ongoing fee, in addition to a one-time payment to cover disposal of fuel utilized prior to April 7, 1983. The annual fee is currently 1 mill per kilowatthour of net electricity generated and sold; it is included in the fuel expenses reported to the Federal Energy Regulatory Commission. Also, owners of nuclear power plants are required by the U.S. Nuclear Regulatory Commission to place funds into an external trust to provide for the cost of decommissioning the radioactive portions of plant and equipment. Thus, the costs incurred to ensure that nuclear waste does not contaminate the environment are included, or “internalized,” in the cost of nuclear power.
[1221] Report: “Federal Financial Interventions and Subsidies in Energy Markets 1999: Primary Energy.” U.S. Energy Information Administration, September 1999. <www.justfacts.com>
Page 3:
Historically, there have been a class of future liabilities characterized by large, but uncertain, future costs for such actions as remediating leaking underground storage tanks, cleaning up oil spills, shutting down retired nuclear power plants, or paying health benefits for coal miners with black lung disease. Policymakers have feared that if private firms were assigned liability for these future costs, they might fail to make adequate current provision today, and then evade the costs in the future through bankruptcy. Alternatively, there might be health or environmental liabilities for which no current responsible party could be identified.
The public policy response to this situation has taken two forms:
The Government assigns liability to private firms, but requires them to make payments into public or private trust funds to assure that funds will be available to meet future liabilities.
The Government assumes legal responsibility for the liability, but levies an excise tax on the products of the industry deemed responsible and accrues the monies into a public trust fund, which is dedicated to meeting future liabilities.
Page 38:
Concerns about the safety, health, and environmental effects of the disposal of nuclear wastes and controversies associated with the siting of nuclear waste disposal facilities led to the assumption of leadership by the Federal Government in developing appropriate facilities. Current efforts are directed primarily at studying the feasibility of a working site at Yucca Mountain in a desert region of Nevada. Since the establishment of the Nuclear Waste Fund in the early 1980s, collections from nuclear utilities have greatly exceeded outlays, resulting in a trust fund balance in excess of $7 billion (nominal dollars) at the end of fiscal year 1998.
Page 40:
These “off-budget” trust funds are fundamentally different from the “on-budget” trust funds described above: the liability for decommissioning expenses continues to lie with the power plant owner, and not with the Federal Government. Thus, the Federal Government has not assumed any new liabilities but merely required the private sector to make arrangements to meet an important future private liability. Consequently, an off-budget trust fund cannot be considered a subsidy, either positive or negative, in a narrow definition of the term. Rather, the fund is Federal intervention that imposes costs on a particular industry. Off-budget approaches represent a method of dealing with the problems of internalizing social costs.
[1222] Report: “Federal Financial Interventions and Subsidies in Energy Markets 2007.” U.S. Energy Information Administration, April 2008. <www.eia.gov>
Page 41:
The results of R&D [research and development] are inherently uncertain. Many programs are intended to advance knowledge across a range of energy and non-energy applications, rather than in the context of a particular fuel or form of consumption. Furthermore, the knowledge obtained may not be of value, in the sense that the research may only reveal technical or economic dead ends to be avoided in the future.65 Thus, only a portion of Federal energy R&D is likely to achieve results in the form of changes in energy production costs or consumption that can be attributed to a specific R&D program. Moreover, to the extent that R&D yields commercial technologies, they are likely to be measurable only years after the funded research effort is initiated.
Federal R&D is intended to support research that the private sector will not undertake. It is not supposed to substitute for private sector R&D. However, the creation of a Federally-funded R&D program could, under some circumstances, displace private-sector R&D. In that case, the Federal program would not produce new knowledge that could not be developed by the private sector, but would simply reduce private R&D costs. It is impossible to know with certainty what R&D private-sector firms would have performed in the hypothetical absence of a Federal program. In general, the less “basic” the R&D program and the more focused on near-term commercialization, the greater the risk that the program will be a substitute for private-sector R&D. As R&D projects approach commercial viability, the justification for government participation lessens.66
Federal government energy-related R&D spending often represents a first stage of Federal intervention in energy markets. The rationale for government intervention in technology development lessens as products approach commercialization, because private investors at later stages of product development face fewer barriers towards successful commercialization. Other forms of Federal interventions in energy markets may complement the preliminary work done at the R&D stage.
65 Several studies suggest that the return on overall Federal R&D investment is much lower than the return on private-sector R&D, implying relatively high failure rates. See, Terlecyyj, N., “Effects of R&D on the Productivity Growth of Industries: An Exploratory Study” (Washington, DC: National Planning Association, 1974), and Griliches, Z., “Returns to R&D in the Private Sector,” in Kendrick, J. and Vaccara, B. (eds.), “New Developments in Productivity Measurement and Analysis,” NBER [National Bureau of Economic Research] Studies in Income and Wealth No. 44 (Chicago, IL: University of Chicago Press, 1980), pp. 419–454. This result need not be surprising, as the Federal Government’s research portfolio may be much riskier than the private sector’s.
66 One recent study, “Energy Research at DOE [U.S. Department of Energy]: Was It Worth It? Energy and Fossil Energy Research 1978 to 2000,” concluded that: “DOE’s R&D programs in fossil energy and energy efficiency have yielded significant benefits (economic, environmental, and national security-related), important technological options for potential applications in a different (but possible) economic, political and/or environmental setting, and important additions to the stock of engineering and scientific knowledge in a number of fields.” The committee also found that DOE has not employed a consistent methodology for estimating and evaluating the benefits from its R&D programs in these and presumably other areas.” National Research Council Committee on the Benefits of DOE R&D on Energy Efficiency and Fossil Energy, Washington, DC: National Academy Press (2001), p. 5.
Page 42:
In the end, there are no means to determine conclusively whether or not particular Federal energy R&D projects are substitutes or complements for private-sector activities. Moreover, because research is risky, with the prospects of failure an inherent part of the process, the effectiveness of Federal R&D cannot easily be assessed. This report makes no judgments on either of these issues. …
Finally, much of what is defined as energy R&D in the Federal government’s budget accounts is not directly expended on energy research or development. Rather, a portion of the funds are expended on environmental restoration and waste management associated with the byproducts of energy-related research facilities, e.g., nuclear waste disposal.
Page 47: “DOE received an appropriation of $922 million for civilian nuclear R&D in FY 2007 (Table 15). Nearly 40 percent of the appropriation ($350 million) is allocated to the cleanup of contaminated nuclear energy and research sites.”
Page 48:
A substantial portion of Federally-funded nuclear R&D is used for managing and addressing the environmental legacy resulting from past nuclear energy and research activities. Thousands of contaminated areas and buildings exist throughout the United States. The goal of the program is to decommission. Upon completing the clean up of these facilities, DOE’s presence and associated costs will be limited to long-term surveillance and maintenance.
[1223] Report: “Federal Energy Subsidies: Direct and Indirect Interventions in Energy Markets.” U.S. Energy Information Administration, November 1992. <www.justfacts.com>
Page x: “The Federal Government has an extensive program of funding energy research and development activities. … To the extent that this Government-supported research can be used by the industries involved, it represents a subsidy to them as they do not have to pay the expense of developing new technologies.”
Page 46:
Coal conversion R&D. Coal conversion covers R&D [research and development] on technologies to convert coal into either petroleum products or synthetic gas. FY 1992 allocations were about $50 million, cut to $38 million in the FY 1993 request. Coal conversion technologies are inherently very high-cost technologies. The United States has a lengthy history of Government-funded efforts to create a synfuels industry.71 This effort has proven the technical possibility of producing synthetic fuels from coal. However, existing technologies are not competitive in current energy markets.72
71 Interested readers can learn about the history of synfuels programs in Richard Vietor, Energy Policy in America Since 1945 (New York, NY: Cambridge University Press, 1984), pp. 44–63 and pp. 163–189. See also Linda Cohen and Roger Noll, The Technology Pork Barrel (Washington, DC: the Brookings Institution, 1991), pp. 259–319.
72 A National Research Council study estimated that coal liquefaction plants, based on future technology developed through current R&D spending, would require oil prices ranging from $30 to $89 per barrel. National Research Council, Fuels to Drive Our Future (Washington, DC: National Academy Press, 1990), pp. 160–161.
[1224] Report: “Direct Federal Financial Interventions and Subsidies in Energy in Fiscal Year 2010.” U.S. Energy Information Administration, July 2011. <www.eia.gov>
Page 11:
Synthetic coal. In FY 2007, the value of this credit for synthetic fuel produced from coal, and biomass, at $3.0 billion, made it the second largest tax expenditure. However under the Code, the credit was available only for synthetic fuel produced from coal and biomass sold up through 2007. Absent the tax credit, none of the 59 coal synthetic plants producing about 140 million tons of coal synfuel in 2007 remained profitable and all ceased production at the end of 2007.
[1225] Report: “Federal Financial Interventions and Subsidies in Energy Markets 1999: Primary Energy.” U.S. Energy Information Administration, September 1999. <www.justfacts.com>
Page 27: “Applied R&D [research and development] is aimed primarily at improving existing technology. Appropriations for applied energy R&D were about $1.5 billion in fiscal year 1999. Of that amount, more than half is allocated to nuclear activities. Within the range of nuclear projects, most of the money is spent on environmental management rather than R&D per se.”
Page 94: “The hydropower R&D focuses on making hydroelectric power plants more compatible with aquatic life and other uses that share water resources.”
[1226] Report: “The Office of Environmental Management Non-Defense Environmental Cleanup.” U.S. Department of Energy, June 18, 2009. <www.energy.gov>
Page 1: “The Department of Energy (DOE) Office of Environmental Management (EM) program nondefense funding is used for the environmental cleanup of multiple sites across the country that comprise the former nuclear weapons development and government-sponsored nuclear energy research complex.”
[1227] Report: “Federal Support for the Development, Production, and Use of Fuels and Energy Technologies.” Congressional Budget Office, November 2015. Updated 6/26/16. <www.cbo.gov>
Page 18:
In general, funding for the early stages of developing new technologies, such as research that provides a better understanding of materials or underlying physical processes, has been more likely to yield benefits in excess of costs than has funding for the commercial demonstration of large integrated systems, such as projects demonstrating technological innovations in the generation of electrical power. Early-stage technology development programs, often in energy efficiency, regularly returned economic benefits that exceeded their costs by substantial amounts. Specifically, DOE [Department of Energy]-funded R&D [research and development] on refrigeration, electronic ballasts for lights, compact fluorescent lights, low-emission windows, and improvements in oil field technology have yielded positive net benefits.33 Not only can federal agencies play a pivotal role in increasing the understanding of physical phenomena that are critical to the development of new technology, they can also serve as the repositories of technical expertise and specialized instruments.
In contrast, many large energy technology demonstration projects undertaken in the 1970s and 1980s produced returns that fell short of their costs. DOE has generally been unsuccessful at lowering costs by funding large demonstration projects, for two reasons. First, federal agencies, including DOE, typically do not have an advantage in lowering production costs.34 In most cases, industrial costs decline only when industries begin producing in substantial volumes, and such costs might even rise with the first few projects. Second, DOE’s handling of large demonstration projects has been questionable in the past; the Government Accountability Office and others have long criticized DOE for poor management of such projects.35
[1228] Article: “Plan Uses Taxes to Fight Climate Change.” By H. Josef Hebert. Associated Press, September 26, 2007. <apnews.com>
Dealing with global warming will be painful, says one of the most powerful Democrats in Congress. To back up his claim he is proposing a recipe many people won’t like—a 50-cent gasoline tax, a carbon tax and scaling back tax breaks for some home owners. …
Dingell says he hasn’t rule out such a so-called “cap-and-trade” system, either, but that at least for now he wants to float what he believes is a better idea. He will propose for discussion: …
– A tax on carbon, at $50 a ton, released from burning coal, petroleum or natural gas. …
A carbon tax would impact everything from the cost of electricity to winter heating and add to the cost of gasoline and other motor fuels.
[1229] Article: “Plan Uses Taxes to Fight Climate Change.” By H. Josef Hebert. Associated Press, September 26, 2007. <apnews.com>
Dealing with global warming will be painful, says one of the most powerful Democrats in Congress. To back up his claim he is proposing a recipe many people won’t like—a 50-cent gasoline tax, a carbon tax and scaling back tax breaks for some home owners. …
Dingell says he hasn’t rule out such a so-called “cap-and-trade” system, either, but that at least for now he wants to float what he believes is a better idea. He will propose for discussion:
– A 50-cent-a-gallon tax on gasoline and jet fuel, phased in over five years, on top of existing taxes.
[1230] Article: “$750 Billion ‘Green’ Investment Could Revive Economy: U.N.” By Alister Doyle. Reuters, March 19, 2009. <www.reuters.com>
“The opportunity must not be lost,” Steiner, head of the U.N. Environment Program (UNEP), told Reuters of a UNEP study….
Steiner also said that the world urgently needed funds to jump start a U.N. deal to fight global warming….
He floated the possibility of taxing oil in rich nations of the Organization for Economic Cooperation and Development (OECD) to help a new pact become the cornerstone of a greener economy.
“If, for argument’s sake, you were to put a five-year levy in OECD countries of $5 a barrel, you would generate $100 billion per annum.”
[1231] Article: “Australia Unveils Sweeping Carbon Plan in Climate Fight.” By Rob Taylor. Reuters, July 10, 2011. <www.reuters.com>
Australia unveiled its most sweeping economic reform in decades on Sunday with a plan to tax carbon emissions from the nation’s worst polluters, reviving hopes of stronger global climate action with the largest emissions trade scheme outside Europe.
Prime Minister Julia Gillard said 500 companies including steel and aluminum manufacturers would pay a A$23 ($24.70) per tonne carbon tax from next year, rising by 2.5 percent a year, moving to a market-based trading scheme in 2015. …
Australia’s scheme will cover 60 percent of carbon pollution apart from exempted agricultural and light vehicle emissions, with Treasury models showing it would boost the consumer price index by 0.7 percent in its first year, in 2012–13 (July–June).
[1232] Article: “Western Lifestyle Unsustainable, Says Climate Expert Rajendra Pachauri.” By James Randerson. Common Dreams, November 29, 2009. <www.commondreams.org>
Ahead of the Copenhagen summit, leading scientist and IPCC [Intergovernmental Panel on Climate Change] chair Rajendra Pachauri warns of radical charges and regulation if global disaster is to be avoided. …
Pachauri also proposed that governments use taxes on aviation to provide heavy subsidies for other forms of transport. “We should make sure there is a huge difference between the cost of flying and taking the train,” he said. Despite the fact that there is often little benefit in time and convenience in short-haul flights, he said people were still making the “irrational” choice to fly. Taxation should be used to discourage them. …
He said that he also believed car use would have to be “curbed”: “I think we can certainly use pricing to regulate the use of private vehicles.” He added he was a supporter of former London mayor Ken Livingstone’s plan to increase the congestion charge to £25 for the most polluting vehicles.
[1233] Report: “Oregon’s Mileage Fee Concept and Road User Fee Pilot Program.” By James M. Whitty. Oregon Department of Transportation, November 2007. <www.myorego.org>
Page vi:
The 2001 Oregon Legislature established the Road User Fee Task Force “to develop a design for revenue collection for Oregon’s roads and highways that could replace the current system for revenue collection.” After considering 28 different funding ideas, the task force recommended that the Oregon Department of Transportation conduct a pilot program to study two strategies called the Oregon Mileage Fee Concept:
(1) Study the feasibility of replacing the gas tax with a mileage-based fee based on miles driven in Oregon and collected at fueling stations; and
(2) Study the feasibility of using this system to collect congestion charges.
Pages 15–16:
Figure 3-1 summarizes in graphic format the technology tested in the pilot program. ODOT [Oregon Department of Transportation] installed on-vehicle devices onto 285 vehicles. The devices allocated the miles driven by participant vehicles in various zones over the period of the field test. The on-vehicle devices sent this data to wireless readers installed at the participating service stations using 2.45 GHz radio frequency (RF) communications signals. A wireless gateway provided vehicle to pump associations and mileage data to the station’s point-of-sale system (POS). Existing data communications wiring provided fuel volume sales data from the pump to the POS system. The POS system provided this data to a central computer system via commercial Digital Subscriber Line (DSL) technology. The central computer calculated and returned the appropriate mileage fee for that vehicle. The POS then deducted the gas tax from the sale and displayed the mileage fee amount on the customer’s receipt along with the gas tax deduction and fuel sales amount.
A GPS [global positioning system] receiver allows the on-vehicle device to determine in which pre-defined zone a participant operates the vehicle. Specific point-to-point trip data about the vehicle’s whereabouts are not transmitted nor stored on the on-vehicle device or any other external data repository (that is, database). The only information collected is the total number of miles driven by zone. The on-vehicle device allocates the mileage readings from the odometer to the appropriate zone. In basic form, the minimum zones include the area within state boundaries and an out-of-Oregon zone. In the field test, an additional zone outlining metropolitan Portland was also tested.
Page 61:
Among the legitimate policies to consider when creating a mileage fee rate structure include energy use, air quality control, climate change response, resource conservation, growth management and traffic demand management, and, of course, fairness in paying for road capacity expansion. The electronic platform developed for the Oregon Concept allows an almost limitless variation of potential rate structures to accommodate whichever policies a legislature desires. The point is that whether a legislature adopts a flat fee rate or a structured rate of some variation will depend on the policies considered at the time.
Page 70: “DSRC Dedicated Short Range Communications. A short to medium range wireless protocol specifically designed for automotive use. It offers communication between the vehicle and roadside equipment. It is a sub-set of the RFID-technology.”
Page 71:
RFID Radio-Frequency Identification. An automatic identification method, relying on storing and remotely retrieving data using devices called RFID tags or transponders. An RFID tag is an object that can be applied to or incorporated into a product, animal, or person for the purpose of identification using radio waves. Some tags can be read from several miles away and beyond the line of sight of the reader.
[1234] Article: “Panel Says US Must Act Now to Curb Global Warming.” By Dina Cappiello. Associated Press, May 12, 2011. <www.sandiegouniontribune.com>
An expert panel asked by Congress to recommend ways to deal with global warming said Thursday that the U.S. should not wait to substantially reduce the pollution responsible and any efforts to delay action would be shortsighted. …
The report released Thursday from a 22-member panel assembled by the National Research Council strongly suggests that the U.S. should be heading in a different direction. …
The best and most economical way to address global warming, the panel concludes, is to put a price on carbon pollution through a tax or a market-based system.
[1235] “Testimony of the Staff of the Joint Committee on Taxation before the Joint Select Committee on Deficit Reduction.” By Thomas A. Barthold. United States Congress, Joint Committee on Taxation, September 22, 2011. <www.jct.gov>
Pages 43–44: “Generally, excise taxes are taxes imposed on a per unit or ad valorem (i.e., percentage of price) basis on the production, importation, or sale of a specific good or service.”
[1236] Report: “Overview of the Federal Tax System.” By David L. Brumbaugh and others. Congressional Research Service, March 10, 2005. <www.everycrsreport.com>
Page 9: “Excise taxes are a form of consumption tax—levies on the consumption of goods and services rather than income. Unlike sales taxes, they apply to particular commodities, rather than to broad categories.”
[1237] Report: “Present Law and Background Information on Federal Excise Taxes.” United States Congress, Joint Committee on Taxation, January 2011. <www.jct.gov>
Page 1: “In addition to excise taxes the primary purpose of which is revenue production, excise taxes also are imposed to promote adherence to other policies (e.g., penalty excise taxes).”
[1238] Report: “Overview of the Federal Tax System.” By David L. Brumbaugh and others. Congressional Research Service, March 10, 2005. <www.everycrsreport.com>
Pages 9–10:
Excise taxes serve a variety of fiscal purposes. Some were enacted simply to raise revenue (for example, the telephone tax and fuel taxes enacted for deficit reduction). The taxes linked with trust funds serve to fund expenditure programs by taxing their beneficiaries, or by taxing those responsible for certain problems addressed by expenditure programs. Some excise taxes adjust for the effects of negative externalities—that is, they seek to ensure that the price of products that produce side-effects like pollution reflects their true cost to society. Other purposes of excise taxes include: adjusting the price of imports to reflect domestic taxes, regulation of certain activities, and regulation of activities thought to be undesirable.
[1239] “Testimony of the Staff of the Joint Committee on Taxation before the Joint Select Committee on Deficit Reduction.” By Thomas A. Barthold. United States Congress, Joint Committee on Taxation, September 22, 2011. <www.jct.gov>
Pages 43–44: “Among the goods and services subject to U.S. excise taxes are motor fuels, alcoholic beverages, tobacco products, firearms, air and ship transportation, certain environmentally hazardous activities and products, coal, telephone communications, certain wagers, and vehicles lacking in fuel efficiency.”
[1240] Report: “Federal Financial Interventions and Subsidies in Energy Markets 1999: Primary Energy.” U.S. Energy Information Administration, September 1999. <www.justfacts.com>
Page 41:
Energy excise taxes are disincentives to the production and consumption of the fuels on which they are levied. Excise taxes increase fuel prices and reduce volumes consumed. Some shift in the relative importance of the various modes of transportation occurs, because the various fuel taxes are applied differentially. Generally, the aggregate and compositional effects on fuel consumption can be greater in the long run as consumers adjust to higher prices and increase their demand for more fuel-efficient technologies. It should also be noted that all State and many local governments levy fuel-specific excise and sales taxes on energy commodities such as gasoline. Many States also levy severance taxes on oil, gas, and coal production.54
[1241] Calculated with data from the report: “Notes to State Motor Fuel Excise and Other Taxes.” American Petroleum Institute, January 1, 2022. <www.api.org>
Page 1: “Regional Gasoline Motor Fuel Taxes (cents per gallon) … Total State … U.S. [=] 38.69 … Total State and Federal … U.S. [=] 57.09”
CALCULATION: 57.09 – 38.69 = 18.4
[1242] Calculated with data from:
a) Dataset: “Table FE-210: Status of the Highway Trust Fund, Fiscal Years 1957–2020.” U.S. Department of Transportation, Federal Highway Administration, November 2021. <www.fhwa.dot.gov>
“Net Income (Thousands of Dollars) … From Excise Taxes … Motor Fuel … Total2 … 2021 Total [=] 35,735,253”
b) Dataset: “Table MF-201: State Motor Fuel Tax Receipts (1963–2020).” U.S. Department of Transportation, Federal Highway Administration, October 2021. <www.fhwa.dot.gov>
“Adjusted Net Total Receipts (Thousands of Dollars) … 2020 [=] 51,020,975”
CALCULATION: $35,735,253,000 federal + $51,020,975,000 state = $86,756,228,000
[1243] Calculated with data from:
a) Report: “July 2022 Monthly Energy Review.” U.S. Energy Information Administration, Office of Energy Statistics, July 26, 2022. <www.eia.gov>
Page 19: “Table 1.7 Primary Energy Consumption, Energy Expenditures, and Carbon Dioxide Emissions Indicators … Energy Expendituresb … Expenditures … Million Nominal Dollarsg … 2020 [=] 1,007,433 … b Expenditures include taxes where data are available.”
b) Report: “State Energy Price and Expenditure Estimates: 1970 Through 2020.” U.S. Energy Information Administration, June 2022. <www.eia.gov>
Page 15: “Table E13. Transportation Sector Energy Expenditure Estimates, 2020 (Million Dollars) … United States … Total Energy [=] 405,453”
CALCULATIONS:
[1244] Report: “The Distribution of Household Income and Federal Taxes, 2008 and 2009.” Congressional Budget Office, July 10, 2012. <www.cbo.gov>
Page 9: “The effect of federal excise taxes, relative to income, is greatest for lower-income households, who tend to spend a large share of their income on such goods as gasoline, alcohol, and tobacco, which are subject to such taxes.”
Pages 23–24:
CBO [Congressional Budget Office] also assumed that the economic cost of excise taxes falls on households according to their consumption of taxed goods (such as tobacco and alcohol). Excise taxes on intermediate goods, which are paid by businesses, were attributed to households in proportion to their overall consumption. CBO assumed that each household spent the same amount on taxed goods as a similar household with comparable income is reported to spend in the Bureau of Labor Statistics’ Consumer Expenditure Survey.
[1245] Book: Basic Economics (15th edition). By Frank V. Mastrianna. Cengage Learning, 2008.
Page 353:
The burden of a tax does not always fall on the person or firm paying the tax. Where it does fall depends on the slopes of the supply and demand curves for the product being taxed. For example, the burden of taxes on cigarettes, liquor, and other consumer goods with very inelastic demands is usually shifted to the final consumer. The tax is paid by the manufacturer or distributor, who, because of the inelastic demand for the product, then adds the amount of the tax to the selling price of the good and passes the burden of the tax on to the consumer.
[1246] Report: “Overview of the Federal Tax System.” By David L. Brumbaugh and others. Congressional Research Service, March 10, 2005. <www.everycrsreport.com>
Page 10:
The burden of excise taxes is thought to fall on consumption and more heavily on individuals with lower incomes. The tax is believed to be usually passed on by producers to consumers in the form of higher prices. And because consumption is a higher proportion of income for lower-income persons than upper-income individuals, excise taxes are usually considered regressive. However, the incidence of excise taxes in particular cases depends on the market conditions, and how consumers and producers respond to price changes. Further, some economists have argued that consideration of the incidence of excise taxes over an individual’s lifetime reduces their apparent regressivity.
[1247] Webpage: “Excise Tax.” Internal Revenue Service. Last reviewed or updated July 29, 2019. <www.irs.gov>
“Excise taxes are taxes paid when purchases are made on a specific good, such as gasoline. Excise taxes are often included in the price of the product.”
[1248] Webpage: “S&P 500.” Standard and Poors. Accessed June 15, 2021 at <www.spglobal.com>
The S&P [Standard & Poors] 500® is widely regarded as the best single gauge of large-cap U.S. equities. According to our Annual Survey of Assets, an estimated USD [U.S. dollars] 13.5 trillion is indexed or benchmarked to the index, with indexed assets comprising approximately USD 5.4 trillion of this total (as of Dec. 31, 2020). The index includes 500 leading companies and covers approximately 80% of available market capitalization.
[1249] Article: “Does Corporate America Need a Tax Cut? Here’s What Every S&P 500 Company Actually Pays in Taxes.” By Philip van Doorn and Katie Marriner. MarketWatch, December 21, 2017. <www.marketwatch.com>
The new MarketWatch Corporate Tax Calculator allows you to look at average income-tax rates for individual S&P [Standard & Poors] 500 companies and for the benchmark index’s 11 sectors.
The effective tax rate for Energy [=] 36.8%
Median tax rate over 11 years
Energy sector [=] 36.8%
S&P 500 [=] 30% …
Companies’ effective income-tax rates can change radically from quarter to quarter and year to year because of major accounting adjustments and events. Some examples are asset write-downs, gains or losses on sales, realization of deferred tax assets and legal settlements. So we used data provided by FactSet to calculate median effective annual income-tax rates based on the past 11 years’ financial statements from companies annual 10-K filings with the Securities and Exchange Commission. If less than five years of data were available for a company, we did not calculate its median tax rate.
For the sector data, FactSet took a further step to smooth out the results, by excluding any companies annual income-tax rates that were above 100% or below 0%.
Another point about the data: the effective income-tax rates include state, local and foreign income taxes paid, if any.
[1250] Letter from Congressional Budget Office Director Douglas W. Elmendorf to U.S. Senator Charles E. Grassley, March 4, 2010. <www.cbo.gov>
Page 2:
The President proposes to assess an annual fee on liabilities of banks, thrifts, bank and thrift holding companies, brokers, and security dealers, as well as U.S. holding companies controlling such entities. …
… However, the ultimate cost of a tax or fee is not necessarily borne by the entity that writes the check to the government. The cost of the proposed fee would ultimately be borne to varying degrees by an institution’s customers, employees, and investors, but the precise incidence among those groups is uncertain. Customers would probably absorb some of the cost in the form of higher borrowing rates and other charges, although competition from financial institutions not subject to the fee would limit the extent to which the cost could be passed through to borrowers. Employees might bear some of the cost by accepting some reduction in their compensation, including income from bonuses, if they did not have better employment opportunities available to them. Investors could bear some of the cost in the form of lower prices of their stock if the fee reduced the institution’s future profits.
[1251] Report: “Reducing the Deficit: Spending and Revenue Options.” Congressional Budget Office, March 2011. <www.cbo.gov>
Page 133: “In addition, households bear the burden of corporate income taxes, although the extent to which they do so as owners of capital, as workers, or as consumers is not clear.”
[1252] Report: “The Distribution of Household Income and Federal Taxes, 2008 and 2009.” Congressional Budget Office, July 10, 2012. <www.cbo.gov>
Pages 16–18:
In previous reports, CBO [Congressional Budget Office] allocated the entire economic burden of the corporate income tax to owners of capital in proportion to their capital income. CBO has reevaluated the research on that topic, and in this report it allocates 75 percent of the federal corporate income tax to capital income and 25 percent to labor income.
The incidence of the corporate income tax is uncertain. In the very short term, corporate shareholders are likely to bear most of the economic burden of the tax; but over the longer term, as capital markets adjust to bring the after-tax returns on different types of capital in line with each other, some portion of the economic burden of the tax is spread among owners of all types of capital. In addition, because the tax reduces capital investment in the United States, it reduces workers’ productivity and wages relative to what they otherwise would be, meaning that at least some portion of the economic burden of the tax over the longer term falls on workers. That reduction in investment probably occurs in part through a reduction in U.S. saving and in part through decisions to invest more savings outside the United States (relative to what would occur in the absence of the U.S. corporate income tax); the larger the decline in saving or outflow of capital, the larger the share of the burden of the corporate income tax that is borne by workers.
CBO recently reviewed several studies that use so-called general-equilibrium models of the economy to determine the long-term incidence of the corporate income tax. The results of those studies are sensitive to assumptions about the values of several key parameters, such as the ease with which capital can move between countries. Using assumptions that reflect the central tendency of published estimates of the key parameters yields an estimate that about 60 percent of the corporate income tax is borne by owners of capital and 40 percent is borne by workers.8
However, standard general-equilibrium models exclude important features of the corporate income tax system that tend to increase the share of the corporate tax borne by corporate shareholders or by capital owners in general.9 For example, standard models generally assume that corporate profits represent the “normal” return on capital (that is, the return that could be obtained from making a risk-free investment). In fact, corporate profits partly represent returns on capital in excess of the normal return, for several reasons: Some corporations possess unique assets such as patents or trademarks; some choose riskier investments that have the potential to provide above-normal returns; and some produce goods or services that face little competition and thereby earn some degree of monopoly profits. Some estimates indicate that less than half of the corporate tax is a tax on the normal return on capital and that the remainder is a tax on such excess returns.10 Taxes on excess returns are probably borne by the owners of the capital that produced those excess returns. Standard models also generally fail to incorporate tax policies that affect corporate finances, such as the preferences afforded to corporate debt under the corporate income tax. Increases in the corporate tax will increase the subsidy afforded to domestic debt, increasing the relative return on debt-financed investment in the United States and drawing new investment from overseas, thus reducing the net amount of capital that flows out of the country. In addition, standard models generally do not account for corporate income taxes in other countries; those taxes also reduce the amount of capital that flows out of this country because of the U.S. corporate income tax.
Those factors imply that workers bear less of the burden of the corporate income tax than is estimated using standard general-equilibrium models, but quantifying the magnitude of the impact of the factors is difficult.
Page 24:
Far less consensus exists about how to allocate corporate income taxes (and taxes on capital income generally). In this analysis, CBO allocated 75 percent of the burden of corporate income taxes to owners of capital in proportion to their income from interest, dividends, adjusted capital gains, and rents. The agency used capital gains scaled to their long-term historical level given the size of the economy and the tax rate that applies to them rather than actual capital gains so as to smooth out large year-to-year variations in the total amount of gains realized. CBO allocated 25 percent of the burden of corporate income taxes to workers in proportion to their labor income.
[1253] In May 2012, Just Facts conducted a search of academic literature to determine the range of scholarly opinion on this subject. The search found that estimates for the portion of corporate income taxes that are borne by owners of capital ranged from nearly 100% down to 33%. Here are two extremes:
a) Report: “An Analysis of the ‘Buffett Rule.’ ” By Thomas L. Hungerford. Congressional Research Service, October 7, 2011. <www.fas.org>
Page 4: “The evidence suggests that most or all of the burden of the corporate income tax falls on owners of capital.”
b) Working paper: “International Burdens of the Corporate Income Tax.” By William C. Randolph. Congressional Budget Office, August, 2006. <www.cbo.gov>
Pages 51–52: “In the base case (Table 3), the model used in this study predicts that domestic labor bears 74 percent, domestic capital owners bear 33 percent, foreign capital owners bear 72 percent, foreign labor bears –71 percent, and the excess burden equals about 4 percent of the revenue.”
[1254] Report: “Federal Energy Subsidies: Direct and Indirect Interventions in Energy Markets.” U.S. Energy Information Administration, November 1992. <www.justfacts.com>
Page 3:
The issue of subsidy in energy policy analysis extends beyond consideration of actions involving some form of financial commitment by the Federal Government. Subsidy-like effects flow from the imposition of a range of regulations imposed by Government on energy markets. Regulations may directly subsidize a fuel by mandating a specified level of consumption, thereby creating a market which might not otherwise exist. The imposition of oxygenate requirements for gasoline in the winter of 1992, which stimulates demand for alcohol-based additives, is a recent example. Regulations more often explicitly penalize rather than subsidize the targeted fuel. To the extent that regulations on coal emissions raise costs of coal use, the competitive opportunities for alternatives, including renewables, natural gas, and conservation, are enhanced. The additional costs that influence the consumption of coal versus other fuels do not require any exchange of money between the Government and buyers and sellers of energy. However, this in no way diminishes the policy’s potential impact on resource allocation and relative prices of energy products.
Page 8:
Regulation is the most consequential form of Federal intervention in the energy industries. Published estimates of the annual cost of an ad hoc collection of major energy regulations suggest an annual cost of compliance to firms well in excess of the cost of direct and indirect subsidies. Many of these interventions are designed to yield environmental benefits.
Page 70:
The regulation of energy markets can have the same consequences for energy prices, production, and consumption as the direct payment of a cash subsidy or the imposition of a tax. For example, in the case of limiting the emissions from combustion of fossil fuels, the Government has the choice of taxing emissions to the degree necessary to reduce them to a mandated level in the economic interest of the fuel user; or, the Government can impose restrictions that prohibit emissions above a mandated level. In either case the Government action leads to a reduction in emissions to a given level and an increase in the cost of energy consumed.
Accordingly, energy market regulation can serve the same purposes and yield the same results as taxes and subsidies. Regulation is a particular kind of market intervention, among many kinds of market interventions, that the Government might select to pursue a specific social goal. Unlike most of the Government programs discussed in the other chapters of this report, Government regulation usually (although not always) increases the costs of the energy industry to which it is directed. However, from the perspective of the concept of subsidy, per se, if a given regulation works to the disadvantage of one energy industry, then it works to the advantage of competitors of that industry. Indeed, if there is significant environmental harm or damage as a consequence of energy consumption, it could be argued that the failure to regulate is a subsidy of the polluting fuel.124 As a result, regulation stands in principle as another way in which the Government can intervene in energy markets to accomplish the same ends that it might otherwise accomplish through direct subsidies and/or taxation.
There are so many Government regulations concerning energy that it is difficult to identify and analyze all of them. Only a small sample of regulations are discussed here. The overriding consideration for selection of the programs listed here is actual or potential significance from the standpoint of the cost of compliance with the regulation. Cost implications reported are those developed and reported in other publications. Only Federal regulations have been examined. As a result, State and local regulations are not included.
[1255] “Small Hydropower Technology: Summary Report on a Summit Meeting Convened by Oak Ridge National Laboratory, the National Hydropower Association, and the Hydropower Research Foundation.” Oak Ridge National Laboratory, April 7–8, 2010. <www.hydro.org>
Pages 4–5:
Among the issues faced by owners and operators of small hydro projects are financing, operating, regulatory, labor, and development costs. …
Financing – The issues in successful financing and power sales contracts are important to the successful implementation of new small hydropower projects and technologies. Lenders focus on environmental issues (permitting), site control, hydrology studies, regulatory/legal, technology, construction completion risks, the revenue model, the operations plan, and the quality of the management team.
The primary challenge for hydropower financing is the long development timeline and uncertainty about requirements of the permitting process. Uncertainty in the permitting process affects developers, power purchasers, and lenders in a circular manner because each entity needs assurances to enter into new ventures and agreements. …
Lenders are very risk averse; if a lender has to take risks, then the financing rates will be higher. …
Regulatory – Regulatory costs have increased six times over the past thirty years. They have gone from 5% to 25–30% of the total costs and include licensing, post-licensing, relicensing, environmental, and Section 401 (Clean Water Act water quality certification) mandates. Section 401 is widely interpreted by individual States on a case-by-case basis, which increases the uncertainty and regulatory costs for each project. The permitting processes should be examined to determine the conditions that cause them to be so complicated and lengthy.
[1256] Webpage: “Large-Scale Hydropower Basics.” U.S. Energy Information Administration, Office of Energy Efficiency & Renewable Energy. Last updated April 14, 2013. <energy.gov>
“As a result of increased environmental regulation, the National Hydropower Association forecasts a decline in large-scale hydropower use through 2020.”
[1257] Article: “Legal Perspectives on Dam Removal.” By Margaret B. Bowman. BioScience, August 2002. Pages 739–747. <academic.oup.com>
Page 740:
Hydropower dam regulation. Another regulatory arena that has resulted in dam removals is the regulation of hydropower dams by the Federal Energy Regulatory Commission (FERC) pursuant to the Federal Power Act (US Code, title 16, sec. 791 et seq.)…. Eleven FERC-regulated dams have been removed since 1963 (Emery 2001), with more than 25 currently under consideration.
There are three regulatory avenues for FERC involvement in a dam removal: (1) dam relicensing, (2) dam safety inspections, and (3) the surrender of a dam’s operating license.
NOTE: The subsequent paragraphs in this article provide further detail on these regulatory avenues.
[1258] Article: “BPA Curtails Wind Power Generators During High Hydropower Conditions.” U.S. Energy Information Administration, June 15, 2011. <www.eia.gov>
Dam operators have regulatory limits on how much water they can “spill” over a dam. Spilling churns air into the water and increases the concentration of dissolved nitrogen, which can give fish gas bubble disease (like the bends). Since many of these fish are protected under the Endangered Species Act, as much water as possible is brought through the turbines to generate electricity, avoiding contact with air.
BPA [Bonneville Power Administration] in its role as electric system operator must balance electric supply with demand, so overnight, when demand for electric power is low, BPA must decrease generation. BPA curtails hydropower generation as far as it can, but is constrained by regulations limiting how much water can be spilled over the dams. To further reduce the electricity supplied, BPA curtails generation from wind generators.
Periods where wind generation has been reduced are highlighted on the chart. Curtailing wind generators reduces the production tax credit the wind plant operators would otherwise receive as renewable power generators (since the credit is a function of their generation).
[1259] Article: “Why Are Diesel Fuel Prices Higher Than Gasoline Prices?” U.S. Energy Information Administration. Last updated March 8, 2018. <www.eia.gov>
On-highway diesel fuel prices have been higher than regular grade gasoline prices, on a dollar per gallon basis, almost continuously since September 2004. This trend is a break from the previous historical pattern of diesel fuel prices usually being lower than gasoline prices except in cold winters when demand for heating oil pushed diesel fuel prices higher. There are three main reasons why diesel fuel prices have been higher than regular gasoline prices in recent years:
• Demand for diesel fuel and other distillate fuel oils has been relatively high, especially in Europe, China, India, and the United States.
• the transition to less polluting, lower-sulfur diesel fuels in the United States affected diesel fuel production and distribution costs.
• the federal excise tax for on-highway diesel fuel of 24.3 cents per gallon is 6 cents per gallon higher than the federal excise tax on gasoline.
[1260] Report: “Germany 2020 Energy Policy Review.” International Energy Agency, February 2020. <iea.blob.core.windows.net>
Pages 124–125:
Coal is the major source of electricity produced in Germany, with 38% of total generation in 2018. However, its share is declining, down from close to 50% a decade earlier (Figure 7.3). Furthermore, nuclear power has been reduced by almost half in a decade, mainly replaced by the increased use of renewable energy sources, strongly supported by feed-in tariffs (FiTs). The share of renewable energy grew from 15% in 2008 to 35% in 2018. In particular, wind power has been growing exponentially, and more than doubled its production in the last five years. In addition, solar power and bioenergy have increased significantly in the last decade.
The energy transition will continue to impact Germany’s electricity generation for decades. As the government plans to shut down all nuclear facilities by the end of 2022 and all coal plants by 2038, the power sector’s trajectory will continue to be dominated by growth in renewable energy.
[1261] Article: “Germany’s Renewables Electricity Generation Grows in 2015, but Coal Still Dominant.” By Sara Hoff. U.S. Energy Information Administration, May 24, 2016. <www.eia.gov>
Germany’s Energiewende, or energy transition policy, focuses on renewable energy and sustainable development. Energiewende goals include eliminating nonrenewable energy sources from Germany’s energy portfolio, phasing out nuclear power generation, reducing dependence on energy imports, and lowering carbon emissions. Official goals call for greenhouse gas reductions to 80% to 95% of 1990 levels by 2050 and a gradual phase-out of nuclear power by 2022. …
The German government has supported renewable electricity growth by promising a fixed, above-market price for every kilowatthour of energy generated by solar PV [photovoltaic] or wind and delivered to the grid, a policy known as a feed-in tariff. By law, these renewable sources have priority over traditional generation, meaning that other forms of generation must be curtailed to accommodate fluctuations in renewable electricity generation.
[1262] Article: “European Residential Electricity Prices Increasing Faster Than Prices in the United States.” By Cara Marcy and Alexander Metelitsa. U.S. Energy Information Administration, November 18, 2014. <www.eia.gov>
In Germany, where taxes and levies account for about half of retail electricity prices, transmission system operators charge residential consumers a renewable energy levy that is used to subsidize certain renewable generation facilities. … In addition, Germany committed to reducing the number of operating nuclear energy plants in the country and introduced policy incentives to reduce electricity generation from coal. Replacing these existing facilities and their fuels with new generation sources has also increased their electricity cost.
[1263] Calculated with data from the webpage: “Production: Gross Electricity Production in Germany.” Federal Statistical Office of Germany. Accessed September 9, 2022 at <www.destatis.de>
“Gross electricity production1 in Germany from 2019 to 2021 … Energy sources … 20212 … % … Wind power [=] 23.3 … Photovoltaic energy [=] 8.7% … 2 Provisional data.”
CALCULATION: 23.3% + 8.7% = 32.0%
[1264] Calculated with data from the report: “Electric Power Monthly with Data for January 2022.” U.S. Energy Information Administration, Office of Energy Statistics, March 24, 2022. <www.eia.gov>
Page 17 (of PDF): “Table 1.1. Net Generation by Energy Source: Total (All Sectors), 2012–January 2022 (Thousand Megawatthours) … Total Generation … 2021 [=] 4,115,540”
Page 18 (of PDF): “Table 1.1.A. Net Generation from Renewable Sources: Total (All Sectors), 2012–January 2022 (Thousand Megawatthours) … 2021 … Wind [=] 379,767 … Estimated Total Solar [=] 163,703”
CALCULATION: (379,767,000 wind + 163,703,000 solar) / 4,115,540,000 total = 13.2%
[1265] Calculated with data from:
a) Dataset: “Electricity Prices for Household Consumers, All Taxes and Levies Included (Euros Per Kilowatthour) Bi-Annual Data (From 2007 Onwards).” Eurostat. Last updated June 27, 2022. <appsso.eurostat.ec.europa.eu>
“Germany … 2021S1 [=] 0.3193 … 2021S2 [=] 0.3234”
b) Report: “Electric Power Monthly with Data for January 2022.” U.S. Energy Information Administration, Office of Energy Statistics, March 24, 2022. <www.eia.gov>
Page 133 (of PDF): “Table 5.3. Average Price of Electricity to Ultimate Customers: Total by End-Use Sector, 2012–January 2022 (Cents per Kilowatthour) … Residential … 2021 [=] 13.72
c) Dataset: “Purchasing Power Parities (PPP): Total, National Currency Units/U.S. Dollar, 2000–2021.” Organization for Economic Cooperation and Development. Accessed September 12, 2022 at <data.oecd.org>
“Purchasing power parities (PPPs) are the rates of currency conversion that try to equalise the purchasing power of different currencies, by eliminating the differences in price levels between countries. … 2021 … Germany [=] 0.741 … United States [=] 1.000
CALCULATIONS:
[1266] Report: “Germany 2020 Energy Policy Review.” International Energy Agency, February 2020. <iea.blob.core.windows.net>
Page 127:
Germany’s consumers pay among the highest electricity prices in the IEA [International Energy Agency], mostly because of levies, charges and taxes, including levies to pay for renewables subsidies. The country ranked third among IEA member countries in terms of industry electricity prices in 2018 (Figure 7.7), though energy-intensive industries receive significant price relief. Taxes account for 48% of total industry prices, which is the highest among IEA members. The total electricity price that households paid, of which about half consist of public charges, ranked second after Denmark. End-use prices in Germany are not regulated. Compared with several neighbouring IEA countries, the price of electricity in Germany has risen the most in the past decade (Figure 7.8).
[1267] Article: “Germany’s Renewables Electricity Generation Grows in 2015, but Coal Still Dominant.” By Sara Hoff. U.S. Energy Information Administration, May 24, 2016. <www.eia.gov>
[R]esidential retail prices have risen and are expected to continue to increase because of higher taxes and fees charged to consumers. For instance, one surcharge for renewable electricity increased from 8.8% of the residential electricity price in 2010 to 17% in 2013. Taxes and surcharges make up about half of the average residential electricity rate, and tariffs account for the remainder. In 2014, the average sales-weighted retail price for residential consumption in Germany was about 35 cents/kWh, while the average residential retail price in the United States was about 13 cents/kWh.
[1268] Article: “Rising Energy Costs Drive Up Forest Thievery.” By Von Renuka Rayasam. Der Spiegel International, January 17, 2013. <www.spiegel.de>
The Germany’s Renters Association estimates the heating costs will go up 22 percent this winter alone. A side effect is an increasing number of people turning to wood-burning stoves for warmth. …. The number of Germans buying heating devices that burn wood and coal has grown steadily since 2005, according to consumer research group GfK Group.
That increase in demand has now also boosted prices for wood, leading many to fuel their fires with theft. …
About 10 percent of the firewood that comes out of Brandenburg’s forest every year is stolen, resulting in losses of about €500,000, Rosenthal [head of Brandenburg’s forest farmers association] estimates.
[1269] Article: “A Ladder, Wood Theft, and Sustainability.” By Klas Sander, Tuukka Castren, and Valerie Hickey. World Bank, April 18, 2013. <blogs.worldbank.org>
[H]ouseholds are increasingly using wood to heat their homes. … This time, it is Germany, where the residential use of woodfuel reportedly increased by almost 300% between 2000 and 2010, translating into total wood volumes of 33 million m3 in 2010. In fact, across the EU [European Union], the use of wood for energy in private households remains the most important sector for wood consumption….
In Germany, heating costs rose by an estimated 22% for some households. … Similar narratives emerge from other countries across Europe, where the increased use of wood for energy is also linked to high energy prices.
The situation in Europe highlights that the sustainability of forest management and legality of forest use cannot be taken for granted, even in OECD [Organization for Economic Cooperation and Development] countries…. It also underscores the importance of designing and implementing forest laws and regulations that take into account both the needs and priorities of local people and the incentive system (prices for example) that guides people’s behavior.
[1270] Article: “Now the Energy Transition Is Becoming a Danger for All of Germany.” By Daniel Wetzel. Welt, March 31, 2021. <www.welt.de>
The Federal Audit Office has accused the Federal Ministry of Economics of inadequately controlling the energy transition and inadequately managing it. …
“The Federal Audit Office sees the danger that the energy transition in this form will endanger Germany as a business location and overwhelm the financial strength of electricity-consuming companies and private households,” warned Scheller when presenting the special report: “This can ultimately jeopardize social acceptance of the energy transition.” …
It is “not realistic to assume that the expansion targets for renewable energies will be achieved under the currently difficult acceptance conditions, especially for wind energy projects.” …
The assumptions of the Ministry of Economic Affairs regarding security of supply for electricity are “partly too optimistic and partly implausible,” criticize the auditors. …
“The Federal Audit Office maintains that essential assumptions on which the current assessment of the security of supply on the electricity market is based are unrealistic or outdated,” says the conclusion of the special report.
[1271] Article: “Germany’s Energy Drive Criticized Over Expense, Risks.” By Markus Wacket. Reuters, March 30, 2021. <www.reuters.com>
Germany’s energy transition has proved too costly and underestimated the risks to supply, a federal audit office report seen by Reuters has found. …
“There is a risk of losing Germany’s competitiveness and acceptance of the energy transition,” the report said. …
The audit office also warned of a looming energy supply shortfall as utilities prepare to turn off the last of their nuclear reactors and the government spurs a pullout from coal. There is likely be a shortfall of 4.5 gigawatts (GW), equivalent to 10 large coal-to-power generation plants, on the power grid between 2022 and 2025, the audit office report said.
The report said the economy ministry’s approach has been “too optimistic and (its assumptions) partly implausible” and had tip-toed around addressing the worst-case scenarios, a view echoed by grid operators.
[1272] Article: “Renewable Energy Boom Risks More Blackouts Without Adequate Investment in Grid Reliability.” By Michael Shellenberger. Forbes, April 20, 2021. <www.forbes.com>
Federal auditors in Germany raised the same concerns about weather-dependent renewables as California’s electricity grid operator raised last summer. The auditors called the assumptions made by the Ministry of Economic Affairs regarding the security of electricity supply as “partly too optimistic and partly implausible.”
And, in their recent report, federal auditors concluded that Germany would need to spend over $600 billion between 2020 to 2025, including on grid updates. “The Federal Audit Office sees the danger that the energy transition will endanger Germany as a business location,” they wrote.
[1273] “An Interview with Sen. Barack Obama.” San Francisco Chronicle, January 17, 2008. <www.sfgate.com>
Time marker 21:55:
Let me sort of describe my overall policy. What I’ve said is that we would put a cap-and-trade system in place that is as aggressive, if not more aggressive, than anybody else’s out there.
I was the first to call for a 100% auction on the cap and trade system, which means that every unit of carbon or greenhouse gases emitted would be charged to the polluter. That will create a market in which whatever technologies are out there that are being presented, whatever power plants that are being built, that they would have to meet the rigors of that market and the ratcheted down caps that are placed, imposed every year.
So if somebody wants to build a coal-powered plant, they can. It’s just that it will bankrupt them because they’re gonna to be charged a huge sum for all that greenhouse gas that’s being emitted. That will also generate billions of dollars that we can invest in solar, wind, biodiesel, and other alternative energy approaches.
The only thing that I’ve said with respect to coal, I haven’t been some coal booster. What I have said is that for us that for us to take coal off the table as a ideological matter, as opposed to saying if technology allows us to use coal in a clean way, we should pursue it. That I think is the right approach.
The same with respect to nuclear. Right now, we don’t know how to store nuclear waste wisely, and we don’t know how to deal with some of the safety issues that remain. And so it’s wildly expensive to pursue nuclear energy. But I tell you what, if we could figure out how to store it safely, then I think most of us would say that might be a pretty good deal.
The point is, if we set rigorous standards for the allowable emissions, then we can allow the market to determine and technology and entrepreneurs to pursue, what’s the best approach is to take, as opposed to us saying at the outset, here are the winners that we’re picking, and maybe we pick wrong and maybe we pick right.
Time marker 8:50:
The problem is not technical. The problem is not sufficient mastery of the legislative intricacies of Washington. The problem is, can you get the American people to say this is really important and force their representatives to do the right thing? That requires mobilizing a citizenry. That requires them understanding what is at stake.
Climate change is a great example. You know, when I was asked earlier about the issue of coal, under my plan of a cap-and-trade system, electricity rates would necessarily skyrocket, regardless of what I say about whether coal is good or bad, because I’m capping greenhouse gasses: coal power plants, natural gas, you name it, whatever the plants were, whatever the industry was, they would have to retrofit their operations. That will cost money. They will pass that money on to consumers.
You can already see what the arguments are going to be during the general election. People will say, “Ah, Obama and Al Gore, these folks, they’re going to destroy the economy. This is going to cost us eight trillion dollars,” or whatever their number is. If you can’t persuade the American people that, yes, there is going to be some increase in electricity rates on the front end, but that over the long-term, because of combinations of more efficient energy usage and changing light bulbs and more efficient appliances, but also technology improving how we can produce clean energy, that the economy will benefit.
If we can’t make that argument persuasively enough, you can be Lyndon Johnson—you can be the master of Washington—you’re not going to get that done.
[1274] Report: “Greenhouse Gas Legislation: Summary and Analysis of H.R. 2454 as Passed by the House of Representatives.” By Mark Holt and Gene Whitney. Congressional Research Service, July 27, 2009. <www.everycrsreport.com>
Page 77: “Title III—Reducing Global Warming Pollution”
Page 6:
As passed, Title III of H.R. 2454 would amend the Clean Air Act to set up a cap-and-trade system that is designed to reduce greenhouse gas (GHG) emissions from covered entities 17% below 2005 levels by 2020 and 83% below 2005 levels by 2050. Covered entities are phased into the program over a four-year period from 2012 to 2016. When the phase-in schedule is complete, the cap will apply to entities that account for 84.5% of U.S. total GHG emissions.
Page 83:
When the phase-in schedule concludes (in 2016), and all of the covered entities are subject to the cap, approximately 85% of the U.S. GHG emissions would be covered. Although this section does not specifically exclude specific emission sources, certain sources do not meet any of the definitions or thresholds. … These uncapped sources include: agricultural emissions, residential emissions, commercial buildings, and stationary sources that emit less than 25,000 tons/year.
[1275] Calculated with data from vote 477: “H.R. 2454 – American Clean Energy and Security Act of 2009.” 111th U.S. Congress, House of Representatives, June 26, 2009. <clerk.house.gov>
|
House |
||||||
|
Party |
Voted “Yes” |
Voted “No” |
Voted “Present” or Did Not Vote † |
|||
|
Number |
Portion |
Number |
Portion |
Number |
Portion |
|
|
Republican |
8 |
4% |
168 |
94% |
2 |
1% |
|
Democrat |
211 |
82% |
44 |
17% |
1 |
0% |
|
Independent |
0 |
0% |
0 |
0% |
0 |
0% |
|
NOTE: † Voting “Present” is effectively the same as not voting. |
||||||
[1276] Webpage: “H.R.2454 – American Clean Energy and Security Act of 2009.” 111th Congress (2009–2010). Accessed June 4, 2018 at <www.congress.gov>
“Latest Action: Senate – 07/07/2009 Read the second time. Placed on Senate Legislative Calendar under General Orders. Calendar No. 97.”
[1277] Webpage: “Endangerment and Cause or Contribute Findings for Greenhouse Gases Under Section 202(a) of the Clean Air Act.” United States Environmental Protection Agency. Last updated April 25, 2022. <www.epa.gov>
On December 7, 2009, the Administrator signed two distinct findings regarding greenhouse gases under section 202(a) of the Clean Air Act:
• Endangerment Finding: The Administrator finds that the current and projected concentrations of the six key well-mixed greenhouse gases—carbon dioxide (CO2), methane (CH4), nitrous oxide (N2O), hydrofluorocarbons (HFCs), perfluorocarbons (PFCs), and sulfur hexafluoride (SF6)—in the atmosphere threaten the public health and welfare of current and future generations.
• Cause or Contribute Finding: The Administrator finds that the combined emissions of these well-mixed greenhouse gases from new motor vehicles and new motor vehicle engines contribute to the greenhouse gas pollution that threatens public health and welfare.
These findings do not themselves impose any requirements on industry or other entities. However, this action was a prerequisite for implementing greenhouse gas emissions standards for vehicles and other sectors.
[1278] Article: “Greenhouse Gases Imperil Health, E.P.A. Announces.” By John M. Broder. New York Times, December 8, 2009. <www.nytimes.com>
“The Environmental Protection Agency [EPA] on Monday issued a final ruling that greenhouse gases posed a danger to human health and the environment, paving the way for regulation of carbon dioxide emissions from vehicles, power plants, factories, refineries and other major sources.”
[1279] Article: “Measuring Cost on Climate Change.” By Erica Martinson. Politico, July 16, 2013. <www.politico.com>
Critics in Congress are turning up the heat on the Obama Administration’s decision to quietly push through a regulatory change that makes it easier to justify the costs of new greenhouse gas rules. …
The debate concerns the social cost of carbon, or SCC, a measure of the cost imposed on society by each metric ton of greenhouse gas pollution—and a crucial number for weighing the benefits of climate regulations. …
The administration revealed the change in the quietest way possible, outlining the new cost estimate on Page 409 of Appendix 16A of a technical support document for an Energy Department regulation on microwave ovens.
[1280] Article: “Petition Asks OMB [Office of Management and Budget] to Withdraw Figure on Social Cost of Carbon, Use Open Analysis.” By Andrew Childers. Bloomberg BNA, September 10, 2013. <www.bna.com>
Seven industry and business groups have petitioned the White House to withdraw its figure on the social cost of carbon and repeat its analysis through a publicly transparent process. …
A federal interagency working group in May increased the social cost of carbon figure that federal agencies will use to evaluate the climate change impact of their actions to $38 per metric ton at a 3 percent discount rate in 2007 dollars for the year 2015. That is up from the previous estimate of nearly $24 per ton that was issued in 2010.
[1281] Webpage: “The Executive Branch.” White House. Accessed February 1, 2013 at <www.whitehouse.gov>
Under Article II of the Constitution, the President is responsible for the execution and enforcement of the laws created by Congress. Fifteen executive departments—each led by an appointed member of the President’s Cabinet—carry out the day-to-day administration of the federal government. They are joined in this by other executive agencies such as the CIA [Central Intelligence Agency] and Environmental Protection Agency, the heads of which are not part of the Cabinet, but who are under the full authority of the President. The President also appoints the heads of more than 50 independent federal commissions, such as the Federal Reserve Board or the Securities and Exchange Commission, as well as federal judges, ambassadors, and other federal offices. The Executive Office of the President (EOP) consists of the immediate staff to the President, along with entities such as the Office of Management and Budget and the Office of the United States Trade Representative.
[1282] Calculated with data from:
a) Report: “Annual Energy Outlook 2013 with Projections to 2040.” U.S. Energy Information Administration, April 2013. <www.osti.gov>
Page 217: “No GHG Concern No GHG [greenhouse gas] emissions reduction policy is enacted, and market investment decisions are not altered in anticipation of such a policy. … GHG25 Applies a price for CO2 emissions throughout the economy, starting at $25 per metric ton in 2014 and rising by 5 percent per year through 2040”
Page 222: “The seven alternative GHG cases are used to provide a range of potential outcomes, from no concern about future GHG legislation to the imposition of a specific economy-wide carbon emissions price, as well as an examination of the impact of a combination of specific economy-wide carbon emissions prices and low natural gas prices.”
b) Dataset: “Total Energy Supply, Disposition, and Price Summary.” Accessed October 14, 2013 at <www.eia.gov>
c) Dataset: “Petroleum Product Prices (2011 dollars per gallon, unless otherwise noted).” Accessed October 14, 2013 at <www.eia.gov>
NOTE: Excel files containing the data and calculations are available upon request.
[1283] Webpage: “Affordable Clean Energy Rule.” U.S. Environmental Protection Agency. Last updated April 4, 2022. <www.epa.gov>
On June 19, 2019, EPA [U.S. Environmental Protection Agency] issued the final Affordable Clean Energy rule (ACE)—replacing the prior administration’s overreaching Clean Power Plan with a rule that restores rule of law, empowers states, and supports energy diversity. The ACE rule establishes emission guidelines for states to use when developing plans to limit carbon dioxide (CO2) at their coal-fired electric generating units (EGUs). In this notice, EPA also repealed the CPP [Clean Power Plan], and issued new implementing regulations for ACE and future rules under section 111(d).
[1284] Report: “Overview of the Clean Power Plan.” U.S. Environmental Protection Agency. Last updated May 9, 2017. <archive.epa.gov>
On August 3, President Obama and EPA [U.S. Environmental Protection Agency] announced the Clean Power Plan – a historic and important step in reducing carbon pollution from power plants that takes real action on climate change. … With strong but achievable standards for power plants, and customized goals for states to cut the carbon pollution that is driving climate change, the Clean Power Plan provides national consistency, accountability and a level playing field while reflecting each state’s energy mix. …
The Clean Power Plan will reduce carbon pollution from power plants, the nation’s largest source, while maintaining energy reliability and affordability.
[1285] Webpage: “Affordable Clean Energy Rule.” U.S. Environmental Protection Agency. Last updated April 4, 2022. <www.epa.gov>
On June 19, 2019, EPA [U.S. Environmental Protection Agency] issued the final Affordable Clean Energy rule (ACE)—replacing the prior administration’s overreaching Clean Power Plan with a rule that restores rule of law, empowers states, and supports energy diversity. The ACE rule establishes emission guidelines for states to use when developing plans to limit carbon dioxide (CO2) at their coal-fired electric generating units (EGUs). In this notice, EPA also repealed the CPP [Clean Power Plan], and issued new implementing regulations for ACE and future rules under section 111(d).
On January 19, 2021, the D.C. Circuit vacated the Affordable Clean Energy rule and remanded to the Environmental Protection Agency for further proceedings consistent with its opinion.
[1286] Memorandum: “Status of Affordable Clean Energy Rule and Clean Power Plan.” U.S. Environmental Protection Agency, February 12, 2021. <www.epa.gov>
On January 19, 2021, the D.C. Circuit vacated the Affordable Clean Energy (ACE) rule and remanded to the Environmental Protection Agency (EPA) for further proceedings consistent with its opinion.1 Since then, EPA Regional staff have received requests from multiple states seeking clarity regarding their obligations in light of the court decision. The purpose of this memo is to provide EPA Regional staff with information so they can respond to those requests regarding EPA’s view that the court’s opinion did not result in any obligation for states to submit Clean Air Act (CAA) section 111(d) State Plans under the Clean Power Plan (CPP),2 nor do states have any obligations under the now-vacated ACE rule.3
The court’s decision vacated the ACE rule, including its requirements that states submit State Plans by July 8, 2022. Because the court vacated ACE and did not expressly reinstate the CPP, EPA understands the decision as leaving neither of those rules, and thus no CAA section 111(d) regulation, in place with respect to greenhouse gas (GHG) emissions from electric generating units (EGUs). As a practical matter, the reinstatement of the CPP would not make sense. The deadline for states to submit State Plans under the CPP has already passed4 and, in any event, ongoing changes in electricity generation mean that the emission reduction goals that the CPP set for 2030 have already been achieved.5 Therefore, EPA does not expect states to take any further action to develop and submit plans under CAA section 111(d) with respect to GHG emissions from EGUs at this time.
1 Am. Lung Ass’n v. EPA, 2021 WL 162579 (D.C. Cir. Jan. 19, 2021).
2 80 Fed. Reg. 64,662 (Oct. 23, 2015).
3 84 Fed. Reg. 32,520 (July 8, 2019).
4 Under the CPP, states were required to submit their State Plans no later than September 6, 2018. 80 Fed. Reg. at 64,828.
5 See “Regulatory Impact Analysis for the Repeal of the Clean Power Plan, and the Emission Guidelines for Greenhouse Gas Emissions from Existing Electric Utility Generating Units,” EPA-452/R-19-003 (June 2019), at 2-14 to 2-15. We note further that none of the parties in the ACE litigation sought reinstatement of the CPP.
[1287] Ruling: American Lung Association v. EPA. United States Court of Appeals, District of Columbia Circuit, January 19, 2021. <www.cadc.uscourts.gov>
Page 147:
Because the ACE [Affordable Clean Energy] Rule rests squarely on the erroneous legal premise that the statutory text expressly foreclosed consideration of measures other than those that apply at and to the individual source, we conclude that the EPA [U.S. Environmental Protection Agency] fundamentally “has misconceived the law,” such that its conclusion “may not stand.” … Accordingly, we hold that the ACE Rule must be vacated and remanded to the EPA so that the Agency may “consider the question afresh in light of the ambiguity we see.” …
Because promulgation of the ACE Rule and its embedded repeal of the Clean Power Plan rested critically on a mistaken reading of the Clean Air Act, we vacate the ACE Rule and remand to the Agency. We also vacate the amendments to the implementing regulations that extend the compliance timeline. Because the objections of the Coal Petitioners are without merit, we deny their petitions. And because the Robinson Petitioners lack standing, their petition is dismissed.
[1288] Ruling: West Virginia v. EPA. U.S. Supreme Court, June 30, 2022. Decided 6–3. Majority: Roberts, Thomas, Alito, Gorsuch, Kavanaugh, Barrett. Concurrence: Gorsuch. Dissenting: Sotomayor, Kagan, Jackson. <www.law.cornell.edu>
Majority:
Thus, in certain extraordinary cases, both separation of powers principles and a practical understanding of legislative intent make us “reluctant to read into ambiguous statutory text” the delegation claimed to be lurking there. … To convince us otherwise, something more than a merely plausible textual basis for the agency action is necessary. The agency instead must point to “clear congressional authorization” for the power it claims. …
[T]he only interpretive question before us, and the only one we answer, is more narrow: whether the “best system of emission reduction” identified by EPA [U.S. Environmental Protection Agency] in the Clean Power Plan was within the authority granted to the Agency in Section 111(d) of the Clean Air Act. For the reasons given, the answer is no.5
Capping carbon dioxide emissions at a level that will force a nationwide transition away from the use of coal to generate electricity may be a sensible “solution to the crisis of the day.” … But it is not plausible that Congress gave EPA the authority to adopt on its own such a regulatory scheme in Section 111(d). A decision of such magnitude and consequence rests with Congress itself, or an agency acting pursuant to a clear delegation from that representative body. The judgment of the Court of Appeals for the District of Columbia Circuit is reversed, and the cases are remanded for further proceedings consistent with this opinion.
It is so ordered.
[1289] Webpage: “The Executive Branch.” White House. Accessed February 1, 2013 at <www.whitehouse.gov>
Under Article II of the Constitution, the President is responsible for the execution and enforcement of the laws created by Congress. Fifteen executive departments—each led by an appointed member of the President’s Cabinet—carry out the day-to-day administration of the federal government. They are joined in this by other executive agencies such as the CIA [Central Intelligence Agency] and Environmental Protection Agency, the heads of which are not part of the Cabinet, but who are under the full authority of the President. …
The Department of the Interior (DOI) is the nation’s principal conservation agency. Its mission is to protect America’s natural resources, offer recreation opportunities, conduct scientific research, conserve and protect fish and wildlife, and honor our trust responsibilities to American Indians, Alaskan Natives, and our responsibilities to island communities.
DOI manages 500 million acres of surface land, or about one-fifth of the land in the United States, and manages hundreds of dams and reservoirs. Agencies within the DOI include the Bureau of Indian Affairs, the Minerals Management Service, and the U.S. Geological Survey. The DOI manages the national parks and is tasked with protecting endangered species.
The Secretary of the Interior oversees about 70,000 employees and 200,000 volunteers on a budget of approximately $16 billion. Every year it raises billions in revenue from energy, mineral, grazing, and timber leases, as well as recreational permits and land sales.
[1290] Calculated with data from the report: “Renewable Energy: Federal Agencies Implement Hundreds of Initiatives.” U.S. Government Accountability Office, February 2012. <www.gao.gov>
Page 3:
The federal government is also uniquely positioned to affect the development of renewable energy resources through its land management and regulatory activities and as a consumer of energy. For example, the Department of the Interior (Interior) manages approximately 500 million acres, or one-fifth, of the nation’s land and 1.7 billion acres off its shores. Interior has recently emphasized development of renewable resources in these areas by, for example, implementing measures to streamline the regulatory processes associated with constructing solar energy projects on some of these lands.
CALCULATION: 1,700 / 500 = 3.4
[1291] Article: “U.S. Blocks Oil Drilling at 60 Sites in Utah.” By John M. Broder. New York Times, October 9, 2009. <www.nytimes.com>
The Department of the Interior has frozen oil and gas development on 60 of 77 contested drilling sites in Utah, saying the process of leasing the land was rushed and badly flawed.
The 77 government-owned parcels, covering some 100,000 acres in eastern and southern Utah, were leased in the last weeks of the Bush administration. …
In recommending lease withdrawal or further study for 60 of the parcels, the review team gave a variety of reasons, including possible damage to the habitat of sage grouse, which is being considered for endangered species protection, and to avoid the dust and noise pollution associated with drilling operations.
[1292] Calculated with data from:
a) Dataset: “Natural Resource Production by Fiscal Year, 2003–2021.” U.S. Department of the Interior. Accessed September 12, 2022 at <revenuedata.doi.gov>
b) Report: “July 2022 Monthly Energy Review.” U.S. Energy Information Administration, Office of Energy Statistics, July 26, 2022. <www.eia.gov>
Page 5: “Table 1.2. Primary Energy Production by Source (Quadrillion Btu)”
NOTE: An Excel file containing the data and calculations is available upon request.
[1293] Paper: “Comparing Bird and Bat Fatality-Rate Estimates Among North American Wind-Energy Projects.” By K. Shawn Smallwood. Wildlife Society Bulletin, March 26, 2013. Pages 19–33. <onlinelibrary.wiley.com>
Page 19:
Many fatality estimates have been made across North America, but they have varied greatly in field and analytical methods, monitoring duration, and in the size and height of the wind turbines monitored for fatalities, and few benefited from scientific peer review. To improve comparability among estimates, I reviewed available reports of fatality monitoring at wind-energy projects throughout North America, and I applied a common estimator and 3 adjustment factors to data collected from these reports. To adjust fatality estimates for proportions of carcasses not found during routine monitoring, I used national averages from hundreds of carcass placement trials intended to characterize scavenger removal and searcher detection rates, and I relied on patterns of carcass distance from wind turbines to develop an adjustment for variation in maximum search radius around wind turbines mounted on various tower heights. Adjusted fatality rates correlated inversely with wind-turbine size for all raptors as a group across the United States, and for all birds as a group within the Altamont Pass Wind Resource Area, California. I estimated 888,000 bat and 573,000 bird fatalities/year (including 83,000 raptor fatalities) at 51,630 megawatt (MW) of installed wind-energy capacity in the United States in 2012.
[1294] Webpage: “Living with Raptors.” Arizona Game and Fish Department. Accessed October 14, 2013 at <www.azgfd.gov>
Birds of prey, also called raptors, include hawks, eagles, owls and falcons. This diverse group of birds has a huge range of sizes and behaviors, but the one thing most have in common is a tendency to catch live animals to eat. …
Raptors are protected by both state and federal laws, and harassing, trapping, killing, or even possessing bones or feathers without the proper permits can result in large fines.
[1295] Article: “Wind Farms Get Pass on Eagle Deaths.” By Dina Cappiello. Associated Press, May 14, 2013. <www.usnews.com>
Killing these iconic birds is not just an irreplaceable loss for a vulnerable species. It’s also a federal crime, a charge that the Obama administration has used to prosecute oil companies when birds drown in their waste pits, and power companies when birds are electrocuted by their power lines.
But the administration has never fined or prosecuted a wind-energy company, even those that flout the law repeatedly. Instead, the government is shielding the industry from liability and helping keep the scope of the deaths secret. …
Getting precise figures is impossible because many companies aren't required to disclose how many birds they kill. And when they do, experts say, the data can be unreliable.
When companies voluntarily report deaths, the Obama administration in many cases refuses to make the information public, saying it belongs to the energy companies or that revealing it would expose trade secrets or implicate ongoing enforcement investigations. …
One of the deadliest places in the country for golden eagles is Wyoming, where federal officials said wind farms have killed more than four dozen golden eagles since 2009, predominantly in the southeastern part of the state. The officials spoke on condition of anonymity because they were not authorized to disclose the figures.
[1296] Article: “Wind Energy Company Pleads Guilty to Eagle Deaths.” By Dina Cappiello. Associated Press, November 22, 2013. <www.washingtontimes.com>
“The government for the first time has enforced environmental laws protecting birds against wind energy facilities, winning a $1 million settlement from a power company that pleaded guilty to killing 14 eagles and 149 other birds at two Wyoming wind farms.”
[1297] Rule: “Eagle Permits; Changes in the Regulations Governing Eagle Permitting.” Executive Office of the President, Office of Management and Budget, Office of Information and Regulatory Affairs, Department of the Interior, December 2013. <www.reginfo.gov>
We will finalize our proposal to revise the regulations for permits for non-purposeful of take of eagles—that is, where the take is associated with, but not the purpose of, the activity. We proposed to extend the possible maximum term for programmatic permits to 30 years, as long as the permits incorporate conditions requiring the permittee to implement additional adaptive conservation measures if such measures are necessary to ensure the preservation of eagles. This change will facilitate the development of renewable energy and other projects that are designed to be in operation for many decades. These regulations will provide a measure of certainty to project proponents and their funders, while continuing to protect eagles consistent with statutory mandates.
[1298] Article: “Feds Nix Eagle Penalties for California Wind Farm.” Associated Press, June 26 2014. <www.nbcnews.com>
A California wind farm will become the first in the nation to avoid prosecution if eagles are injured or die when they run into the giant turning blades, the U.S. Fish and Wildlife Service said Thursday.
The Shiloh IV Wind Project LLC, 60 miles east of San Francisco, will receive a special permit allowing up to five golden eagles to be accidentally killed over five years. Previously, such a violation could potentially draw criminal charges and discourage private investment in wind farms known for catching birds in their rotors.
[1299] Memorandum: “The Migratory Bird Treaty Act Does Not Prohibit Incidental Take.” U.S. Department of the Interior, Office of the Solicitor, December 22, 2017. <www.doi.gov>
Pages 1–2:
This memorandum analyzes whether the Migratory Bird Treaty Act, 16 U.S.C. § 703 (“MBTA”), prohibits the accidental or “incidental” taking or killing of migratory birds. Unless permitted by regulation, the MBTA prohibits the “taking” and “killing” of migratory birds. “Incidental take” is take that results from an activity, but is not the purpose of that activity.
This issue was most recently addressed in Solicitor’s Opinion M-37041 – Incidental Take Prohibited Under the Migratory Bird Treaty Act, issued January 10, 2017 (hereinafter “Opinion M-37041 “), which concluded that “the MBTA’s broad prohibition on taking and killing migratory birds by any means and in any manner includes incidental taking and killing.”1 Opinion M-37041 was suspended pending review on February 6, 2017.2 In light of further analysis of the text, history, and purpose of the MBTA, as well as relevant case law, this memorandum permanently withdraws and replaces Opinion M-37041.
Interpreting the MBTA to apply to incidental or accidental actions hangs the sword of Damocles over a host of otherwise lawful and productive actions, threatening up to six months in jail and a $15,000 penalty for each and every bird injured or killed. As Justice Marshall warned, “the value of a sword of Damocles is that it hangs—not that it drops.”3 Indeed, the mere threat of prosecution inhibits otherwise lawful conduct. For the reasons explained below, this Memorandum finds that, consistent with the text, history, and purpose of the MBTA, the statute’s prohibitions on pursuing, hunting, taking, capturing, killing, or attempting to do the same apply only to affirmative actions that have as their purpose the taking or killing of migratory birds, their nests, or their eggs.4
4 This memorandum recognizes that this interpretation is contrary to the prior practice of this Department. As explained below, the past expansive assertion of federal authority under the MBTA rested upon a slim foundation—one that ultimately cannot carry its weight. Neither the plain language of the statute nor its legislative history support the notion that Congress intended to criminalize, with fines and potential jail time, otherwise lawful conduct that might incidentally result in the taking of one or more birds.
Page 18: “Based upon the text and purpose of the MBTA, as well as sound principles of constitutional avoidance, this memorandum concludes that the MBTA’s prohibitions on pursuing, hunting, taking, capturing, killing, or attempting to do the same only criminalize affirmative actions that have as their purpose the taking or killing of migratory birds, their nests, or their eggs.”
Page 41:
The text, history, and purpose of the MBTA demonstrate that it is a law limited in relevant part to affirmative and purposeful actions, such as hunting and poaching, that reduce migratory birds and their nests and eggs, by killing or capturing, to human control. Even assuming that the text could be subject to multiple interpretations, courts and agencies are to avoid interpreting ambiguous laws in ways that raise grave Constitutional doubts if alternative interpretations are available. Interpreting the MBTA to criminalize incidental takings raises serious due process concerns and is contrary to the fundamental principle that ambiguity in criminal statutes must be resolved in favor of defendants. Based upon the text, history, and purpose of the MBTA, and consistent with decisions in the Courts of Appeals for the Fifth, Eighth, and Ninth circuits, there is an alternative interpretation that avoids these concerns. Thus, based on the foregoing, we conclude that the MBTA’s prohibition on pursuing, hunting, taking, capturing, killing, or attempting to do the same applies only to direct and affirmative purposeful actions that reduce migratory birds, their eggs, or their nests, by killing or capturing, to human control.
[1300] Proposed rule: “Regulations Governing Take of Migratory Birds.” Federal Register, February 3, 2020. <www.govinfo.gov>
Page 5915:
We, the U.S. Fish and Wildlife Service (FWS, Service, we), propose to adopt a regulation that defines the scope of the Migratory Bird Treaty Act (MBTA or Act) as it applies to conduct resulting in the injury or death of migratory birds protected by the Act. This proposed rule is consistent with the Solicitor’s Opinion, M–37050, which concludes that the MBTA’s prohibitions on pursuing, hunting, taking, capturing, killing, or attempting to do the same, apply only to actions directed at migratory birds, their nests, or their eggs.
[1301] Final rule: “Regulations Governing Take of Migratory Birds.” Federal Register, January 7, 2021. <www.govinfo.gov>
We, the U.S. Fish and Wildlife Service (FWS, Service, we), define the scope of the Migratory Bird Treaty Act (MBTA or Act) as it applies to conduct resulting in the injury or death of migratory birds protected by the Act. We determine that the MBTA’s prohibitions on pursuing, hunting, taking, capturing, killing, or attempting to do the same, apply only to actions directed at migratory birds, their nests, or their eggs.
[1302] Webpage: “Governing the Take of Migratory Birds Under the Migratory Bird Treaty Act.” U.S. Fish and Wildlife Service. Accessed September 14, 2022 at <www.fws.gov>
On October 4, 2021, the Service published a final rule revoking the January 7, 2021, regulation that limited the scope of the MBTA. With this final and formal revocation of the January 7 rule, the Service returns to implementing the MBTA as prohibiting incidental take and applying enforcement discretion, consistent with judicial precedent and long-standing agency practice prior to 2017. This final rule goes into effect on December 3, 2021.
The Service also published the final economic documents, the Final Regulatory Flexibility Analysis and Final Revised Regulatory Impact Analysis, following public comments.
In addition, the Service published a Final Record of Decision in compliance with the National Environmental Policy Act. The Record of Decision now states that the Service will implement Alternative B, the Environmentally Preferred Alternative, revoking the January 7 regulation and beginning a new process to promulgate a regulation that defines the scope of the MBTA’s prohibitions to include actions that incidentally take migratory birds.
The Service also issued a Director’s Order to provide instruction to Service employees, including expectations for conducting Service activities and prioritizing our law enforcement activities. This Director’s Order goes into effect on December 3, 2021.
In addition, the Service simultaneously published an Advanced Notice of Proposed Rulemaking (ANPR) ;announcing the intent to solicit public comments and information as we consider developing proposed regulations to authorize the incidental take of migratory birds.
[1303] Final rule: “Regulations Governing Take of Migratory Birds; Revocation of Provisions.” Federal Register, October 4, 2021. <www.govinfo.gov>
On January 7, 2021, we, the U.S. Fish and Wildlife Service (we, the Service, or USFWS), published a final rule (January 7 rule) defining the scope of the Migratory Bird Treaty Act (MBTA) as it applies to conduct resulting in the injury or death of migratory birds protected by the MBTA. We now revoke that rule for the reasons set forth below. The immediate effect of this final rule is to return to implementing the MBTA as prohibiting incidental take and applying enforcement discretion, consistent with judicial precedent and longstanding agency practice prior to 2017.
[1304] Report: “Information on Shale Resources, Development, and Environmental and Public Health Risks.” U.S. Government Accountability Office, September 5, 2012. <www.gao.gov>
Page 1: “Shale is a sedimentary rock that is predominantly composed of consolidated clay-sized particles.”
Pages 5–6:
In contrast to the free-flowing resources found in conventional formations, the low permeability of some formations, including shale, means that oil and gas trapped in the formation cannot move easily within the rock. … [T]o extract shale oil and gas from the rock, fluids and proppants (usually sand or ceramic beads used to hold fractures open in the formation) are injected under high pressure to create and maintain fractures to increase permeability, thus allowing oil or gas to be extracted. Other formations, such as coalbed methane formations and tight sandstone formations,12 may also require stimulation to allow oil or gas to be extracted.13…
The process to develop shale oil and gas is similar to the process for conventional onshore oil and gas, but shale formations may rely on the use of horizontal drilling and hydraulic fracturing—which may or may not be used on conventional wells.
12 Conventional sandstone has well-connected pores, but tight sandstone has irregularly distributed and poorly connected pores. Due to this low connectivity or permeability, gas trapped within tight sandstone is not easily produced.
13 For coalbed methane formations, the reduction in pressure needed to extract gas is achieved through dewatering. As water is pumped out of the coal seams, reservoir pressure decreases, allowing the natural gas to release (desorb) from the surface of the coal and flow through natural fracture networks into the well.
[1305] Article: “On the Rise.” By Thomas Helbling. International Monetary Fund Finance & Development, March 2013. Pages 34–37. <www.imf.org>
Page 35:
Other geological structures in the United States—shale rock and tight sand formations—have long been known to contain oil and gas. But the fuels are trapped in these formations and cannot be extracted in the same way as from conventional sources. Instead, producers use a combination of horizontal drilling and hydraulic fracturing, or “fracking,” during which fluids are injected under high pressure to break up the formations and release trapped fossil fuels.
[1306] Report: “Technically Recoverable Shale Oil and Shale Gas Resources: An Assessment of 137 Shale Formations in 41 Countries Outside the United States.” U.S. Energy Information Administration, June 10, 2013. <www.eia.gov>
Executive Summary (<www.eia.gov>):
Within the United States, the oil and natural gas industry typically refers to tight oil production rather than shale oil production, because it is a more encompassing and accurate term with respect to the geologic formations producing oil at any particular well. EIA [U.S. Energy Information Administration] has adopted this convention, and develops estimates of tight oil production and resources in the United States that include, but are not limited to, production from shale formations.
[1307] Report: “Annual Energy Review 2011.” U.S. Energy Information Administration, Office of Energy Statistics, September 2012. <www.eia.gov>
Page 89: “Table 4.1 Technically Recoverable Crude Oil and Natural Gas Resource Estimates, 2009 … Tight Gas … Natural gas produced from a non-shale formation with extremely low permeability.”
[1308] Report: “Drilling Sideways—A Review of Horizontal Well Technology and Its Domestic Application.” U.S. Energy Information Administration, April 1993. <www.eia.gov>
Page 1:
A widely accepted definition of what qualifies as horizontal drilling has yet to be written. The following combines the essential components of two previously published definitions:1
Horizontal drilling is the process of drilling and completing, for production, a well that begins as a vertical or inclined linear bore which extends from the surface to a subsurface location just above the target oil or gas reservoir called the “kickoff point,” then bears off on an arc to intersect the reservoir at the “entry point,” and, thereafter, continues at a near-horizontal attitude tangent to the arc, to substantially or entirely remain within the reservoir until the desired bottom hole location is reached.
Most oil and gas reservoirs are much more extensive in their horizontal (areal) dimensions than in their vertical (thickness) dimension. By drilling that portion of a well which intersects such a reservoir parallel to its plane of more extensive dimension, horizontal drilling’s immediate technical objective is achieved. That objective is to expose significantly more reservoir rock to the wellbore surface than would be the case with a conventional vertical well penetrating the reservoir perpendicular to its plane of more extensive dimension (Figure 1). The desire to attain this immediate technical objective is almost always motivated by the intended achievement of more important objectives (such as avoidance of water production) related to specific physical characteristics of the target reservoir.
Pages 4–5:
Even when drilling technique has been optimized for a target, the expected financial benefits of horizontal drilling must at least offset the increased well costs before such a project will be undertaken. In successful horizontal drilling applications, the “offset or better” happens due to the occurrence of one or more of a number of factors.
First, operators often are able to develop a reservoir with a sufficiently smaller number of horizontal wells, since each well can drain a larger rock volume about its bore than a vertical well could. When this is the case, per well proved reserves are higher than for a vertical well. An added advantage relative to the environmental costs or land use problems that may pertain in some situations is that the aggregate surface “footprint” of an oil or gas recovery operation can be reduced by use of horizontal wells.
Second, a horizontal well may produce at rates several times greater than a vertical well, due to the increased wellbore surface area within the producing interval. For example, in the Austin Chalk reservoir of Texas’ Giddings Field, under equal pressure conditions, horizontal completions of 500 to 2,200 foot HD [horizontal displacement] produce at initial rates 2½ to 7 times higher than vertical completions.7 Chairman Robert Hauptfuhrer of Oryx Energy Co. noted that “Our costs in the [Austin] chalk now are 50 percent more than a vertical well, but we have three to five or more times the daily production and reserves than a vertical well.”8 A faster producing rate translates financially to a higher rate of return on the horizontal project than would be achieved by a vertical project.
Third, use of a horizontal well may preclude or significantly delay the onset of production problems (interferences) that engender low production rates, low recovery efficiencies, and/or premature well abandonment, reducing or even eliminating, as a result of their occurrence, return on investment and total return.
[1309] Report: “Technically Recoverable Shale Oil and Shale Gas Resources: An Assessment of 137 Shale Formations in 41 Countries Outside the United States.” U.S. Energy Information Administration, June 10, 2013. <www.eia.gov>
Page 18: “One reason why 3,000-to-5,000-foot horizontal laterals are employed in the United States is to increase the likelihood that a portion of the horizontal lateral will be sufficiently productive to make the well profitable.”
[1310] Webpage: “Development of Radar Navigation and Radio Data Transmission for Microhole Coiled Tubing Bottomhole Assemblies.” U.S. Department of Energy, National Energy Technology Laboratory. Accessed August 27, 2013 at <www.netl.doe.gov>
[1311] Report: “Drilling Sideways—A Review of Horizontal Well Technology and Its Domestic Application.” U.S. Energy Information Administration, April 1993. <www.eia.gov>
Page vii:
Horizontal drilling technology achieved commercial viability during the late 1980’s. Its successful employment, particularly in the Bakken Shale of North Dakota and the Austin Chalk of Texas, has encouraged testing of it in many domestic geographic regions and geologic situations. …
… The commercial viability of horizontal wells for production of natural gas has not been well demonstrated yet, although some horizontal wells have been used to produce coal seam gas.
Page viii:
An offset to the benefits provided by successful horizontal drilling is its higher cost. But the average cost is going down. By 1990, the cost premium associated with horizontal wells had shrunk from the 300-percent level experienced with some early experimental wells to an annual average of 17 percent. Learning curves are apparent, as indicated by incurred costs, as new companies try horizontal drilling and as companies move to new target reservoirs. It is probable that the cost premium associated with horizontal drilling will continue to decline, leading to its increased use.
Pages 7–8:
The modern concept of non-straight line, relatively short-radius drilling, dates back at least to September 8, 1891, when the first U.S. patent for the use of flexible shafts to rotate drilling bits was issued to John Smalley Campbell (Patent Number 459,152). While the prime application described in the patent was dental, the patent also carefully covered use of his flexible shafts at much larger and heavier physical scales “… such, for example, as those used in engineer’s shops for drilling holes in boiler-plates or other like heavy work. The flexible shafts or cables ordinarily employed are not capable of being bent to and working at a curve of very short radius …”
The first recorded true horizontal oil well, drilled near Texon, Texas, was completed in 1929.9 Another was drilled in 1944 in the Franklin Heavy Oil Field, Venango County, Pennsylvania, at a depth of 500 feet.10 China tried horizontal drilling as early as 1957, and later the Soviet Union tried the technique.11 Generally, however, little practical application occurred until the early 1980’s, by which time the advent of improved downhole drilling motors and the invention of other necessary supporting equipment, materials, and technologies, particularly downhole telemetry equipment, had brought some kinds of applications within the imaginable realm of commercial viability.
Early Commercial Horizontal Wells
Tests, which indicated that commercial horizontal drilling success could be achieved in more than isolated instances, were carried out between 1980 and 1983 by the French firm Elf Aquitaine in four horizontal wells drilled in three European fields: the Lacq Superieur Oil Field (2 wells) and the Castera Lou Oil Field, both located in southwestern France, and the Rospo Mare Oil Field, located offshore Italy in the Mediterranean Sea. In the latter instance, output was very considerably enhanced.12 Early production well drilling using horizontal techniques was subsequently undertaken by British Petroleum in Alaska’s Prudhoe Bay Field, in a successful attempt to minimize unwanted water and gas intrusions into the Sadlerochit reservoir.13
The Recent Growth of Commercial Horizontal Drilling Taking a cue from these initial successes, horizontal drilling has been undertaken with increasing frequency by more and more operators. They and the drilling and service firms that support them have expanded application of the technology to many additional types of geological and reservoir engineering factor-related drilling objectives. Domestic horizontal wells have now been planned and completed in at least 57 counties or offshore areas located in or off 20 States.
Horizontal drilling in the United States has thus far been focused almost entirely on crude oil applications. In 1990, worldwide, more than 1,000 horizontal wells were drilled. Some 850 of them were targeted at Texas’ Upper Cretaceous Austin Chalk Formation alone.
Page 23: “As noted early on, most domestic horizontal wells have thus far been drilled in search of, or to produce, crude oil. There is no physical reason why they should not also be targeted for natural gas.”
[1312] Article: “On the Rise.” By Thomas Helbling. International Monetary Fund Finance & Development, March 2013. Pages 34–37. <www.imf.org>
Page 35: “[During fracking] fluids are injected under high pressure to break up the formations and release trapped fossil fuels.”
[1313] Report: “Information on Shale Resources, Development, and Environmental and Public Health Risks.” U.S. Government Accountability Office, September 5, 2012. <www.gao.gov>
Page 1: “[Hydraulic fracturing is] a process that injects a combination of water, sand, and chemical additives under high pressure to create and maintain fractures in underground rock formations that allow oil and natural gas to flow….”
Page 5: “[T]o extract shale oil and gas from the rock, fluids and proppants (usually sand or ceramic beads used to hold fractures open in the formation) are injected under high pressure to create and maintain fractures to increase permeability, thus allowing oil or gas to be extracted.”
Pages 9–13:
The next stage in the development process is stimulation of the shale formation using hydraulic fracturing. Before operators or service companies perform a hydraulic fracture treatment of a well, a series of tests may be conducted to ensure that the well, wellhead equipment, and fracturing equipment can safely withstand the high pressures associated with the fracturing process. Minimum requirements for equipment pressure testing can be determined by state regulatory agencies for operations on state or private lands. In addition, fracturing is conducted below the surface of the earth, sometimes several thousand feet below, and can only be indirectly observed. Therefore, operators may collect subsurface data—such as information on rock stresses20 and natural fault structures—needed to develop models that predict fracture height, length, and orientation prior to drilling a well. The purpose of modeling is to design a fracturing treatment that optimizes the location and size of induced fractures and maximizes oil or gas production.
To prepare a well to be hydraulically fractured, a perforating tool may be inserted into the casing and used to create holes in the casing and cement. Through these holes, fracturing fluid—that is injected under high pressures—can flow into the shale (fig. 2 shows a used perforating tool).
Fracturing fluids are tailored to site specific conditions, such as shale thickness, stress, compressibility, and rigidity. As such, the chemical additives used in a fracture treatment vary. Operators may use computer models that consider local conditions to design site-specific hydraulic fluids. The water, chemicals, and proppant used in fracturing fluid are typically stored on-site in separate tanks and blended just before they are injected into the well. Figure 3 provides greater detail about some chemicals commonly used in fracturing.
Figure 3: Examples of Common Ingredients Found in Fracturing Fluid
The operator pumps the fracturing fluid into the wellbore at pressures high enough to force the fluid through the perforations into the surrounding formation—which can be shale, coalbeds, or tight sandstone—expanding existing fractures and creating new ones in the process. After the fractures are created, the operator reduces the pressure. The proppant stays in the formation to hold open the fractures and allow the release of oil and gas. Some of the fracturing fluid that was injected into the well will return to the surface (commonly referred to as flowback) along with water that occurs naturally in the oil- or gas-bearing formation—collectively referred to as produced water. The produced water is brought to the surface and collected by the operator, where it can be stored on-site in impoundments, injected into underground wells, transported to a wastewater treatment plant, or reused by the operator in other ways.21 Given the length of horizontal wells, hydraulic fracturing is often conducted in stages, where each stage focuses on a limited linear section and may be repeated numerous times.
Once a well is producing oil or natural gas, equipment and temporary infrastructure associated with drilling and hydraulic fracturing operations is no longer needed and may be removed, leaving only the parts of the infrastructure required to collect and process the oil or gas and ongoing produced water. Operators may begin to reclaim the part of the site that will not be used by restoring the area to predevelopment conditions. Throughout the producing life of an oil or gas well, the operator may find it necessary to periodically restimulate the flow of oil or gas by repeating the hydraulic fracturing process. The frequency of such activity depends on the characteristics of the geologic formation and the economics of the individual well. If the hydraulic fracturing process is repeated, the site and surrounding area will be further affected by the required infrastructure, truck transport, and other activity associated with this process.
20 Stresses in the formation generally define a maximum and minimum stress direction that influence the direction a fracture will grow.
21 Underground injection is the predominant practice for disposing of produced water. In addition to underground injection, a limited amount of produced water is managed by discharging it to surface water, storing it in surface impoundments, and reusing it for irrigation or hydraulic fracturing.
[1314] Report: “Information on Shale Resources, Development, and Environmental and Public Health Risks.” U.S. Government Accountability Office, September 5, 2012. <www.gao.gov>
Page 7:
1940s Hydraulic fracturing first introduced to the petroleum industry.
1947 The first experimental hydraulic fracturing treatment conducted in Grant County, Kansas.
1949 The first commercial hydraulic fracturing treatment conducted in Stephens County, Oklahoma.
1950s Hydraulic fracturing becomes a commercially accepted process.
1955 More than 100,000 individual hydraulic fracturing treatments performed.
Late 1970s and early 1980s Shale formations, such as the Barnett in Texas and Marcellus in Pennsylvania, are known but believed to have essentially zero permeability and thus are not considered economic. Federally sponsored research seeks to improve ways to extract gas from unconventional formations, such as shale.
1980s to early 1990s Mitchell Energy combines larger fracture designs, rigorous reservoir characterization, horizontal drilling, and lower cost approaches to hydraulic fracturing to make the Barnett Shale economic.
[1315] Article: “U.S. Gas Fields Go From Bust to Boom.” By Ben Casselman. Wall Street Journal, April 30, 2009. <online.wsj.com>
In the 1980s, Texas oilman George Mitchell began trying to produce gas from a formation near Fort Worth, Texas, known as the Barnett Shale. He pumped millions of gallons of water at high pressure down the well, cracking open the rock and allowing gas to flow to the surface.
Oklahoma City-based Devon Energy Corp. bought Mr. Mitchell’s company in 2002. It combined his methods with a technique for drilling straight down to gas-bearing rock, then turning horizontally to stay within the formation. Devon’s first horizontal wells produced about three times as much gas as traditional vertical wells.
[1316] Report: “Technically Recoverable Shale Oil and Shale Gas Resources: An Assessment of 137 Shale Formations in 41 Countries Outside the United States.” U.S. Energy Information Administration, June 10, 2013. <www.eia.gov>
Executive Summary (<www.eia.gov>):
The advent of large-scale shale gas production did not occur until around 2000 when shale gas production became a commercial reality in the Barnett Shale located in north-central Texas. As commercial success of the Barnett Shale became apparent, other companies started drilling wells in this formation so that by 2005, the Barnett Shale alone was producing almost half a trillion cubic feet per year of natural gas.
[1317] Article: “U.S. Gas Fields Go From Bust to Boom.” By Ben Casselman. Wall Street Journal, April 30, 2009. <online.wsj.com>
In the 1980s, Texas oilman George Mitchell began trying to produce gas from a formation near Fort Worth, Texas, known as the Barnett Shale. He pumped millions of gallons of water at high pressure down the well, cracking open the rock and allowing gas to flow to the surface.
Oklahoma City-based Devon Energy Corp. bought Mr. Mitchell’s company in 2002. It combined his methods with a technique for drilling straight down to gas-bearing rock, then turning horizontally to stay within the formation. Devon’s first horizontal wells produced about three times as much gas as traditional vertical wells.
[1318] Report: “Information on Shale Resources, Development, and Environmental and Public Health Risks.” U.S. Government Accountability Office, September 5, 2012. <www.gao.gov>
Page 1:
For decades, the United States has relied on imports of oil and natural gas to meet domestic needs. As recently as 2007, the expectation was that the nation would increasingly rely on imports of natural gas to meet its growing demand. However, recent improvements in technology have allowed companies that develop petroleum resources to extract oil and natural gas from shale formations,1 known as “shale oil” and “shale gas,” respectively, which were previously inaccessible because traditional techniques did not yield sufficient amounts for economically viable production.
Page 2: “Early drilling activity in shale formations was centered primarily on natural gas, but with the falling price of natural gas companies switched their focus to oil and natural gas liquids, which are a more valuable product.”
Page 6:
The process to develop shale oil and gas is similar to the process for conventional onshore oil and gas, but shale formations may rely on the use of horizontal drilling and hydraulic fracturing—which may or may not be used on conventional wells. Horizontal drilling and hydraulic fracturing are not new technologies, as seen in figure 1, but advancements, refinements, and new uses of these technologies have greatly expanded oil and gas operators’ abilities to use these processes to economically develop shale oil and gas resources. For example, the use of multistage hydraulic fracturing within a horizontal well has only been widely used in the last decade.15
15 Hydraulic fracturing is often conducted in stages. Each stage focuses on a limited linear section and may be repeated numerous times.
[1319] Calculated with data from the report: “July 2022 Monthly Energy Review.” U.S. Energy Information Administration, Office of Energy Statistics, July 26, 2022. <www.eia.gov>
Page 103: “Table 4.1: Natural Gas Overview (Billion Cubic Feet)”
NOTE: An Excel file containing the data and calculations is available upon request.
[1320] Report: “International Energy Outlook 2013.” U.S. Energy Information Administration, July 25, 2013. <www.eia.gov>
Page 4:
In the United States, one of the keys to increasing natural gas production has been advances in the application of horizontal drilling and hydraulic fracturing technologies, which made it possible to develop the country’s vast shale gas resources and contributed to a near doubling of total U.S. technically recoverable natural gas resource estimates over the past decade.
[1321] Report: “Technically Recoverable Shale Oil and Shale Gas Resources: An Assessment of 137 Shale Formations in 41 Countries Outside the United States.” U.S. Energy Information Administration, June 10, 2013. <www.eia.gov>
Executive Summary (<www.eia.gov>):
Because they have proven to be quickly producible in large volumes at a relatively low cost, tight oil and shale gas resources have revolutionized U.S. oil and natural gas production, providing 29 percent of total U.S. crude oil production and 40 percent of total U.S. natural gas production in 2012. …
The use of horizontal drilling in conjunction with hydraulic fracturing has greatly expanded the ability of producers to profitably produce oil and natural gas from low permeability geologic formations, particularly shale formations.
[1322] Report: “Federal Support for the Development, Production, and Use of Fuels and Energy Technologies.” Congressional Budget Office, November 2015. Updated 6/26/16. <www.cbo.gov>
Page 12: “Over the past decade, the amount of oil produced in the United States has increased dramatically because of technological developments related to hydraulic fracturing.”
[1323] Webpage: “Natural Gas Explained: Where Our Natural Gas Comes From.” U.S. Energy Information Administration. Last updated July 8, 2022. <www.eia.gov>
U.S. dry natural gas production in 2020 was about 33.5 trillion cubic feet (Tcf), an average of about 91.5 billion cubic feet per day and the second-highest annual amount recorded. Most of the production increases since 2005 are the result of horizontal drilling and hydraulic fracturing techniques, notably in shale, sandstone, carbonate, and other tight geologic formations. Natural gas is produced from onshore and offshore natural gas and oil wells and from coal beds.
[1324] Calculated with data from the report: “July 2022 Monthly Energy Review.” U.S. Energy Information Administration, Office of Energy Statistics, July 26, 2022. <www.eia.gov>
Page 61: “Table 3.1: Petroleum Overview (Thousand Barrels per Day)”
NOTE: An Excel file containing the data and calculations is available upon request.
[1325] Article: “U.S. Crude Oil Production Grew 11% in 2019, Surpassing 12 Million Barrels Per Day.” U.S. Energy Information Administration, March 2, 2020. <www.eia.gov>
Annual U.S. crude oil production reached another record level at 12.23 million barrels per day (b/d) in 2019, 1.24 million b/d, or 11%, more than 2018 levels. The 2019 growth rate was down from a 17% growth rate in 2018. In November 2019, monthly U.S. crude oil production averaged 12.86 million b/d, the most monthly crude oil production in U.S. history, according to the U.S. Energy Information Administration’s (EIA) Petroleum Supply Monthly. U.S. crude oil production has increased significantly during the past 10 years, driven mainly by production from tight rock formations developed using horizontal drilling and hydraulic fracturing to extract hydrocarbons.
[1326] Article: “Hydraulic Fracturing Accounts for About Half of Current U.S. Crude Oil Production.” U.S. Energy Information Administration, March 15, 2016. <www.eia.gov>
Even though hydraulic fracturing has been in use for more than six decades, it has only recently been used to produce a significant portion of crude oil in the United States. This technique, often used in combination with horizontal drilling, has allowed the United States to increase its oil production faster than at any time in its history. Based on the most recent available data from states, EIA [U.S. Energy Information Administration] estimates that oil production from hydraulically fractured wells now makes up about half of total U.S. crude oil production.
[1327] Report: “Annual Energy Outlook 2014 with Projections to 2040.” U.S. Energy Information Administration, April 2014. <www.eia.gov>
Page ES-2:
Key results highlighted in the AEO2014 [Annual Energy Outlook] Reference and alternative cases include:
• Growing domestic production of natural gas and oil continues to reshape the U.S. energy economy, largely as a result of rising production from tight formations, but the effect could vary substantially depending on expectations about resources and technology. …
Growth in crude oil production from tight oil and shale formations supported by identification of resources and technology advances have supported a nearly fourfold increase in tight oil production from 2008, when it accounted for 12% of total U.S. crude oil production, to 2012, when it accounted for 35% of total U.S. production. …
In the Reference case, tight oil production begins to slow after 2021, contributing to a decline in total U.S. oil production through 2040. However, tight oil development is still at an early stage, and the outlook is uncertain. Changes in U.S. crude oil production depend largely on the degree to which technological advances allow production to occur in potentially high-yielding tight and shale formations.
[1328] Report: “Technically Recoverable Shale Oil and Shale Gas Resources: An Assessment of 137 Shale Formations in 41 Countries Outside the United States.” U.S. Energy Information Administration, June 10, 2013. <www.eia.gov>
Executive Summary (<www.eia.gov>):
Because they have proven to be quickly producible in large volumes at a relatively low cost, tight oil and shale gas resources have revolutionized U.S. oil and natural gas production, providing 29 percent of total U.S. crude oil production and 40 percent of total U.S. natural gas production in 2012. …
… The increase in U.S. crude oil production in 2012 of 847,000 barrels per day over 2011 was largely attributable to increased production from shales and other tight resources. …
… For example, U.S. crude oil production rose by 847,000 barrels per day in 2012, compared with 2011, by far the largest growth in crude oil production in any country. Production from shales and other tight plays accounted for nearly all of this increase, reflecting both the availability of recoverable resources and favorable above-the-ground conditions for production. …
The use of horizontal drilling in conjunction with hydraulic fracturing has greatly expanded the ability of producers to profitably produce oil and natural gas from low permeability geologic formations, particularly shale formations.
[1329] Article: “On the Rise.” By Thomas Helbling. International Monetary Fund Finance & Development, March 2013. Pages 34–37. <www.imf.org>
Page 34: “The surge in production is largely the result of the new ability of producers to extract oil and gas from unconventional geological formations—so-called shale rock and tight rock or sand formations. The revolution in production occurred first in natural gas and more recently in oil.”
[1330] Report: “Information on Shale Resources, Development, and Environmental and Public Health Risks.” U.S. Government Accountability Office, September 5, 2012. <www.gao.gov>
Page 2: “Early drilling activity in shale formations was centered primarily on natural gas, but with the falling price of natural gas companies switched their focus to oil and natural gas liquids, which are a more valuable product.”
[1331] Report: “The Distribution of U.S. Oil and Natural Gas Wells by Production Rate.” U.S. Energy Information Administration, December 2019. <www.eia.gov>
Page 8:
Are any wells still drilled using only conventional drilling practices?
Yes, many vertical wells are still drilled and completed without hydraulic fracturing; however, these wells and older completion techniques are becoming less common. Based on the larger number of wells and footage drilled, horizontal drilling combined with hydraulic fracturing have become standard practice for oil and natural gas production in the United States.
[1332] Article: “Horizontally Drilled Wells Dominate U.S. Tight Formation Production.” By Jack Perrin. U.S. Energy Information Administration, June 6, 2019. <www.eia.gov>
Wells drilled horizontally into tight oil and shale gas formations continue to account for an increasing share of crude oil and natural gas production in the United States. In 2004, horizontal wells accounted for about 15% of U.S. crude oil production in tight oil formations. By the end of 2018, that percentage had increased to 96%. Similarly, horizontal wells made up about 14% of U.S. natural gas production in shale formations in 2004 and increased to 97% in 2018. Although horizontal wells have been the dominant source of production from U.S. shale gas and tight oil plays since 2008 and 2010, respectively, the number of horizontal wells did not surpass the number of vertical wells drilled in these plays until 2017. About 88,000 vertical wells in tight oil and shale gas plays in the United States still produced crude oil or natural gas at the end of 2018, but the volume produced by these wells was minor compared with the volume produced by horizontal wells. Many of these remaining vertical wells are considered marginal, or stripper, wells, which will continue to produce small volumes until they become uneconomic.
[1333] Calculated with data from:
a) Webpage: “How Much Shale Gas Is Produced in the United States?” U.S. Energy Information Administration. Last updated March 15, 2022. <www.eia.gov>
“The U.S. Energy Information Administration (EIA) estimates that in 2021, U.S. dry shale gas production was about 26.8 trillion cubic feet (Tcf) and equal to about 79% of total U.S. dry natural gas production in 2021.”
b) Article: “Horizontally Drilled Wells Dominate U.S. Tight Formation Production.” By Jack Perrin. U.S. Energy Information Administration, June 6, 2019. <www.eia.gov>
“[H]orizontal wells made up about 14% of U.S. natural gas production in shale formations in 2004 and increased to 97% in 2018. … Drilling horizontally, parallel to the geologic layers in tight formations, allows producers to access more of the oil- and natural gas-bearing rock than drilling vertically. This increased exposure allows additional hydraulic fracturing with greater water volumes and pounds of proppant (small, solid particles, usually sand or a manmade granular solid of similar size).”
CALCULATION: 79% of gas production from shale × 97% of shale gas production from horizontal wells = 76.6% of natural gas production from horizontal wells
[1334] Webpage: “Natural Gas Explained: Where Our Natural Gas Comes From.” U.S. Energy Information Administration. Last updated July 8, 2022. <www.eia.gov>
U.S. dry natural gas production in 2020 was about 33.5 trillion cubic feet (Tcf), an average of about 91.5 billion cubic feet per day and the second-highest annual amount recorded. Most of the production increases since 2005 are the result of horizontal drilling and hydraulic fracturing techniques, notably in shale, sandstone, carbonate, and other tight geologic formations. Natural gas is produced from onshore and offshore natural gas and oil wells and from coal beds.
[1335] Calculated with data from:
a) Webpage: “How Much Shale (Tight) Oil Is Produced in the United States?” U.S. Energy Information Administration. Last updated March 7, 2022. <www.eia.gov>
“The U.S. Energy Information Administration (EIA) estimates that in 2021, about 2.64 billion barrels (or about 7.22 million barrels per day) of crude oil were produced directly from tight oil resources in the United States. This was equal to about 65% of total U.S. crude oil production in 2021.”
b) Article: “Horizontally Drilled Wells Dominate U.S. Tight Formation Production.” By Jack Perrin. U.S. Energy Information Administration, June 6, 2019. <www.eia.gov>
“In 2004, horizontal wells accounted for about 15% of U.S. crude oil production in tight oil formations. By the end of 2018, that percentage had increased to 96%. … Because tight formations have very low permeability, which prevents oil and gas from moving toward the well bore, using hydraulic fracturing to increase permeability, along with horizontal drilling, is necessary for oil and gas to be produced from these formations economically.”
CALCULATION: 65% of crude oil production from tight oil formations × 96% of tight oil production from horizontal wells = 62.4% of crude oil production from horizontal wells
[1336] Article: “Tight Oil Development Will Continue to Drive Future U.S. Crude Oil Production.” By Dana Van Wagener and Faouzi Aloulou. U.S. Energy Information Administration, March 28, 2019. <www.eia.gov>
“Tight oil production reached 6.5 million b/d [barrels per day] in the United States in 2018, accounting for 61% of total U.S. production. EIA projects further U.S. tight oil production growth as the industry continues to improve drilling efficiencies and reduce costs, which makes developing tight oil resources less sensitive to oil prices than in the past.”
[1337] Report: “Information on Shale Resources, Development, and Environmental and Public Health Risks.” U.S. Government Accountability Office, September 5, 2012. <www.gao.gov>
Page 2 (of PDF):
For example, according to a number of studies and publications GAO [U.S. Government Accountability Office] reviewed, shale oil and gas development poses risks to air quality, generally as the result of (1) engine exhaust from increased truck traffic, (2) emissions from diesel-powered pumps used to power equipment, (3) gas that is flared (burned) or vented (released directly into the atmosphere) for operational reasons, and (4) unintentional emissions of pollutants from faulty equipment or impoundments—temporary storage areas. Similarly, a number of studies and publications GAO reviewed indicate that shale oil and gas development poses risks to water quality from contamination of surface water and groundwater as a result of erosion from ground disturbances, spills and releases of chemicals and other fluids, or underground migration of gases and chemicals.
Page 4:
The risks identified in the studies and publications we reviewed cannot, at present, be quantified, and the magnitude of potential adverse effects or likelihood of occurrence cannot be determined for several reasons. First, it is difficult to predict how many or where shale oil and gas wells may be constructed. Second, the extent to which operators use effective best management practices to mitigate risk may vary. Third, based on the studies we reviewed, there are relatively few studies that are based on comparing predevelopment conditions to postdevelopment conditions—making it difficult to detect or attribute adverse conditions to shale oil and gas development.
[1338] Article: “On the Rise.” By Thomas Helbling. International Monetary Fund Finance & Development, March 2013. Pages 34–37. <www.imf.org>
Page 37: “Another concern is potential environmental damage, which could hold back the expansion. So far, however, there is no conclusive evidence that the new technology leads to groundwater contamination, the main fear about the process.”
[1339] Booklet: “Energy, Powering Your World.” By M.T. Westra and S. Kuyvenhoven. Foundation for Fundamental Research on Matter, Institute for Plasma Physics, Rijnhuizen (the Netherlands), 2002. <fire.pppl.gov>
Page 7: “In 1859, the first petroleum was pumped out of the ground in Pennsylvania in the USA. For long the petroleum had been a nuisance, contaminating wells for drinking water.”
[1340] Fact sheet: “Coal-Bed Methane: Potential and Concerns.” U.S. Department of the Interior, U.S. Geological Survey, October 2000. <pubs.usgs.gov>
Page 2: “Reports from the 1800’s document gas bubbles in water wells, in streams, and in fields after heavy rains; this evidence suggests that migration has always existed. It has now become a problem because of new residential development near the methane migration pathways. Studies by the USGS [U.S. Geological Survey] will help clarify the nature of methane migration.”
[1341] Textbook: The Chemistry and Technology of Petroleum (4th edition). By James G. Speight. CRC Press, 2007.
Page 69: “Most of the crude oil currently recovered is produced from underground reservoirs. However, surface seepage of crude oil and natural gas are common in many regions.”
[1342] Article: “Natural Gas.” Encyclopædia Britannica Ultimate Reference Suite 2004.
“The first discoveries of natural gas seeps were made in Iran between 6000 and 2000 BC. Many early writers described the natural petroleum seeps in the Middle East, especially in the Baku region of what is now Azerbaijan. The gas seeps, probably first ignited by lightning, provided the fuel for the ‘eternal fires’ of the fire-worshiping religion of the ancient Persians.”
[1343] Guide: “Routine Water Well Maintenance, Disinfection and Methane Gas.” State of Kentucky, Energy and Environment Cabinet, Department for Environmental Protection, Division of Water, August 13, 2009. <eec.ky.gov>
Page 11:
High concentrations of methane in enclosed structures may lead to an explosion. Water wells located in pump houses, well pits, basements or any enclosed structure should be properly vented as a safety precaution to prevent the buildup of methane. The following is an explanation of methane gas occurrence in wells and some suggested practices to help keep your well and your well house safe.
Naturally occurring gases, such as methane and hydrogen sulfide, may be present in some wells. These gases occur naturally in the subsurface, accumulating in voids within the rock and as dissolved gas in groundwater. Methane and hydrogen sulfide can enter a well through damaged or corroded well casing, improperly sealed well casing, uncased formations, and as dissolved gases being released from well water.
Methane and hydrogen sulfide gases, in the right mixture with air, can be highly explosive. A lower explosive limit (LEL) value defines the percentage of gas in air that can be explosive. If the concentration is below the LEL, there is not enough of the gas in the air to ignite. Once the concentration reaches the LEL, any ignition source may set of an explosion. Ignition sources include: light switches; pressure switches, pump relays; heat from light bulbs or engines; natural gas appliances such as furnaces and hot water heaters (including the pilot light); lit cigarettes and other flame or spark sources.
[1344] Report: “Information on Shale Resources, Development, and Environmental and Public Health Risks.” U.S. Government Accountability Office, September 5, 2012. <www.gao.gov>
Page 45: “Methane can occur naturally in shallow bedrock and unconsolidated sediments and has been known to naturally seep to the surface and contaminate water supplies, including water wells.”
[1345] Report: “Information on Shale Resources, Development, and Environmental and Public Health Risks.” U.S. Government Accountability Office, September 5, 2012. <www.gao.gov>
Page 45: “Methane is a colorless, odorless gas and is generally considered nontoxic, but there could be an explosive hazard if gas is present in significant volumes and the water well is not properly vented.”
[1346] Guide: “Routine Water Well Maintenance, Disinfection and Methane Gas.” State of Kentucky, Energy and Environment Cabinet, Department for Environmental Protection, Division of Water, August 13, 2009. <eec.ky.gov>
Page 11: “Because methane is colorless and odorless, it can accumulate undetected in well bores and enclosed structures to explosive levels if not properly vented.”
[1347] Report: “Information on Shale Resources, Development, and Environmental and Public Health Risks.” U.S. Government Accountability Office, September 5, 2012. <www.gao.gov>
Page 37: “An aquifer is an underground layer of rock or unconsolidated sand, gravel, or silt that will yield groundwater to a well or spring.”
Pages 46–47:
Fracture growth. A number of such studies and publications we reviewed report that the risk of induced fractures extending out of the target formation into an aquifer—allowing gas or other fluids to contaminate water—may depend, in part, on the depth separating the fractured formation and the aquifer. For example, according to a 2012 Bipartisan Policy Center report,67 the fracturing process itself is unlikely to directly affect freshwater aquifers because fracturing typically takes place at a depth of 6,000 to 10,000 feet, while drinking water tables are typically less than 1,000 feet deep.68 Fractures created during the hydraulic fracturing process are generally unable to span the distance between the targeted shale formation and freshwater bearing zones. According to a 2011 industry report, fracture growth is stopped by natural subsurface barriers and the loss of hydraulic fracturing fluid.69 When a fracture grows, it conforms to a general direction set by the stresses in the rock, following what is called fracture direction or orientation. The fractures are most commonly vertical and may extend laterally several hundred feet away from the well, usually growing upward until they intersect with a rock of different structure, texture, or strength. These are referred to as seals or barriers and stop the fracture’s upward or downward growth. In addition, as the fracturing fluid contacts the formation or invades natural fractures, part of the fluid is lost to the formation. The loss of fluids will eventually stop fracture growth according to this industry report.
From 2001 through 2010, an industry consulting firm monitored the upper and lower limits of hydraulically induced fractures relative to the position of drinking water aquifers in the Barnett and Eagle Ford Shale, the Marcellus Shale, and the Woodford Shale.70 In 2011, the firm reported that the results of the monitoring show that even the highest fracture point is several thousand feet below the depth of the deepest drinking water aquifer. For example, for over 200 fractures in the Woodford Shale, the typical distance between the drinking water aquifer and the top of the fracture was 7,500 feet, with the highest fracture recorded at 4,000 feet from the aquifer. In another example, for the 3,000 fractures performed in the Barnett Shale, the typical distance from the drinking water aquifer and the top of the fracture was 4,800 feet, and the fracture with the closest distance to the aquifer was still separated by 2,800 feet of rock. Table 4 shows the relationship between shale formations and the depth of treatable water in five shale gas plays currently being developed.
68 Some coalbed methane formations are much closer to drinking water aquifers than are shale formations. In 2004, EPA [U.S. Environmental Protection Agency] reviewed incidents of drinking water well contamination believed to be associated with hydraulic fracturing in coalbed methane formations. EPA found no confirmed cases linked to the injection of fracturing fluid or subsequent underground movement of fracturing fluids. The report states that, although thousands of coalbed methane formations are fractured annually, EPA did not find confirmed evidence that drinking water wells had been contaminated by the hydraulic fracturing process.
69 George E. King, Apache Corporation, “Explaining and Estimating Fracture Risk: Improving Fracture Performance in Unconventional Gas and Oil Wells” (presented at the Society of Petroleum Engineers Hydraulic Fracturing Conference, the Woodlands, Texas, February 2012).
70 Kevin Fisher, Norm Warpinski, Pinnacle—A Haliburton Service, “Hydraulic Fracture–Height Growth: Real Data” (presented at the Society of Petroleum Engineers Technical Conference and Exhibition, Denver, Colorado, October 2011).
[1348] Report: “Information on Shale Resources, Development, and Environmental and Public Health Risks.” U.S. Government Accountability Office, September 5, 2012. <www.gao.gov>
Page 36:
As with conventional oil and gas development, emissions can also occur as faulty equipment or accidents, such as leaks or blowouts, release concentrations of methane and other gases into the atmosphere. For example, corrosion in pipelines or improperly tightened valves or seals can be sources of emissions. In addition, according to EPA [U.S. Environmental Protection Agency] officials, storage vessels for crude oil, condensate, or produced water are significant sources of methane, volatile organic compounds and hazardous air pollutant emissions.
Page 40:
Shale oil and gas development poses a risk to water quality from spills or releases of toxic chemicals and waste that can occur as a result of tank ruptures, blowouts, equipment or impoundment failures, overfills, vandalism, accidents (including vehicle collisions), ground fires, or operational errors. For example, tanks storing toxic chemicals or hoses and pipes used to convey wastes to the tanks could leak, or impoundments containing wastes could overflow as a result of extensive rainfall. According to New York Department of Environmental Conservation’s 2011 Supplemental Generic Environmental Impact Statement, spilled, leaked, or released chemicals or wastes could flow to a surface water body or infiltrate the ground, reaching and contaminating subsurface soils and aquifers. In August 2003, we reported that damage from oil and gas related spills on National Wildlife Refuges varied widely in severity, ranging from infrequent small spills with no known effect on wildlife to large spills causing wildlife death and long-term water and soil contamination.53
Drill cuttings, if improperly managed, also pose a risk to water quality. Drill cuttings brought to the surface during oil and gas development may contain naturally occurring radioactive materials (NORM),54 along with other decay elements (radium-226 and radium-228), according to an industry report presented at the Society of Petroleum Engineers Annual Technical Conference and Exhibition.55
Page 41:
The chemical additives in fracturing fluid, if not properly handled, also poses a risk to water quality if they come into contact with surface water or groundwater. Some additives used in fracturing fluid are known to be toxic, but data are limited for other additives. For example, according to reports we reviewed, operators may include diesel fuel—a refinery product that consists of several components, possibly including some toxic impurities such as benzene and other aromatics—as a solvent and dispersant in fracturing fluid. While some additives are known to be toxic, less is known about potential adverse effects on human health in the event that a drinking water aquifer was contaminated as a result of a spill or release of fracturing fluid, according to the 2011 New York Department of Environmental Conservation’s Supplemental Generic Environmental Impact Statement. This is largely because the overall risk of human health effects occurring from hydraulic fracturing fluid would depend on whether human exposure occurs, the specific chemical additives being used, and site-specific information about exposure pathways and environmental contaminant levels.
Pages 43–44:
Unlike shale oil and gas formations, water permeates coalbed methane formations, and its pressure traps natural gas within the coal. To produce natural gas from coalbed methane formations, water must be extracted to lower the pressure in the formation so the natural gas can flow out of the coal and to the wellbore. In 2000, USGS [U.S. Geological Survey] reported that water extracted from coalbed methane formations is commonly saline and, if not treated and disposed of properly, could adversely affect streams and threaten fish and aquatic resources.
According to several reports, handling and transporting toxic fluids or contaminants poses a risk of environmental contamination for all industries, not just oil and gas development; however, the large volume of fluids and contaminants—fracturing fluid, drill cuttings, and produced water—that is associated with the development of shale oil and gas poses an increased risk for a release to the environment and the potential for greater effects should a release occur in areas that might not otherwise be exposed to these chemicals.
Pages 45–46:
According to a number of studies and publications we reviewed, underground migration of gases and chemicals poses a risk of contamination to water quality.64 Underground migration can occur as a result of improper casing and cementing of the wellbore as well as the intersection of induced fractures with natural fractures, faults, or improperly plugged dry or abandoned wells. Moreover, there are concerns that induced fractures can grow over time and intersect with drinking water aquifers. Specifically:
• Improper casing and cementing. A well that is not properly isolated through proper casing and cementing could allow gas or other fluids to contaminate aquifers as a result of inadequate depth of casing,65 inadequate cement in the annular space around the surface casing, and ineffective cement that cracks or breaks down under the stress of high pressures. For example, according to a 2008 report by the Ohio Department of Natural Resources, a gas well in Bainbridge, Ohio, was not properly isolated because of faulty sealing, allowing natural gas to build up in the space around the production casing and migrate upward over about 30 days into the local aquifer and infiltrating drinking water wells.66 The risk of contamination from improper casing and cementing is not unique to the development of shale formations. Casing and cementing practices also apply to conventional oil and gas development. However, wells that are hydraulically fractured have some unique aspects. For example, hydraulically fractured wells are commonly exposed to higher pressures than wells that are not hydraulically fractured. In addition, hydraulically fractured wells are exposed to high pressures over a longer period of time as fracturing is conducted in multiple stages, and wells may be refractured multiple times—primarily to extend the economic life of the well when production declines significantly or falls below the estimated reservoir potential.
• Natural fractures, faults, and abandoned wells. If shale oil and gas development activities result in connections being established with natural fractures, faults, or improperly plugged dry or abandoned wells, a pathway for gas or contaminants to migrate underground could be created—posing a risk to water quality. These connections could be established through either induced fractures intersecting directly with natural fractures, faults, or improperly plugged dry or abandoned wells or as a result of improper casing and cementing that allow gas or other contaminants to make such connections. In 2011, the New York State Department of Environmental Conservation reported that operators generally avoid development around known faults because natural faults could allow gas to escape, which reduces the optimal recovery of gas and the economic viability of a well. However, data on subsurface conditions in some areas are limited. Several studies we reviewed report that some states are unaware of the location or condition of many old wells. As a result, operators may not be fully aware of the location of abandoned wells and natural fractures or faults.
[1349] Article: “Pollution Is Called a Byproduct of a ‘Clean’ Fuel.” By Brenda Goodman. New York Times, March 11, 2008. <www.nytimes.com>
It turned out to be an old chemical factory that had been converted into Alabama’s first biodiesel plant, a refinery that intended to turn soybean oil into earth-friendly fuel. …
But the oily sheen on the water returned again and again, and a laboratory analysis of a sample taken in March 2007 revealed that the ribbon of oil and grease being released by the plant—it resembled Italian salad dressing—was 450 times higher than permit levels typically allow, and that it had drifted at least two miles downstream.
The spills, at the Alabama Biodiesel Corporation plant outside this city about 17 miles from Tuscaloosa, are similar to others that have come from biofuel plants in the Midwest. The discharges, which can be hazardous to birds and fish, have many people scratching their heads over the seeming incongruity of pollution from an industry that sells products with the promise of blue skies and clear streams.
[1350] Statement of Lisa Jackson at the U.S. House Oversight and Government Reform Committee, May 24, 2011. <www.youtube.com>
Time marker 0:39: “I’m not aware of any proven case where the fracking process itself affected water, although there are investigations ongoing.”
[1351] Report: “Information on Shale Resources, Development, and Environmental and Public Health Risks.” U.S. Government Accountability Office, September 5, 2012. <www.gao.gov>
Pages 48–50:
Several government, academic, and nonprofit organizations evaluated water quality conditions or groundwater contamination incidents in areas experiencing shale oil and gas development. Among the studies and publications we reviewed that discuss the potential contamination of drinking water from the hydraulic fracturing process in shale formations are the following:
• In 2011, the Center for Rural Pennsylvania analyzed water samples taken from 48 private water wells located within about 2,500 feet of a shale gas well in the Marcellus Shale.71 The analysis compared predrilling samples to postdrilling samples to identify any changes to water quality. The analysis showed that there were no statistically significant increases in pollutants prominent in drilling waste fluids—such as total dissolved solids, chloride, sodium, sulfate, barium, and strontium—and no statistically significant increases in methane. The study concluded that gas well drilling had not had a significant effect on the water quality of nearby drinking water wells.
• In 2011, researchers from Duke University studied shale gas drilling and hydraulic fracturing and the potential effects on shallow groundwater systems near the Marcellus Shale in Pennsylvania and the Utica Shale in New York. Sixty drinking water samples were collected in Pennsylvania and New York from bedrock aquifers that overlie the Marcellus or Utica Shale formations—some from areas with shale gas development and some from areas with no shale gas development.72 The study found that methane concentrations were detected generally in 51 drinking water wells across the region—regardless of whether shale gas drilling occurred in the area—but that concentrations of methane were substantially higher closer to shale gas wells. However, the researchers reported that a source of the contamination could not be determined. Further, the researchers reported that they found no evidence of fracturing fluid in any of the samples.
• In 2011, the Ground Water Protection Council evaluated state agency groundwater investigation findings in Texas and categorized the determinations regarding causes of groundwater contamination resulting from the oil and gas industry.73 During the study period—from 1993 through 2008—multistaged hydraulic fracturing stimulations were performed in over 16,000 horizontal shale gas wells. The evaluation of the state investigations found that there were no incidents of groundwater contamination caused by hydraulic fracturing.
In addition, regulatory officials we met with from eight states—Arkansas, Colorado, Louisiana, North Dakota, Ohio, Oklahoma, Pennsylvania, and Texas—told us that, based on state investigations, the hydraulic fracturing process has not been identified as a cause of groundwater contamination within their states.
A number of studies discuss the potential contamination of water from the hydraulic fracturing process in shale formations. However, according to several studies we reviewed, there are insufficient data for predevelopment (or baseline) conditions for groundwater. Without data to compare predrilling conditions to postdrilling conditions, it is difficult to determine if adverse effects were the result of oil and gas development, natural occurrences, or other activities. In addition, while researchers have evaluated fracture growth, the widespread development of shale oil and gas is relatively new. As such, little data exist on (1) fracture growth in shale formations following multistage hydraulic fracturing over an extended time period, (2) the frequency with which refracturing of horizontal wells may occur, (3) the effect of refracturing on fracture growth over time,74 and (4) the likelihood of adverse effects on drinking water aquifers from a large number of hydraulically fractured wells in close proximity to each other.
Ongoing studies by federal agencies, industry groups, and academic institutions are evaluating the effects of hydraulic fracturing on water resources so that, over time, better data and information about these effects should become available to policymakers and the public. For example, EPA’s [U.S. Environmental Protection Agency] Office of Research and Development initiated a study in January 2010 to examine the potential effects of hydraulic fracturing on drinking water resources. According to agency officials, the agency anticipates issuing a progress report in 2012 and a final report in 2014. EPA is also conducting an investigation to determine the presence of groundwater contamination within a tight sandstone formation being developed for natural gas near Pavillion, Wyoming, and, to the extent possible, identify the source of the contamination. In December 2011, EPA released a draft report outlining findings from the investigation. The report is not finalized, but the agency indicated that it had identified certain constituents in groundwater above the production zone of the Pavillion natural gas wells that are consistent with some of the constituents used in natural gas well operations, including the process of hydraulic fracturing. DOE [U.S. Department of Energy] researchers are also testing the vertical growth of fractures during hydraulic fracturing to determine whether fluids can travel thousands of feet through geologic faults into water aquifers close to the surface.
71 The Center for Rural Pennsylvania, the Impact of Marcellus Gas Drilling on Rural Drinking Water Supplies (Harrisburg, Pennsylvania: October 2011).
72 Stephen G. Osborn, Avner Vengosh, Nathaniel R. Warner, and Robert B. Jackson, “Methane Contamination of Drinking Water Accompanying Gas-well Drilling and Hydraulic Fracturing,” Proceedings of the National Academy of Science 108, no. 20 (2011).
73 Ground Water Protection Council, State Oil and Gas Agency Groundwater Investigations And Their Role in Advancing Regulatory Reforms: A Two-State Review: Ohio and Texas (Oklahoma City, Oklahoma: August 2011).
[1352] Report: “An Evaluation of Fracture Growth and Gas/Fluid Migration as Horizontal Marcellus Shale Gas Wells Are Hydraulically Fractured in Greene County, Pennsylvania.” By Richard W. Hammack and others. U.S. Department of Energy, Office of Fossil Energy, September 15, 2014. <edx.netl.doe.gov>
Pages 1–2:
Executive Summary
This field study monitored the induced fracturing of six horizontal Marcellus Shale gas wells in Greene County, Pennsylvania. The study had two research objectives: 1) to determine the maximum height of fractures created by hydraulic fracturing at this location; and 2) to determine if natural gas or fluids from the hydraulically fractured Marcellus Shale had migrated 3,800 ft upward to an overlying Upper Devonian/Lower Mississippian gas field during or after hydraulic fracturing.
The Tully Limestone occurs about 280 ft above the Marcellus Shale at this location and is considered to be a barrier to upward fracture growth when intact. Microseismic monitoring using vertical geophone arrays located 10,288 microseismic events during hydraulic fracturing; about 40% of the events were above the Tully Limestone, but all events were at least 2,000 ft below producing zones in the overlying Upper Devonian/Lower Mississippian gas field, and more than 5,000 ft below drinking water aquifers.
Monitoring for evidence of fluid and gas migration was performed during and after the hydraulic fracturing of six horizontal Marcellus Shale gas wells. This monitoring program included: 1) gas pressure and production histories of three Upper Devonian/Lower Mississippian wells; 2) chemical and isotopic analysis of the gas produced from seven Upper Devonian/Lower Mississippian wells; 3) chemical and isotopic analysis of water produced from five Upper Devonian/Lower Mississippian wells; and 4) monitoring for perfluorocarbon tracers in gas produced from two Upper Devonian/Lower Mississippian wells.
Gas production and pressure histories from three Upper Devonian/Lower Mississippian gas wells that directly overlie stimulated, horizontal Marcellus Shale gas wells recorded no production or pressure increase in the 12-month period after hydraulic fracturing. An increase would imply communication with the over-pressured Marcellus Formation below.
Sampling to detect possible migration of fluid and gas from the underlying hydraulically fractured Marcellus Shale gas wells commenced 2 months prior to hydraulic fracturing to establish background conditions. Analyses have been completed for gas samples collected up to 8 months after hydraulic fracturing and for produced water samples collected up to 5 months after hydraulic fracturing. Samples of gas and produced water continue to be collected monthly (produced water) and bimonthly (gas) from seven Upper Devonian/Lower Mississippian gas wells.
Current findings are: 1) no evidence of gas migration from the Marcellus Shale; and 2) no evidence of brine migration from the Marcellus Shale.
Four perfluorocarbon tracers were injected with hydraulic fracturing fluids into 10 stages of a 14-stage, horizontal Marcellus Shale gas well during stimulation. Gas samples collected from two Upper Devonian/Lower Mississippian wells that directly overlie the tracer injection well were analyzed for presence of the tracer. No tracer was found in 17 gas samples taken from each of the two wells during the 2-month period after completion of the hydraulic fracturing.
Conclusions of this study are: 1) the impact of hydraulic fracturing on the rock mass did not extend to the Upper Devonian/Lower Mississippian gas field; and 2) there has been no detectable migration of gas or aqueous fluids to the Upper Devonian/Lower Mississippian gas field during the monitored period after hydraulic fracturing.
Page 9: “The base of the monitored zone is about 3,800 ft above the underlying horizontal Marcellus Shale gas wells while the top of the zone is at least 1,300 ft below the deepest known freshwater aquifer at the site.”
Page 13:
This study employed multiple lines of evidence to determine if fluids and gas from the hydraulically fractured Marcellus Shale had migrated at least 3,800 ft upward to a monitored conventional gas reservoir in the Upper Devonian and Lower Mississippian. This evidence was collected before, during, and after the hydraulic fracturing of six horizontal Marcellus Shale gas wells and included: 1) microseismic determination of the uppermost extent of the stress regime created by hydraulic fracturing; 2) pressure and production histories of Upper Devonian/Lower Mississippian wells; 3) chemical and isotopic analysis of the gas produced by Upper Devonian/Lower Mississippian wells; 4) chemical and isotopic analysis of water produced from Upper Devonian/Lower Mississippian wells (where fluid samples were available); and 5) monitoring for perfluorocarbon tracers in gas produced from two Upper Devonian/Lower Mississippian wells.