Please wait as we load hundreds of rigorously documented facts for you.
Please wait as we load hundreds of rigorously documented facts for you.

For example:

* Several U.S. government agencies—such as the Bureau of Economic Analysis, the Congressional Budget Office, the Census Bureau, and the White House Office of Management & Budget—publish measures of government spending. These sometimes differ from one another because of their accounting methods.[1] [2] [3]
* This research mainly uses data from the U.S. Bureau of Economic Analysis because it is the only primary source of comprehensive and timely data on government spending at all levels (federal, state, and local).[4] [5] [6]
* The U.S. Bureau of Economic Analysis presents most of its data on government spending in a measure called “current expenditures.” These account for about 97% of government “total expenditures.”[7] [8] [9]
* The figures in this research don’t account for:
* In keeping with Just Facts’ Standards of Credibility, all charts in this research show the full range of available data, and all facts are cited based upon availability and relevance, not to slant results by singling out specific years that are different from others.
* Federal government agencies sometimes divide federal spending into two main categories:
* In 2021, the federal government spent:
* In 2022, U.S. federal, state, and local governments spent a combined total of $8.7 trillion, or more precisely, $8,740,300,000,000.[24] This amounts to:
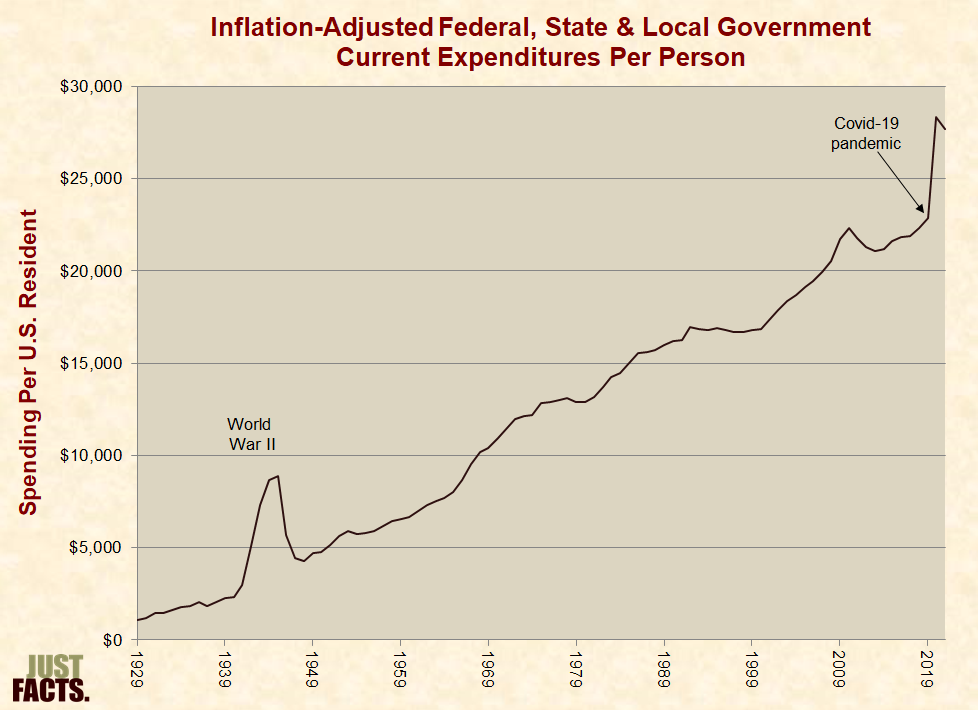
* From 1929 to 2021, inflation-adjusted federal, state and local government current expenditures per U.S. resident ranged from $1,101 to $28,333 per year, with a median of $12,820 and an average of $11,981. In 2021, they were $27,672, or 131% above the average:
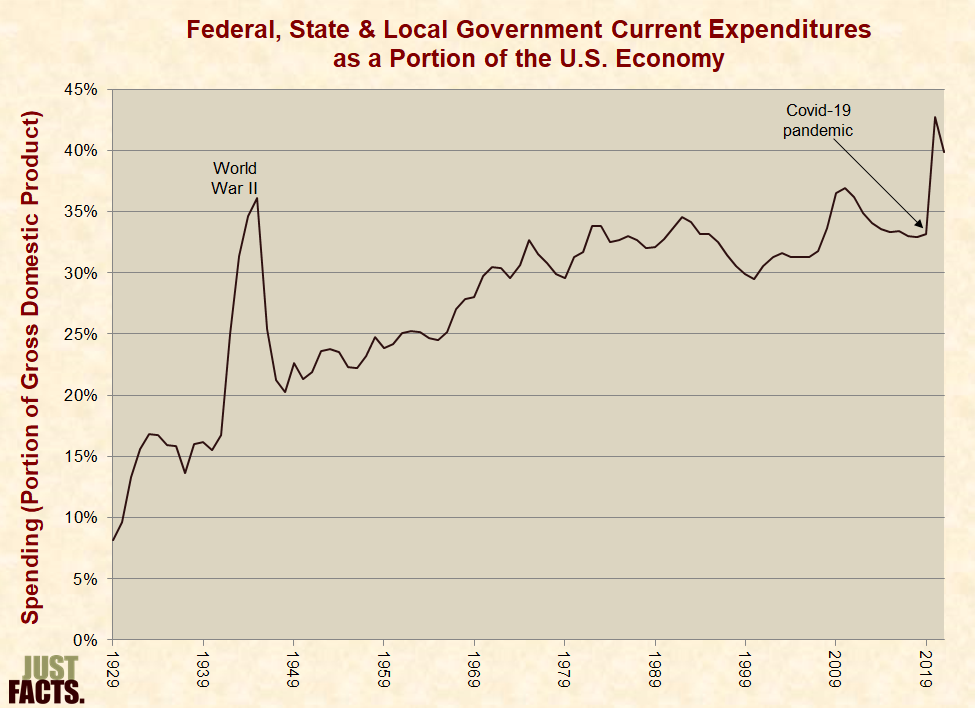
* From 1929 to 2021, federal, state and local government current expenditures ranged from 8.1% to 42.8% of the U.S. economy, with a median of 30.5% and an average of 27.9%. In 2021, they were 39.9%, or 43% above the average:
* In 2022, the U.S. federal government spent $6.2 trillion, or more precisely, $6,168,400,000,000.[36] This amounts to:
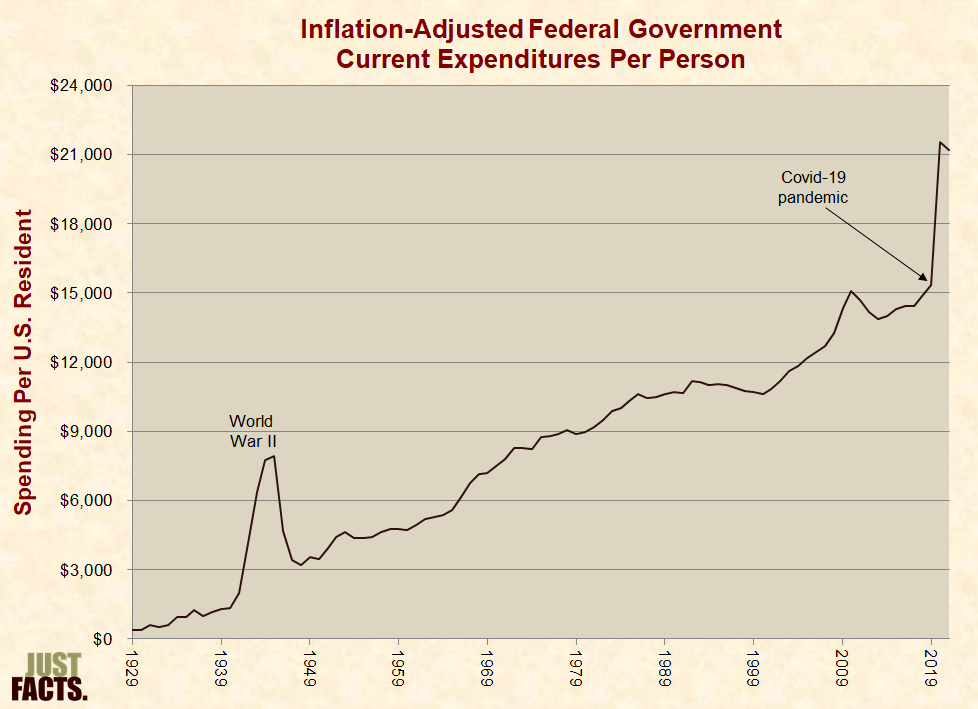
* From 1929 to 2021, inflation-adjusted federal government current expenditures per U.S. resident ranged from $376 to $21,547 per year, with a median of $8,738 and an average of $8,149. In 2021, they were $21,188, or 160% above the average:
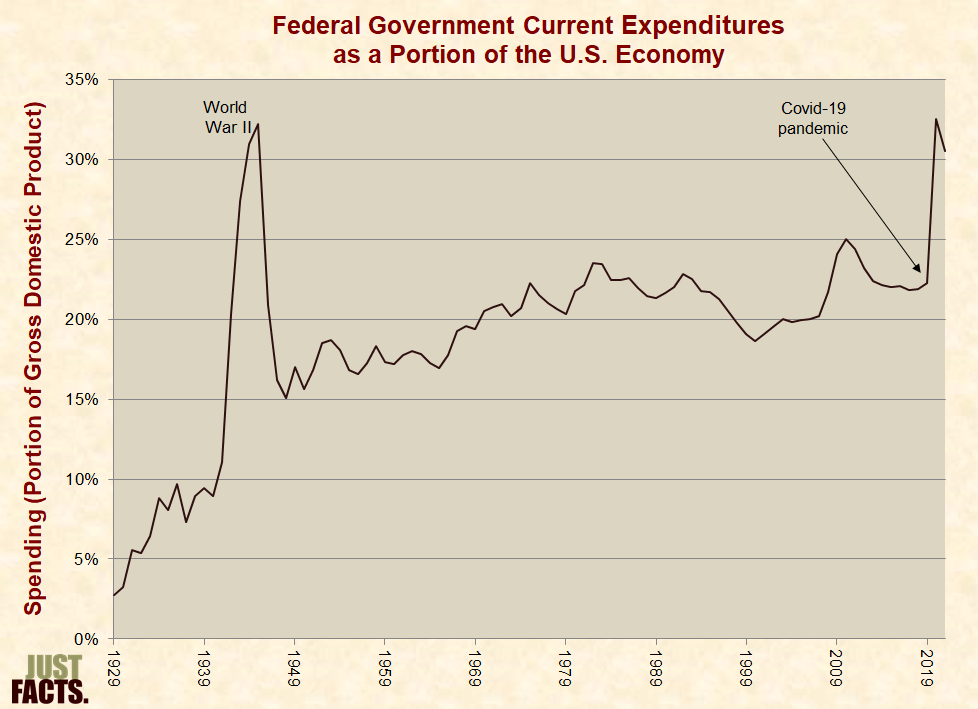
* From 1929 to 2021, federal government current expenditures ranged from 2.8% to 32.5% of the U.S. economy, with a median of 20.2% and an average of 19.0%. In 2021, they were 30.5% or 61% above the average:
* Excluding federal grants (which are counted under federal spending), state and local governments spent $2.6 trillion in 2022, or more precisely, $2,571,900,000,000.[48] This amounts to:
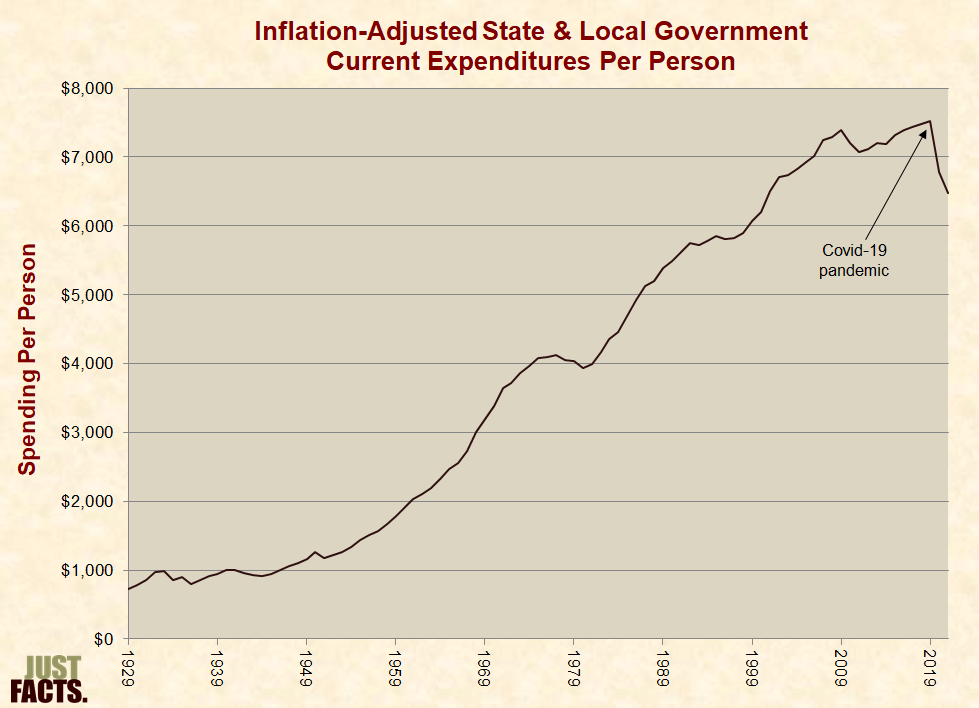
* From 1929 to 2021, inflation-adjusted state and local government current expenditures per U.S. resident ranged from $726 to $7,526 per year, with a median of $3,959 and an average of $3,832. In 2021, they were $6,484, or 69% above the average:
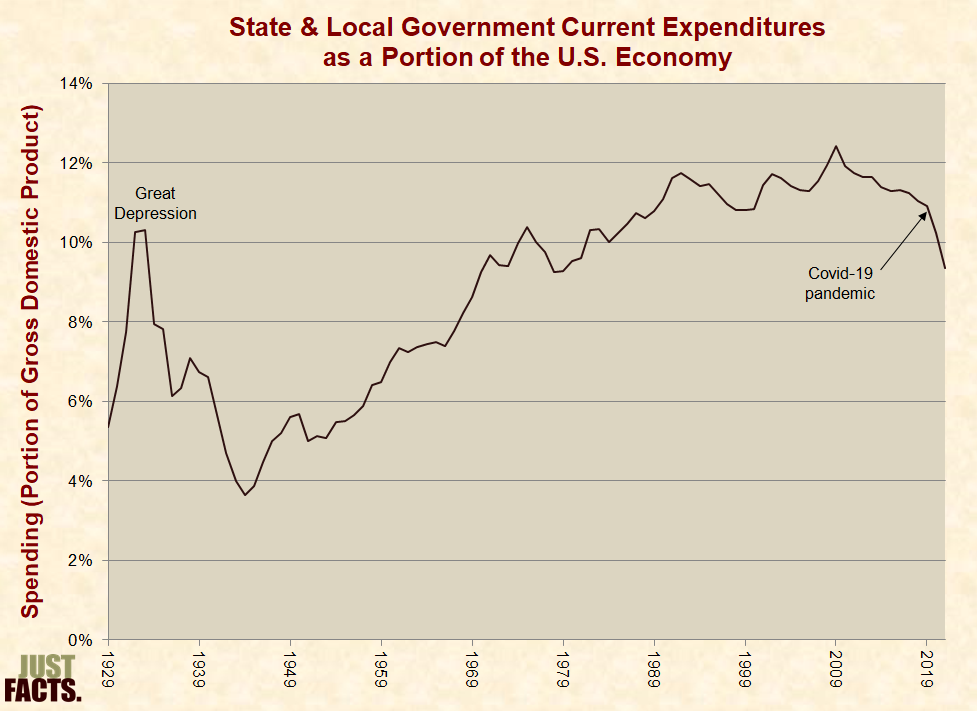
* From 1929 to 2021, state and local government current expenditures ranged from 3.7% to 12.4% of the U.S. economy, with a median of 9.6% and an average of 8.9%. In 2021, they were 9.3%, or 5% above the average:
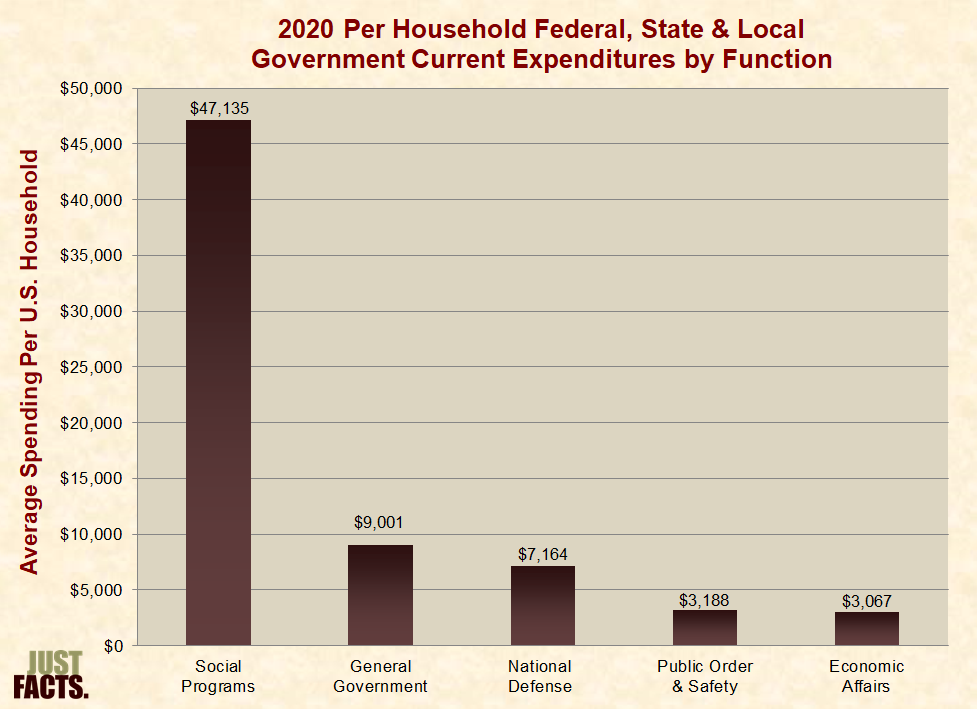
* During 2020, U.S. federal, state, and local government current expenditures for:
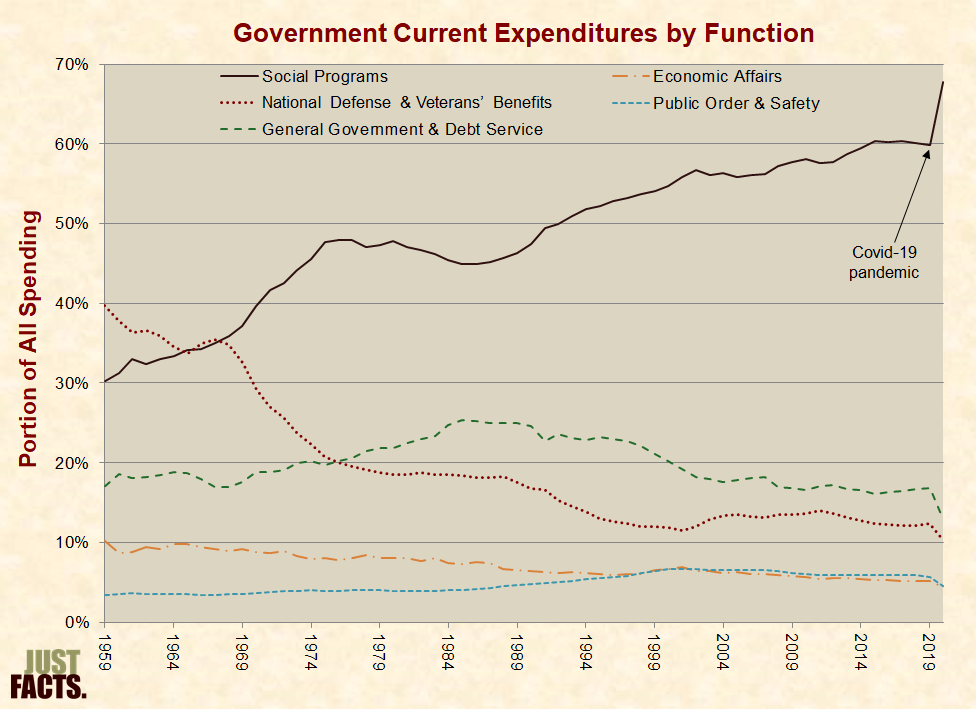
* From 1959 to 2020, the portion of U.S. federal, state, and local government current expenditures that were spent on:
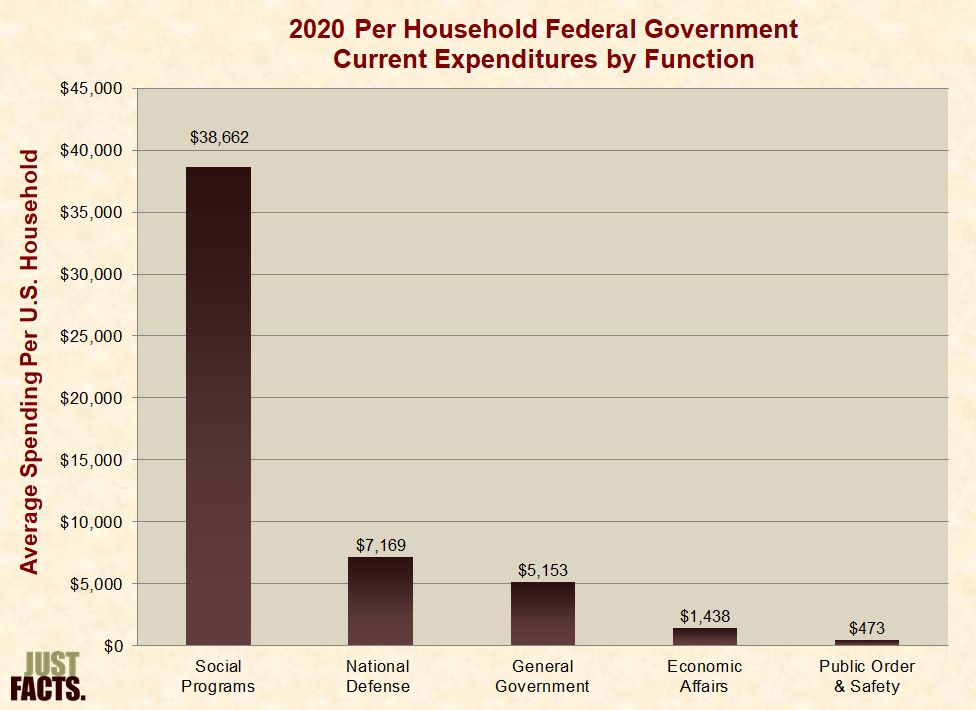
* During 2020, federal government current expenditures for:
* A scientific, nationally representative survey commissioned in 2020 by Just Facts found that 50% of voters believe social spending is not the main cause of rising national debt.[67] [68] [69]
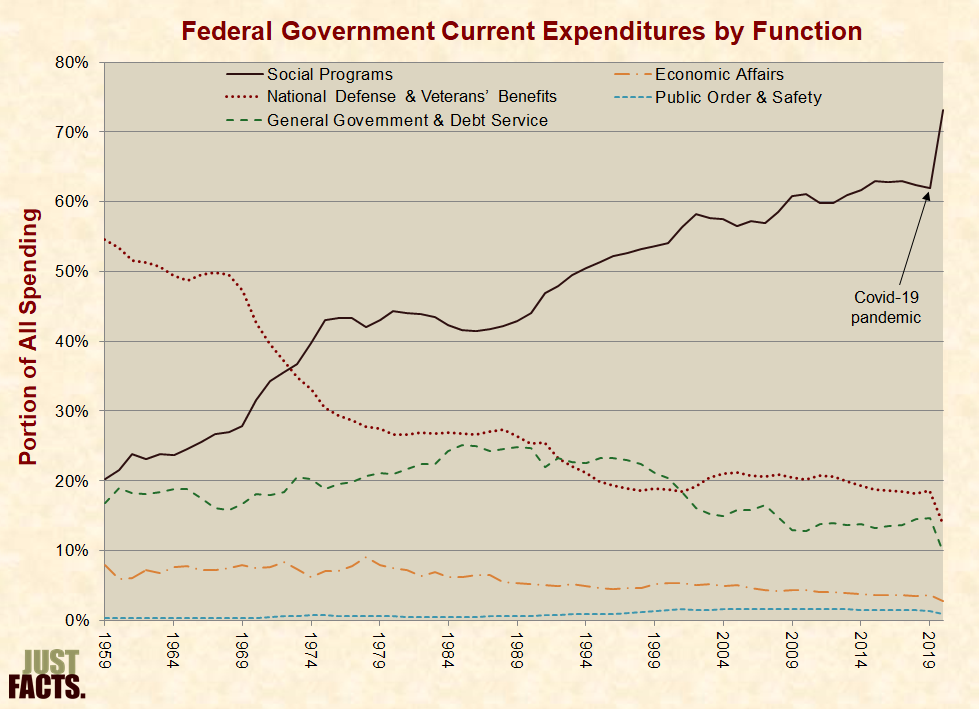
* From 1959 to 2020, the portion of federal government current expenditures that were spent on:
* Excluding federal grants (which are counted under federal spending), in 2020 U.S. state and local government current expenditures for:

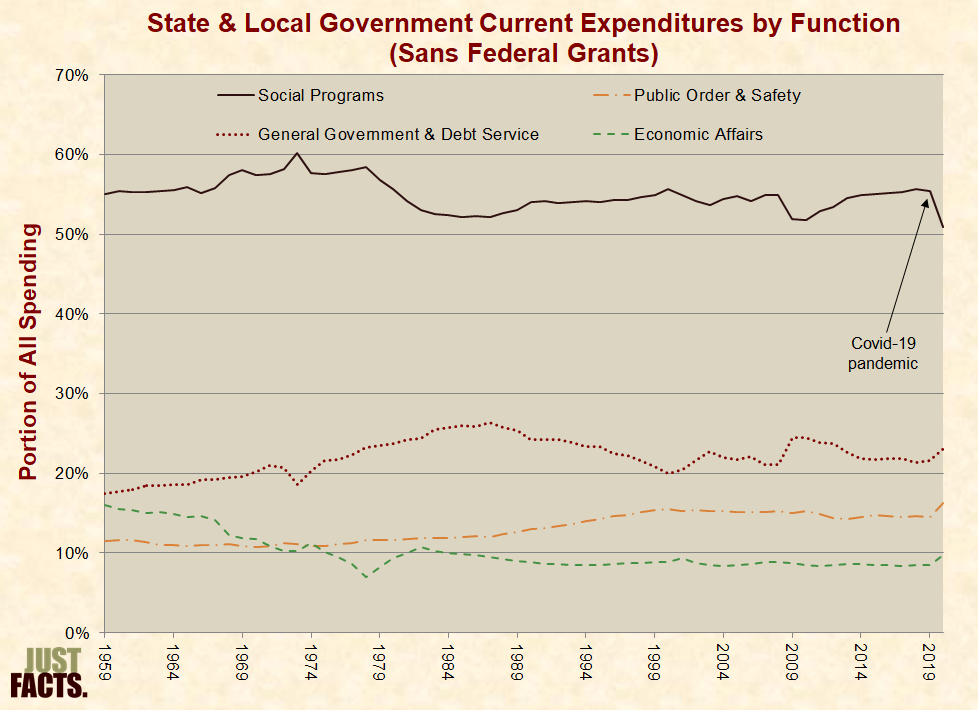
* Excluding federal grants (which are counted under federal spending), from 1959 to 2020, the portion of U.S. state and local government current expenditures that were spent on:
* Government social programs provide healthcare, income security, education, nutrition, housing, and cultural services.[80] [81] [82] [83]
* Some government agencies include veterans’ benefits in their measures of social spending, but Just Facts counts these as spending for national defense because they are earned for serving in the Armed Forces.[84]
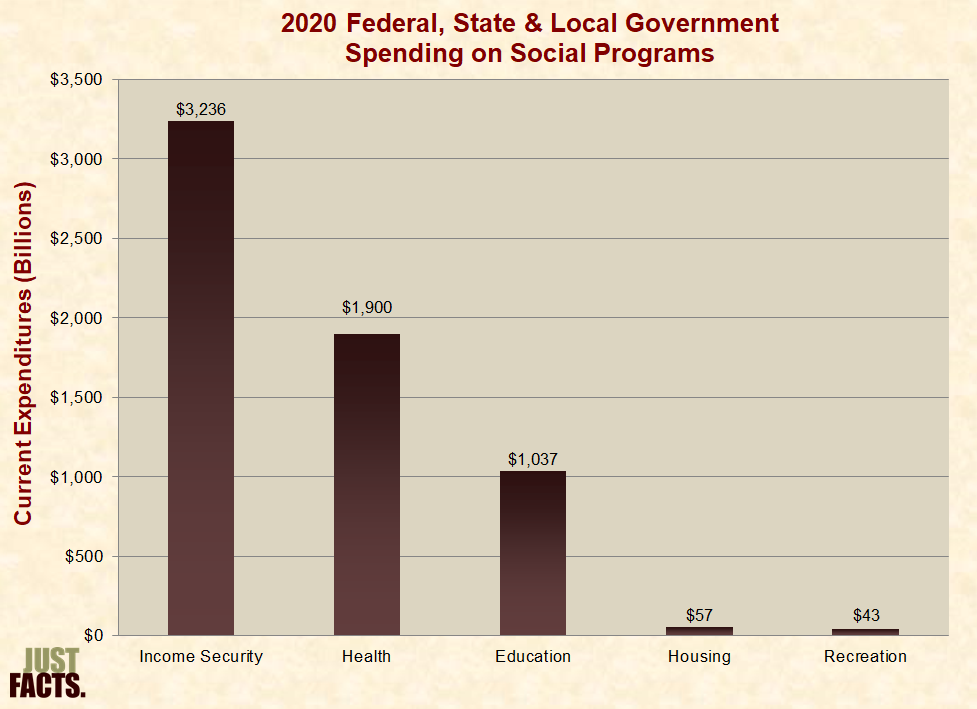
* In 2020, U.S. federal, state, and local governments spent $6,054 billion on social programs.[85] This amounts to:
* In 2020, federal, state, and local government spending on social programs were comprised of:
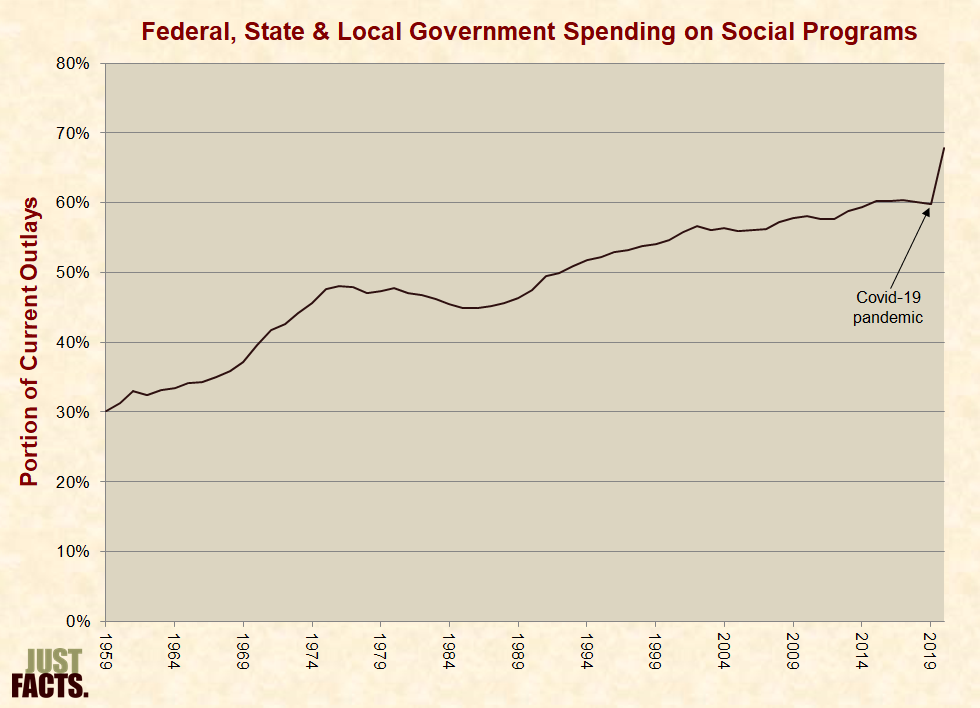
* From 1959 to 2020, spending on social programs increased from 30% of all federal, state, and local outlays to 68%:
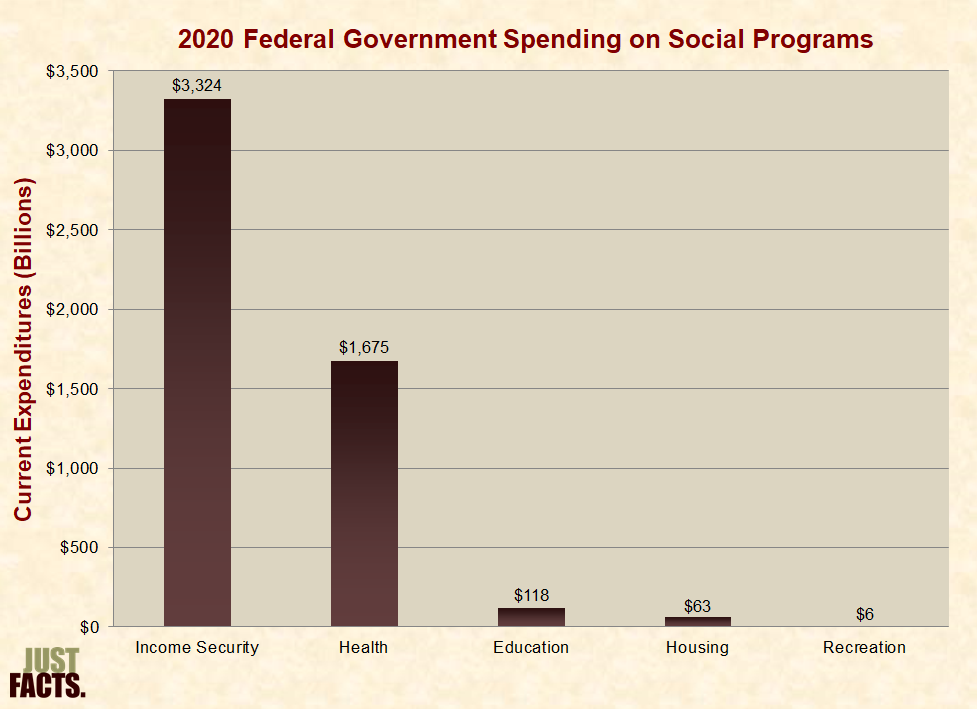
* In 2020, the U.S. federal government spent $4,966 billion on social programs.[91] This amounts to:
* In 2020, federal government spending on social programs was comprised of:
* From 1959 to 2020, spending on social programs increased from 20% of all federal outlays to 73%:

* Excluding federal grants (which are counted under federal spending), in 2020 U.S. state and local governments spent $1,088 billion on social programs.[97] This amounts to:
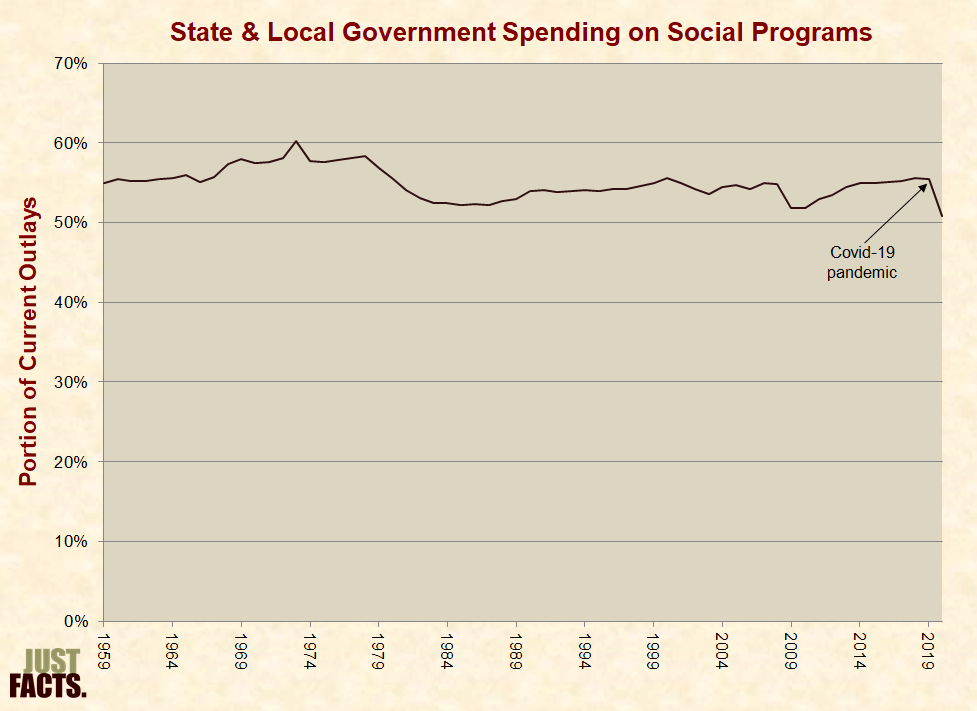
* From 1959 to 2020, spending on social programs (excluding federal grants) increased from 55% of all state and local outlays to 60%, then decreased to 51%:
* General government spending funds:
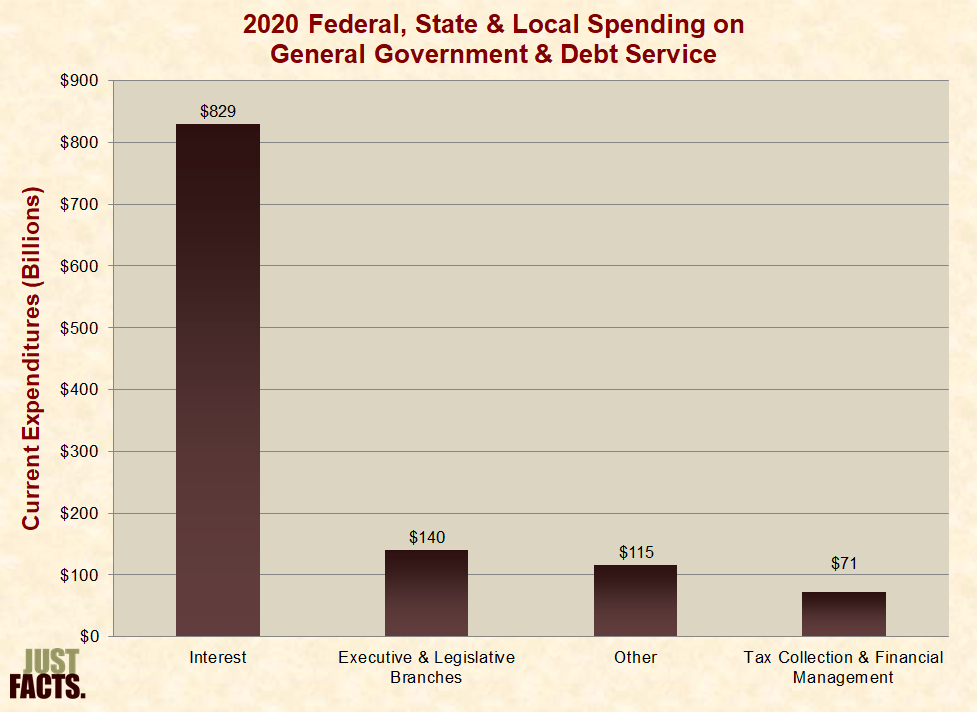
* In 2020, U.S. federal, state, and local governments spent $1,156 billion on general government and debt service.[103] This amounts to:
* In 2020, federal, state, and local government spending on general government and debt service were comprised of:
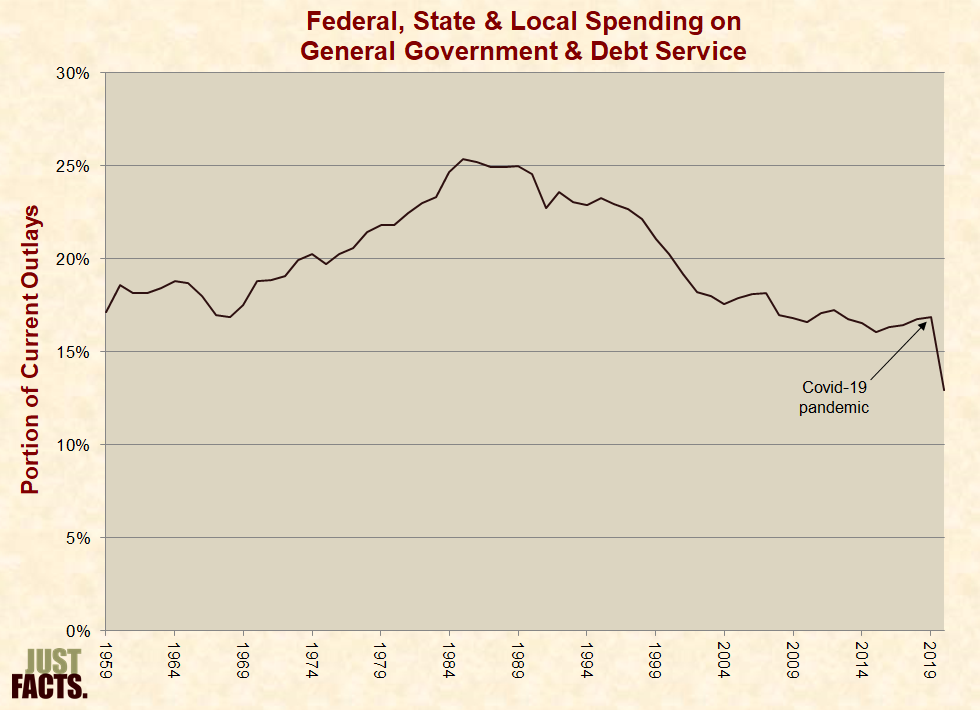
* From 1959 to 2020, spending on general government and debt service increased from 17% of all federal, state, and local outlays to 25%, then decreased to 13%:
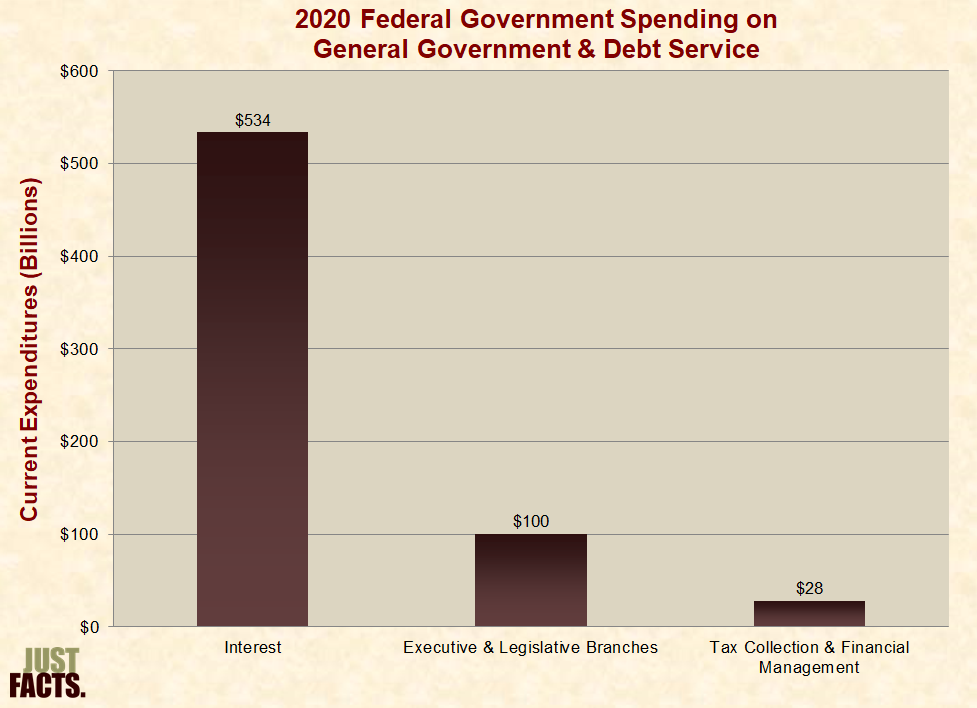
* In 2020, the U.S. federal government spent $662 billion on general government and debt service.[109] This amounts to:
* In 2020, federal government spending on general government and debt service was comprised of:
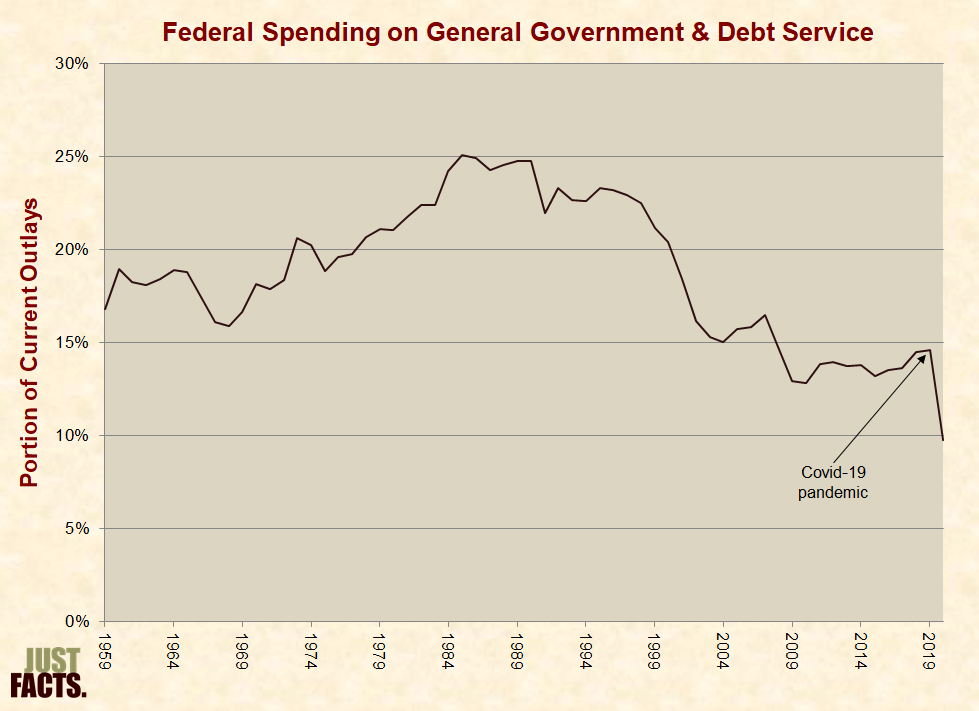
* From 1959 to 2020, spending on general government and debt service increased from 17% of all federal outlays to 25%, then decreased to 10%:
* Excluding federal grants (which are counted under federal spending), in 2020 U.S. state and local governments spent $494 billion on general government and debt service.[115] This amounts to:
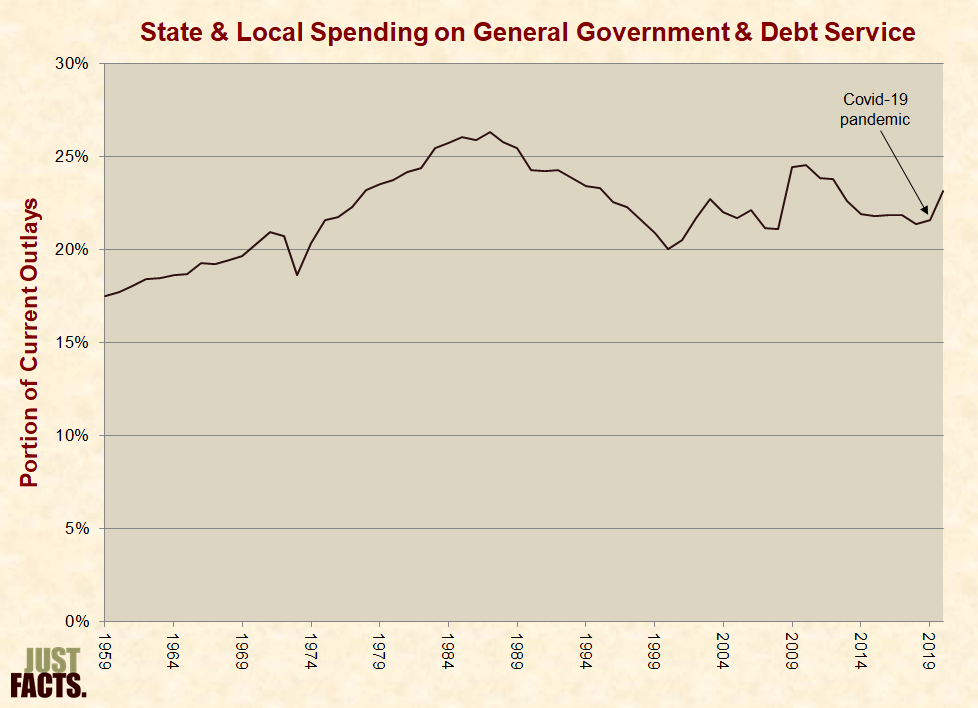
* From 1959 to 2020, spending on general government and debt service (excluding federal grants) increased from 17% of all state and local outlays to 26%, then decreased to 23%:
* National defense spending funds:
* In 2020, the U.S. federal government spent $921 billion on national defense.[122] This amounts to:
* In 2020, federal spending on national defense was comprised of:

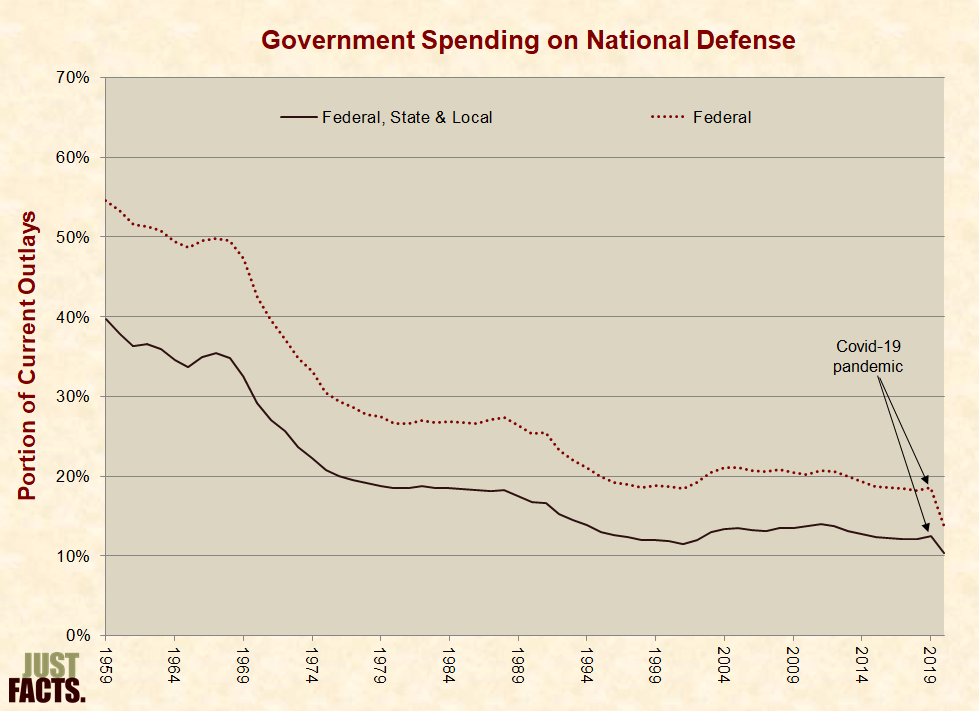
* From 1959 to 2020, spending on national defense decreased from 55% of all federal outlays to 14% and from 40% of all federal, state, & local government outlays to 10%:
* Government spending on public order and safety funds the police, fire protection, law courts, prisons, and immigration enforcement.[128] [129]
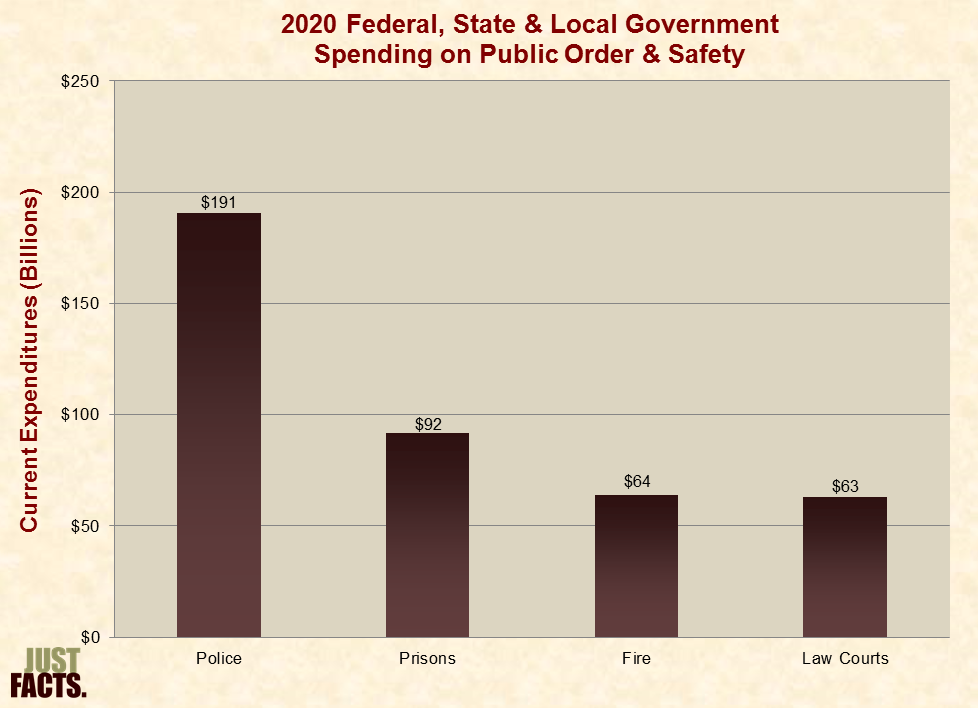
* In 2020, U.S. federal, state, and local governments spent $410 billion on public order and safety.[130] This amounts to:
* In 2020, federal, state, and local government spending on public order and safety were comprised of:
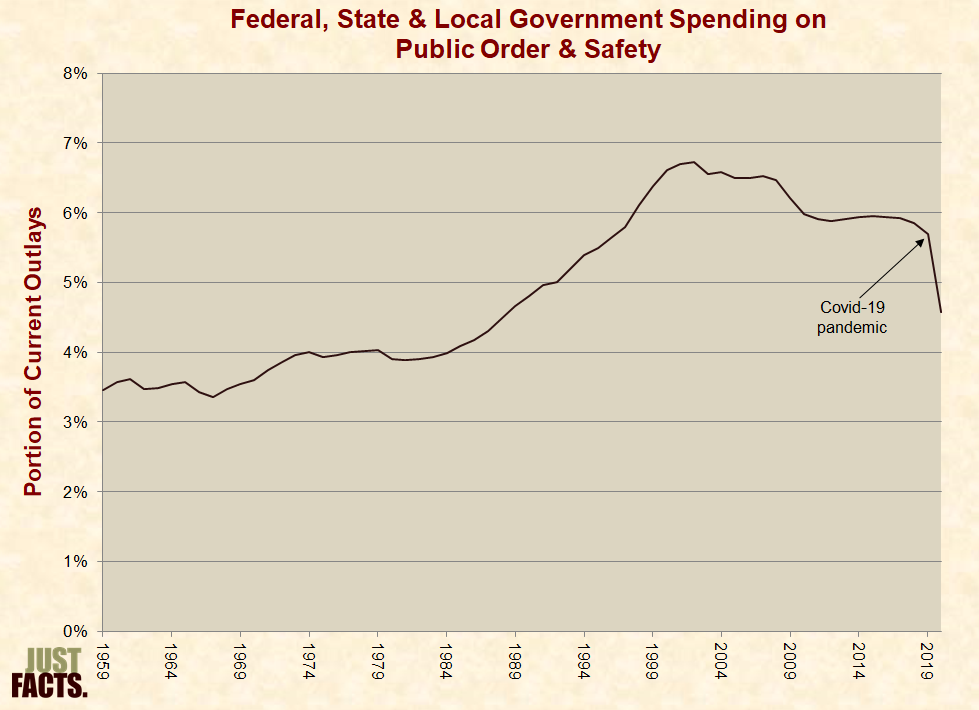
* From 1959 to 2020, spending on public order and safety increased from 3% of all federal, state, and local outlays to 7%, then decreased to 5%:
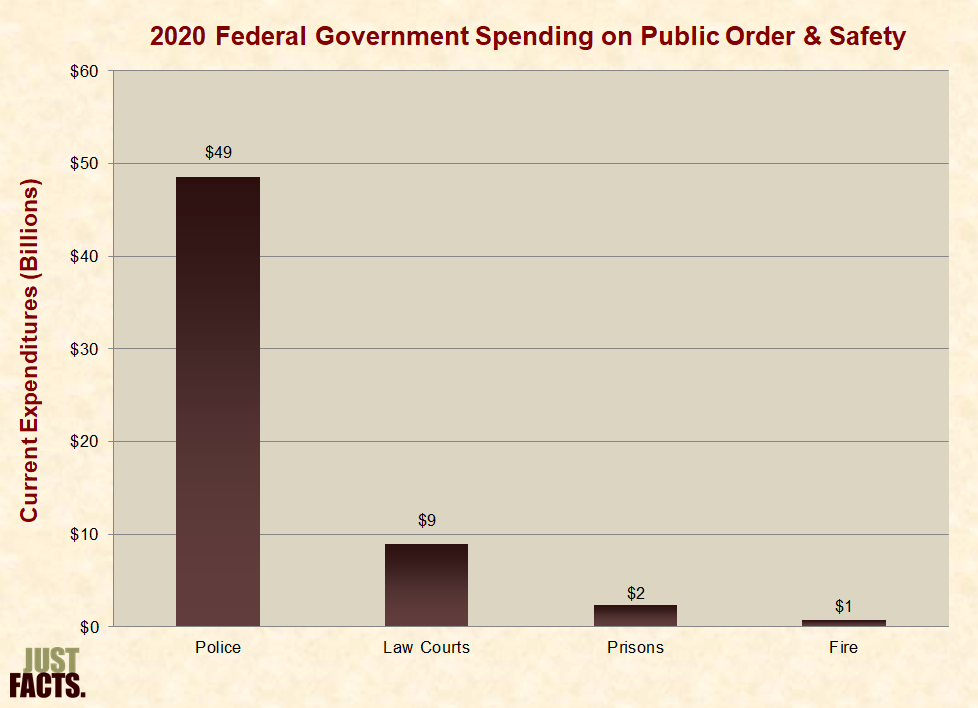
* In 2020, the U.S. federal government spent $61 billion on public order and safety.[136] This amounts to:
* In 2020, federal government spending on public order and safety was comprised of:
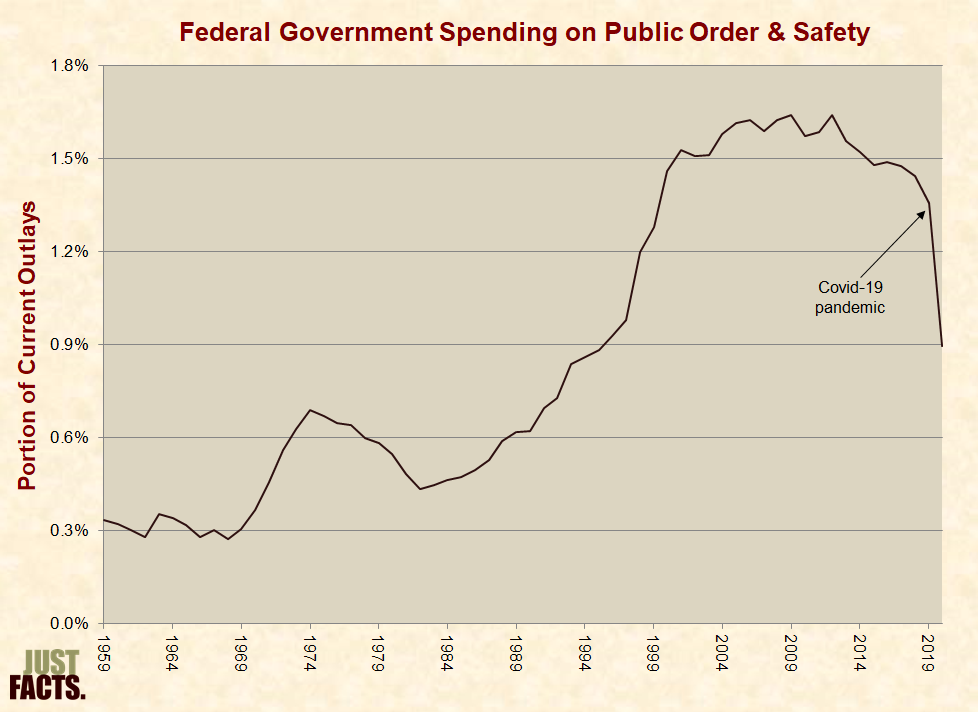
* From 1959 to 2020, spending on public order and safety increased from 0.3% of all federal outlays to 1.6%, then decreased to 0.9%:
* Excluding federal grants (which are counted under federal spending), in 2020 U.S. state and local governments spent $349 billion on public order and safety.[142] This amounts to:
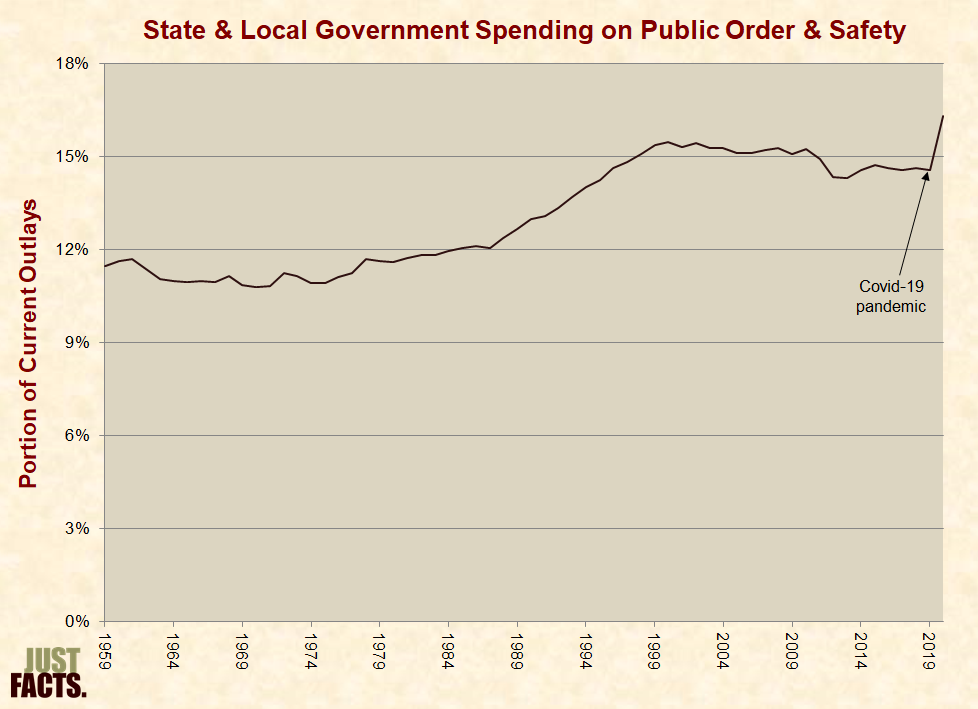
* From 1959 to 2020, spending on public order and safety (excluding federal grants) increased from 11% of all state and local outlays to 16%:
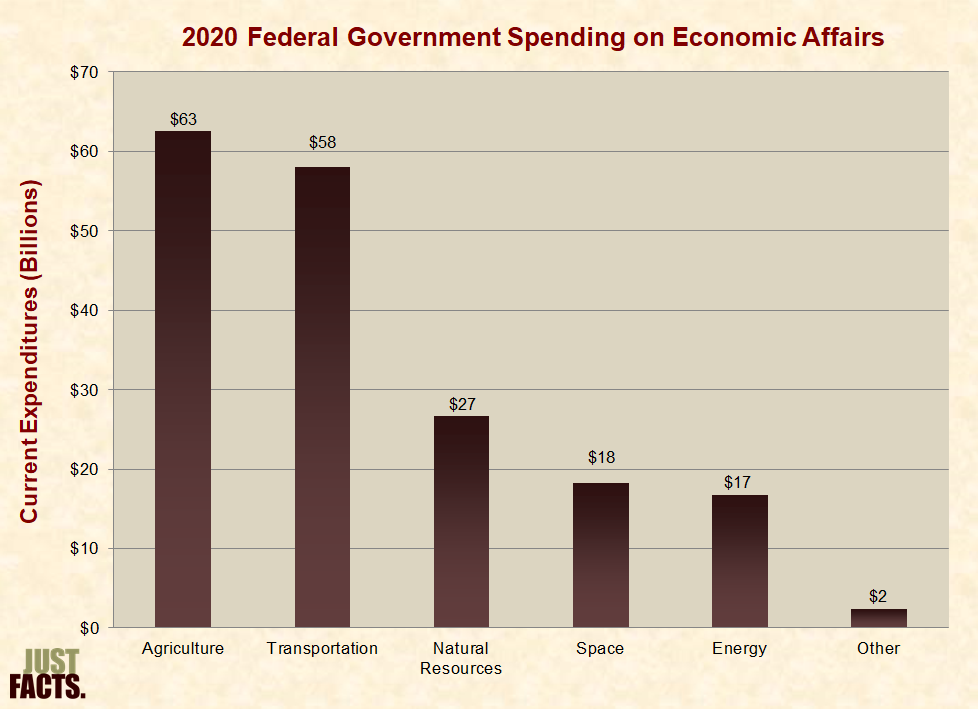
* Government spending on economic affairs funds:
* Some government agencies include federal spending for the Covid-19 Paycheck Protection Program and other pandemic programs as “general economic and labor affairs,”[148] but Just Facts includes these as social spending in accord with definitions of the term by government agencies and academic publications.[149]
* In 2020, U.S. federal, state, and local governments spent $394 billion on economic affairs.[150] This amounts to:
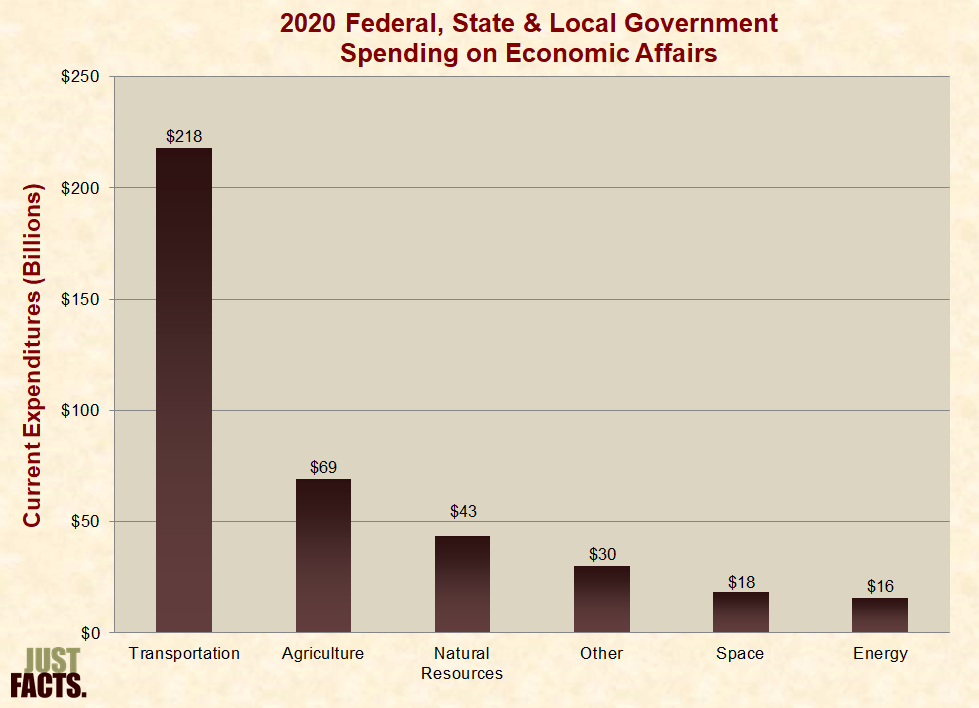
* In 2020, federal, state, and local government spending on economic affairs were comprised of:
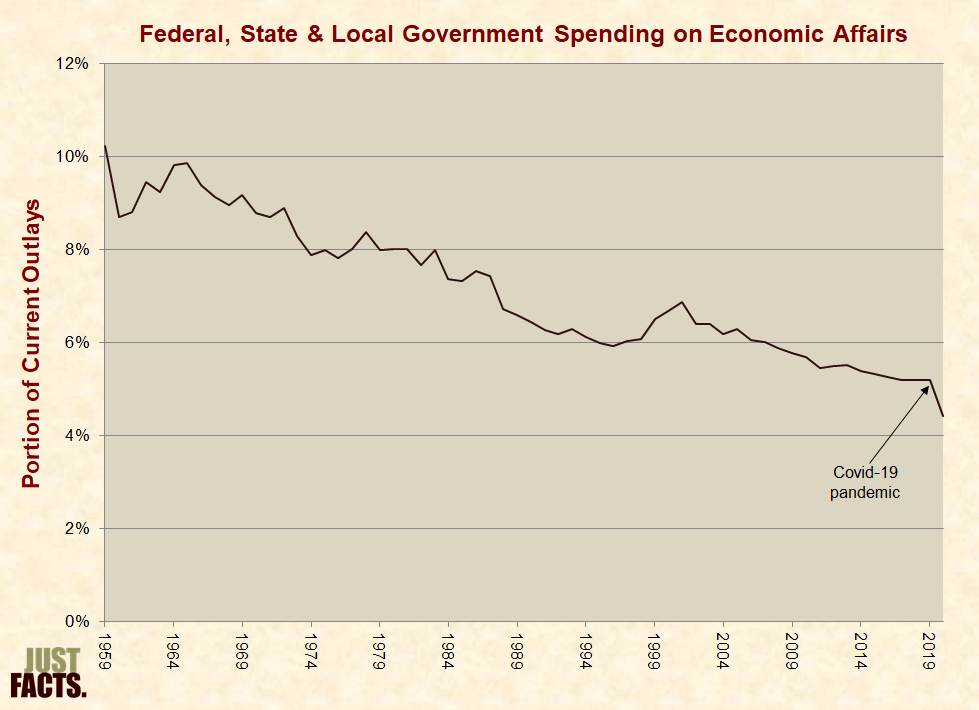
* From 1959 to 2020, spending on economic affairs decreased from 10% of all federal, state, and local outlays to 4%:
* In 2020, the U.S. federal government spent $185 billion on economic affairs.[156] This amounts to:
* In 2020, federal government spending on economic affairs was comprised of:
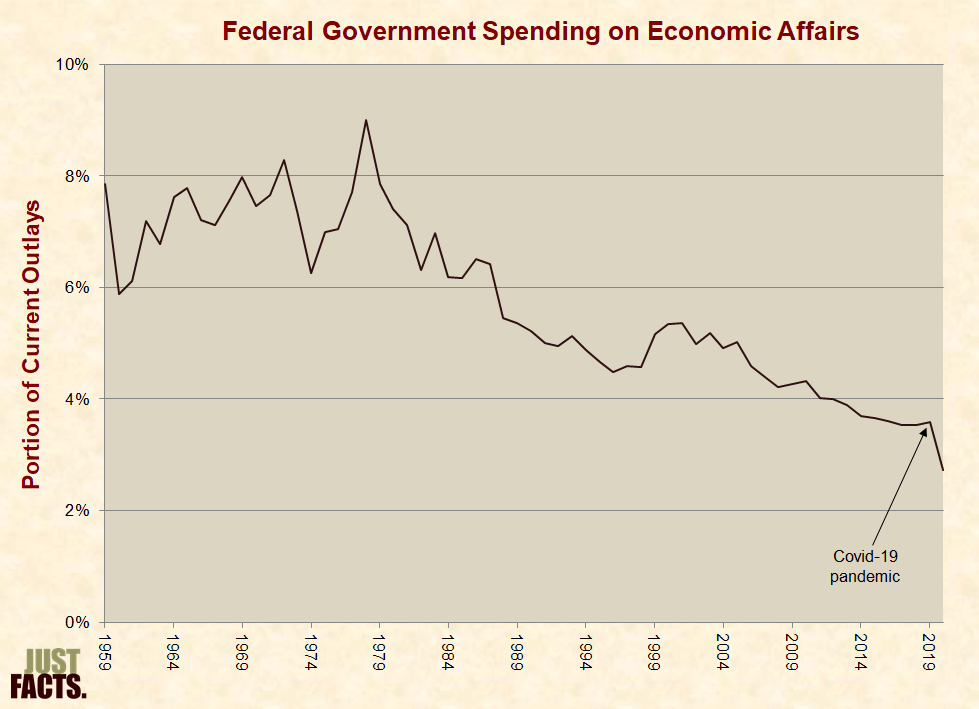
* From 1959 to 2020, spending on economic affairs decreased from 8% of all federal outlays to 3%:
* Excluding federal grants (which are counted under federal spending), in 2020 U.S. state and local governments spent $209 billion on economic affairs.[162] This amounts to:
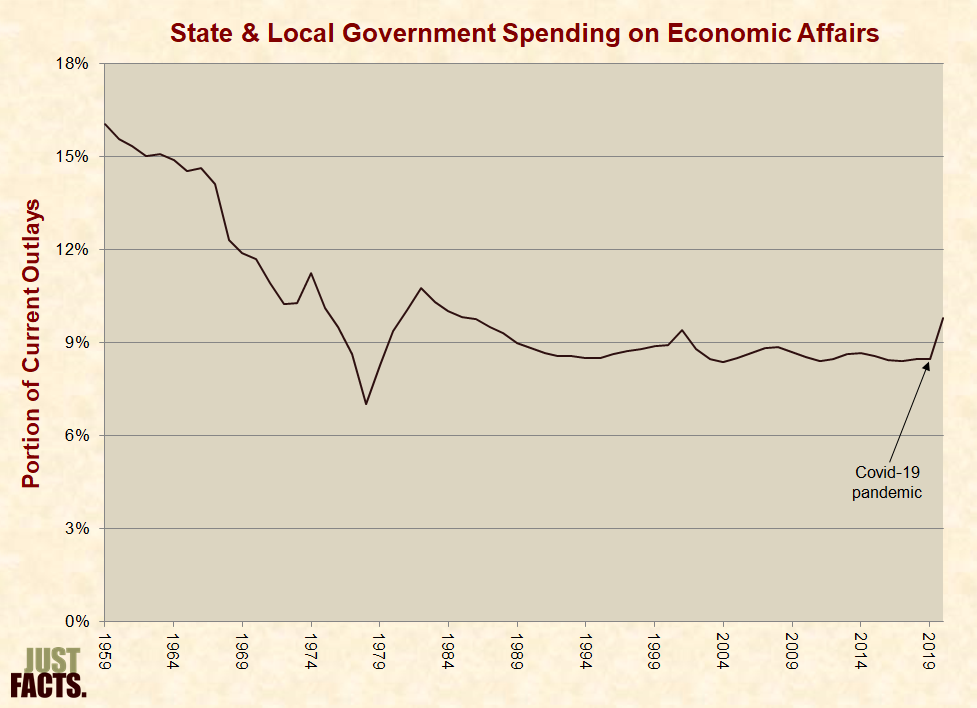
* From 1959 to 2020, spending on economic affairs decreased from 16% of all state and local outlays to 10%:
[1] Webpage: “BEA Seems to Have Several Different Measures of Government Spending. What Are They for and What Do They Measure?” U.S. Bureau of Economic Analysis, May 28, 2010. Last modified 4/28/20. <www.bea.gov>
In addition to these [Bureau of Economic Analysis’s (BEA)] NIPA [National Income and Product Accounts] measures of government spending, other data on government spending include federal budget data and Census Government Finances data from the Census Bureau. These other measures use different concepts that result in differences in level, timing, and the composition of spending than the statistics shown in the NIPAs. The NIPA measures are often used by macroeconomists and others because of the consistency of concepts and definitions in the national accounts, which aid in forecasting the economy, taxes, and budgets. To facilitate such uses, the [White House] Office of Management and Budget and BEA each publish an annual reconciliation of the federal budget with the NIPA measures of federal spending (NIPA Table 3.18B).
[2] Report: “Fiscal Year 2013 Analytical Perspectives, Budget Of The U.S. Government.” White House Office of Management and Budget, February 12, 2012. <www.gpo.gov>
Page 471:
Federal transactions in the [Bureau of Economic Analysis’s] NIPAs [National Income and Product Accounts] are measured according to NIPA accounting concepts and as a result they differ from the [White House Office of Management & Budget’s] budget in netting and grossing, timing, and coverage. …
Over the period 1994–2010, NIPA current expenditures averaged 3.7 percent higher than budget outlays, while NIPA current receipts averaged 3.4 percent higher than budget receipts. Including capital transfers and net investment, NIPA total expenditures averaged 6.4 percent higher than budget outlays, while NIPA total receipts averaged 4.6 percent higher than budget receipts.
[3] Report: “Monthly Budget Review: Summary for Fiscal Year 2021.” Congressional Budget Office, November 8, 2021. <www.cbo.gov>
Page 5: “Net spending by the government was $6.8 trillion in 2021—$266 billion (or 4 percent) more than in 2020. Spending in both years was roughly 50 percent greater than in 2019. Outlays were 30.5 percent of GDP [gross domestic product] in 2021, less than the 31.3 percent in 2020 but much higher than the 50-year average of 20.8 percent.”
[4] Webpage: “Government Receipts and Expenditures.” U.S. Bureau of Economic Analysis, May 26, 2022. <www.bea.gov>
“Receipts and expenditures tables labeled ‘government’ combine federal, state, and local activities. Data also are produced for the federal government, and for state and local governments combined. BEA [Bureau of Economic Analysis] produces the only comprehensive estimates of state and local government activity available on a timely basis.”
[5] Report: “A Primer on BEA’s Government Accounts.” By Bruce E. Baker and Pamela A. Kelly. U.S. Bureau of Economic Analysis, March 2008. <apps.bea.gov>
Page 29: “The federal estimates in the [Bureau of Economic Analysis’s] NIPAs [National Income and Product Accounts] contain much of the same information as the Budget of the United States Government, although the information is classified differently. The state and local estimates in the NIPAs are the only comprehensive estimates of state and local government activity available on a timely basis.”
[6] Webpage: “BEA Seems to Have Several Different Measures of Government Spending. What Are They for and What Do They Measure?” U.S. Bureau of Economic Analysis, May 28, 2010. Last modified 4/28/20. <www.bea.gov>
“The [U.S. Bureau of Economic Analysis’s (BEA)] NIPA [National Income and Product Accounts] measures [of government spending] are often used by macroeconomists and others because of the consistency of concepts and definitions in the national accounts, which aid in forecasting the economy, taxes, and budgets.”
[7] The Bureau of Economic Analysis presents its primary breakdown of government spending by function in current expenditures,† not total expenditures.‡ Also, the Bureau of Economic Analysis’s data on government current expenditures date back to 1929, while its data on total expenditures only date back to 1959.§
NOTES:
[8] “Current expenditures” include “all spending by government on current-period activities,” such as:
“Total expenditures” include all current expenditures plus:
NOTES:
[9] Calculated with the dataset: “Table 3.1. Government Current Receipts and Expenditures [Billions of Dollars].” U.S. Bureau of Economic Analysis. Last revised May 26, 2022. <apps.bea.gov>
“2021 …Total expenditures [=] 9,405.8 … Current expenditures [=] 9,170.0”
CALCULATION: 9,170.0 / 9,405.8 = 97%
[10] For wide-ranging examples, see Just Facts’ research on social spending.
[11] Article: “Spending in Disguise.” By Donald B. Marron (director of the Tax Policy Center and former acting director of the Congressional Budget Office). National Affairs, Summer 2011. <www.nationalaffairs.com>
A great deal of government spending is hidden in the federal tax code in the form of deductions, credits, and other preferences—preferences that seem like they let taxpayers keep their own money, but are actually spending in disguise. …
To illustrate, consider a dilemma that President Obama faced in constructing his 2012 budget. …
… The president thus structured his special, one-time payment as a $250 refundable tax credit for any retiree who did not qualify for Social Security. In Beltway parlance, he offered these men and women a tax cut.
But was it really a tax cut? The president’s $250 credit would have the same budgetary, economic, and distributional effects as his $250 boost in Social Security benefits. Both would deliver extra money to retirees, and both would finance those payments by adding to America’s growing debt. One benefit would arrive as a Social Security check, the other as a reduced tax payment or a refund. These superficial differences aside, however, the proposed tax credit would be, in effect, a spending increase.
[12] Report: “Estimates of Federal Tax Expenditures.” Joint Committee on Taxation, March 14, 1978. <www.jct.gov>
Pages 1–2:
The Concept of Tax Expenditures
Tax expenditure data are intended to show the cost to the Federal Government, in terms of revenues it has foregone, from tax provisions that either have been enacted as incentives for the private sector of the economy or have that effect even though initially having a different objective. The tax incentives usually are designed to encourage certain kinds of economic behavior as an alternative to employing direct expenditures or loan programs to achieve the same or similar objectives. These provisions take the form of exclusions, deductions, credits, preferential tax rates, or deferrals of tax liability. Tax expenditures also are analogous to uncontrolled expenditures made through individual entitlement programs because the taxpayer who can meet the criteria specified in the Internal Revenue Code may use the provision indefinitely without any further action by the Federal Government. This is possible because provisions in the Internal Revenue Code rarely have expiration dates that would require specific congressional action to continue the availability of the tax provision. For many provisions, the revenue loss is determined by the taxpayer’s level of income and his tax rate bracket. From the viewpoint of the budget process, fiscal policy and the allocation of resources, uncontrollable outlays or receipts restrict the range of adjustments that can be made in public policy. One of the initial purposes of the enumeration of tax expenditures was to provide Congress with the information it would need to select between a tax or an outlay approach to accomplish a goal of public policy.
[13] Report: “Estimates of Federal Tax Expenditures for Fiscal Years 2012–2017.” Joint Committee on Taxation, February 1, 2013. <www.govinfo.gov>
Individual Income Tax
Under the Joint Committee staff methodology, the normal structure of the individual income tax includes the following major components: one personal exemption for each taxpayer and one for each dependent, the standard deduction, the existing tax rate schedule, and deductions for investment and employee business expenses. Most other tax benefits to individual taxpayers are classified as exceptions to normal income tax law.
The Joint Committee staff views the personal exemptions and the standard deduction as defining the zero-rate bracket that is a part of normal tax law. An itemized deduction that is not necessary for the generation of income is classified as a tax expenditure, but only to the extent that it, when added to a taxpayer’s other itemized deductions, exceeds the standard deduction.
[14] Email from the U.S. Bureau of Economic Analysis to Just Facts, September 6, 2018.
With regard to Table 3.12 [Government Social Benefits], most tax policies and “tax preferences” affect NIPA [National Income and Product Accounts] estimates only by how they affect tax receipts. For example, the tax exclusion for employer-provided health insurance would show up in the NIPAs as lower taxes received from businesses. Only refundable personal tax credits are treated differently—we classify the full amount of these credits as social benefits, not as a reduction in tax receipts.
[15] Report: “Overview of the Federal Tax System in 2022.” By Molly F. Sherlock and Donald J. Marples. Congressional Research Service. Updated June 8, 2022. <fas.org>
Page 8: “If a tax credit is refundable, and the credit amount exceeds tax liability, a taxpayer receives the credit (or a portion of the credit) as a refund. … Some credits are phased out as income rises to limit or eliminate benefits for higher-income taxpayers.”
[16] Report: “Preview of the 2015 Annual Revision of the National Income and Product Accounts.” By Stephanie H. McCulla and Shelly Smith. U.S. Bureau of Economic Analysis, June 2015. <apps.bea.gov>
Page 2:
Federal Refundable Tax Credits
Federal income tax credits allow taxpayers who meet certain eligibility criteria to reduce the amount they are required to pay in federal income taxes. A tax credit is considered to be “refundable” if any excess of the tax credit over a taxpayer’s total tax liability is paid to the taxpayer as a refund. In contrast, tax credits are considered to be “nonrefundable” if taxpayers can only claim the credit up to the amount of their tax liability.1 Examples of refundable tax credits include the earned income tax credit and the temporary “Making Work Pay” tax credit (see table C).
|
Table C. Federal Refundable Tax Credit Programs |
|
|
Major Programs |
Program Dates |
|
Earned Income Tax Credit |
1975–present |
|
Additional Child Tax Credit |
1998–present |
|
2008 Economic Stimulus Payments |
2008 |
|
American Opportunity Tax Credit |
2009–present |
|
Making Work Pay Tax Credit |
2010–2011 |
|
Health Insurance Premium Assistance Credits |
2014–present |
Current treatment. In the NIPAs [national income and product accounts], the portion of refundable tax credits that is not directly paid to taxpayers as refunds (that is, the amount up to, but not exceeding, the total liability) is recorded as a reduction in the income taxes paid by persons to the federal government, and the portion that is paid to taxpayers as refunds (that is, any excess of the credit over the liability) is recorded as a government social benefit. This treatment provides an accurate picture of actual tax revenues and payments, but it obscures the full costs and benefits of government tax policies; that is, households not only receive the amount by which tax credits exceed their tax liabilities—but they are also relieved of the associated liabilities. Similarly, the government not only pays the refunds, but it also relinquishes its claim on the associated tax liabilities.
New treatment. As part of this annual revision, the NIPAs will record the full value of the liabilities and the credits associated with refundable tax credit programs administered by the federal government in the accounts for personal income and outlays and for federal government receipts and expenditures.2 This change will improve the consistency of the NIPAs with the System of National Accounts 2008, the international guidelines for national economic accounts, which recommends that the total value of refundable tax credits, not just the amount paid to persons, be recognized as a transfer from the government to the household sector.3 As a result, estimates of federal government social benefit payments to persons will be revised up to reflect the total amount of the refundable tax credits, and estimates of personal current taxes paid to the federal government will be revised up by an equal amount to reflect the total tax liability of taxpayers (which does not include the refunds).
[17] Report: “Common Budgetary Terms Explained.” Congressional Budget Office, December 2021. <www.cbo.gov>
Discretionary spending results from budget authority provided in appropriation acts. (A few mandatory programs are also funded through appropriation acts; those programs are discussed below.) Through the appropriation process, the Congress decides on the amount of funding for a program (such as veterans’ health care) or an activity (such as collecting entrance fees at national parks). Administrative costs—to pay salaries, for example—are usually covered through those appropriations.
As a share of all federal outlays, discretionary spending has dropped from 60 percent in the early 1970s to 30 percent in recent years. Almost all defense spending is discretionary, and about 15 percent of pandemic-related spending was classified as discretionary.
Although statutory limits (often referred to as caps) on most types of discretionary budget authority were in place in many years, none are in effect now. The Budget Control Act of 2011 established caps for fiscal years 2012 to 2021; no caps were established for subsequent years.
Mandatory spending (also called direct spending) consists of outlays for certain federal benefit programs and other payments to individuals, businesses, nonprofit institutions, and state and local governments. That spending is generally governed by statutory criteria and, in most cases, is not constrained by the annual appropriation process. Social Security, Medicare, and Medicaid are the three largest mandatory programs.
Funding amounts for a mandatory program can be specified in law or, as is the case with Social Security, determined by complex eligibility rules and benefit formulas. The authorization laws that specify the amount of funding for mandatory programs may use language such as “there is hereby appropriated [a particular amount of money].”
Funding for some mandatory programs—for example, the Supplemental Nutrition Assistance Program, veterans’ disability compensation and pensions, and Medicaid—is appropriated annually. Spending on those programs is called appropriated mandatory spending. Those programs are mandatory because authorization acts legally require the government to provide benefits and services to eligible people or because other laws require that they be treated as mandatory; however, appropriation acts provide the funds to the agencies to fulfill those obligations.
As discretionary spending’s share of total federal spending has declined, mandatory spending’s share has grown, from about 30 percent in the early 1970s to 60 percent in recent years. The remaining 10 percent of total federal outlays consists of net spending on interest (primarily interest payments on the federal debt).
[18] “A Glossary of Terms Used in the Federal Budget Process.” U.S. Government Accountability Office. September, 2005. <www.gao.gov>
Page 46:
Discretionary
A term that usually modifies either “spending,” “appropriation,” or “amount.” “Discretionary spending” refers to outlays from budget authority that is provided in and controlled by appropriation acts. “Discretionary appropriation” refers to those budgetary resources that are provided in appropriation acts, other than those that fund mandatory programs.
Page 66:
Mandatory
A term that usually modifies either “spending” or “amount.” “Mandatory spending,” also known as “direct spending,” refers to budget authority that is provided in laws other than appropriation acts and the outlays that result from such budget authority. Mandatory spending includes entitlement authority (for example, the Food Stamp, Medicare, and veterans’ pension programs), payment of interest on the public debt, and non-entitlements such as payments to states from Forest Service receipts. By defining eligibility and setting the benefit or payment rules, Congress controls spending for these programs indirectly rather than directly through appropriations acts.
[19] Report: “Federal Spending on Benefits and Services for People with Low Income: FY2008–FY2020.” By Patrick A. Landers and others. Congressional Research Service, December 8, 2021. <crsreports.congress.gov>
Pages 7–8:
Mandatory and Discretionary Spending
The largest programs providing benefits and services to low-income people are mandatory spending programs. These are programs where spending is controlled by the terms of their authorizing laws—such as entitlements either to individuals or states—rather than the annual appropriation process. Discretionary spending is determined through annual appropriations.
Figure 3 shows federal spending in FY2020 on benefits and services for people with low income by category and budget classification (mandatory, discretionary, or some programs have spending classified as both). The largest categories (health, cash aid, and food aid) are dominated by mandatory spending. Housing is almost entirely discretionary spending, determined through annual appropriations. Education is split between discretionary spending and the Pell Grant program, which has both mandatory and discretionary components. Social services and employment and training have a mix of mandatory spending (much of it coming from the broadbased Temporary Assistance for Needy Families (TANF) block grant) and discretionary funding. Energy assistance is entirely discretionary.
Of the estimated $1.078 trillion spent by the federal government on benefits and services for people with low income in FY2020, $869.3 billion (81%) was spent on programs or activities receiving only mandatory funding and $166.3 billion (15%) was spent on programs or activities receiving only discretionary funding. The remaining $42.3 billion (4%) of spending occurred in programs receiving both mandatory and discretionary funding.8 Health care is a major source of mandatory spending: 94% of all health care spending discussed in this report was mandatory spending in FY2020.
[20] Report: “Federal Mandatory Spending for Means-Tested Programs, 2009 to 2029.” Congressional Budget Office, June 2019. <www.cbo.gov>
Page 1:
Means-tested programs (which provide cash payments or other forms of assistance to people with relatively low income or few assets) currently account for a little more than a quarter of all mandatory spending.1 The largest means-tested mandatory programs are Medicaid, the earned income and child tax credits (which are refundable and thus affect outlays), the Supplemental Nutrition Assistance Program (SNAP), and the Supplemental Security Income program.
1 Mandatory spending is governed by statutory criteria and is not normally controlled by the annual appropriation process.
[21] Report: “Fiscal Year 2023 Historical Tables: Budget Of The U.S. Government.” White House Office of Management and Budget, March 2022. <www.whitehouse.gov>
Pages 9–10 (of PDF):
While total discretionary spending as a percent of GDP [gross domestic product] has generally followed a downward path over most of the past 50 years, its major components—defense and nondefense—have contrasting histories. …
Nondefense discretionary spending as a percent of GDP has followed a much different path. In 1962, it stood at 3.3 percent of GDP. During the next few years it quickly increased, reaching 4.1 percent of GDP by 1967. It dropped slightly after that year, but still averaged about 3.8 percent of GDP until 1975, when it grew to 4.4 percent of GDP due, in part, to the recession and partly due to growth in spending on energy, the environment, and housing and other income support programs. Much of this growth was in the form of Federal grants to State and local governments. Additional spending arose from the creation of various antirecession grants at the end of the decade. …
Programmatic mandatory spending (which excludes net interest and undistributed offsetting receipts) accounts for the largest part of the growth in total Federal spending as a percent of GDP since the 1950s. Major programs in this category include Social Security, Medicare, unemployment compensation, deposit insurance, and means-tested entitlements (Medicaid, the Supplemental Nutrition Assistance Program (SNAP), Supplemental Security Income, the refundable portions of a variety of tax credits, including the Earned Income and Child Tax Credits, and other programs subject to an income or asset test).
[22] Report: “Fiscal Year 2023 Historical Tables: Budget of the U.S. Government.” White House Office of Management and Budget, March 2022. <www.whitehouse.gov>
Page 15 (of PDF): “Net interest: Most spending for net interest is paid to the public† as interest on the Federal debt. As shown in Table 3.2, net interest includes, as an offset, significant amounts of interest income. Spending in this category is equal to net outlays in the budget function of the same name.”
NOTE: † Interest “paid to the public” refers to interest on the publicly held national debt, or the portion of the national debt that is not owed to federal programs like Social Security.
[23] Report: “Fiscal Year 2023 Historical Tables: Budget Of The U.S. Government.” White House Office of Management and Budget, March 2022. <www.whitehouse.gov>
“Table 8.3 – Percentage Distribution of Outlays by Budget Enforcement Act Category: 1962–2027.” <www.whitehouse.gov>
2021 … Discretionary [=] 24.0% … Mandatory [=] 70.9% … Net Interest [=] 5.2%”
[24] Dataset: “Table 3.1. Government Current Receipts and Expenditures [Billions of dollars].” U.S. Bureau of Economic Analysis. Last revised May 25, 2023. <apps.bea.gov>
“Total expenditures … 2022 [=] 8,740.3”
[25] Calculated with the dataset: “Table 7.1. Selected Per Capita Product and Income Series in Current and Chained Dollars.” U.S. Department of Commerce, Bureau of Economic Analysis. Last revised January 26, 2023.
“Population (Midperiod, Thousands) … 2022 [=] 333,595”
CALCULATION: $8,740,300,000,000 spending / 333,595,000 people = $26,200 spending per person
[26] Calculated with the dataset: “Average Number of People per Household, by Race and Hispanic Origin, Marital Status, Age, and Education of Householder: 2022.” U.S. Census Bureau, November 2022. <www2.census.gov>
“Total households [=] 131,202,000”
CALCULATION: $8,740,300,000,000 spending / 131,202,000 households = $66,617 spending per household
[27] Calculated with the dataset: “Table 1.1.5. Gross Domestic Product [Billions of Dollars].” United States Department of Commerce, Bureau of Economic Analysis. Last revised January 26, 2023. <apps.bea.gov>
“Gross Domestic Product … 2022 [=] $25,461.3”
CALCULATION: $8,740,300,000,000 spending / $25,461,300,000,000 GDP = 34.3%
[28] Calculated with data from:
a) Dataset: “Table 3.1. Government Current Receipts and Expenditures [Billions of dollars].” U.S. Bureau of Economic Analysis. Last revised May 26, 2022. <apps.bea.gov>
b) Dataset: “CPI—All Urban Consumers (Current Series).” U.S. Department of Labor, Bureau of Labor Statistics. Accessed February 5, 2022 at <www.bls.gov>
“Series Id: CUUR0000SA0; Series Title: All Items in U.S. City Average, All Urban Consumers, Not Seasonally Adjusted; Area: U.S. City Average; Item: All Items; Base Period: 1982–84=100”
c) Dataset: “HH-1. Households by Type: 1940 to Present.” U.S. Census Bureau, Current Population Survey, November 2021. <www.census.gov>
NOTE: An Excel file containing the data and calculations is available upon request.
[29] Article: “Federal Reserve’s Role During WWII.” By Gary Richardson. Federal Reserve Bank of Richmond, Federal Reserve History, November 22, 2013. <www.federalreservehistory.org>
In September 1939, Germany’s invasion of Poland triggered war among the principal European powers. In December 1941, Japan attacked Pearl Harbor. Germany and Italy declared war on the United States. The American “arsenal of democracy” joined the Allied nations, including Britain, France, China, the Soviet Union, and numerous others, in the fight against the Axis alliance. The Allied counteroffensive began in 1942. The Axis surrendered in 1945.
[30] “WHO Director-General’s Opening Remarks at the Media Briefing on Covid-19.” World Health Organization, March 11, 2020. <bit.ly>
[Dr. Tedros Adhanom Ghebreyesus:] …
WHO [World Health Organization] has been assessing this outbreak around the clock and we are deeply concerned both by the alarming levels of spread and severity, and by the alarming levels of inaction.
We have therefore made the assessment that COVID-19 can be characterized as a pandemic.
[31] Press release: “COVID-19 and Other Global Health Issues.” World Health Organization, May 5, 2023. <www.justfacts.com>
[Dr. Tedros Adhanom Ghebreyesus:] …
Yesterday, the Emergency Committee met for the 15th time and recommended to me that I declare an end to the public health emergency of international concern. I have accepted that advice. It’s therefore with great hope that I declare COVID-19 over as a global health emergency.
[32] Calculated with data from:
a) Dataset: “Table 3.1. Government Current Receipts and Expenditures [Billions of dollars].” U.S. Bureau of Economic Analysis. Last revised May 26, 2022. <apps.bea.gov>
b) Dataset: “Table 1.1.5. Gross Domestic Product.” United States Department of Commerce, Bureau of Economic Analysis. Last revised May 29, 2022. <apps.bea.gov>
Line 1: “Gross Domestic Product”
NOTE: An Excel file containing the data and calculations is available upon request.
[33] Article: “Federal Reserve’s Role During WWII.” By Gary Richardson. Federal Reserve Bank of Richmond, Federal Reserve History, November 22, 2013. <www.federalreservehistory.org>
In September 1939, Germany’s invasion of Poland triggered war among the principal European powers. In December 1941, Japan attacked Pearl Harbor. Germany and Italy declared war on the United States. The American “arsenal of democracy” joined the Allied nations, including Britain, France, China, the Soviet Union, and numerous others, in the fight against the Axis alliance. The Allied counteroffensive began in 1942. The Axis surrendered in 1945.
[34] “WHO Director-General’s Opening Remarks at the Media Briefing on Covid-19.” World Health Organization, March 11, 2020. <bit.ly>
[Dr. Tedros Adhanom Ghebreyesus:] …
WHO [World Health Organization] has been assessing this outbreak around the clock and we are deeply concerned both by the alarming levels of spread and severity, and by the alarming levels of inaction.
We have therefore made the assessment that COVID-19 can be characterized as a pandemic.
[35] Press release: “COVID-19 and Other Global Health Issues.” World Health Organization, May 5, 2023. <www.justfacts.com>
[Dr. Tedros Adhanom Ghebreyesus:] …
Yesterday, the Emergency Committee met for the 15th time and recommended to me that I declare an end to the public health emergency of international concern. I have accepted that advice. It’s therefore with great hope that I declare COVID-19 over as a global health emergency.
[36] Dataset: “Table 3.2. Federal Government Current Receipts and Expenditures [Billions of Dollars].” U.S. Bureau of Economic Analysis. Last revised May 25, 2023. <apps.bea.gov>
“Total expenditures … 2022 [=] $6,168.4”
[37] Calculated with the dataset: “Table 7.1. Selected Per Capita Product and Income Series in Current and Chained Dollars.” U.S. Department of Commerce, Bureau of Economic Analysis. Last revised January 26, 2023.
“Population (Midperiod, Thousands) … 2022 [=] 333,595”
CALCULATION: $6,168,400,000,000 spending / 333,595,000 people = $18,491 spending per person
[38] Calculated with the dataset: “Average Number of People per Household, by Race and Hispanic Origin, Marital Status, Age, and Education of Householder: 2022.” U.S. Census Bureau, November 2022. <www2.census.gov>
“Total households [=] 131,202,000”
CALCULATION: $6,168,400,000,000 spending / 131,202,000 households = $47,015 spending per household
[39] Calculated with the dataset: “Table 1.1.5. Gross Domestic Product [Billions of Dollars].” United States Department of Commerce, Bureau of Economic Analysis. Last revised January 26, 2023. <apps.bea.gov>
“Gross Domestic Product … 2022 [=] $25,461.3”
CALCULATION: $6,168,400,000,000 spending / $25,461,300,000,000 GDP = 24.2%
[40] Calculated with data from:
a) Dataset: “Table 3.2. Federal Government Current Receipts and Expenditures [Billions of dollars].” U.S. Bureau of Economic Analysis. Last revised May 26, 2022. <apps.bea.gov>
b) Dataset: “CPI—All Urban Consumers (Current Series).” U.S. Department of Labor, Bureau of Labor Statistics. Accessed February 5, 2022 at <www.bls.gov>
“Series Id: CUUR0000SA0; Series Title: All Items in U.S. City Average, All Urban Consumers, Not Seasonally Adjusted; Area: U.S. City Average; Item: All Items; Base Period: 1982–84=100”
c) Dataset: “HH-1. Households by Type: 1940 to Present.” U.S. Census Bureau, Current Population Survey, November 2021. <www.census.gov>
NOTE: An Excel file containing the data and calculations is available upon request.
[41] Article: “Federal Reserve’s Role During WWII.” By Gary Richardson. Federal Reserve Bank of Richmond, Federal Reserve History, November 22, 2013. <www.federalreservehistory.org>
In September 1939, Germany’s invasion of Poland triggered war among the principal European powers. In December 1941, Japan attacked Pearl Harbor. Germany and Italy declared war on the United States. The American “arsenal of democracy” joined the Allied nations, including Britain, France, China, the Soviet Union, and numerous others, in the fight against the Axis alliance. The Allied counteroffensive began in 1942. The Axis surrendered in 1945.
[42] “WHO Director-General’s Opening Remarks at the Media Briefing on Covid-19.” World Health Organization, March 11, 2020. <bit.ly>
[Dr. Tedros Adhanom Ghebreyesus:] …
WHO [World Health Organization] has been assessing this outbreak around the clock and we are deeply concerned both by the alarming levels of spread and severity, and by the alarming levels of inaction.
We have therefore made the assessment that COVID-19 can be characterized as a pandemic.
[43] Press release: “COVID-19 and Other Global Health Issues.” World Health Organization, May 5, 2023. <www.justfacts.com>
[Dr. Tedros Adhanom Ghebreyesus:] …
Yesterday, the Emergency Committee met for the 15th time and recommended to me that I declare an end to the public health emergency of international concern. I have accepted that advice. It’s therefore with great hope that I declare COVID-19 over as a global health emergency.
[44] Calculated with data from:
a) Dataset: “Table 3.2. Federal Government Current Receipts and Expenditures [Billions of dollars].” U.S. Bureau of Economic Analysis. Last revised May 26, 2022. <apps.bea.gov>
b) Calculated with the dataset: “Table 1.1.5. Gross Domestic Product [Billions of Dollars].” United States Department of Commerce, Bureau of Economic Analysis. Last revised May 29, 2022. <apps.bea.gov>
NOTE: An Excel file containing the data and calculations is available upon request.
[45] Article: “Federal Reserve’s Role During WWII.” By Gary Richardson. Federal Reserve Bank of Richmond, Federal Reserve History, November 22, 2013. <www.federalreservehistory.org>
In September 1939, Germany’s invasion of Poland triggered war among the principal European powers. In December 1941, Japan attacked Pearl Harbor. Germany and Italy declared war on the United States. The American “arsenal of democracy” joined the Allied nations, including Britain, France, China, the Soviet Union, and numerous others, in the fight against the Axis alliance. The Allied counteroffensive began in 1942. The Axis surrendered in 1945.
[46] “WHO Director-General’s Opening Remarks at the Media Briefing on Covid-19.” World Health Organization, March 11, 2020. <bit.ly>
[Dr. Tedros Adhanom Ghebreyesus:] …
WHO [World Health Organization] has been assessing this outbreak around the clock and we are deeply concerned both by the alarming levels of spread and severity, and by the alarming levels of inaction.
We have therefore made the assessment that COVID-19 can be characterized as a pandemic.
[47] Press release: “COVID-19 and Other Global Health Issues.” World Health Organization, May 5, 2023. <www.justfacts.com>
[Dr. Tedros Adhanom Ghebreyesus:] …
Yesterday, the Emergency Committee met for the 15th time and recommended to me that I declare an end to the public health emergency of international concern. I have accepted that advice. It’s therefore with great hope that I declare COVID-19 over as a global health emergency.
[48] Calculated with data from:
a) Dataset: “Table 3.1. Government Current Receipts and Expenditures [Billions of dollars].” U.S. Bureau of Economic Analysis. Last revised May 25, 2023. <apps.bea.gov>
“Total expenditures … 2022 [=] 8,740.3”
b) Dataset: “Table 3.2. Federal Government Current Receipts and Expenditures [Billions of Dollars].” U.S. Bureau of Economic Analysis. Last revised May 25, 2023. <apps.bea.gov>
“Total expenditures … 2022 [=] $6,168.4”
CALCULATION: $8,740.3 billion federal, state, and local expenditures – $6,168.4 federal expenditures = $2,571.9 billion state and local expenditures
[49] Calculated with the dataset: “Table 7.1. Selected Per Capita Product and Income Series in Current and Chained Dollars.” U.S. Department of Commerce, Bureau of Economic Analysis. Last revised January 26, 2023.
“Population (Midperiod, Thousands) … 2022 [=] 333,595”
CALCULATION: $2,571,900,000,000 spending / 333,595,000 people = $7,710 spending per person
[50] Calculated with the dataset: “Average Number of People per Household, by Race and Hispanic Origin, Marital Status, Age, and Education of Householder: 2022.” U.S. Census Bureau, November 2022. <www2.census.gov>
“Total households [=] 131,202,000”
CALCULATION: $2,571,900,000,000 spending / 131,202,000 households = $19,603 spending per household
[51] Calculated with the dataset: “Table 1.1.5. Gross Domestic Product [Billions of Dollars].” United States Department of Commerce, Bureau of Economic Analysis. Last revised January 26, 2023. <apps.bea.gov>
“Gross Domestic Product … 2022 [=] $25,461.3”
CALCULATION: $2,571,900,000,000 spending / $25,461,300,000,000 = 10.1%
[52] Calculated with data from:
a) Dataset: “Table 3.1. Government Current Receipts and Expenditures [Billions of Dollars].” U.S. Bureau of Economic Analysis. Last revised May 26, 2022. <apps.bea.gov>
b) Dataset: “Table 3.2. Federal Government Current Receipts and Expenditures [Billions of Dollars].” U.S. Bureau of Economic Analysis. Last revised May 26, 2022. <apps.bea.gov>
c) Dataset: “Table 7.1. Selected Per Capita Product and Income Series in Current and Chained Dollars.” U.S. Department of Commerce, Bureau of Economic Analysis. Last revised January 27, 2022. <apps.bea.gov>
Line 18: “Population (Midperiod, Thousands)”
d) Dataset: “CPI—All Urban Consumers (Current Series).” U.S. Department of Labor, Bureau of Labor Statistics. Accessed February 5, 2022 at <www.bls.gov>
“Series Id: CUUR0000SA0; Series Title: All Items in U.S. City Average, All Urban Consumers, Not Seasonally Adjusted; Area: U.S. City Average; Item: All Items; Base Period: 1982–84=100”
NOTE: An Excel file containing the data and calculations is available upon request.
[53] “WHO Director-General’s Opening Remarks at the Media Briefing on Covid-19.” World Health Organization, March 11, 2020. <bit.ly>
[Dr. Tedros Adhanom Ghebreyesus:] …
WHO [World Health Organization] has been assessing this outbreak around the clock and we are deeply concerned both by the alarming levels of spread and severity, and by the alarming levels of inaction.
We have therefore made the assessment that COVID-19 can be characterized as a pandemic.
[54] Press release: “COVID-19 and Other Global Health Issues.” World Health Organization, May 5, 2023. <www.justfacts.com>
[Dr. Tedros Adhanom Ghebreyesus:] …
Yesterday, the Emergency Committee met for the 15th time and recommended to me that I declare an end to the public health emergency of international concern. I have accepted that advice. It’s therefore with great hope that I declare COVID-19 over as a global health emergency.
[55] Calculated with data from:
a) Dataset: “Table 3.1. Government Current Receipts and Expenditures [Billions of Dollars].” U.S. Bureau of Economic Analysis. Last revised May 26, 2022. <apps.bea.gov>
b) Dataset: “Table 3.2. Federal Government Current Receipts and Expenditures [Billions of Dollars].” U.S. Bureau of Economic Analysis. Last revised May 26, 2022. <apps.bea.gov>
c) Table 1.1.5. Gross Domestic Product [Billions of Dollars].” United States Department of Commerce, Bureau of Economic Analysis. Last revised January 27, 2022. <apps.bea.gov>
NOTE: An Excel file containing the data and calculations is available upon request.
[56] Article: “Great Depression.” By Richard H. Pells and Christina D. Romer. Encyclopedia Britannica, 1998. <www.britannica.com>
“Great Depression, worldwide economic downturn that began in 1929 and lasted until about 1939. It was the longest and most severe depression ever experienced by the industrialized Western world, sparking fundamental changes in economic institutions, macroeconomic policy, and economic theory.”
[57] “WHO Director-General’s Opening Remarks at the Media Briefing on Covid-19.” World Health Organization, March 11, 2020. <bit.ly>
[Dr. Tedros Adhanom Ghebreyesus:] …
WHO [World Health Organization] has been assessing this outbreak around the clock and we are deeply concerned both by the alarming levels of spread and severity, and by the alarming levels of inaction.
We have therefore made the assessment that COVID-19 can be characterized as a pandemic.
[58] Press release: “COVID-19 and Other Global Health Issues.” World Health Organization, May 5, 2023. <www.justfacts.com>
[Dr. Tedros Adhanom Ghebreyesus:] …
Yesterday, the Emergency Committee met for the 15th time and recommended to me that I declare an end to the public health emergency of international concern. I have accepted that advice. It’s therefore with great hope that I declare COVID-19 over as a global health emergency.
[59] Calculated with data from:
a) Dataset: “Table 3.16. Government Current Expenditures by Function [Billions of Dollars].” U.S. Department of Commerce, Bureau of Economic Analysis. Last revised October 29, 2021. <apps.bea.gov>
b) Report: “Fiscal Year 2023 Historical Tables: Budget Of The U.S. Government.” White House Office of Management and Budget, March 2022. <www.whitehouse.gov>
“Table 3.1—Outlays by Superfunction and Function: 1940–2027.” <www.whitehouse.gov>
c) Dataset: “HH-1. Households by Type: 1940 to Present.” U.S. Census Bureau, Current Population Survey, November 2021. <www.census.gov>
NOTES:
[60] Calculated with data from:
a) Dataset: “Table 3.16. Government Current Expenditures by Function [Billions of Dollars].” U.S. Department of Commerce, Bureau of Economic Analysis. Last revised October 29, 2021. <apps.bea.gov>
b) Report: “Fiscal Year 2023 Historical Tables: Budget Of The U.S. Government.” White House Office of Management and Budget, March 2022. <www.whitehouse.gov>
“Table 3.1—Outlays by Superfunction and Function: 1940–2027.” <www.whitehouse.gov>
c) Dataset: “HH-1. Households by Type: 1940 to Present.” U.S. Census Bureau, Current Population Survey, November 2021. <www.census.gov>
NOTES:
[61] Calculated with data from:
a) Dataset: “Table 3.16. Government Current Expenditures by Function [Billions of Dollars].” U.S. Department of Commerce, Bureau of Economic Analysis. Last revised October 29, 2021. <apps.bea.gov>
b) Report: “Fiscal Year 2023 Historical Tables: Budget Of The U.S. Government.” White House Office of Management and Budget, March 2022. <www.whitehouse.gov>
“Table 3.1—Outlays by Superfunction and Function: 1940–2027.” <www.whitehouse.gov>
NOTES:
[62] Calculated with data from:
a) Dataset: “Table 3.16. Government Current Expenditures by Function [Billions of Dollars].” U.S. Department of Commerce, Bureau of Economic Analysis. Last revised October 29, 2021. <apps.bea.gov>
b) Report: “Fiscal Year 2023 Historical Tables: Budget Of The U.S. Government.” White House Office of Management and Budget, March 2022. <www.whitehouse.gov>
“Table 3.1—Outlays by Superfunction and Function: 1940–2027.” <www.whitehouse.gov>
Data from the chart:
|
Category |
Portion of Government Current Spending |
||||||
|
1960 |
1970 |
1980 |
1990 |
2000 |
2010 |
2020 |
|
|
Social Programs |
31% |
40% |
48% |
47% |
55% |
58% |
68% |
|
National Defense |
38% |
29% |
18% |
17% |
12% |
14% |
10% |
|
General Government & Debt Service |
19% |
19% |
22% |
25% |
20% |
17% |
13% |
|
Economic Affairs & Infrastructure |
9% |
9% |
8% |
6% |
7% |
6% |
4% |
|
Public Order & Safety |
4% |
4% |
4% |
5% |
7% |
6% |
5% |
NOTES:
[63] “WHO Director-General’s Opening Remarks at the Media Briefing on Covid-19.” World Health Organization, March 11, 2020. <bit.ly>
[Dr. Tedros Adhanom Ghebreyesus:] …
WHO [World Health Organization] has been assessing this outbreak around the clock and we are deeply concerned both by the alarming levels of spread and severity, and by the alarming levels of inaction.
We have therefore made the assessment that COVID-19 can be characterized as a pandemic.
[64] Press release: “COVID-19 and Other Global Health Issues.” World Health Organization, May 5, 2023. <www.justfacts.com>
[Dr. Tedros Adhanom Ghebreyesus:] …
Yesterday, the Emergency Committee met for the 15th time and recommended to me that I declare an end to the public health emergency of international concern. I have accepted that advice. It’s therefore with great hope that I declare COVID-19 over as a global health emergency.
[65] Calculated with data from:
a) Dataset: “Table 3.16. Government Current Expenditures by Function [Billions of Dollars].” U.S. Department of Commerce, Bureau of Economic Analysis. Last revised October 29, 2021. <apps.bea.gov>
b) Report: “Fiscal Year 2023 Historical Tables: Budget Of The U.S. Government.” White House Office of Management and Budget, March 2022. <www.whitehouse.gov>
“Table 3.1—Outlays by Superfunction and Function: 1940–2027.” <www.whitehouse.gov>
c) Dataset: “HH-1. Households by Type: 1940 to Present.” U.S. Census Bureau, Current Population Survey, November 2021. <www.census.gov>
NOTES:
[66] Calculated with data from:
a) Dataset: “Table 3.16. Government Current Expenditures by Function [Billions of Dollars].” U.S. Department of Commerce, Bureau of Economic Analysis. Last revised October 29, 2021. <apps.bea.gov>
b) Report: “Fiscal Year 2023 Historical Tables: Budget Of The U.S. Government.” White House Office of Management and Budget, March 2022. <www.whitehouse.gov>
“Table 3.1—Outlays by Superfunction and Function: 1940–2027.” <www.whitehouse.gov>
c) Dataset: “HH-1. Households by Type: 1940 to Present.” U.S. Census Bureau, Current Population Survey, November 2021. <www.census.gov>
NOTES:
[67] Article: “Scientific Survey Shows Voters Across the Political Spectrum Are Ideologically Deluded.” By James D. Agresti. Just Facts, April 16, 2021. <www.justfacts.com>
The survey was conducted by Triton Polling & Research, an academic research firm that serves scholars, corporations, and political campaigns. The responses were obtained through live telephone surveys of 1,000 likely voters across the U.S. during November 4–11, 2020. This sample size is large enough to accurately represent the U.S. population. Likely voters are people who say they vote “every time there is an opportunity” or in “most” elections.
The margin of sampling error for all respondents is ±3% with at least 95% confidence. The margins of error for the subsets are 5% for Biden voters, 5% for Trump voters, 4% for males, 5% for females, 9% for 18 to 34 year olds, 4% for 35 to 64 year olds, and 5% for 65+ year olds.
The survey results presented in this article are slightly weighted to match the ages and genders of likely voters. The political parties and geographic locations of the survey respondents almost precisely match the population of likely voters. Thus, there is no need for weighting based upon these variables.
[68] Calculated with data from the report: “Just Facts 2020 U.S. Nationwide Survey.” Triton Polling & Research, November 2020. <www.justfacts.com>
Page 5:
Q22. Since the 1960s, what do you think has been the main cause of rising national debt?
Military spending [=] 25.4%
Social programs [=] 39.5%
Tax cuts [=] 25.1%
CALCULATION: 25.4% + 25.1% = 50.5%
[69] For facts about how surveys work and why some are accurate while others are not, click here.
[70] Calculated with data from:
a) Dataset: “Table 3.16. Government Current Expenditures by Function [Billions of Dollars].” U.S. Department of Commerce, Bureau of Economic Analysis. Last revised October 29, 2021. <apps.bea.gov>
b) Report: “Fiscal Year 2023 Historical Tables: Budget Of The U.S. Government.” White House Office of Management and Budget, March 2022. <www.whitehouse.gov>
“Table 3.1—Outlays by Superfunction and Function: 1940–2027.” <www.whitehouse.gov>
NOTE: An Excel file containing the data and calculations is available here.
[71] Calculated with data from:
a) Dataset: “Table 3.16. Government Current Expenditures by Function [Billions of Dollars].” U.S. Department of Commerce, Bureau of Economic Analysis. Last revised October 29, 2021. <apps.bea.gov>
b) Report: “Fiscal Year 2023 Historical Tables: Budget Of The U.S. Government.” White House Office of Management and Budget, March 2022. <www.whitehouse.gov>
“Table 3.1—Outlays by Superfunction and Function: 1940–2027.” <www.whitehouse.gov>
Data from the chart:
|
Category |
Portion of Federal Current Spending |
||||||
|
1960 |
1970 |
1980 |
1990 |
2000 |
2010 |
2020 |
|
|
Social Programs |
21% |
32% |
44% |
44% |
54% |
61% |
73% |
|
National Defense |
53% |
42% |
27% |
25% |
19% |
20% |
14% |
|
General Government & Debt Service |
19% |
18% |
21% |
25% |
20% |
13% |
10% |
|
Economic Affairs & Infrastructure |
6% |
7% |
7% |
5% |
5% |
4% |
3% |
|
Public Order & Safety |
0% |
0% |
1% |
1% |
1% |
2% |
1% |
NOTES:
[72] “WHO Director-General’s Opening Remarks at the Media Briefing on Covid-19.” World Health Organization, March 11, 2020. <bit.ly>
[Dr. Tedros Adhanom Ghebreyesus:] …
WHO [World Health Organization] has been assessing this outbreak around the clock and we are deeply concerned both by the alarming levels of spread and severity, and by the alarming levels of inaction.
We have therefore made the assessment that COVID-19 can be characterized as a pandemic.
[73] Press release: “COVID-19 and Other Global Health Issues.” World Health Organization, May 5, 2023. <www.justfacts.com>
[Dr. Tedros Adhanom Ghebreyesus:] …
Yesterday, the Emergency Committee met for the 15th time and recommended to me that I declare an end to the public health emergency of international concern. I have accepted that advice. It’s therefore with great hope that I declare COVID-19 over as a global health emergency.
[74] Calculated with data from:
a) Dataset: “Table 3.16. Government Current Expenditures by Function [Billions of Dollars].” U.S. Department of Commerce, Bureau of Economic Analysis. Last revised October 29, 2021. <apps.bea.gov>
b) Dataset: “HH-1. Households by Type: 1940 to Present.” U.S. Census Bureau, Current Population Survey, November 2021. <www.census.gov>
NOTE: An Excel file containing the data and calculations is available here.
[75] Calculated with data from:
a) Dataset: “Table 3.16. Government Current Expenditures by Function [Billions of Dollars].” U.S. Department of Commerce, Bureau of Economic Analysis. Last revised October 29, 2021. <apps.bea.gov>
b) Dataset: “HH-1. Households by Type: 1940 to Present.” U.S. Census Bureau, Current Population Survey, November 2021. <www.census.gov>
NOTE: An Excel file containing the data and calculations is available here.
[76] Calculated with data from:
a) Dataset: “Table 3.16. Government Current Expenditures by Function [Billions of Dollars].” U.S. Department of Commerce, Bureau of Economic Analysis. Last revised October 29, 2021. <apps.bea.gov>
b) Report: “Fiscal Year 2023 Historical Tables: Budget Of The U.S. Government.” White House Office of Management and Budget, March 2022. <www.whitehouse.gov>
“Table 3.1—Outlays by Superfunction and Function: 1940–2027.” <www.whitehouse.gov>
NOTE: An Excel file containing the data and calculations is available here.
[77] Calculated with data from:
a) Dataset: “Table 3.16. Government Current Expenditures by Function [Billions of Dollars].” U.S. Department of Commerce, Bureau of Economic Analysis. Last revised October 29, 2021. <apps.bea.gov>
b) Report: “Fiscal Year 2023 Historical Tables: Budget Of The U.S. Government.” White House Office of Management and Budget, March 2022. <www.whitehouse.gov>
“Table 3.1—Outlays by Superfunction and Function: 1940–2027.” <www.whitehouse.gov>
Data from the chart:
|
Category |
Portion of State & Local Current Spending (Sans Federal Grants) |
||||||
|
1960 |
1970 |
1980 |
1990 |
2000 |
2010 |
2020 |
|
|
Social Programs |
55% |
57% |
56% |
54% |
56% |
52% |
51% |
|
National Defense |
18% |
20% |
24% |
24% |
20% |
25% |
23% |
|
General Government & Debt Service |
16% |
12% |
9% |
9% |
9% |
9% |
10% |
|
Economic Affairs & Infrastructure |
12% |
11% |
12% |
13% |
15% |
15% |
16% |
|
Public Order & Safety |
55% |
57% |
56% |
54% |
56% |
52% |
51% |
NOTE: An Excel file containing the data and calculations is available here.
[78] “WHO Director-General’s Opening Remarks at the Media Briefing on Covid-19.” World Health Organization, March 11, 2020. <bit.ly>
[Dr. Tedros Adhanom Ghebreyesus:] …
WHO [World Health Organization] has been assessing this outbreak around the clock and we are deeply concerned both by the alarming levels of spread and severity, and by the alarming levels of inaction.
We have therefore made the assessment that COVID-19 can be characterized as a pandemic.
[79] Press release: “COVID-19 and Other Global Health Issues.” World Health Organization, May 5, 2023. <www.justfacts.com>
[Dr. Tedros Adhanom Ghebreyesus:] …
Yesterday, the Emergency Committee met for the 15th time and recommended to me that I declare an end to the public health emergency of international concern. I have accepted that advice. It’s therefore with great hope that I declare COVID-19 over as a global health emergency.
[80] Article: “Social Welfare Program.” Encyclopædia Britannica. Accessed May 11, 2018 at <www.britannica.com>
“Social welfare program, any of a variety of governmental programs designed to protect citizens from the economic risks and insecurities of life. The most common types of programs provide benefits to the elderly or retired, the sick or invalid, dependent survivors, mothers, the unemployed, the work-injured, and families.”
[81] Report: “Social Welfare Expenditures Under Public Programs, Fiscal Year 1977.” By Alma McMillan. U.S. Social Security Administration Office of Research and Statistics Social Security Bulletin, June 1979. <www.ssa.gov>
Page 7:
Public social welfare expenditures are defined in this series as cash and medical benefits, services, and administrative costs for all programs operating under public law that are of direct benefit to individuals and families. Included are programs providing income maintenance and health benefits through social insurance and public aid, and those providing public support of health, education, housing, and other welfare services.
[82] Article: “Social Welfare Expenditures in the United States, 1956–57.” By Ida C. Merriam (Director, Division of Program Research, Office of the Social Security Commissioner). U.S. Social Security Administration Office of Research and Statistics Social Security Bulletin, October 1958. Pages 22–33. <www.ssa.gov>
Page 22:
Whatever definition of social welfare programs or activities is used, there are several different contexts in which it is desirable to look at social welfare expenditures. The primary one around which the series has been organized is that of program expenditures. This classification identifies total expenditures, including costs of administration, under designated programs—in this instance, civilian public programs of income maintenance, health, education, public housing, and other welfare services. The data thus compiled give a measure of the shares of the total national output and of all public expenditures that have been going to these designated programs.
[83] The Oxford Handbook of U.S. Social Policy. Edited by Daniel Beland, Christopher Howard, and Kimberly J. Morgan. Oxford University Press, 2015.
Chapter 1: “The Fragmented American Welfare State: Putting the Pieces Together.” By Daniel Beland, Christopher Howard, and Kimberly J. Morgan. Pages 3–22.
Page 4:
Social policy refers to programs that redistribute resources across society and often seek to cushion people against life’s socioeconomic risks. These programs usually take the form of cash transfers or in-kind benefits such as medical care. Taken together, social programs constitute the welfare state, a term that implies uniformity and coherence but in fact often conceals a tremendous amount of variation in terms of programmatic design and political dynamics.
… Modern social programs span a multitude of policy areas, including programs for the unemployed, retirees, the sick, the disabled, the poor, and families with children (Beland 2010). All of these policy areas are explicitly analyzed in this handbook. Some, such as retirement pensions and health care, are represented by several chapters each, a reflection of the programmatic complexity and fragmentation of the American welfare state.
[84] For facts about different measures of social spending, see Just Facts’ comprehensive research on this issue.
[85] Calculated with data from:
a) Dataset: “Table 3.16. Government Current Expenditures by Function [Billions of Dollars].” U.S. Department of Commerce, Bureau of Economic Analysis. Last revised October 29, 2021. <apps.bea.gov>
b) Report: “Fiscal Year 2023 Historical Tables: Budget Of The U.S. Government.” White House Office of Management and Budget, March 2022. <www.whitehouse.gov>
“Table 3.1—Outlays by Superfunction and Function: 1940–2027.” <www.whitehouse.gov>
NOTES:
[86] Calculated with data from:
a) Dataset: “Table 3.16. Government Current Expenditures by Function [Billions of Dollars].” U.S. Department of Commerce, Bureau of Economic Analysis. Last revised October 29, 2021. <apps.bea.gov>
b) Report: “Fiscal Year 2023 Historical Tables: Budget Of The U.S. Government.” White House Office of Management and Budget, March 2022. <www.whitehouse.gov>
“Table 3.1—Outlays by Superfunction and Function: 1940–2027.” <www.whitehouse.gov>
c) Dataset: “Monthly Population Estimates for the United States: April 1, 2010 to December 1, 2022.” U.S. Census Bureau, Population Division, December 2021. <www2.census.gov>
d) Dataset: “HH-1. Households by Type: 1940 to Present.” U.S. Census Bureau, Current Population Survey, November 2021. <www.census.gov>
e) Dataset: “Table 1.1.5. Gross Domestic Product [Billions of Dollars].” United States Department of Commerce, Bureau of Economic Analysis. Last revised May 29, 2022. <apps.bea.gov>
NOTE: An Excel file containing the data and calculations is available here.
[87] Calculated with data from:
a) Dataset: “Table 3.16. Government Current Expenditures by Function [Billions of Dollars].” U.S. Department of Commerce, Bureau of Economic Analysis. Last revised October 29, 2021. <apps.bea.gov>
b) Report: “Fiscal Year 2023 Historical Tables: Budget Of The U.S. Government.” White House Office of Management and Budget, March 2022. <www.whitehouse.gov>
“Table 3.1—Outlays by Superfunction and Function: 1940–2027.” <www.whitehouse.gov>
NOTES:
[88] Calculated with data from:
a) Dataset: “Table 3.16. Government Current Expenditures by Function [Billions of Dollars].” U.S. Department of Commerce, Bureau of Economic Analysis. Last revised October 29, 2021. <apps.bea.gov>
b) Report: “Fiscal Year 2023 Historical Tables: Budget Of The U.S. Government.” White House Office of Management and Budget, March 2022. <www.whitehouse.gov>
“Table 3.1—Outlays by Superfunction and Function: 1940–2027.” <www.whitehouse.gov>
NOTES:
[89] “WHO Director-General’s Opening Remarks at the Media Briefing on Covid-19.” World Health Organization, March 11, 2020. <bit.ly>
[Dr. Tedros Adhanom Ghebreyesus:] …
WHO [World Health Organization] has been assessing this outbreak around the clock and we are deeply concerned both by the alarming levels of spread and severity, and by the alarming levels of inaction.
We have therefore made the assessment that COVID-19 can be characterized as a pandemic.
[90] Press release: “COVID-19 and Other Global Health Issues.” World Health Organization, May 5, 2023. <www.justfacts.com>
[Dr. Tedros Adhanom Ghebreyesus:] …
Yesterday, the Emergency Committee met for the 15th time and recommended to me that I declare an end to the public health emergency of international concern. I have accepted that advice. It’s therefore with great hope that I declare COVID-19 over as a global health emergency.
[91] Calculated with data from:
a) Dataset: “Table 3.16. Government Current Expenditures by Function [Billions of Dollars].” U.S. Department of Commerce, Bureau of Economic Analysis. Last revised October 29, 2021. <apps.bea.gov>
b) Report: “Fiscal Year 2023 Historical Tables: Budget Of The U.S. Government.” White House Office of Management and Budget, March 2022. <www.whitehouse.gov>
“Table 3.1—Outlays by Superfunction and Function: 1940–2027.” <www.whitehouse.gov>
NOTES:
[92] Calculated with data from:
a) Dataset: “Table 3.16. Government Current Expenditures by Function [Billions of Dollars].” U.S. Department of Commerce, Bureau of Economic Analysis. Last revised October 29, 2021. <apps.bea.gov>
b) Report: “Fiscal Year 2023 Historical Tables: Budget Of The U.S. Government.” White House Office of Management and Budget, March 2022. <www.whitehouse.gov>
“Table 3.1—Outlays by Superfunction and Function: 1940–2027.” <www.whitehouse.gov>
c) Dataset: “Monthly Population Estimates for the United States: April 1, 2010 to December 1, 2022.” U.S. Census Bureau, Population Division, December 2021. <www2.census.gov>
d) Dataset: “HH-1. Households by Type: 1940 to Present.” U.S. Census Bureau, Current Population Survey, November 2021. <www.census.gov>
e) Dataset: “Table 1.1.5. Gross Domestic Product [Billions of Dollars].” United States Department of Commerce, Bureau of Economic Analysis. Last revised May 29, 2022. <apps.bea.gov>
NOTE: An Excel file containing the data and calculations is available here.
[93] Calculated with data from:
a) Dataset: “Table 3.16. Government Current Expenditures by Function [Billions of Dollars].” U.S. Department of Commerce, Bureau of Economic Analysis. Last revised October 29, 2021. <apps.bea.gov>
b) Report: “Fiscal Year 2023 Historical Tables: Budget Of The U.S. Government.” White House Office of Management and Budget, March 2022. <www.whitehouse.gov>
“Table 3.1—Outlays by Superfunction and Function: 1940–2027.” <www.whitehouse.gov>
NOTES:
[94] Calculated with data from:
a) Dataset: “Table 3.16. Government Current Expenditures by Function [Billions of Dollars].” U.S. Department of Commerce, Bureau of Economic Analysis. Last revised October 29, 2021. <apps.bea.gov>
b) Report: “Fiscal Year 2023 Historical Tables: Budget Of The U.S. Government.” White House Office of Management and Budget, March 2022. <www.whitehouse.gov>
“Table 3.1—Outlays by Superfunction and Function: 1940–2027.” <www.whitehouse.gov>
NOTES:
[95] “WHO Director-General’s Opening Remarks at the Media Briefing on Covid-19.” World Health Organization, March 11, 2020. <bit.ly>
[Dr. Tedros Adhanom Ghebreyesus:] …
WHO [World Health Organization] has been assessing this outbreak around the clock and we are deeply concerned both by the alarming levels of spread and severity, and by the alarming levels of inaction.
We have therefore made the assessment that COVID-19 can be characterized as a pandemic.
[96] Press release: “COVID-19 and Other Global Health Issues.” World Health Organization, May 5, 2023. <www.justfacts.com>
[Dr. Tedros Adhanom Ghebreyesus:] …
Yesterday, the Emergency Committee met for the 15th time and recommended to me that I declare an end to the public health emergency of international concern. I have accepted that advice. It’s therefore with great hope that I declare COVID-19 over as a global health emergency.
[97] Calculated with data from:
a) Dataset: “Table 3.16. Government Current Expenditures by Function [Billions of Dollars].” U.S. Department of Commerce, Bureau of Economic Analysis. Last revised October 29, 2021. <apps.bea.gov>
b) Report: “Fiscal Year 2023 Historical Tables: Budget Of The U.S. Government.” White House Office of Management and Budget, March 2022. <www.whitehouse.gov>
“Table 3.1—Outlays by Superfunction and Function: 1940–2027.” <www.whitehouse.gov>
NOTE: An Excel file containing the data and calculations is available here.
[98] Calculated with data from:
a) Dataset: “Table 3.16. Government Current Expenditures by Function [Billions of Dollars].” U.S. Department of Commerce, Bureau of Economic Analysis. Last revised October 29, 2021. <apps.bea.gov>
b) Report: “Fiscal Year 2023 Historical Tables: Budget Of The U.S. Government.” White House Office of Management and Budget, March 2022. <www.whitehouse.gov>
“Table 3.1—Outlays by Superfunction and Function: 1940–2027.” <www.whitehouse.gov>
c) Dataset: “Monthly Population Estimates for the United States: April 1, 2010 to December 1, 2022.” U.S. Census Bureau, Population Division, December 2021. <www2.census.gov>
d) Dataset: “HH-1. Households by Type: 1940 to Present.” U.S. Census Bureau, Current Population Survey, November 2021. <www.census.gov>
e) Dataset: “Table 1.1.5. Gross Domestic Product [Billions of Dollars].” United States Department of Commerce, Bureau of Economic Analysis. Last revised May 29, 2022. <apps.bea.gov>
NOTE: An Excel file containing the data and calculations is available here.
[99] Calculated with data from:
a) Dataset: “Table 3.16. Government Current Expenditures by Function [Billions of Dollars].” U.S. Department of Commerce, Bureau of Economic Analysis. Last revised October 29, 2021. <apps.bea.gov>
b) Report: “Fiscal Year 2023 Historical Tables: Budget Of The U.S. Government.” White House Office of Management and Budget, March 2022. <www.whitehouse.gov>
“Table 3.1—Outlays by Superfunction and Function: 1940–2027.” <www.whitehouse.gov>
NOTE: An Excel file containing the data and calculations is available here.
[100] “WHO Director-General’s Opening Remarks at the Media Briefing on Covid-19.” World Health Organization, March 11, 2020. <bit.ly>
[Dr. Tedros Adhanom Ghebreyesus:] …
WHO [World Health Organization] has been assessing this outbreak around the clock and we are deeply concerned both by the alarming levels of spread and severity, and by the alarming levels of inaction.
We have therefore made the assessment that COVID-19 can be characterized as a pandemic.
[101] Press release: “COVID-19 and Other Global Health Issues.” World Health Organization, May 5, 2023. <www.justfacts.com>
[Dr. Tedros Adhanom Ghebreyesus:] …
Yesterday, the Emergency Committee met for the 15th time and recommended to me that I declare an end to the public health emergency of international concern. I have accepted that advice. It’s therefore with great hope that I declare COVID-19 over as a global health emergency.
[102] Dataset: “Table 3.16. Government Current Expenditures by Function [Billions of Dollars].” U.S. Department of Commerce, Bureau of Economic Analysis. Last revised October 29, 2021. <apps.bea.gov>
General public service
Executive and legislative
Tax collection and financial management
Interest payments2
Other3
2 Prior to 1960, federal interest receipts are not available separately but are included in interest payments, which is shown net of federal interest receipts. Interest payments includes interest accrued on the actuarial liabilities of defined benefit pension plans for government employees.
3 Equals unallocable state and local government expenditures….
[103] Dataset: “Table 3.16. Government Current Expenditures by Function [Billions of Dollars].” U.S. Department of Commerce, Bureau of Economic Analysis. Last revised October 29, 2021. <apps.bea.gov>
“Government … General public service … 2020 [=] 1,156.2”
[104] Calculated with data from:
a) Dataset: “Table 3.16. Government Current Expenditures by Function [Billions of Dollars].” U.S. Department of Commerce, Bureau of Economic Analysis. Last revised October 29, 2021. <apps.bea.gov>
b) Report: “Fiscal Year 2023 Historical Tables: Budget Of The U.S. Government.” White House Office of Management and Budget, March 2022. <www.whitehouse.gov>
“Table 3.1—Outlays by Superfunction and Function: 1940–2027.” <www.whitehouse.gov>
c) Dataset: “Monthly Population Estimates for the United States: April 1, 2010 to December 1, 2022.” U.S. Census Bureau, Population Division, December 2021. <www2.census.gov>
d) Dataset: “HH-1. Households by Type: 1940 to Present.” U.S. Census Bureau, Current Population Survey, November 2021. <www.census.gov>
e) Dataset: “Table 1.1.5. Gross Domestic Product [Billions of Dollars].” United States Department of Commerce, Bureau of Economic Analysis. Last revised May 29, 2022. <apps.bea.gov>
NOTE: An Excel file containing the data and calculations is available here.
[105] Calculated with data from:
a) Dataset: “Table 3.16. Government Current Expenditures by Function [Billions of Dollars].” U.S. Department of Commerce, Bureau of Economic Analysis. Last revised October 29, 2021. <apps.bea.gov>
b) Report: “Fiscal Year 2023 Historical Tables: Budget Of The U.S. Government.” White House Office of Management and Budget, March 2022. <www.whitehouse.gov>
“Table 3.1—Outlays by Superfunction and Function: 1940–2027.” <www.whitehouse.gov>
NOTE: An Excel file containing the data and calculations is available here.
[106] Calculated with data from:
a) Dataset: “Table 3.16. Government Current Expenditures by Function [Billions of Dollars].” U.S. Department of Commerce, Bureau of Economic Analysis. Last revised October 29, 2021. <apps.bea.gov>
b) Report: “Fiscal Year 2023 Historical Tables: Budget Of The U.S. Government.” White House Office of Management and Budget, March 2022. <www.whitehouse.gov>
“Table 3.1—Outlays by Superfunction and Function: 1940–2027.” <www.whitehouse.gov>
NOTE: An Excel file containing the data and calculations is available here.
[107] “WHO Director-General’s Opening Remarks at the Media Briefing on Covid-19.” World Health Organization, March 11, 2020. <bit.ly>
[Dr. Tedros Adhanom Ghebreyesus:] …
WHO [World Health Organization] has been assessing this outbreak around the clock and we are deeply concerned both by the alarming levels of spread and severity, and by the alarming levels of inaction.
We have therefore made the assessment that COVID-19 can be characterized as a pandemic.
[108] Press release: “COVID-19 and Other Global Health Issues.” World Health Organization, May 5, 2023. <www.justfacts.com>
[Dr. Tedros Adhanom Ghebreyesus:] …
Yesterday, the Emergency Committee met for the 15th time and recommended to me that I declare an end to the public health emergency of international concern. I have accepted that advice. It’s therefore with great hope that I declare COVID-19 over as a global health emergency.
[109] Dataset: “Table 3.16. Government Current Expenditures by Function [Billions of Dollars].” U.S. Department of Commerce, Bureau of Economic Analysis. Last revised October 29, 2021. <apps.bea.gov>
“Federal … General public service … 2020 [=] 661.9”
[110] Calculated with data from:
a) Dataset: “Table 3.16. Government Current Expenditures by Function [Billions of Dollars].” U.S. Department of Commerce, Bureau of Economic Analysis. Last revised October 29, 2021. <apps.bea.gov>
b) Report: “Fiscal Year 2023 Historical Tables: Budget Of The U.S. Government.” White House Office of Management and Budget, March 2022. <www.whitehouse.gov>
“Table 3.1—Outlays by Superfunction and Function: 1940–2027.” <www.whitehouse.gov>
c) Dataset: “Monthly Population Estimates for the United States: April 1, 2010 to December 1, 2022.” U.S. Census Bureau, Population Division, December 2021. <www2.census.gov>
d) Dataset: “HH-1. Households by Type: 1940 to Present.” U.S. Census Bureau, Current Population Survey, November 2021. <www.census.gov>
e) Dataset: “Table 1.1.5. Gross Domestic Product [Billions of Dollars].” United States Department of Commerce, Bureau of Economic Analysis. Last revised May 29, 2022. <apps.bea.gov>
NOTE: An Excel file containing the data and calculations is available here.
[111] Calculated with data from:
a) Dataset: “Table 3.16. Government Current Expenditures by Function [Billions of Dollars].” U.S. Department of Commerce, Bureau of Economic Analysis. Last revised October 29, 2021. <apps.bea.gov>
b) Report: “Fiscal Year 2023 Historical Tables: Budget Of The U.S. Government.” White House Office of Management and Budget, March 2022. <www.whitehouse.gov>
“Table 3.1—Outlays by Superfunction and Function: 1940–2027.” <www.whitehouse.gov>
NOTE: An Excel file containing the data and calculations is available here.
[112] Calculated with data from:
a) Dataset: “Table 3.16. Government Current Expenditures by Function [Billions of Dollars].” U.S. Department of Commerce, Bureau of Economic Analysis. Last revised October 29, 2021. <apps.bea.gov>
b) Report: “Fiscal Year 2023 Historical Tables: Budget Of The U.S. Government.” White House Office of Management and Budget, March 2022. <www.whitehouse.gov>
“Table 3.1—Outlays by Superfunction and Function: 1940–2027.” <www.whitehouse.gov>
NOTES:
[113] “WHO Director-General’s Opening Remarks at the Media Briefing on Covid-19.” World Health Organization, March 11, 2020. <bit.ly>
[Dr. Tedros Adhanom Ghebreyesus:] …
WHO [World Health Organization] has been assessing this outbreak around the clock and we are deeply concerned both by the alarming levels of spread and severity, and by the alarming levels of inaction.
We have therefore made the assessment that COVID-19 can be characterized as a pandemic.
[114] Press release: “COVID-19 and Other Global Health Issues.” World Health Organization, May 5, 2023. <www.justfacts.com>
[Dr. Tedros Adhanom Ghebreyesus:] …
Yesterday, the Emergency Committee met for the 15th time and recommended to me that I declare an end to the public health emergency of international concern. I have accepted that advice. It’s therefore with great hope that I declare COVID-19 over as a global health emergency.
[115] Calculated with data from:
a) Dataset: “Table 3.16. Government Current Expenditures by Function [Billions of Dollars].” U.S. Department of Commerce, Bureau of Economic Analysis. Last revised October 29, 2021. <apps.bea.gov>
b) Report: “Fiscal Year 2023 Historical Tables: Budget Of The U.S. Government.” White House Office of Management and Budget, March 2022. <www.whitehouse.gov>
“Table 3.1—Outlays by Superfunction and Function: 1940–2027.” <www.whitehouse.gov>
NOTE: An Excel file containing the data and calculations is available here.
[116] Calculated with data from:
a) Dataset: “Table 3.16. Government Current Expenditures by Function [Billions of Dollars].” U.S. Department of Commerce, Bureau of Economic Analysis. Last revised October 29, 2021. <apps.bea.gov>
b) Report: “Fiscal Year 2023 Historical Tables: Budget Of The U.S. Government.” White House Office of Management and Budget, March 2022. <www.whitehouse.gov>
“Table 3.1—Outlays by Superfunction and Function: 1940–2027.” <www.whitehouse.gov>
c) Dataset: “Monthly Population Estimates for the United States: April 1, 2010 to December 1, 2022.” U.S. Census Bureau, Population Division, December 2021. <www2.census.gov>
d) Dataset: “HH-1. Households by Type: 1940 to Present.” U.S. Census Bureau, Current Population Survey, November 2021. <www.census.gov>
e) Dataset: “Table 1.1.5. Gross Domestic Product [Billions of Dollars].” United States Department of Commerce, Bureau of Economic Analysis. Last revised May 29, 2022. <apps.bea.gov>
NOTE: An Excel file containing the data and calculations is available here.
[117] Calculated with data from:
a) Dataset: “Table 3.16. Government Current Expenditures by Function [Billions of Dollars].” U.S. Department of Commerce, Bureau of Economic Analysis. Last revised October 29, 2021. <apps.bea.gov>
b) Report: “Fiscal Year 2023 Historical Tables: Budget Of The U.S. Government.” White House Office of Management and Budget, March 2022. <www.whitehouse.gov>
“Table 3.1—Outlays by Superfunction and Function: 1940–2027.” <www.whitehouse.gov>
NOTE: An Excel file containing the data and calculations is available here.
[118] “WHO Director-General’s Opening Remarks at the Media Briefing on Covid-19.” World Health Organization, March 11, 2020. <bit.ly>
[Dr. Tedros Adhanom Ghebreyesus:] …
WHO [World Health Organization] has been assessing this outbreak around the clock and we are deeply concerned both by the alarming levels of spread and severity, and by the alarming levels of inaction.
We have therefore made the assessment that COVID-19 can be characterized as a pandemic.
[119] Press release: “COVID-19 and Other Global Health Issues.” World Health Organization, May 5, 2023. <www.justfacts.com>
[Dr. Tedros Adhanom Ghebreyesus:] …
Yesterday, the Emergency Committee met for the 15th time and recommended to me that I declare an end to the public health emergency of international concern. I have accepted that advice. It’s therefore with great hope that I declare COVID-19 over as a global health emergency.
[120] Webpage: “The Executive Branch.” White House. Accessed June 13, 2022 at <www.whitehouse.gov>
The mission of the Department of Defense (DOD) is to provide the military forces needed to deter war and to protect the security of our country. The department’s headquarters is at the Pentagon.
The DOD consists of the Departments of the Army, Navy, and Air Force, as well as many agencies, offices, and commands, including the Joint Chiefs of Staff, the Pentagon Force Protection Agency, the National Security Agency, and the Defense Intelligence Agency. The DOD occupies the vast majority of the Pentagon building in Arlington, Virginia.
The DOD is the largest government agency, with more than 1.4 million men and women on active duty, more than 700,000 civilian personnel, and 1.1 million citizens who serve in the National Guard and Reserve forces. Together, the military and civilian arms of DOD protect national interests through war-fighting, providing humanitarian aid, and performing peacekeeping and disaster relief services.
[121] Some government agencies include veterans’ benefits in their measures of social spending, but Just Facts counts these as spending for national defense because they are earned for serving in the Armed Forces.
[122] Calculated with data from:
a) Dataset: “Table 3.16. Government Current Expenditures by Function [Billions of Dollars].” U.S. Department of Commerce, Bureau of Economic Analysis. Last revised October 29, 2021. <apps.bea.gov>
b) Report: “Fiscal Year 2023 Historical Tables: Budget Of The U.S. Government.” White House Office of Management and Budget, March 2022. <www.whitehouse.gov>
“Table 3.1—Outlays by Superfunction and Function: 1940–2027.” <www.whitehouse.gov>
NOTE: An Excel file containing the data and calculations is available here.
[123] Calculated with data from:
a) Dataset: “Table 3.16. Government Current Expenditures by Function [Billions of Dollars].” U.S. Department of Commerce, Bureau of Economic Analysis. Last revised October 29, 2021. <apps.bea.gov>
b) Report: “Fiscal Year 2023 Historical Tables: Budget Of The U.S. Government.” White House Office of Management and Budget, March 2022. <www.whitehouse.gov>
“Table 3.1—Outlays by Superfunction and Function: 1940–2027.” <www.whitehouse.gov>
c) Dataset: “Monthly Population Estimates for the United States: April 1, 2010 to December 1, 2022.” U.S. Census Bureau, Population Division, December 2021. <www2.census.gov>
d) Dataset: “HH-1. Households by Type: 1940 to Present.” U.S. Census Bureau, Current Population Survey, November 2021. <www.census.gov>
e) Dataset: “Table 1.1.5. Gross Domestic Product [Billions of Dollars].” United States Department of Commerce, Bureau of Economic Analysis. Last revised May 29, 2022. <apps.bea.gov>
NOTE: An Excel file containing the data and calculations is available here.
[124] Calculated with data from:
a) Dataset: “Table 3.16. Government Current Expenditures by Function [Billions of Dollars].” U.S. Department of Commerce, Bureau of Economic Analysis. Last revised October 29, 2021. <apps.bea.gov>
b) Report: “Fiscal Year 2023 Historical Tables: Budget Of The U.S. Government.” White House Office of Management and Budget, March 2022. <www.whitehouse.gov>
“Table 3.1—Outlays by Superfunction and Function: 1940–2027.” <www.whitehouse.gov>
NOTE: An Excel file containing the data and calculations is available here.
[125] Calculated with data from:
a) Dataset: “Table 3.16. Government Current Expenditures by Function [Billions of Dollars].” U.S. Department of Commerce, Bureau of Economic Analysis. Last revised October 29, 2021. <apps.bea.gov>
b) Report: “Fiscal Year 2023 Historical Tables: Budget Of The U.S. Government.” White House Office of Management and Budget, March 2022. <www.whitehouse.gov>
“Table 3.1—Outlays by Superfunction and Function: 1940–2027.” <www.whitehouse.gov>
NOTE: An Excel file containing the data and calculations is available here.
[126] “WHO Director-General’s Opening Remarks at the Media Briefing on Covid-19.” World Health Organization, March 11, 2020. <bit.ly>
[Dr. Tedros Adhanom Ghebreyesus:] …
WHO [World Health Organization] has been assessing this outbreak around the clock and we are deeply concerned both by the alarming levels of spread and severity, and by the alarming levels of inaction.
We have therefore made the assessment that COVID-19 can be characterized as a pandemic.
[127] Press release: “COVID-19 and Other Global Health Issues.” World Health Organization, May 5, 2023. <www.justfacts.com>
[Dr. Tedros Adhanom Ghebreyesus:] …
Yesterday, the Emergency Committee met for the 15th time and recommended to me that I declare an end to the public health emergency of international concern. I have accepted that advice. It’s therefore with great hope that I declare COVID-19 over as a global health emergency.
[128] Dataset: “Table 3.16. Government Current Expenditures by Function [Billions of Dollars].” U.S. Department of Commerce, Bureau of Economic Analysis. Last revised October 29, 2021. <apps.bea.gov>
Public order and safety
Police
Fire
Law courts
Prisons
[129] Email from Just Facts to the U.S. Bureau of Economic Analysis, April 10, 2014.
“In NIPA Table 3.16 (Government Current Expenditures by Function), is spending on federal immigration enforcement included in line 49 (Public order and safety)? If not, under which category does it fall?”
Email from the U.S. Bureau of Economic Analysis to Just Facts, April 11, 2014.
“Spending on federal immigration enforcement is indeed included in Public order and safety in table 3.16.”
[130] Dataset: “Table 3.16. Government Current Expenditures by Function [Billions of Dollars].” U.S. Department of Commerce, Bureau of Economic Analysis. Last revised October 29, 2021. <apps.bea.gov>
“Government … Public order and safety … 2020 [=] 409.5”
[131] Calculated with data from:
a) Dataset: “Table 3.16. Government Current Expenditures by Function [Billions of Dollars].” U.S. Department of Commerce, Bureau of Economic Analysis. Last revised October 29, 2021. <apps.bea.gov>
b) Report: “Fiscal Year 2023 Historical Tables: Budget Of The U.S. Government.” White House Office of Management and Budget, March 2022. <www.whitehouse.gov>
“Table 3.1—Outlays by Superfunction and Function: 1940–2027.” <www.whitehouse.gov>
c) Dataset: “Monthly Population Estimates for the United States: April 1, 2010 to December 1, 2022.” U.S. Census Bureau, Population Division, December 2021. <www2.census.gov>
d) Dataset: “HH-1. Households by Type: 1940 to Present.” U.S. Census Bureau, Current Population Survey, November 2021. <www.census.gov>
e) Dataset: “Table 1.1.5. Gross Domestic Product [Billions of Dollars].” United States Department of Commerce, Bureau of Economic Analysis. Last revised May 29, 2022. <apps.bea.gov>
NOTE: An Excel file containing the data and calculations is available here.
[132] Calculated with data from:
a) Dataset: “Table 3.16. Government Current Expenditures by Function [Billions of Dollars].” U.S. Department of Commerce, Bureau of Economic Analysis. Last revised October 29, 2021. <apps.bea.gov>
b) Report: “Fiscal Year 2023 Historical Tables: Budget Of The U.S. Government.” White House Office of Management and Budget, March 2022. <www.whitehouse.gov>
“Table 3.1—Outlays by Superfunction and Function: 1940–2027.” <www.whitehouse.gov>
NOTE: An Excel file containing the data and calculations is available here.
[133] Calculated with data from:
a) Dataset: “Table 3.16. Government Current Expenditures by Function [Billions of Dollars].” U.S. Department of Commerce, Bureau of Economic Analysis. Last revised October 29, 2021. <apps.bea.gov>
b) Report: “Fiscal Year 2023 Historical Tables: Budget Of The U.S. Government.” White House Office of Management and Budget, March 2022. <www.whitehouse.gov>
“Table 3.1—Outlays by Superfunction and Function: 1940–2027.” <www.whitehouse.gov>
NOTE: An Excel file containing the data and calculations is available here.
[134] “WHO Director-General’s Opening Remarks at the Media Briefing on Covid-19.” World Health Organization, March 11, 2020. <bit.ly>
[Dr. Tedros Adhanom Ghebreyesus:] …
WHO [World Health Organization] has been assessing this outbreak around the clock and we are deeply concerned both by the alarming levels of spread and severity, and by the alarming levels of inaction.
We have therefore made the assessment that COVID-19 can be characterized as a pandemic.
[135] Press release: “COVID-19 and Other Global Health Issues.” World Health Organization, May 5, 2023. <www.justfacts.com>
[Dr. Tedros Adhanom Ghebreyesus:] …
Yesterday, the Emergency Committee met for the 15th time and recommended to me that I declare an end to the public health emergency of international concern. I have accepted that advice. It’s therefore with great hope that I declare COVID-19 over as a global health emergency.
[136] Dataset: “Table 3.16. Government Current Expenditures by Function [Billions of Dollars].” U.S. Department of Commerce, Bureau of Economic Analysis. Last revised October 29, 2021. <apps.bea.gov>
“Federal … Public order and safety … 2020 [=] 60.8”
[137] Calculated with data from:
a) Dataset: “Table 3.16. Government Current Expenditures by Function [Billions of Dollars].” U.S. Department of Commerce, Bureau of Economic Analysis. Last revised October 29, 2021. <apps.bea.gov>
b) Report: “Fiscal Year 2023 Historical Tables: Budget Of The U.S. Government.” White House Office of Management and Budget, March 2022. <www.whitehouse.gov>
“Table 3.1—Outlays by Superfunction and Function: 1940–2027.” <www.whitehouse.gov>
c) Dataset: “Monthly Population Estimates for the United States: April 1, 2010 to December 1, 2022.” U.S. Census Bureau, Population Division, December 2021. <www2.census.gov>
d) Dataset: “HH-1. Households by Type: 1940 to Present.” U.S. Census Bureau, Current Population Survey, November 2021. <www.census.gov>
e) Dataset: “Table 1.1.5. Gross Domestic Product [Billions of Dollars].” United States Department of Commerce, Bureau of Economic Analysis. Last revised May 29, 2022. <apps.bea.gov>
NOTE: An Excel file containing the data and calculations is available here.
[138] Calculated with data from:
a) Dataset: “Table 3.16. Government Current Expenditures by Function [Billions of Dollars].” U.S. Department of Commerce, Bureau of Economic Analysis. Last revised October 29, 2021. <apps.bea.gov>
b) Report: “Fiscal Year 2023 Historical Tables: Budget Of The U.S. Government.” White House Office of Management and Budget, March 2022. <www.whitehouse.gov>
“Table 3.1—Outlays by Superfunction and Function: 1940–2027.” <www.whitehouse.gov>
NOTE: An Excel file containing the data and calculations is available here.
[139] Calculated with data from:
a) Dataset: “Table 3.16. Government Current Expenditures by Function [Billions of Dollars].” U.S. Department of Commerce, Bureau of Economic Analysis. Last revised October 29, 2021. <apps.bea.gov>
b) Report: “Fiscal Year 2023 Historical Tables: Budget Of The U.S. Government.” White House Office of Management and Budget, March 2022. <www.whitehouse.gov>
“Table 3.1—Outlays by Superfunction and Function: 1940–2027.” <www.whitehouse.gov>
NOTE: An Excel file containing the data and calculations is available here.
[140] “WHO Director-General’s Opening Remarks at the Media Briefing on Covid-19.” World Health Organization, March 11, 2020. <bit.ly>
[Dr. Tedros Adhanom Ghebreyesus:] …
WHO [World Health Organization] has been assessing this outbreak around the clock and we are deeply concerned both by the alarming levels of spread and severity, and by the alarming levels of inaction.
We have therefore made the assessment that COVID-19 can be characterized as a pandemic.
[141] Press release: “COVID-19 and Other Global Health Issues.” World Health Organization, May 5, 2023. <www.justfacts.com>
[Dr. Tedros Adhanom Ghebreyesus:] …
Yesterday, the Emergency Committee met for the 15th time and recommended to me that I declare an end to the public health emergency of international concern. I have accepted that advice. It’s therefore with great hope that I declare COVID-19 over as a global health emergency.
[142] Calculated with data from:
a) Dataset: “Table 3.16. Government Current Expenditures by Function [Billions of Dollars].” U.S. Department of Commerce, Bureau of Economic Analysis. Last revised October 29, 2021. <apps.bea.gov>
b) Report: “Fiscal Year 2023 Historical Tables: Budget Of The U.S. Government.” White House Office of Management and Budget, March 2022. <www.whitehouse.gov>
“Table 3.1—Outlays by Superfunction and Function: 1940–2027.” <www.whitehouse.gov>
NOTE: An Excel file containing the data and calculations is available here.
[143] Calculated with data from:
a) Dataset: “Table 3.16. Government Current Expenditures by Function [Billions of Dollars].” U.S. Department of Commerce, Bureau of Economic Analysis. Last revised October 29, 2021. <apps.bea.gov>
b) Report: “Fiscal Year 2023 Historical Tables: Budget Of The U.S. Government.” White House Office of Management and Budget, March 2022. <www.whitehouse.gov>
“Table 3.1—Outlays by Superfunction and Function: 1940–2027.” <www.whitehouse.gov>
c) Dataset: “Monthly Population Estimates for the United States: April 1, 2010 to December 1, 2022.” U.S. Census Bureau, Population Division, December 2021. <www2.census.gov>
d) Dataset: “HH-1. Households by Type: 1940 to Present.” U.S. Census Bureau, Current Population Survey, November 2021. <www.census.gov>
e) Dataset: “Table 1.1.5. Gross Domestic Product [Billions of Dollars].” United States Department of Commerce, Bureau of Economic Analysis. Last revised May 29, 2022. <apps.bea.gov>
NOTE: An Excel file containing the data and calculations is available here.
[144] Calculated with data from:
a) Dataset: “Table 3.16. Government Current Expenditures by Function [Billions of Dollars].” U.S. Department of Commerce, Bureau of Economic Analysis. Last revised October 29, 2021. <apps.bea.gov>
b) Report: “Fiscal Year 2023 Historical Tables: Budget Of The U.S. Government.” White House Office of Management and Budget, March 2022. <www.whitehouse.gov>
“Table 3.1—Outlays by Superfunction and Function: 1940–2027.” <www.whitehouse.gov>
NOTE: An Excel file containing the data and calculations is available here.
[145] “WHO Director-General’s Opening Remarks at the Media Briefing on Covid-19.” World Health Organization, March 11, 2020. <bit.ly>
[Dr. Tedros Adhanom Ghebreyesus:] …
WHO [World Health Organization] has been assessing this outbreak around the clock and we are deeply concerned both by the alarming levels of spread and severity, and by the alarming levels of inaction.
We have therefore made the assessment that COVID-19 can be characterized as a pandemic.
[146] Press release: “COVID-19 and Other Global Health Issues.” World Health Organization, May 5, 2023. <www.justfacts.com>
[Dr. Tedros Adhanom Ghebreyesus:] …
Yesterday, the Emergency Committee met for the 15th time and recommended to me that I declare an end to the public health emergency of international concern. I have accepted that advice. It’s therefore with great hope that I declare COVID-19 over as a global health emergency.
[147] Dataset: “Table 3.16. Government Current Expenditures by Function [Billions of Dollars].” U.S. Department of Commerce, Bureau of Economic Analysis. Last revised October 29, 2021. <apps.bea.gov>
Economic affairs
Transportation
Highways
Air
Water
Transit and railroad
Space
Other economic affairs
General economic and labor affairs
Agriculture
Energy
Natural resources
Postal service
Other4
4 Consists of state and local government publicly owned liquor store systems, government-administered lotteries and parimutuels, and other commercial activities.
[148] E-mail from the Bureau of Economic Analysis to Just Facts, November 15, 2021.
[149] For facts about different measures of social spending, see Just Facts’ comprehensive research on this issue.
[150] Calculated with data from:
a) Dataset: “Table 3.16. Government Current Expenditures by Function [Billions of Dollars].” U.S. Department of Commerce, Bureau of Economic Analysis. Last revised October 29, 2021. <apps.bea.gov>
b) Report: “Fiscal Year 2023 Historical Tables: Budget Of The U.S. Government.” White House Office of Management and Budget, March 2022. <www.whitehouse.gov>
“Table 3.1—Outlays by Superfunction and Function: 1940–2027.” <www.whitehouse.gov>
NOTE: An Excel file containing the data and calculations is available here.
[151] Calculated with data from:
a) Dataset: “Table 3.16. Government Current Expenditures by Function [Billions of Dollars].” U.S. Department of Commerce, Bureau of Economic Analysis. Last revised October 29, 2021. <apps.bea.gov>
b) Report: “Fiscal Year 2023 Historical Tables: Budget Of The U.S. Government.” White House Office of Management and Budget, March 2022. <www.whitehouse.gov>
“Table 3.1—Outlays by Superfunction and Function: 1940–2027.” <www.whitehouse.gov>
c) Dataset: “Monthly Population Estimates for the United States: April 1, 2010 to December 1, 2022.” U.S. Census Bureau, Population Division, December 2021. <www2.census.gov>
d) Dataset: “HH-1. Households by Type: 1940 to Present.” U.S. Census Bureau, Current Population Survey, November 2021. <www.census.gov>
e) Dataset: “Table 1.1.5. Gross Domestic Product [Billions of Dollars].” United States Department of Commerce, Bureau of Economic Analysis. Last revised May 29, 2022. <apps.bea.gov>
NOTE: An Excel file containing the data and calculations is available here.
[152] Calculated with data from:
a) Dataset: “Table 3.16. Government Current Expenditures by Function [Billions of Dollars].” U.S. Department of Commerce, Bureau of Economic Analysis. Last revised October 29, 2021. <apps.bea.gov>
b) Report: “Fiscal Year 2023 Historical Tables: Budget Of The U.S. Government.” White House Office of Management and Budget, March 2022. <www.whitehouse.gov>
“Table 3.1—Outlays by Superfunction and Function: 1940–2027.” <www.whitehouse.gov>
NOTE: An Excel file containing the data and calculations is available here.
[153] Calculated with data from:
a) Dataset: “Table 3.16. Government Current Expenditures by Function [Billions of Dollars].” U.S. Department of Commerce, Bureau of Economic Analysis. Last revised October 29, 2021. <apps.bea.gov>
b) Report: “Fiscal Year 2023 Historical Tables: Budget Of The U.S. Government.” White House Office of Management and Budget, March 2022. <www.whitehouse.gov>
“Table 3.1—Outlays by Superfunction and Function: 1940–2027.” <www.whitehouse.gov>
NOTE: An Excel file containing the data and calculations is available here.
[154] “WHO Director-General’s Opening Remarks at the Media Briefing on Covid-19.” World Health Organization, March 11, 2020. <bit.ly>
[Dr. Tedros Adhanom Ghebreyesus:] …
WHO [World Health Organization] has been assessing this outbreak around the clock and we are deeply concerned both by the alarming levels of spread and severity, and by the alarming levels of inaction.
We have therefore made the assessment that COVID-19 can be characterized as a pandemic.
[155] Press release: “COVID-19 and Other Global Health Issues.” World Health Organization, May 5, 2023. <www.justfacts.com>
[Dr. Tedros Adhanom Ghebreyesus:] …
Yesterday, the Emergency Committee met for the 15th time and recommended to me that I declare an end to the public health emergency of international concern. I have accepted that advice. It’s therefore with great hope that I declare COVID-19 over as a global health emergency.
[156] Calculated with data from:
a) Dataset: “Table 3.16. Government Current Expenditures by Function [Billions of Dollars].” U.S. Department of Commerce, Bureau of Economic Analysis. Last revised October 29, 2021. <apps.bea.gov>
b) Report: “Fiscal Year 2023 Historical Tables: Budget Of The U.S. Government.” White House Office of Management and Budget, March 2022. <www.whitehouse.gov>
“Table 3.1—Outlays by Superfunction and Function: 1940–2027.” <www.whitehouse.gov>
NOTE: An Excel file containing the data and calculations is available here.
[157] Calculated with data from:
a) Dataset: “Table 3.16. Government Current Expenditures by Function [Billions of Dollars].” U.S. Department of Commerce, Bureau of Economic Analysis. Last revised October 29, 2021. <apps.bea.gov>
b) Report: “Fiscal Year 2023 Historical Tables: Budget Of The U.S. Government.” White House Office of Management and Budget, March 2022. <www.whitehouse.gov>
“Table 3.1—Outlays by Superfunction and Function: 1940–2027.” <www.whitehouse.gov>
c) Dataset: “Monthly Population Estimates for the United States: April 1, 2010 to December 1, 2022.” U.S. Census Bureau, Population Division, December 2021. <www2.census.gov>
d) Dataset: “HH-1. Households by Type: 1940 to Present.” U.S. Census Bureau, Current Population Survey, November 2021. <www.census.gov>
e) Dataset: “Table 1.1.5. Gross Domestic Product [Billions of Dollars].” United States Department of Commerce, Bureau of Economic Analysis. Last revised May 29, 2022. <apps.bea.gov>
NOTE: An Excel file containing the data and calculations is available here.
[158] Calculated with data from:
a) Dataset: “Table 3.16. Government Current Expenditures by Function [Billions of Dollars].” U.S. Department of Commerce, Bureau of Economic Analysis. Last revised October 29, 2021. <apps.bea.gov>
b) Report: “Fiscal Year 2023 Historical Tables: Budget Of The U.S. Government.” White House Office of Management and Budget, March 2022. <www.whitehouse.gov>
“Table 3.1—Outlays by Superfunction and Function: 1940–2027.” <www.whitehouse.gov>
NOTE: An Excel file containing the data and calculations is available here.
[159] Calculated with data from:
a) Dataset: “Table 3.16. Government Current Expenditures by Function [Billions of Dollars].” U.S. Department of Commerce, Bureau of Economic Analysis. Last revised October 29, 2021. <apps.bea.gov>
b) Report: “Fiscal Year 2023 Historical Tables: Budget Of The U.S. Government.” White House Office of Management and Budget, March 2022. <www.whitehouse.gov>
“Table 3.1—Outlays by Superfunction and Function: 1940–2027.” <www.whitehouse.gov>
NOTE: An Excel file containing the data and calculations is available here.
[160] “WHO Director-General’s Opening Remarks at the Media Briefing on Covid-19.” World Health Organization, March 11, 2020. <bit.ly>
[Dr. Tedros Adhanom Ghebreyesus:] …
WHO [World Health Organization] has been assessing this outbreak around the clock and we are deeply concerned both by the alarming levels of spread and severity, and by the alarming levels of inaction.
We have therefore made the assessment that COVID-19 can be characterized as a pandemic.
[161] Press release: “COVID-19 and Other Global Health Issues.” World Health Organization, May 5, 2023. <www.justfacts.com>
[Dr. Tedros Adhanom Ghebreyesus:] …
Yesterday, the Emergency Committee met for the 15th time and recommended to me that I declare an end to the public health emergency of international concern. I have accepted that advice. It’s therefore with great hope that I declare COVID-19 over as a global health emergency.
[162] Calculated with data from:
a) Dataset: “Table 3.16. Government Current Expenditures by Function [Billions of Dollars].” U.S. Department of Commerce, Bureau of Economic Analysis. Last revised October 29, 2021. <apps.bea.gov>
b) Report: “Fiscal Year 2023 Historical Tables: Budget Of The U.S. Government.” White House Office of Management and Budget, March 2022. <www.whitehouse.gov>
“Table 3.1—Outlays by Superfunction and Function: 1940–2027.” <www.whitehouse.gov>
NOTE: An Excel file containing the data and calculations is available here.
[163] Calculated with data from:
a) Dataset: “Table 3.16. Government Current Expenditures by Function [Billions of Dollars].” U.S. Department of Commerce, Bureau of Economic Analysis. Last revised October 29, 2021. <apps.bea.gov>
b) Report: “Fiscal Year 2023 Historical Tables: Budget Of The U.S. Government.” White House Office of Management and Budget, March 2022. <www.whitehouse.gov>
“Table 3.1—Outlays by Superfunction and Function: 1940–2027.” <www.whitehouse.gov>
c) Dataset: “Monthly Population Estimates for the United States: April 1, 2010 to December 1, 2022.” U.S. Census Bureau, Population Division, December 2021. <www2.census.gov>
d) Dataset: “HH-1. Households by Type: 1940 to Present.” U.S. Census Bureau, Current Population Survey, November 2021. <www.census.gov>
e) Dataset: “Table 1.1.5. Gross Domestic Product [Billions of Dollars].” United States Department of Commerce, Bureau of Economic Analysis. Last revised May 29, 2022. <apps.bea.gov>
NOTE: An Excel file containing the data and calculations is available here.
[164] Calculated with data from:
a) Dataset: “Table 3.16. Government Current Expenditures by Function [Billions of Dollars].” U.S. Department of Commerce, Bureau of Economic Analysis. Last revised October 29, 2021. <apps.bea.gov>
b) Report: “Fiscal Year 2023 Historical Tables: Budget Of The U.S. Government.” White House Office of Management and Budget, March 2022. <www.whitehouse.gov>
“Table 3.1—Outlays by Superfunction and Function: 1940–2027.” <www.whitehouse.gov>
NOTE: An Excel file containing the data and calculations is available here.
[165] “WHO Director-General’s Opening Remarks at the Media Briefing on Covid-19.” World Health Organization, March 11, 2020. <bit.ly>
[Dr. Tedros Adhanom Ghebreyesus:] …
WHO [World Health Organization] has been assessing this outbreak around the clock and we are deeply concerned both by the alarming levels of spread and severity, and by the alarming levels of inaction.
We have therefore made the assessment that COVID-19 can be characterized as a pandemic.
[166] Press release: “COVID-19 and Other Global Health Issues.” World Health Organization, May 5, 2023. <www.justfacts.com>
[Dr. Tedros Adhanom Ghebreyesus:] …
Yesterday, the Emergency Committee met for the 15th time and recommended to me that I declare an end to the public health emergency of international concern. I have accepted that advice. It’s therefore with great hope that I declare COVID-19 over as a global health emergency.